An insight into the pyrolysis process of metal–organic framework templates/precursors to construct metal oxide anode materials for lithium-ion batteries†
Ang
Li
abc,
Binbin
Qian
ab,
Ming
Zhong
ab,
Yingying
Liu
ab,
Ze
Chang
 *ab and
Xian-He
Bu
 *abc
*abc
aSchool of Materials Science and Engineering, National Institute for Advanced Materials, Tianjin Key Laboratory of Metal and Molecule-Based Material Chemistry, Nankai University, Tianjin 300350, China. E-mail: changze@nankai.edu.cn; buxh@nankai.edu.cn
bCollaborative Innovation Center of Chemical Science and Engineering (Tianjin), Tianjin 300072, China
cKey Laboratory of Advanced Energy Materials Chemistry (MOE), College of Chemistry, Nankai University, Tianjin 300071, China
First published on 30th April 2019
Abstract
Metal–organic frameworks (MOFs) have been utilized as templates/precursors for the synthesis of metal oxide anode materials of lithium-ion batteries, due to their large accessible surface, tunable pore size, and various metal centers. However, the same phase of materials derived from different MOFs could show diverse capacities and performances. In this study, aiming at an in-depth understanding of the structural relationship between the precursors and the product, we chose two MOFs with the same linker as templates/precursors for Co3O4 nanomaterials. The structure and component evolution in the pyrolysis process were analyzed, and the electrochemical properties of the resulting Co3O4 were studied. The results showed that the concentration of metal centers and the strength of coordination bonds in the MOFs were critical factors that determined the morphology and performances of the resulting material.
Introduction
Lithium-ion batteries (LIBs) are one of the most extensively applied energy storage systems due to their high capacity and long life.1–4 Therein, electrode materials play a crucial role in the electrochemical performance. Although commercial graphite anodes have been widely accepted, they are still limited by their low capacity of approximately 370 mA h g−1.5 To obtain greater capacity, numerous efforts have been devoted to the exploration of advanced anode materials to achieve superior lithium storage properties.6 Among the various promising anode materials, transition metal oxides (TMO), especially Co3O4, are attractive by virtue of their high theoretical reversible capacity.7–12 Nevertheless, this type of material has limitations because of the large volume change during the insertion/extraction of Li+, which easily leads to unstable cycle life and poor rate performance.13In order to solve this problem, one of the most effective methods is nanonization. Nanosized particles could provide more optimal performance based on their relatively large surface area and abundant pores, which could facilitate the diffusion of Li+ and buffer the volume changes of the materials during the charge–discharge processes.14 However, in the electrochemical processes, particle aggregation could easily occur at nanoscale dimensions, causing large interparticle resistance.15 To arrive at a solution, the optimization of nanoscale building blocks into a microscale framework is necessary, aiming at the fabrication of long-range electron transport networks.16,17
Template-assisted methods have been widely employed in achieving target electrode materials. Compared with other precursors/templates, metal–organic frameworks (MOFs) is one of the most attractive ones.18 They are characterized by highly ordered structures as well as hybrid components based on metallic nodes and organic linkers in the frameworks.19,20 On the basis of these characteristics, TMO materials showing highly tunable micro/nanoscale morphology and outstanding properties could be obtained through appropriate transformation methods.16 For example, Tian and co-workers reported that hollow tetrahedral Co3O4 consisting of nanoparticles as high-performance anode materials exhibited reversible capacities of 1196 and 1052 mA h g−1 at 50 mA g−1 and 200 mA g−1, respectively, after 60 charge/discharge cycles.21 Li et al. designed a 3D flower-like Co3O4/NC composed of nanosheets, which exhibited improved electrochemical properties.22 It should be noted that although MOF-derived materials have been extensively studied, most of the research focus has been on amazing morphology or electrochemical performances.23–25 Only a small number of investigations have focused on the relationship between the MOF precursors/templates and their derivatives,25,26 which could be applied as principles for targeted screening of MOFs toward advanced anode materials. Insights regarding the transformation process of MOFs into TMO anode materials are also less reported, but this should be helpful for the optimization of treatment conditions toward materials with better performances.
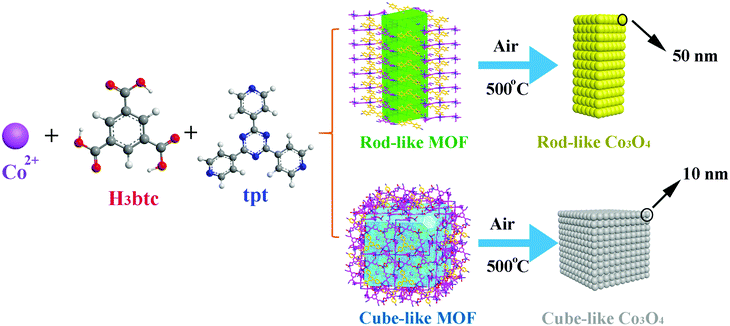
On the basis of our ongoing research on TMO anodes, much effort has been made to elucidate the structure–activity relationship between the MOF precursors/templates and the corresponding TMO materials. Herein, we report detailed research of the pyrolysis transformation process of two Co(II)-based MOFs, namely, [Co6(btc)4(tpt)2(H2O)12]·solvent (rod-like MOF) and [Co9(btc)6(tpt)2(H2O)15]·solvent (cube-like MOF) (H3btc = 1,3,5-benzenetricarboxylic acid, tpt = 2,4,6-tris(4-pyridyl)-1,3,5-triazine), into the corresponding nanosized Co3O4 materials for anode applications (Scheme 1). Due to the distinct structures of the MOFs based on similar components, both the microscale structures of the MOF and that of the corresponding Co3O4 materials were investigated, aiming at an in-depth understanding of the structural relationship between the precursors and the products. Furthermore, the performance of the Co3O4 as anode material was investigated, to further assist with the understanding of the structure-activity relationship of the materials.
The results suggest that the size of the corresponding TMO nanoparticles is highly dependent on the concentration of metal centers in the MOF, while the anisotropic structure of the MOF and the strength of the coordination bonds could affect the morphology of the product. From the perspective of electronic performance, the material featuring small particle size possesses better capacity, recyclability, and rate performance. In addition to the instructive principles for the screening of MOF precursors mentioned above, the cube-like Co3O4 we report herein, with a capacity of 936.2 mA h g−1 after 500 cycles at a current density of 100 mA g−1, also exhibits remarkable performance as an anode material.
Experimental
Chemicals
Tpt was synthesized according to reported methods.27 All other reagents and solvents, including cobaltous nitrate hexahydrate (Co(NO3)2·6H2O, Aladdin), H3btc (AR, TCI), N,N-dimethylformamide (DMF, J&K Scientific) and ethanol (C2H5OH, J&K Scientific), were commercially obtained and used without further purification.Preparation of MOF precursors
The rod-like MOF was prepared under solvothermal conditions. In a typical process, Co(NO3)2·6H2O (58.2 mg, 0.2 mmol), H3btc (42 mg, 0.2 mmol), and tpt (62 mg, 0.2 mmol) were dispersed in a vial containing a mixed solvent of DMF (4 ml), ethanol (4 ml), and water (4 ml). After that, the vial was heated at 100 °C for 24 h. Rod-shaped crystals were obtained and collected by filtration, washed with DMF and ethanol, and then dried in air. The cube-like MOF was prepared according to our previous report.28 In a typical process, Co(NO3)2·6H2O (58.2 mg, 0.2 mmol), H3btc (21.0 mg, 0.1 mmol), and tpt (15.5 mg, 0.05 mmol) were dispersed in a mixed solvent of DMF (4 ml), ethanol (4 ml), and water (4 ml) under stirring in a vial. After that, the vial was heated at 100 °C for 24 h. As the reaction progressed, red cube-shaped crystals formed. The crystals were collected by filtration, washed with DMF and ethanol, and then dried in air.Preparation of micro/nanoscale Co3O4 from MOFs
For the preparation of micro/nanoscale Co3O4 materials, the rod-like MOF and the cube-like MOF were calcined at 500 °C for 5 h in a tube furnace at a rate of 5 °C min−1. Because the morphology of the products was mainly retained, the products were named rod-like Co3O4 and cube-like Co3O4, respectively.Characterization
Room temperature powder X-ray diffraction (PXRD) patterns were recorded via a Rigaku MiniFlex 600 X-ray diffractometer at 40 kV and 15 mA with a Cu-target tube. Variable temperature PXRD patterns were recorded with the same diffractometer equipped with an Anton Paar BTS 500 benchtop heating stage. Scanning electron microscopy (SEM) (JEOL JSM-7500F), transmission electron microscopy (TEM), and high resolution transmission electron microscopy (HRTEM) (JEOL JEM-2800) were used to investigate the morphology of products. Thermogravimetric analysis (TGA) was carried out with a Rigaku TG-DTA 8121 analyzer at a rate of 10 °C min−1 from 25 to 800 °C.X-ray crystallography
Single-crystal X-ray diffraction data for the rod-like MOF were collected at the BL16B1 beamline at the Shanghai Synchrotron Radiation Facility (SSRF) at 113 K with Mo Kα radiation (λ = 0.71073 Å). The structure was solved by direct methods using the SHELXS program of the SHELXTL-2014 software package and refined on F2 by full-matrix least-squares using SHELXL. Metal atoms were located from the E maps, and other non-hydrogen atoms were located in successive difference Fourier synthesis and anisotropically refined. The hydrogen atoms were added theoretically. The disordered solvent molecules in the rod-like MOF were removed by the SQUEEZE function in PLATON.29 Detailed crystallographic data are summarized in Table S1 (ESI†), and selected bond lengths and angles are given in Tables S2 and S3 (ESI†). Full crystallographic data for the rod-like MOF have been deposited with the CCDC number of 1887353.†Electrochemical measurements
CR2025-type coin cells were assembled in an argon-filled glove box (O2 and H2O content <0.1 ppm) for electrochemical testing. The working electrode material consisting of 80 wt% Co3O4, 10 wt% Ketjen black (KB), and 10 wt% polyvinylidene difluoride (PVDF) was prepared under continuous stirring in N-methylpyrrolidone (NMP) solvent. The electrodes were prepared by casting the slurry onto copper foil as a current collector, and it was dried in a vacuum oven at 110 °C for 12 h. The loading of active material was at approximately 1 mg cm−2. Lithium foil was used as counter and reference electrodes, and a Celgard 2400 membrane was used as a separator. The electrolyte was a solution of 1 M LiPF6 dissolved in a mixture of ethylmethyl carbonate (EMC), ethylene carbonate (EC), and dimethyl carbonate (DMC), (v/v/v = 1![[thin space (1/6-em)]](https://www.rsc.org/images/entities/char_2009.gif) :
:![[thin space (1/6-em)]](https://www.rsc.org/images/entities/char_2009.gif) 1
1![[thin space (1/6-em)]](https://www.rsc.org/images/entities/char_2009.gif) :
:![[thin space (1/6-em)]](https://www.rsc.org/images/entities/char_2009.gif) 1). The cyclic voltammetry (CV) profile was collected on an electrochemical workstation (CHI 760c, Chenhua, Shanghai) at a scanning rate of 0.1 mV s−1 in the voltage range of 0.01–3.00 V (vs. Li/Li+) at room temperature. Discharge/charge profiles were galvanostatically recorded in the potential range of 0.01–3.00 V (vs. Li/Li+) with a LAND-CT2001A (Wuhan, China) battery tester. Electrochemical impendence spectra (EIS) with a perturbation voltage of 5 mV were measured with a Princeton VersaSTAT4 electrochemical workstation using the frequency range from 0.01 Hz to 100 kHz.
1). The cyclic voltammetry (CV) profile was collected on an electrochemical workstation (CHI 760c, Chenhua, Shanghai) at a scanning rate of 0.1 mV s−1 in the voltage range of 0.01–3.00 V (vs. Li/Li+) at room temperature. Discharge/charge profiles were galvanostatically recorded in the potential range of 0.01–3.00 V (vs. Li/Li+) with a LAND-CT2001A (Wuhan, China) battery tester. Electrochemical impendence spectra (EIS) with a perturbation voltage of 5 mV were measured with a Princeton VersaSTAT4 electrochemical workstation using the frequency range from 0.01 Hz to 100 kHz.
Results and discussion
Structures and morphologies of the rod-like MOF and the cube-like MOF
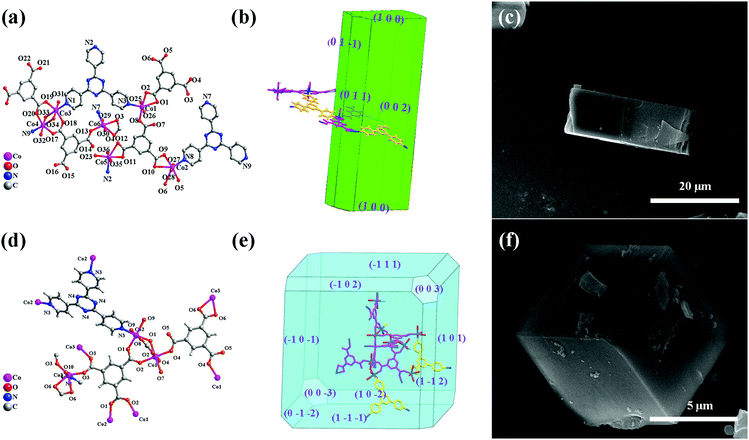
Aiming at the illustration of the relationship between the structure and morphology of the MOF precursors and the corresponding TMO materials, two MOFs based on the same metal ion and ligands but featuring different structures and morphologies were selected. The cube-like MOF has been previously reported,14 while the rod-like MOF is newly synthesized. For a better understanding and comparison of the two compounds, their structures and morphologies are briefly described below.X-ray crystallographic analysis reveals that the rod-like MOF crystallized in the monoclinic space group P21/c. Generally, Co(II) ions are coordinated with btc3− and tpt ligands (Fig. 1a) to give a three dimensional (3D) framework (Fig. S1, ESI†). Analysis with the PLATON program showed that the total solvent-accessible volume of the rod-like MOF is 5.6% of the crystal volume (464.4 Å3 out of the 8242.0 Å3 unit cell volumes) after squeezing solvent molecules in frameworks. The simulation of the crystal morphology of the rod-like MOF using the Bravais–Friedel–Donnay–Harker (BFDH) method showed a rod-shaped morphology (Fig. 1b),30 which was consistent with that of the obtained sample (Fig. 1c).
The cube-like MOF crystallized in the trigonal space group R![[3 with combining macron]](https://www.rsc.org/images/entities/char_0033_0304.gif) m. Distinct from that of the rod-like MOF, the coordination between the Co(II) ions and the ligands (Fig. 1d) resulted in a cage-based framework. The total solvent-accessible volume of the cube-like MOF is estimated to be 49%. The calculation of its morphology using the BFDH method resulted in a cubic-shaped morphology (Fig. 1e), which is also consistent with that of the obtained sample (Fig. 1b).
m. Distinct from that of the rod-like MOF, the coordination between the Co(II) ions and the ligands (Fig. 1d) resulted in a cage-based framework. The total solvent-accessible volume of the cube-like MOF is estimated to be 49%. The calculation of its morphology using the BFDH method resulted in a cubic-shaped morphology (Fig. 1e), which is also consistent with that of the obtained sample (Fig. 1b).
In general, the rod-like MOF and the cube-like MOF feature distinct framework structures and morphologies. It could be expected that the corresponding TMO materials with these MOFs as precursors may reveal distinct structures, morphologies, and performances as the anode for LIBs. Therefore, an insight into the MOF to TMO transformation process may help increase our understanding of the critical structural factors of the precursors that determine the morphology and performances of the product. It should be noted that the well-matched calculated and actual morphologies of the crystals could facilitate the morphology analysis of the products and comparison with that of the precursors from the perspective of the framework structure. This could lead to the illustration of the details of material decomposition/formation during the transformation process.
Transformation of MOF precursors to nanosized Co3O4
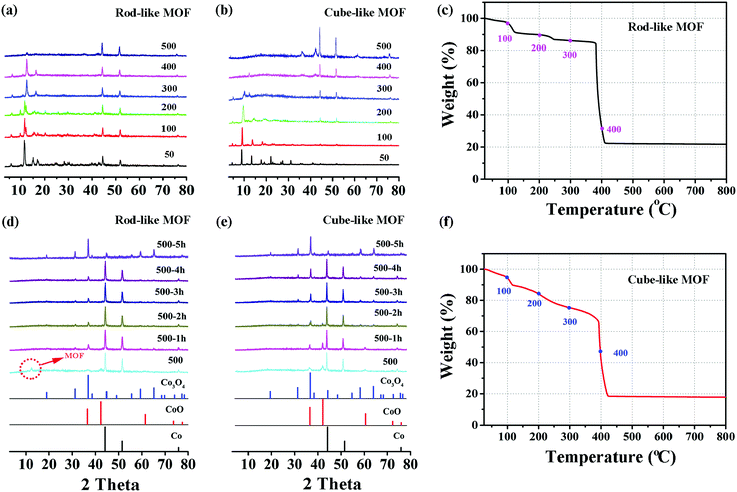
On the basis of the previous assumption, the rod-like MOF and the cube-like MOF are transformed into corresponding Co3O4 through a pyrolysis method. In brief, the complete transformation is achieved by heating the precursors in air for 5 hours. There was a satisfactory match between the PXRD patterns of the products and the standard pattern of Co3O4 (PDF#43-1003).To better understand the mechanism of the transformation, the structure and component evolution during the process were monitored by variable temperature PXRD, which was analyzed by combining with the TGA results (Fig. 2). The transformation process was mainly divided into two steps. The first is the decomposition of MOF, and the second is the formation of Co3O4.
For the first step, as shown in Fig. 2a and b, the diffraction peaks of the rod-like MOF are well retained until 400 °C, while for the cube-like MOF, the peak intensity is clearly reduced at 300 °C. The peaks originating from MOFs mainly vanished at 500 °C, indicating the total decomposition of the framework of the compound and the removal of the organic components, which is straightforwardly proved by the TGA profile of the compounds. In consideration of the crystalline nature of the compounds, the reduced peak intensity indicates the reduction of crystallinity along with the increased temperature, which should be attributed to the breaking of chemical bonds and distortion of the framework. In addition to the distinct variable temperature PXRD, the analysis of the TGA profiles could provide details regarding the decomposition process. For the rod-like MOF, the stepwise loss of weight before 350 °C should be attributed to the removal of coordinated solvents, followed by a sharp loss of weight based on decomposition at approximately 400 °C (Fig. 2c). For the cube-like MOF, continuous weight loss was observed with the increase of temperature (Fig. 2f), indicating its lower thermostability compared with that of the rod-like MOF. It is worth noting that although the cube-like MOF almost lost its crystallinity at 300 °C, the organic components were not fully removed, according to the TGA profile. This implies that the chemical bonds were partly broken in that temperature range, while the organic fragments resulting from the decomposition were mainly retained in the solid, which could prevent the agglomeration of metal centers during the procedure. In contrast, the rapid decomposition of the rod-like MOF accompanied by the removal of organic components may lead to severe agglomeration of metal centers.
The process of the second step for the rod-like MOF and the cube-like MOF is shown in Fig. 2d and e. After the first step of the transformation process, the component of the product for both rod-like MOF and cube-like MOF is mainly Co, with a small amount of CoO. During continuous heating at 500 °C, the Co and CoO gradually oxidized into Co3O4, and the transformation was complete within 5 hours. The almost identical second step transformation processes of the rod-like and cube-like MOFs indicate that this step shall not determine the characteristics of the final products.
The Co3O4 products from different MOFs was further characterized, with an emphasis on the morphology evolution. As shown in Fig. 1c and f, the SEM images show that the rod-like MOF and the cube-like MOF demonstrate uniform rod and cube morphology, respectively. After the pyrolyzation, both of the Co3O4 products inherit the morphology of the corresponding MOF (Fig. S2, ESI†). The surface of the products became rough because of the decomposition and removal of the organic ligand (Fig. 3a and d). It is worth noting that the rod-like Co3O4 from the rod-like MOF shows an obvious trend of exfoliation along the (100) plane direction of the crystal (Fig. 3a), compared with the isotropic shrinkage of the cube-like MOF. These distinct characteristics of the products should be due to the different symmetry of the MOF framework and the ordered breaking of different chemical bonds and interactions during the pyrolyzation. For the rod-like MOF, the (100) plane is defined by layer structures based on the coordination of Co(II) ions and ligands (Fig. 4). Compared with the covalent and coordination bonds in the layers, the hydrogen bonds between the layers, originating from the coordinated water molecules, are relatively weak. Therefore, the interactions perpendicular to the (100) plane are preferentially destroyed accompanied by the removal of coordinated water molecules at high temperature, to result in the exfoliation phenomenon and the cracks observed in the SEM image of rod-like Co3O4. For the cube-like MOF, the high symmetry of the 3D framework assures that there is no preferential destroyed bonding or interactions in the framework, which results in the symmetrical morphology of the product. These results suggest that the morphology of the pyrolyzation product is highly dependent on the framework structure of the MOF precursor in consideration of the strength of the interactions and bonds therein.
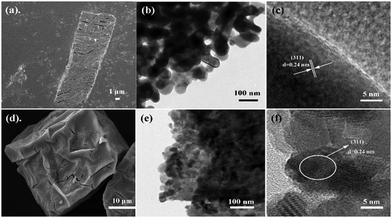 | ||
| Fig. 3 SEM images of (a) rod-like Co3O4 and (d) cube-like Co3O4, and TEM images of (b and c) rod-like Co3O4 and (e and f) cube-like Co3O4. | ||
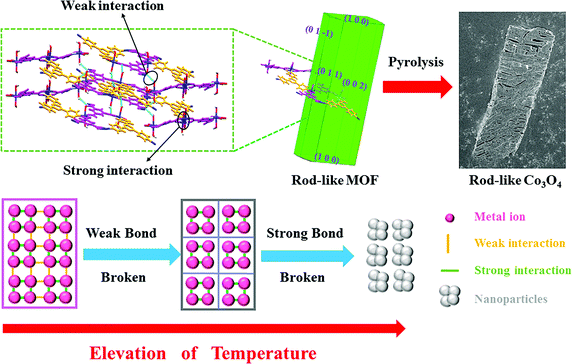 | ||
| Fig. 4 A schematic of the pyrolyzation process of MOFs into corresponding TMO nanoparticles to illustrate the role of interactions and the framework structure. | ||
Transmission electron microscopy (TEM) was employed to characterize the particle size of the products. The typical particle size of the rod-like Co3O4 is approximately 50 nm, while that of the cube-like one is less than 10 nm (Fig. 3b and e). In consideration of the structures of the MOF precursors and the transformation procedure discussed above, the distinct particle size of Co3O4 should be related to the volumetric concentration of the Co(II) in the MOF framework. According to the crystal structure of the rod-like MOF and the cube-like MOF, it can be calculated that there are 2.91 and 2.18 Co(II) ions, respectively, in one-unit volume (1 nm3) of their framework. Obviously, the higher concentration of Co(II) ions in the framework could promote the aggregation of metal centers during the pyrolyzation to give larger particles. In addition, the HRTEM images indicate a clear lattice spacing of 0.24 nm, which is in good agreement with the (311) plane of Co3O4 (PDF #43-1003) (Fig. 2f and 3c).
In general, most of the reports about MOFs in energy fields focus on the inorganic component because the metal centers are retained after pyrolyzation to transform into metal oxides, metallic phosphides, and metal nitrides for further application. Herein, on the basis of our research and discussion mentioned above, we show that the organic linkers of the MOF precursors is equally important. The organic linkers not only prevents the aggregation of nanoparticles during pyrolysis, but they also determine the volumetric concentration of metal centers and the corresponding particle size. Accordingly, it was concluded that a general transformation process of MOF-derived nanomaterials (Fig. 4) reveals the relationship between the MOF and the product. During the elevation of temperature, the weak bonds/interactions in the MOF framework will initially break, and then the strong interaction between atoms will be destroyed at higher temperatures to produce nanoparticles. On the basis of the well determined periodic crystal structure of MOFs, the interaction in the framework could be readily identified through detailed structure analysis. Furthermore, the strength of the interactions could be mainly distinguished through their type. Commonly, the strength of the interaction in MOFs follow the order of covalent bonding > coordination bonding > supramolecular interactions (hydrogen bonds, π–π interactions, etc.). Therefore, these principles could be utilized for the rational selection of MOF precursors with suitable structures, aiming at targeted nanonization and morphology control of TMO materials.
Investigations of electrochemical properties
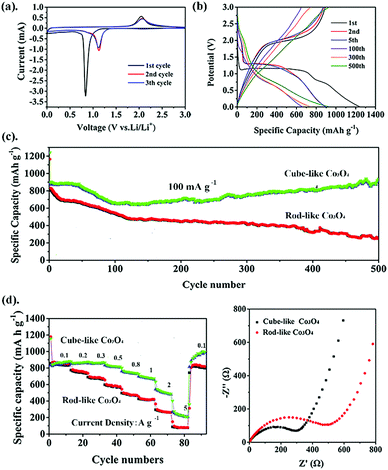
After the successful preparation of nanosized Co3O4 materials, their electrochemical properties were further investigated. Because both rod-like and cube-like samples were derived from the same component, cube-like Co3O4 from the cube-like MOF was selected to illustrate the research process in detail.In order to study the lithium-ion storage mechanism of the cube-like Co3O4 electrode for LIBs, CV curves were recorded at a scan rate of 0.1 mV s−1 (Fig. 5a). In the first cycle, the cathodic peaks located at 0.83 V are attributed to the reduction of Co3O4 to metallic cobalt and formation of solid–electrolyte-interphase (SEI) films, respectively. Additionally, the corresponding anodic peak appearing at 2.04 V is observed, which is related to the change of Co0 to Co3O4.31 From the second scanning, the cathodic and anodic peaks shift to 1.12 V and 2.06 V, respectively.9,32 Obviously, the well-overlapped CV curves after the first cycle predict good cycle stability for this material. Based on the CV results, the electrochemical conversions are as follows: Co3O4 + 8Li+ + 8e− ⇌ Co + Li2O.33,34 The charge–discharge profiles (1st, 2nd, 5th, 100th, 300th, and 500th) of cube-like Co3O4 are displayed in Fig. 5b at a current density of 100 mA g−1. In the first discharge process, a long voltage plateau at approximately 1.1 V is assigned to the reduction of Co3O4 to metallic cobalt, and the plateau at 0.7 V is ascribed to the generation of SEI films, which is consistent with typical features of Co3O4 in previous reports.35 The initial charge and discharge capacities are 1241.6 mA h g−1 and 891 mA h g−1, respectively, with a coulombic efficiency (CE) of 71.7%. The irreversible capacity loss should be due to the inevitable formation of SEI films and partial decomposition of the electrolyte.36 The performance of the rod-like Co3O4 was investigated in the same way, and the cycling performances of both materials at 100 mA g−1 are shown in Fig. 5c. The cube-like Co3O4 demonstrates excellent reversible capacity and cycling stability. The overall capacity decreases first and then increases; this may occur because when the SEI film forms and the electrolyte partially decomposes, the capacity first shows a decreasing trend in the second cycle, but from the hundredth cycle, the capacity starts to increase due to electrolyte degradation by the active metal nanoparticles (Co). This effect is especially marked under low current densities.37 As a result, the capacity of cube-like Co3O4 remains at 936.2 mA h g−1 after 500 cycles at a current density of 100 mA g−1, which is greater than the theoretical value of Co3O4 and surpasses those of most previously reported Co3O4 species (Table S4, ESI†). In contrast, the charge and discharge capacities of rod-like Co3O4 are 1164.8 mA h g−1 and 823.7 mA h g−1, showing a lower initial coulombic efficiency of approximately 70.7% as compared to cube-like Co3O4, and the capacity decreased to 251 mA h g−1 after 500 cycles. Furthermore, the distinctive capacity variation trend of the samples should be attributed to the dynamic equilibrium of the two factors that originated from the morphology of the samples. In the case of cube-like Co3O4, the activation process may play a major role due to its smaller particle size. In contrast, the performance of rod-like Co3O4 with larger particle size is affected mainly by volume expansion caused by structure destruction. This should be due to the larger particle size of rod-like Co3O4, leading to insufficient contact of electrode/electrolyte areas. However, rate performance is another key factor for advanced anode materials. Fig. 5d presents the corresponding rate capacities of cube-like Co3O4, which demonstrated 848 mA h g−1 at 100 mA g−1, 840 mA h g−1 at 200 mA g−1, 836 mA h g−1 at 300 mA g−1, 797 mA h g−1 at 0.5 A g−1, 725 mA h g−1 at 0.8 A g−1, 662 mA h g−1 at 1 A g−1, 486 mA h g−1 at 2 A g−1, and 201 mA h g−1 at 5 A g−1. It should be noted that the capacity is restored to 975 mA h g−1 after the current density recovers to 100 mA g−1, indicating excellent rate performance. In comparison with cube-like Co3O4, rod-like Co3O4 exhibited much lower reversible capacity and poorer rate performance (846 mA h g−1 at 100 mA g−1, 763 mA h g−1 at 200 mA g−1, 688 mA h g−1 at 300 mA g−1, 582 mA h g−1 at 0.5 A g−1, 479 mA h g−1 at 0.8 A g−1, 429 mA h g−1 at 1 A g−1, 273 mA h g−1 at 2 A g−1, and 80 mA h g−1 at 5 A g−1). The Brunauer–Emmett–Teller (BET) specific surface areas are calculated to be about 8 m2 g−1 for both the samples (Fig. S3, ESI†). These results mean that the distinct electrochemical performances of the two samples are not determined by their porosity. All the results mentioned above indicate that the electrochemical performance of the material is more optimal with a smaller particle size.
In order to interpret the electrochemical performance of cube-like Co3O4 and rod-like Co3O4, EIS was performed (Fig. 5e). The Nyquist plots show that the cube-like Co3O4 possesses a smaller semicircle and more inclined line, which indicate the lower electrode/electrolyte interfacial resistance (Rs) and the smaller diffusion resistance of Li+ (Rct) in the electrode. This phenomenon could be attributed to the smaller particle size, which allows easier access of Li+. Therefore, the high storage capacity and excellent rate performance of the cube-like Co3O4 anode material should be attributed to its unique nanostructure.
Conclusions
In this study, we chose two MOFs (rod-like MOF and cube-like MOF) with identical linkers as templates for Co3O4 anode materials of lithium-ion batteries. Structural evolution in the pyrolysis process was analyzed to interpret why the same phase materials derived from different MOFs showed diverse electrochemical performances. The metal content in the unit volume is a crucial factor for nanoparticle size. With increasing metal, the greater the probability of agglomeration, and the anisotropic structure of the MOF and the strength of the coordination bonds could affect the morphology of the product. From the perspective of electronic performance, the material featuring small particle size demonstrated better capacity, recyclability, and rate performance. In addition to the instructive principles for the screening of the MOF precursors mentioned above, the cube-like Co3O4 material we report herein, with a capacity of 936.2 mA h g−1 after 500 cycles at a current density of 100 mA g−1, also demonstrate remarkable performances as an anode material.Conflicts of interest
There are no conflicts to declare.Acknowledgements
This work was supported by the NSFC (21421001), the MOE Innovation Team of China (IRT_17R57), the Natural Science Fund of Tianjin, China (16JCQNJC02400), and the Programme of Introducing Talents of Discipline to Universities (B18030). This work is also dedicated to the 100th anniversary of Nankai University. We thank the staff from the BL16B1 beamline of the National Facility for Protein Science in Shanghai (NFPS) at the Shanghai Synchrotron Radiation Facility for assistance during data collection.Notes and references
- C. Liu, F. Li, L.-P. Ma and H.-M. Cheng, Adv. Mater., 2010, 22, E28–E62 CrossRef CAS.
- Z.-S. Wu, W. Ren, L. Xu, F. Li and H.-M. Cheng, ACS Nano, 2011, 5, 5463–5471 CrossRef CAS PubMed.
- V. Etacheri, R. Marom, R. Elazari, G. Salitra and D. Aurbach, Energy Environ. Sci., 2011, 4, 3243–3262 RSC.
- X. Zhang, A. Chen, M. Zhong, Z. Zhang, X. Zhang, Z. Zhou and X.-H. Bu, Electrochem. Energy Rev., 2018, 2, 29–104 CrossRef.
- X. Huang, X. Qi, F. Boey and H. Zhang, Chem. Soc. Rev., 2012, 41, 666–686 RSC.
- J. Zhou and B. Wang, Chem. Soc. Rev., 2017, 46, 6927–6945 RSC.
- W. Kang, Y. Zhang, L. Fan, L. Zhang, F. Dai, R. Wang and D. Sun, ACS Appl. Mater. Interfaces, 2017, 9, 10602–10609 CrossRef CAS PubMed.
- Y. Xu, G. Jian, M. R. Zachariah and C. Wang, J. Mater. Chem. A, 2013, 1, 15486–15490 RSC.
- Y. M. Chen, L. Yu and X. W. Lou, Angew. Chem., Int. Ed., 2016, 55, 5990–5993 CrossRef CAS PubMed.
- Y. Xu, G. Jian, Y. Liu, Y. Zhu, M. R. Zachariah and C. Wang, Nano Energy, 2014, 3, 26–35 CrossRef CAS.
- Z.-D. Huang, Z. Gong, Q. Kang, Y. Fang, X.-S. Yang, R. Liu, X. Lin, X. Feng, Y. Ma and D. Wang, Mater. Chem. Front., 2017, 1, 1975–1981 RSC.
- J. Zhang, J. Wan, J. Wang, H. Ren, R. Yu, L. Gu, Y. Liu, S. Feng and D. Wang, Angew. Chem., Int. Ed., 2019, 58, 5266–5271 CrossRef CAS.
- M. V. Reddy, G. V. Subba Rao and B. V. R. Chowdari, Chem. Rev., 2013, 113, 5364–5457 CrossRef CAS PubMed.
- L. Hu, N. Yan, Q. Chen, P. Zhang, H. Zhong, X. Zheng, Y. Li and X. Hu, Chem. – Eur. J., 2012, 18, 8971–8977 CrossRef CAS PubMed.
- P. G. Bruce, B. Scrosati and J.-M. Tarascon, Angew. Chem., Int. Ed., 2008, 47, 2930–2946 CrossRef CAS.
- X. Cao, C. Tan, M. Sindoro and H. Zhang, Chem. Soc. Rev., 2017, 46, 2660–2677 RSC.
- B. Wang, X.-Y. Lu, C.-W. Tsang, Y. Wang, W. K. Au, H. Guo and Y. Tang, Chem. Eng. J., 2018, 338, 278–286 CrossRef CAS.
- X.-M. Cao, Z.-J. Sun, S.-Y. Zhao, B. Wang and Z.-B. Han, Mater. Chem. Front., 2018, 2, 1692–1699 RSC.
- H. Furukawa, K. E. Cordova, M. O'Keeffe and O. M. Yaghi, Science, 2013, 341, 1230444 CrossRef PubMed.
- E. Virmani, O. Beyer, U. Lüning, U. Ruschewitz and S. Wuttke, Mater. Chem. Front., 2017, 1, 1965–1974 RSC.
- D. Tian, X.-L. Zhou, Y.-H. Zhang, Z. Zhou and X.-H. Bu, Inorg. Chem., 2015, 54, 8159–8161 CrossRef CAS PubMed.
- J. Li, D. Yan, S. Hou, T. Lu, Y. Yao and L. Pan, Chem. Eng. J., 2018, 354, 172–181 CrossRef CAS.
- K. J. Lee, T.-H. Kim, T. K. Kim, J. H. Lee, H.-K. Song and H. R. Moon, J. Mater. Chem. A, 2014, 2, 14393–14400 RSC.
- W. Xia, A. Mahmood, R. Zou and Q. Xu, Energy Environ. Sci., 2015, 8, 1837–1866 RSC.
- L. Oar-Arteta, T. Wezendonk, X. Sun, F. Kapteijn and J. Gascon, Mater. Chem. Front., 2017, 1, 1709–1745 RSC.
- L. Wang, J. Wan, Y. Zhao, N. Yang and D. Wang, J. Am. Chem. Soc., 2019, 141, 2238–2241 CrossRef CAS PubMed.
- H. L. Anderson, S. Anderson and J. K. M. Sanders, J. Chem. Soc., Perkin Trans. 1, 1995, 2231–2245 RSC.
- Z. Chang, D.-S. Zhang, T.-L. Hu and X.-H. Bu, Cryst. Growth Des., 2011, 11, 2050–2053 CrossRef CAS.
- A. L. Spek, J. Appl. Crystallogr., 2003, 36, 7–13 CrossRef CAS.
- R. Docherty, G. Clydesdale, K. J. Roberts and P. Bennema, J. Phys. D: Appl. Phys., 1991, 24, 89–99 CrossRef CAS.
- A. Li, M. Zhong, W. Shuang, C. Wang, J. Liu, Z. Chang and X.-H. Bu, Inorg. Chem. Front., 2018, 5, 1602–1608 RSC.
- Y. Feng, X.-Y. Yu and U. Paik, Chem. Commun., 2016, 52, 6269–6272 RSC.
- Y. Han, M. Zhao, L. Dong, J. Feng, Y. Wang, D. Li and X. Li, J. Mater. Chem. A, 2015, 3, 22542–22546 RSC.
- M. Chen, X. Xia, J. Yin and Q. Chen, Electrochim. Acta, 2015, 160, 15–21 CrossRef CAS.
- Z.-S. Wu, W. Ren, L. Wen, L. Gao, J. Zhao, Z. Chen, G. Zhou, F. Li and H.-M. Cheng, ACS Nano, 2010, 4, 3187–3194 CrossRef CAS PubMed.
- Y.-Y. Hu, Z. Liu, K.-W. Nam, O. J. Borkiewicz, J. Cheng, X. Hua, M. T. Dunstan, X. Yu, K. M. Wiaderek, L.-S. Du, K. W. Chapman, P. J. Chupas, X.-Q. Yang and C. P. Grey, Nat. Mater., 2013, 12, 1130–1136 CrossRef CAS.
- H. Sun, G. Xin, T. Hu, M. Yu, D. Shao, X. Sun and J. Lian, Nat. Commun., 2014, 5, 4526 CrossRef CAS.
Footnote |
| † Electronic supplementary information (ESI) available: Additional structure figures and supporting tables. CCDC 1887353. For ESI and crystallographic data in CIF or other electronic format see DOI: 10.1039/c9qm00098d |
| This journal is © the Partner Organisations 2019 |

