
 Open Access Article
 This Open Access Article is licensed under a Creative Commons Attribution-Non Commercial 3.0 Unported Licence
The potential environmental and climate impacts of stratospheric aerosol injection: a review†
Han N.
Huynh
 *ab and
V. Faye
McNeill
*cd
*ab and
V. Faye
McNeill
*cd
aCooperative Institute for Research in Environmental Sciences (CIRES), University of Colorado, Boulder, Colorado, USA 80305
bNational Oceanic and Atmospheric Administration (NOAA), Chemical Sciences Laboratory, Boulder, CO, USA 80305. E-mail: han.huynh@noaa.gov
cDepartment of Chemical Engineering, Columbia University, New York, New York, USA 10027. E-mail: vfm2103@columbia.edu
dDepartment of Earth and Environmental Sciences, Columbia University, New York, New York, USA 10027
First published on 15th January 2024
Abstract
Given the rise in global mean temperature as a direct consequence of increasing levels of greenhouse gases (GHG) in the atmosphere, a variety of climate engineering approaches, including stratospheric aerosol injection (SAI), have been proposed. Often criticized as a distraction from global efforts towards reducing GHG emissions, SAI aims to increase the Earth's albedo by seeding aerosols in the lower stratosphere. Inspired in part by observations of temporary cooling of the Earth's surface following major volcanic eruptions which introduced significant loadings of sulfate particles into the stratosphere, SAI has been explored extensively in modeling studies. The cooling effect may be accompanied by other significant consequences including stratospheric heating, stratospheric ozone (O3) depletion, and reduced global mean precipitation. In order to understand the potential environmental and climate impacts of SAI, we review the state of the knowledge regarding these issues, starting from an aerosol science perspective. We summarize aerosol radiative properties and the role they play in defining the optimal chemical and physical aerosol characteristics for SAI, and their implications for lower stratospheric warming. We then review in depth the impacts of stratospheric aerosol heterogeneous chemistry on global O3 levels. We review SAI modeling studies as well as their uncertainties, in comparison to the observed environmental and climate impacts of volcanically derived sulfate aerosols, including impacts on global temperature, stratospheric warming, and hydrological cycle. We also briefly discuss the current governance and economic considerations of the application of SAI and raise essential questions from both research and social standpoints that should be addressed before SAI is deployed for climate change mitigation.
Environmental significanceClimate engineering approaches, including stratospheric aerosol injection (SAI), have been proposed as climate mitigation tools to complement efforts to reduce greenhouse gas emissions or directly remove greenhouse gases from the atmosphere. SAI consists of injecting aerosol particles into the lower stratosphere which will reflect sunlight back to space, resulting in a cooling effect in the troposphere (lower atmosphere). The cooling effect is accompanied by other significant, potentially negative consequences including heating and ozone depletion in the stratosphere (upper atmosphere), and reduced global mean precipitation. We review the state of the knowledge regarding these issues and raise questions from both scientific and social standpoints that should be addressed before SAI is deployed for climate change mitigation. |
1 Introduction
Global anthropogenic carbon dioxide (CO2) emissions have increased steadily since 1750, with a significant rise between 1970 and 2011 that accounts for almost 50% of the cumulative emissions.1 The rise in global temperature at both land and ocean surfaces, more frequent observations of extreme weather events, such as tropical cyclones2,3 and heat waves,4 together with the projected increase in CO2 and other greenhouse gas (GHG) emissions,5 have prompted an increase in international commitment to battle global warming. As a result, the 2015 Paris agreement was adopted by almost 200 countries, setting a goal of limiting global warming to less than 1.5 °C by reducing GHG emissions significantly. However, there have been discrepancies in the estimated global carbon budget1,6–8 and thus, uncertainty in the required trajectory for emission reduction. In addition, the interpretation and implementation of the nationally determined contributions (NDC) or emission pledges from the participating countries have been inconsistent.9–11 Depending on the level of pledges from participating countries, how much global warming could be reduced varies.12 Consequently, there is a risk that, unless the global mitigation efforts are strengthened, total carbon emissions may remain relatively constant by the near-term target of 2030.13 Therefore, concurrently with the efforts of lowering GHG emissions, many different climate interventions, or ‘geoengineering’ techniques, have been proposed and researched extensively (Fig. 1). | ||
| Fig. 1 An illustration of climate geoengineering techniques, including stratospheric aerosol injection (SAI), cirrus cloud thinning (CCT), and marine cloud brightening (MCB), and their proposed delivery systems and potential impacts. Natural stratospheric aerosol release from a volcanic eruption is also shown for context. Surface albedo geoengineering (SAG), which is based on increasing the albedo of various surfaces, is also represented with two examples: installing white roofs on urban buildings and modifying plants and shrubs surface. See the text for details. | ||
Radiative forcing geoengineering (RFG) has been considered since at least the 1950s.14–16 RFG comprises two main categories that focus on increasing either the outgoing terrestrial longwave (LW) radiation escaping from the Earth's surface to space (i.e., Cirrus Cloud Thinning, CCT)17 or the amount of incoming shortwave (SW) solar radiation reflected back to space (solar radiation management – SRM).18 SRM techniques include Surface Albedo Geoengineering (SAG), Marine Cloud Brightening (MCB), and Stratospheric Aerosol Injection (SAI).
1.1 Cirrus cloud thinning (CCT)
Cirrus clouds are optically thin clouds made of ice crystals that are located in the upper troposphere. They were observed to have a strong impact on the global top-of-atmosphere (TOA) LW radiative fluxes and, thus, an overall warming effect on the climate.19 First proposed by Mitchell and Finnegan in 2009,17 CCT involves seeding cirrus clouds with efficient heterogeneous ice nuclei, such as bismuth tri-iodide, to enable the nucleation and growth of ice crystals, resulting in a quicker sedimentation out of the clouds. The resulting optically thinner cirrus clouds were modelled to reduce the amount of trapped infrared radiation in the atmosphere, leading to a net cloud forcing of about −2 W m−2 and a temperature drop of ∼1.4 K (ref. 20 and 21) at the Earth's surface. In addition to the net cooling impact, CCT was also predicted to enhance the hydrological cycle, including the strengthening of the Indian monsoon.22 However, over-seeding cirrus clouds with ice-nucleating particles could result in a net warming effect.20,23 The climatic responses to cirrus cloud seeding are also uncertain depending on the seed particle size, properties, ice saturation ratio, etc.24–26 For example, CCT was simulated to increase the frequency of extreme precipitation events in the Sahel and Central America regions albeit decrease them in other regions globally.271.2 Surface albedo geoengineering (SAG)
Unlike CCT, surface albedo geoengineering (SAG) focuses on increasing the Earth's albedo (i.e. the amount of incoming shortwave radiation being reflected back into space). A wide variety of surface albedo modifications have been explored, including increasing the albedo of desert,28 cropland,28,29 grassland,30 and urban environment.31–33 If plants and shrubs, which cover up to 7.5% of the Earth's surface,28 were bioengineered to increase their albedo by 25%, a radiative forcing (RF) of about −0.5 W m−2 would be achieved.15,30 At the same time, modifying crops to increase their albedo by 80% (ref. 29) would lead to a RF of −0.35 W m−2, assuming the crops are present year-round over an area as large as 1.4 × 10¹³ m2.34 In addition to modifying vegetation, albedo enhancement to urban regions has the ability to combat the growing problem of urban heat islands (UHI),35,36 which was calculated to contribute up to 4% of gross global warming.37 UHI was defined by Oleson and company (2010) as the difference between “the air temperature in the urban canopy layer to the 2 m air temperature from the “rural” surfaces (i.e. the vegetated and bare soil surfaces).”38 By increasing the roof albedo in their simulation, the authors determined that the annual mean heat island in the control simulation decreased from 1.2 °C (in the base case) to 0.8 °C, equivalent with a 33% reduction in UHI. Thus, many cities in the US have started to implement cool roofs.39 However, there are regional and seasonal limitations to the cooling effectiveness of all of the SAG techniques mentioned here. For example, Oleson et al. (2000) found that, in the winter, the use of white roofs to mitigate UHI is less efficient at high latitudes because of the high albedo of deposited snow on the roofs, the reduction in incoming solar radiation, and the concomitant increase in required space heating. As a result, the cooling effect of white roofs may only be local.37,38 Irvine et al. (2011) determined that by changing surface albedo over the global desert area, the annual average surface air temperature decreased by 1.1 °C. Similar to urban and crop geoengineering, the cooling effect was simulated to have regional disparity, where the desert regions such as Sahara were significantly cooler than other continental areas (−10 °C vs. −1.1 °C).28 In general, due to the dependence of all SAG methods on land coverage, the Northern Hemisphere (NH) is more effectively cooled than the Southern Hemisphere (SH). The regional impacts of SAG are discussed in more detail for different climate extreme scenarios in Seneviratne et al. (2018).1.3 Marine cloud brightening (MCB)
Beyond the SAG techniques, other notable SRM options that have been extensively researched are MCB and stratospheric aerosol injection (SAI) (Fig. 1). The proposed concept of MCB40,41 is to inject sea salt aerosols into the marine boundary layer to increase the cloud droplet number concentrations, and therefore the albedo of the low-lying clouds, due to their enhanced surface area concentrations.42 The increase in cloud condensation nuclei (CCN) concentrations also results in a reduction in droplet size, and subsequently an increase in the cloud lifetime.43 As a result, the degree of MCB's cooling effect could, in principle, be controlled by adjusting the spraying rate of the seeding maritime aerosols.44 Over the ocean, the effects of aerosols on marine clouds have previously been observed in ship tracks or other particle-laden pollution plumes.45 Computer simulations have yielded favorable results for MCB application. Randall et al. (1984) estimated that a 4% increase in marine stratus clouds could offset the global warming impact caused by the doubling of CO2 level.46 Similarly, Latham et al. (2008) simulated that, under optimal cloud seeding conditions where >25% of the ocean surface is covered, a minimum globally averaged RF of −3.7 W m−2 could be achieved.44 MCB was also modelled to restore precipitation and sea ice values from the impact of increasing GHG concentrations. Specifically, Rasch et al. (2009) computed that if ∼70% of the ocean surface was seeded monthly over an 80 year period, polar sea ice in the NH would recover to within 2% of 2009 value and that in the SH would increase by 20%. Without cloud seeding, the control case, where CO2 level was doubled over a 100 year period, yielded about 20% and 36% loss in sea ice area over the NH and SH, respectively.47 However, there are uncertainties in the albedo response to MCB from the variations in the cloud structure (e.g., closed vs. open cell)48 and in cloud altitude,49 to name a few. Additionally, similar to the SAG methods, MCB may only have a regional cooling impact, with a focus on the ocean and coastal areas. In addition, the climate impacts of MCB were simulated to be region-dependent, where precipitation was predicted to decrease drastically in the Amazon rain forest.50 Horowitz et al. (2020) determined that by injecting sea salt aerosols throughout the tropics to offset the 4.5 W m−2 RF from the Representative Concentration Pathway 4.5 scenario (RCP4.5), tropospheric reactive chlorine and bromine species would increase leading to a 2–4% reduction in surface ozone. Subsequently, OH production would decrease resulting in a 3–6% increase in methane lifetime.51 The 2020 study findings suggest that MCB may have implications on air quality in coastal regions. Aside from implementation limitations (e.g., creation and dissemination of CCN),52–54 many environmental and meteorological concerns have been identified that require further study before MCB deployment, such as the potential salt damage to soils and plants,55 the climate feedback of the increase in land–ocean temperature contrast (e.g., tropical circulation), and the radiative effect of changing CCN in higher-level clouds.41,44,56,57 Recent studies have investigated the effects of MCB in more comprehensive models as well as implementation methods such as sea salt aerosol sprayers system.58–601.4 Stratospheric aerosol injection (SAI)
Proposed as a temporary relief to counterbalance the rapid rise in global mean temperature, SAI involves seeding aerosols in the lower stratosphere to harness their reflectivity to offset the positive anthropogenic RF.61–64 The field of SAI, first proposed by Budyko in 1977,65 is inspired in part by observations of a global cooling effect66–68 following major volcanic eruptions.The eruption of Mt. Pinatubo (15 °N, 121 °E) in June 1991 released large quantities of volcanic materials directly into the stratosphere, including ash and sulfur dioxide gas (SO2). In the plumes of major explosive volcanic eruptions such as Mt. Pinatubo, SO2 has the most significant impact on albedo because it eventually forms sulfate aerosols after getting oxidized by hydroxyl (OH) radicals in the stratosphere. The initial OH oxidation of SO2 in the Mt. Pinatubo plume was slow due to the depletion of OH radicals by the large cloud of volcanic SO2.69 The stratospheric aerosol loading from such major volcanic eruptions greatly perturbs the Earth's radiative balance, leading to a temporary cooling effect in the troposphere as illustrated in Fig. 2.70 Excessive cooling caused by volcanic eruptions has resulted in volcanic winter, or “year without a summer,” with devastating impacts like worldwide food shortage in 1816 following the 1815 eruption of Mount Tambora.71
 | ||
| Fig. 2 The observed (black lines) global-mean (90 °N–90 °S) changes in the lower tropospheric temperature compared to the modelled result (dashed red) after Mt. Pinatubo's eruption in June 1991. From Soden et al., Science, 2002, 296, 727–730. Reprinted with permission from AAAS. | ||
Besides the tropospheric cooling effect, the increase in stratospheric aerosol optical depth (AOD)72–75 causes warming in the lower stratosphere (∼24 km).66,76,77 For example, after the 1982 eruption of El Chichón (17 °N, 93 °W), tropospheric temperature was cooled by 0.5 °C, while the lower tropical stratosphere was warmed by 3–4 °C.78,79 Similar observations were made after Mt. Pinatubo's eruption in 1991: after being corrected for 1992 El Niño-Southern Oscillation (ENSO) the tropospheric cooling was ∼0.5 °C as shown in Fig. 2, while stratospheric warming was 2.5 °C.68,80 In the presence of a significant loading of strongly absorbing aerosols like sulfate, the rise in temperature, especially at the tropical tropopause layer (TTL), drives up the amount of water vapor entering the stratosphere.81,82 Since stratospheric water vapor (SWV) is a GHG, this increase leads to further warming in the stratosphere,81,82 resulting in changes in the stratospheric–tropospheric tropical circulation83–85 and accelerating stratospheric ozone depletion.81,86,87 In particular, stratospheric heating induces major dynamic climate feedbacks such as enhancement in tropical upwelling and extratropical downwelling in the SH, affecting the Brewer–Dobson circulation (BDC) in the stratosphere as well as the global O3 budget (e.g., the O3 stratosphere–troposphere exchange (STE) process)88–93 (more details in Section 3). In the scenario of submarine volcanic eruption like that of Hunga Tonga-Hunga Ha'apai (HTHH) in the South Pacific (20 °S, 175 °W) in 2022, more than 100 Tg of water was injected directly into the stratosphere, contributing up to 10% of global stratospheric water.94,95 The increased stratospheric water burden enhanced the conversion rate of SO2 to sulfate, leading to a quicker increase in stratospheric AOD. Despite the initial observed radiative cooling, the presence of large SWV from HTHH eruption was modelled to ultimately lead to a net warming of the climate system.96,97
Beyond stratospheric heating, volcanically derived sulfate aerosols also chemically react with gas-phase reservoir species of ozone (O3) catalytic loss cycles, such as HNO3, HCl, and N2O5, resulting in significant O3 depletion at mid-latitudes in the stratosphere, which has been observed by TOMS and ground spectrophotometers after the eruptions of both Mt. Pinatubo and El Chichón.98–101 In both eruptions, O3 depletion reached about 10% between 16–19 km and 20% between 13–22 km in altitude.68,79,80 Stratospheric O3 depletion leads to an increase in UV-B radiation at the Earth's surface in the polar regions,102 causing adverse effects on human health, marine and terrestrial species such as DNA damage and an increased risk of cancer.103,104
The climate impacts of SAI would depend strongly on how, where, and for how long aerosols or their gas-precursor are injected in the atmosphere. While volcanic eruptions are one-time pulsed injections, ideal SAI scenarios generally involve continuous or periodic injection due to the larger particle sizes and hence reduced albedo and shorter lifetime in the atmosphere.81 The total injected amount of either aerosols (e.g., calcite) or their gas precursor (e.g., SO2 in the case of sulfate aerosol) will depend upon the climate scenarios (i.e., how much radiative forcing is desired), the extent of their impacts on the atmosphere (e.g., stratospheric ozone chemistry, cirrus clouds, etc.),105–107 and the injection scheme. Ideal engineered deployment scenarios are also different from more complex ones which may be affected by, for example, unexpected environmental disturbances or uncoordinated actors. Nevertheless, as some of the only examples of large aerosol loadings in the lower stratosphere, observations of volcanic eruptions and of their environmental and climate impacts are informative.108
Depending on the climate scenario (i.e., the degree of cooling, the continuous or periodic injection rate of aerosol material, the injection location, the termination scheme), SAI could be designed109 to minimize its negative environmental and public health impacts.110 For example, Eastham et al. (2018) approximated that at a continuous aerosol injection rate of 1 Tg S per year, the increase in UV exposure will lead to an increase in mortality. Yet that would be offset by the gains in improved regional air quality due to reduced surface O3 exposure.111 In the study by Madronich et al. (2018),112 about 40 Tg SO2 per year by 2080 was injected annually at four predetermined locations (15 °S, 15 °N, 30 °S, 30 °N) to keep the global temperatures at 2020 levels. UV radiation in this case was modelled to reduce substantially globally and across all seasons. Regardless of their benefits or potential environmental risks, there have long been discussions about how SAI and other SRM studies could weaken the resolve around mitigations efforts to reduce GHGs emission.113–117 However, recent controlled studies have determined that the potential deployment of SAI or SRM either has no effect on or increases the support of the surveyed public on climate mitigation technologies (e.g., carbon capture).116,118,119 In addition, some modeling studies suggest that SAI could reduce the global carbon burden and therefore ocean acidification via various pathways.120–122 For example, by inducing sea surface temperature cooling, SAI improves the carbon uptake of the marine environments.123 However, in the case of a sudden SAI termination, carbon burden has been projected to increase rapidly, causing a worse effect on the environment than the absence of SAI.120,124–126 As a result, SAI implementation most likely requires a gradual reduction in aerosol injection as the rise in GHG levels slows down in the future. A combination of SAI application and reduction in GHGs emission may yield the best outcome.127
To understand the applicability of SAI to offset the rapid rise in global surface temperature, a variety of models and related frameworks has been proposed and extensively studied over the years, many of which are summarized in the 2022 WMO Ozone Assessment report.110 The overall uncertainties associated with SAI are also discussed in detail in Kravitz and MacMartin (2020).106 In this review, our goal is to examine in depth various aspects of SAI with a focus on its foundation – aerosols. Specifically, aerosol radiative properties and their significant role in SAI application design are discussed in Section 2. Lower stratospheric heating due to elevated aerosol loadings, and potential ways to mitigate that unintended consequence of SAI, are also examined in Section 2. The negative impacts of aerosol heterogeneous chemistry on the global O3 budget are covered in detail in Section 3, where we mainly focus on the mechanism behind stratospheric O3 depletion in Section 3.1. The chemical mechanisms behind changes in tropospheric O3 due to both aerosol chemistry and the reduction in atmospheric water vapor as a direct result of global cooling128 are included in Section 3.2. We explore the SAI impact on other aspects of the climate system, such as the hydrological cycle, extreme weather events, and biodiversity in Section 4. Regarding international governance and economic framework for SAI research, implementation and maintenance, we offer a summary of current research and proposals in Section 5. Section 6 includes suggestions and recommendations for future research that is needed to evaluate SAI's applicability for climate mitigation, including uncertainties regarding SAI technology (e.g., seeding aerosols lifetime, termination strategy) and its human health and social impacts.
2 Aerosol radiative properties
The capabilities of atmospheric aerosols to scatter or absorb solar radiation at different wavelengths, collectively referred to as the aerosols' optical properties, have direct effects on the Earth's radiative budget.68,129 The background stratospheric aerosol layer, located between 15 and 25 km in altitude, consists of aerosols either transported via different pathways from the TTL130 or formed after volcanic eruptions. Together with tropospheric SO2, carbonyl sulfide (OCS), a chemically inert species, is the main contributor to non-volcanic background sulfate aerosols. OCS and tropospheric SO2 enter the stratosphere through stratosphere–troposphere exchange (STE),131,132 where up to 80% of OCS undergoes photodissociation to form SO2.131 SO2, in turn, converts into sulfate particles mainly via its reaction with OH radical in the free troposphere and lower stratosphere.133 Explosive (Plinian) volcanic eruptions perturb the aerosol loading in the stratosphere. Within a month after Mt. Pinatubo's eruption in 1991, the resulting volcanically derived sulfate aerosols dispersed longitudinally covering up to 42% of the Earth's surface72 and increasing the stratospheric opacity of the tropics between 20 °S and 30 °N latitudes72,73 by approximately two orders of magnitude as measured by SAGE II75 (left, Fig. 3). This significantly thicker stratospheric aerosol layer at the tropics increased outgoing SW radiation and lowered the global-mean tropospheric temperature as much as 0.6 °C by the end of 1991 (ref. 68 and 128) (Fig. 2). By the end of 1992, the transient negative forcing produced by Mt. Pinatubo's eruption, about −3 W m−2, exceeded the global climate forcing (∼2 W m−2) that was caused by the rise in GHG from pre-industrial (PI) to 1990 (1850–1990).68 This observation further proved the remarkable impact stratospheric aerosol could have on cooling the climate, albeit temporarily. Furthermore, even though the AOD decreased by an order of magnitude from the time of the eruption until September 1993 (right, Fig. 3) due to gravitational sedimentation,68 the remaining loading of sulfate aerosols in the stratosphere was still significant enough to result in a surface cooling effect that persisted till at least 1994 (ref. 128 and 134) as demonstrated in Fig. 2. | ||
| Fig. 3 Stratospheric aerosol optical depth, measured by the stratospheric aerosol and gas experiments-II (SAGE II), was observed to confine in the tropics immediately after Mt. Pinatubo's eruption in June 1991 (left), before the aerosols were dispersed two years later (right). Reprinted with permission of the publisher from McCormick et al., Nature, 1995, 373, 399–404. | ||
Aerosol and chemical species transport from the equator to the poles following volcanic eruptions are driven by stratospheric circulation, Brewer–Dobson circulation (BDC), which also changes seasonally.92 Based on the timing, location, and magnitude of SAI, the climate response differs.135 For example, Tilmes et al. (2017) determined that if 12 Tg SO2 per year was injected over a 10 year period at 15 °N at 5 km above the tropopause, the surface temperature would drop about 0.2 °C per Tg S per year. The same SO2 amount being injected at 1 km above the tropopause would lead to a reduction of 0.12 °C per Tg S per year instead.136 Visioni and co-authors (2019) further determined that aerosol injection limited to the spring season at either 15 °N or 15 °S resulted in a higher global AOD than that done year-round.137
2.1 Aerosol size
Aerosol particle size plays an important role in their radiative effects138,139 and has been taken into account in SAI models.86,140–143 Lacis et al. (1992) illustrated that if the effective radius of a stratospheric aerosol exceeds ∼2 μm, its infrared absorptivity could exceed the albedo effect.144 In the case of Mt. Pinatubo's eruption, the aerosol effective radius was estimated to increase from an average of 0.3 μm to roughly 1 μm.145,146 The observed cooling effect78 after this eruption is consistent with the aerosol size evaluation by Lacis et al. (1992). In addition, aerosol size directly affects its lifetime in the stratosphere147,148 and hence the duration of its radiative impact.Aerosols have indirect effects on the Earth's climate by impacting the concentrations and variations of both CCN149 and ice nuclei.150,151 This nucleation ability of aerosols is exploited in both CCT and MCB proposals,17,40 as discussed in Section 1. For SAI application, once aerosols are transported from the stratosphere to the lower troposphere via gravitational settling,148,152 the ensuing aerosol–cloud interactions may have unintended, albeit uncertain, consequences on the hydrological cycle (e.g., reduced precipitation153–156) (see Section 4.1 for more discussion of this issue). In addition, similar to CCT and MCB, the increase in the number of available aerosols to act as CCN could also reduce the mean size of the cloud droplets, leading to an enhancement in the cloud albedo.42,157 A positive change in the cloud albedo effect would prompt more light reflection and thus a cooling effect. Schmidt et al. (2012) estimated that, by including a hypothetical global volcanic sulfur flux based on volcanic emission inventories, cloud droplet number concentrations could increase by 10% under 2012 conditions.158 Similar to the range stated in the 2007 IPCC report,159 the authors calculated a total cloud albedo forcing range of roughly −0.5 to −1.7 W m−2, including the effects of both anthropogenic (or background) aerosols and volcanic aerosol.
2.2 Aerosol optical properties
How much a change in stratospheric aerosol loading impacts the global radiative forcing depends not only on AOD but also on aerosol composition and its corresponding optical properties. Wavelength-dependent aerosol refractive index, which includes a real index and an imaginary index, accounts for how much light would refract and be absorbed, respectively, by an aerosol particle. An estimate of SW refractive index for various aerosol types were calculated by Dykema and co-authors (2016) and illustrated in Fig. 4. The real refractive index is more frequently available through experimental measurement. The imaginary refractive index, which accounts for the aerosol's absorption capability, may be measured or calculated based on methods used for astronomical applications.160 For solid aerosol materials, uncertainties in their refractive index values also come from potential defects and impurities in the material. Their refractive index also needs to be corrected for birefringence. | ||
| Fig. 4 Shortwave real (left) and imaginary (right) refractive index of different aerosol types based on both available experimental data and estimates from model dielectric functions. Reprinted with permission of the publisher from Dykema et al., Geophys. Res. Lett., 2016, 43, 7758–7766. | ||
For SAI application, aerosol absorption across both SW and LW has an impact on the level of stratospheric heating. For example, since diamond aerosols have no dipole moment, it has a very low imaginary refractive index (orange line in Fig. 4) compared to CaCO3 (grey line) and therefore absorbs LW radiation minimally. In contrast, sulfate aerosols (yellow line) absorb strongly in the infrared region due to the continuum absorption of their liquid phase. In fact, sulfate has a stronger absorption capability than most of the studied solid materials as shown in Fig. 4. For solid aerosol optical properties, besides their complex refractive index, SAI models also need to account for their fractal aggregates especially upon injection.161
2.3 Aerosol types
Sulfate aerosols, the main component of background stratospheric aerosols162 as well as those produced after volcanic eruptions,130 have their radiative effects observed66–68 and modelled89,163,164 in numerous studies over the decades. Beyond tropospheric cooling effect, aqueous sulfate aerosols produced from volcanic injections were determined to cause localized heating in the lower stratosphere (30–100 hPa)70 by absorbing solar near infrared radiation and upwelling LW radiation from the surface.165–167 The extent of stratospheric radiative heating post-volcanic eruptions varies with latitude and altitude.140,166 It depends strongly on stratospheric aerosol loading or AOD.70,81,168 The phase of the quasi-biennial oscillation (QBO) at the time of the eruption is also an important factor in the case of tropical injections.169–171Fig. 5 illustrates the temperature anomaly in the stratosphere as a result of major volcanic eruptions mostly in the 20th century. For example, ∼30 Tg stratospheric aerosol loading of Pinatubo75 increased the lower tropical stratospheric temperature at 50 hPa by ∼4 °C (ref. 70) in 1991. Previously, Labitzke et al. (1992) also reported significant stratospheric heating in 1991 at 30 hPa and 20 °N with the biggest spike in September at 2.5 °C, about 3 standard deviations higher than the 26 year monthly mean (1964–1990).66 As demonstrated in Fig. 5, the largest recorded eruption between 1870 and 2000 was that of Krakatau (1883). Approximately 50 Tg of stratospheric aerosols172 was loaded resulting in a volcanic AOD of ∼0.15 at 550 nm between 30°S and 30°S compared to that of <0.10 from Mt. Pinatubo's eruption.173 As a result, the stratospheric heating in 1883 was substantially higher than that in 1991 (∼5.5 °C vs. ∼4 °C).70 Overall, Fig. 5 shows that the observed and modelled temperature response in the lower stratosphere scaled with the measured volcanic AOD.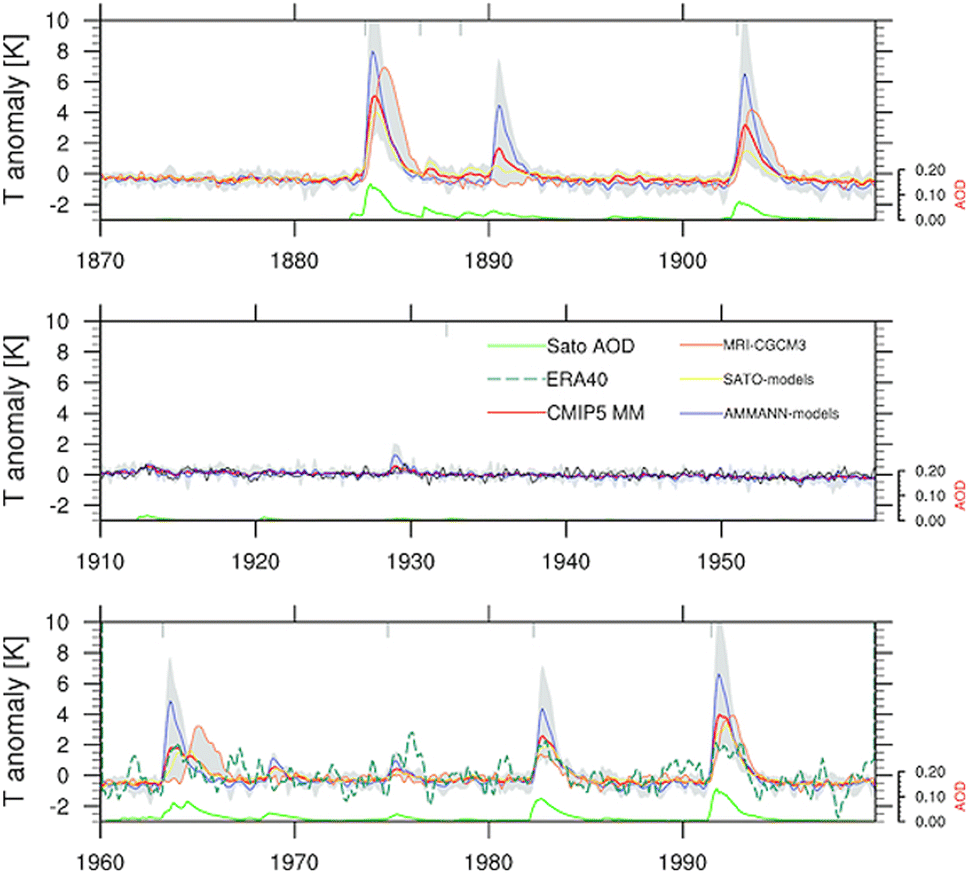 | ||
| Fig. 5 Stratospheric warming at 50 hPa between 30 °S and 30 °N in the lower stratospheric region after nine major volcanic eruptions in the period between 1870 and 2000 from both historical observations and modeling simulations. Reprinted with permission of the publisher from Driscoll et al., J. Geophys. Res. Atmos., 2012, 117, 17105. | ||
With the current knowledge of aerosols' direct and indirect climate forcing effects, besides sulfate many different types of aerosols have been proposed18,141 and explored in the context of SAI, including but not limited to black carbon (BC),86,87,140 titanium dioxide (TiO2),87,140,161 alumina (Al2O3),142 and limestone140,143,161,174 as summarized in Table 1. Sulfate is the most well-studied stratospheric aerosol due to its enhancement after volcanic eruptions. As a result, many SAI scenarios have been modelled using sulfate to offset different GHG trajectories set out by the IPCC.
| Base case scenario | Model | SRM scenario | SRM period | Aerosol studied | Particle radiusa (μm) | Aerosol loading (Tg per year) | Δ Surface temp (K) | Δ Strat. tempb (K) | Δ Global ozone columnc (%) | Δ Precip. (mm per day) | Radiative forcingd (W m−2) | Year | Ref. |
|---|---|---|---|---|---|---|---|---|---|---|---|---|---|
| a Particle radius is denoted as either effective, mode, or median radius depending on studies. b Around ∼50 mb in the tropics (30 °N–30 °S). c Global O3 column change is given in % unless specified otherwise (e.g., DU). d The listed global annual mean net SW RF is calculated at the TOA. If the values are followed by ‘*’ or ‘†’ then the RF is at the surface including cloud adjustments or at the tropopause. (127) net SW only. e Maximum ozone loss at high latitudes in the SH. f Largest reduction (28%) was observed in the South Pole during ozone hole season, while the 8% increase was simulated for Jan between 30 °N and 60 °N. g Largest reduction (40%) was observed in the South Pole during ozone hole season, while the 8% increase was simulated for Jan between 30 °N and 60 °N. h O3 impacts were estimated using gas uptake coefficients that were calculated dependently and independently from the aerosol layer thickness to yield the lower and upper limits, respectively, for O3 column change. i Annual changes in total column ozone (TCO) in the tropics. Impacts in other regions and specific seasons are detailed in the cited reference. | |||||||||||||
| REF2 | WACCM3 | Geo-eng. | 2020–2050 | Sulfate | 0.43 | 2 | −0.5 | 1.2 | −10e | <0.1 | — | 2009 | 175 |
| GEO0 | AER-2D | GEO1 | 20 years | Sulfate | 0.1 | 1 | — | 0.1 | −2.3 | — | −0.37 ± 0.42* | 2009 | 81 |
| SOCOLv2.0 | |||||||||||||
| GEO0 | AER-2D | GEO2 | 20 years | Sulfate | 0.2 | 2 | — | 0.4 | −3.2 | — | −0.78 ± 0.38* | 2009 | 81 |
| SOCOLv2.0 | |||||||||||||
| GEO0 | AER-2D | GEO5 | 20 years | Sulfate | 0.5 | 5 | — | 1.3 | −4.5 | — | −1.06 ± 0.31* | 2009 | 81 |
| SOCOLv2.0 | |||||||||||||
| GEO0 | AER-2D | GEO10 | 20 years | Sulfate | 0.6 | 10 | — | 2.8 | −5.3 | — | −1.68 ± 0.42* | 2009 | 81 |
| SOCOLv2.0 | |||||||||||||
| GEO0 | AER-2D | GEO5p12 | 20 years | Sulfate | 0.1 | 5 | — | 1.3 | −4.6 | — | −1.29 ± 0.35* | 2009 | 81 |
| SOCOLv2.0 | |||||||||||||
| GEO0 | AER-2D | GEO5p2 | 20 years | Sulfate | 0.3 | 5 | — | 1.3 | −4.9 | — | −1.64 ± 0.23* | 2009 | 81 |
| SOCOLv2.0 | |||||||||||||
| 2000 | GISS ModelE2 | Def | 2000–2010 | BC | 0.08 | 1 | −0.38 | 13 | 0 | — | −0.20 | 2012 | 86 |
| 2000 | GISS ModelE2 | HA | 2000–2010 | BC | 0.08 | 1 | −4.92 | 45 | −27 | — | −0.95 | 2012 | 86 |
| 2000 | GISS ModelE2 | SmR | 2000–2010 | BC | 0.03 | 1 | −9.45 | 60 | −47 | — | −1.97 | 2012 | 86 |
| 2000 | GISS ModelE2 | LgR | 2000–2010 | BC | 0.15 | 1 | −0.06 | 3 | 0 | — | −0.09 | 2012 | 86 |
| 2000 | GISS ModelE2 | HALgR | 2000–2010 | BC | 0.15 | 1 | −2.13 | 25 | −13 | — | −0.50 | 2012 | 86 |
| 1991–1995 | ECHAM5-HAM | GE | 1991–1995 | Sulfate | — | 5 | −4.9 | 2 | — | — | −0.37 | 2012 | 164 |
| 1901–2000 | IGCM | 4CO2 + sulfate | 2000–2080 | Sulfate | 0.1 | — | −0.28 | — | — | −0.25 | — | 2014 | 85 |
| RCP4.5 | ULAQ-CCM | G3 | 2020–2070 | Sulfate | — | SAI | — | 0.20 | −2.8 DU | — | −1.42† | 2014 | 102 |
| RCP4.5 | GISS-E2-R | G3 | 2020–2070 | Sulfate | — | SAI | — | −0.03 | −2.1 DU | — | −0.21† | 2014 | 102 |
| RCP4.5 | ULAQ-CCM | G4 | 2020–2070 | Sulfate | 0.61 | 5 | — | 0.40 | −1.1 DU | — | −1.52† | 2014 | 102 |
| RCP4.5 | GISS-E2-R | G4 | 2020–2070 | Sulfate | 0.35 | 5 | — | −0.45 | −9.7 DU | — | −1.64† | 2014 | 102 |
| RCP4.5 | MIROC-ESM-CHEM | G4 | 2020–2070 | Sulfate | 0.24 | 5 | — | 0.16 | −1.1 DU | — | −0.76† | 2014 | 102 |
| RCP4.5 | GEOSCCM | G4 | 2020–2070 | Sulfate | 0.60 | 5 | — | 0.58 | −2.1 DU | — | −1.22† | 2014 | 102 |
| — | AER 2-D | — | 10 years | Al2O3 | 0.08 | 4* | — | — | −10 | — | −0.1 | 2015 | 142 |
| — | AER 2-D | — | 10 years | Al2O3 | 0.16 | 4 | — | — | −6 | — | −0.7 | 2015 | 142 |
| — | AER 2-D | — | 10 years | Al2O3 | 0.24 | 4 | — | — | −3 | — | −1.1 | 2015 | 142 |
| — | AER 2-D | — | 10 years | Diamond | 0.16 | 4 | — | — | −6 | — | −1.8 | 2015 | 142 |
| RCP8.5 | HadGEM2-CCS | GeoSulf | 2020–2100 | Sulfate | 0.376 | 14 | 0 | 7 | — | −0.1 | — | 2016 | 87 |
| RCP8.5 | HadGEM2-CCS | GeoBC | 2020–2100 | BC | 0.0118 | 0.81 | 1 | 76 | — | −0.27 | — | 2016 | 87 |
| RCP8.5 | HadGEM2-CCS | GeoTiO2 | 2020–2100 | TiO2 | 0.045 | 5.8 | 0.5 | +22 | — | −0.15 | — | 2016 | 87 |
| RCP6.0 | RRTM | Rutile | 2040+ | TiO2 (rutile) | 0.130 | 1.3 | — | 1.9 | — | — | −1 | 2016 | 161 |
| RCP6.0 | RRTM | Anatase | 2040+ | TiO2 (anatase) | 0.145 | 1.1 | — | 0.7 | — | — | −1 | 2016 | 161 |
| RCP6.0 | RRTM | α-SiC | 2040+ | α-SiC | 0.150 | 0.9 | — | 0.48 | — | — | −1 | 2016 | 161 |
| RCP6.0 | RRTM | Diamond | 2040+ | Diamond | 0.150 | 1.0 | — | 0.05 | — | — | −1 | 2016 | 161 |
| RCP6.0 | RRTM | α-ZrO2 | 2040+ | α-ZrO2 | 0.170 | 2.1 | — | 0.09 | — | — | −1 | 2016 | 161 |
| RCP6.0 | RRTM | α-Al2O3 | 2040+ | α-Al2O3 | 0.215 | 2.6 | — | 0.18 | — | — | −1 | 2016 | 161 |
| RCP6.0 | RRTM | CaCO3 | 2040+ | CaCO3 | 0.275 | 2.9 | — | 0.15 | — | — | −1 | 2016 | 161 |
| RCP6.0 | RRTM | Sulfate | 2040+ | Sulfate | 0.300 | 3.0 | — | 1.3 | — | — | −1 | 2016 | 161 |
| RCP6.0 | AER 2-D | Calcite | 2040+ | CaCO3 | 0.275 | 5.6 | — | 0.2 | 6.4 | — | −2 | 2016 | 143 |
| RCP4.5 | HadGEM2-ES | G4 | 2020–2069 | Sulfate | 0.55 | 5 | −1 | — | — | −0.1 | — | 2017 | 176 |
| RCP4.5 | HadGEM2-ES | G4NH | 2020–2069 | Sulfate | 0.55 | 5 | −1 | — | — | −0.7 | — | 2017 | 176 |
| RCP4.5 | HadGEM2-ES | G4SH | 2020–2069 | Sulfate | 0.55 | 5 | −1 | — | — | 0.4 | — | 2017 | 176 |
| RCP6.0 | CESM CAM4-chem | G4SSA | 2020–2069 | Sulfate | — | 8 | −0.9 | 3 | −3 | −0.07 | −2.5 | 2017 | 89 |
| RCPP8.5 | CESM1 (WACCM) | Low-altitude | 2042–2049 | Sulfate | 0.42 | 32 | −2 | 15 | −28 to 8f | −0.4 | −4 | 2018 | 135 |
| RCPP8.5 | CESM1 (WACCM) | High-altitude | 2042–2049 | Sulfate | 0.48 | 24 | −2 | 10 | −40 to 8g | −0.6 | −4 | 2018 | 135 |
| RCP4.5 | MPI ESM | G3 | 2050–2069 | Sulfate | — | SAI | −0.88 | — | — | 0.26 | — | 2018 | 177 |
| RCP6.0 | AER 2-D | Calcite | 2040+ | CaCO3 | — | 5.6 | — | — | −5 to 25h | — | −2 | 2020 | 178 |
| SSP5-8.5 | CESM2 (WACCM) | G6sulfur | 2020–2100 | Sulfate | — | 21 | −3 | 7 | 4 DUi | — | −0.2 | 2022 | 107 |
| SSP5-8.5 | CNRM-ESM2-1 | G6sulfur | 2020–2100 | Sulfate | — | — | −2 | 5 | 2 DU | — | −0.2 | 2022 | 107 and 179 |
| SSP5-8.5 | ISPL-CM6A-LR | G6sulfur | 2020–2100 | Sulfate | — | 40 | −3.5 | 13.5 | — | — | −0.26 | 2022 | 107 and 179 |
| SSP5-8.5 | MPI-ESM1.2-LR | G6sulfur | 2020–2100 | Sulfate | — | 36 | −2 | 11 | — | — | −0.25 | 2022 | 107 and 179 |
| SSP5-8.5 | MPI-ESM1.2-HR | G6sulfur | 2020–2100 | Sulfate | — | 36 | −2 | 11 | — | — | −0.25 | 2022 | 107 and 179 |
| SSP5-8.5 | UKESM1-0-LL | G6sulfur | 2020–2100 | Sulfate | — | 21 | −2.5 | 5 | −2 DU | — | −0.3 | 2022 | 107 and 179 |
By varying SAI parameters (e.g., aerosol loading, aerosol injection location, frequency, duration), the models yielded scenarios, for example, with minimal stratospheric warming.81 A commonly used IPCC climate scenario, RCP6.0, is a scenario where a RF of 6.0 W m−2 may be caused by GHGs in 2150.180 Xia et al. (2017) modelled a sulfate scenario, G4SSA, based on Tilmes et al. (2015)181 for the period between 2020 and 2069 that decreased the TOA solar flux by 2.5 W m−2 compared to RCP6.0 as seen in Table 1. For G4SSA a constant sulfate aerosol surface area distribution at 60 mb was added at the beginning of the simulation and maintained over the 50 year period. This abrupt change in aerosol loading reflects the Geoengineering Model Intercomparison Project (GeoMIP) G4 scenario as proposed by Kravitz et al. (2011).182 Similar to previous observations, the 2017 study also reported an increase in the lower tropical stratospheric temperature (∼3 K) at 30–50 mb. Besides investigating the effect of sulfate aerosols on stratospheric temperature, Dykema et al. (2016) also studied a variety of alternative aerosols to improve aerosol radiative properties for SRM application. Sulfate aerosols have one of the strongest infrared absorptions among the studied materials, leading to an increase of ∼1.3 K in stratospheric temperature.161 Note that this heating rate is lower than those observed in the Pinatubo eruption and in Xia et al. (2017) due to a smaller induced RF (−1 W m−2) compared to −3 W m−2 (ref. 68) and −2.5 W m−2,89 respectively. The model indicated that, among the studied materials, diamond has the smallest stratospheric heating at ∼0.05 K due to its minimal absorption of LW and SW radiation. Even though diamond only requires a third of total mass of 70 wt% sulfate to achieve a RF of −1 W m−2,161 the delivered cost per unit weight of diamond is estimated to be about two orders of magnitude higher.183 Due to their high refractive index, Al2O3 and calcite (CaCO3), ubiquitous mineral oxides, were also simulated to have a low rate of stratospheric heating (<0.2 K), which have spurred additional studies to test their applicability.142,143,178,184 Another mineral SAI candidate, TiO2, has previously been proposed due to its high refractive index (i.e. an efficient light scatterer) compared to sulfate (2.5 vs. 1.55 at 0.55 μm),141 requiring 40% less stratospheric aerosol burden for the same cooling. Nevertheless, despite its strong scattering ability, TiO2 was modelled to heat the lower stratosphere with a rate five times larger than sulfate87,161 due to its efficient absorption of solar UV radiation.
In addition to mineral oxide aerosols, BC, predominantly emitted from fossil fuels transportation or biomass burning, was also previously suggested, since only less than 2% of the mass of sulfur would be required to achieve the same cooling as sulfate.18 BC is often considered the strongest absorber among all atmospheric aerosols, with an estimated total climate forcing of +1.1 W m−2, only second after CO2.185 By reducing the amount of incoming solar radiation reaching the surface, BC is capable of cooling the global mean temperature. However, due to its dominant ability to absorb SW radiation, BC's heating pattern varied latitudinally with solar radiation. A significant heating of the stratosphere, upward of +70 °C, was simulated in a scenario where enough BC was injected to maintain the global-mean temperature throughout the 2020–2100 period relative to RCP8.5.87 BC injection may also result in stratospheric O3 loss86 further making BC an undesirable material for stratosphere seeding.
SAI aerosols could cause public health issues once they sediment out of the atmosphere. However, Eastham et al. (2018) estimated that aerosol sedimentation contributed less to SAI-driven annual mortality rate than other SAI impacts, such as reduction in precipitation and global mean temperature.111 The presence of stratospheric aerosol layer increases diffuse radiation that potentially leads to sky whitening186 and enhanced canopy photosynthesis187 among other effects. Thus, estimating the LW RF caused by SWV increase, as well as the SW diffusive flux, are important benchmarks for evaluating the efficacy of different aerosols as potential SAI candidates. Dykema et al. (2016) estimated that rutile and sulfate had the strongest LW RF at 0.24 and 0.18 W m−2, respectively, due to only SWV, leading to a reduction in their SAI efficacy by ∼20%.161 Rutile and sulfate also have the largest LW RF due to only aerosol. Expectedly, the SAI application of these two aerosol materials causes the most stratospheric heating at 1.9 K and 1.3 K, respectively (Table 1). On the other hand, materials that have the least impact on stratospheric temperature (diamond, Al2O3, and CaCO3) were calculated to have the lowest LW RF from SWV (<0.3 W m−2). Considering all the aerosols' radiative effects, as well as economics, CaCO3 and Al2O3 were suggested to be the most promising SAI candidates among all the studied materials in this 2016 study. Overall, our current understanding of SAI points to the inevitable heating of the stratosphere despite the variations in aerosol size, composition or change in RF as summarized in Table 1.
3 Aerosol heterogeneous chemistry ozone impacts
In this section we discuss in detail the impacts of SAI on stratospheric and tropospheric ozone levels.3.1 Stratospheric ozone
Surface chemistry taking place on the surfaces of aerosol particles in the stratosphere plays a role in stratospheric ozone depletion. Here we discuss observations of stratospheric ozone and related chemistry following volcanic eruptions, then we review relevant experimental and modelling studies of stratospheric aerosol chemistry.| ClONO2 + HCl(s) → Cl2 + HNO3(s) | (R1) |
| ClONO2 + H2O(s) → HNO3(s) + HOCl | (R2) |
| HOCl + HCl(s) → Cl2 + H2O | (R3) |
The indirect effect comes from partitioning of reactive nitrogen species (NOx), specifically the reactive uptake of N2O5, by background or volcanic aerosols (R4) to sequester NOx and therefore slow down NOx cycle.188,193,194
| N2O5 + H2O(s) → 2HNO3(s) | (R4) |
By trapping HNO3, a reactive nitrogen reservoir species (NOy), these aerosol reactions also reduce the amount of NOx available to convert photolytically active chlorine back to its reservoir species (ClONO2). The reduction of NOx species coupled with the increase in Cl radicals in the presence of stratospheric aerosols make reactive chlorine species more effective at depleting the O3 layer than reactive nitrogen species.
The main source of stratospheric chlorine has been anthropogenic chlorofluorocarbons (CFCs), with a minor contribution from volcanic eruptions.195 The concentrations of CFCs have decreased since the implementation of the Montreal Protocol leading to a reduction in stratospheric ozone loss.196 However, a recent study by Western et al. (2023) reported that the emissions of five CFCs species (CFC-112a, CFC-113a, CFC-114a, CFC-115, CFC-13) have increased by a factor of 3 between 2010 and 2020 albeit with minimal impact on ozone hole recovery for the time being.197 In addition to chlorine reservoir, surface emission of N2O, a greenhouse gas and a primary source of stratospheric NOx, has accelerated over the last two decades, 43% of which was driven by anthropogenic sources.110,198,199 With the continuous growth of N2O budget in the atmosphere, NOx cycle may impact stratospheric ozone loss more dominantly in the next few decades.
Observations following Mt. Pinatubo's 1991 eruption determined that volcanic HCl did not add significantly to the stratospheric chlorine burden.200,201 Tabazadeh and Turco et al. (1993) also showed in a modeling study that injected HCl was quickly removed in condensed supercooled water droplets.202 However, recent studies203–206 have suggested that explosive volcanic eruptions were capable of injecting significant quantities of halogens into the lower stratosphere (e.g., HCl and HF from Hekla's 2000 eruption in Iceland207,208). Based on previous volcanic halogen observations, Brenna et al. (2019) modelled that an injection of ∼3 Mt. chlorine and 9.5 Kt. bromine at 14 °N and 30 hPa would lead to a 20% reduction in global mean ozone column within the first 18 months of a 12 year period.206 Numerous studies in the 1990s79,209,210 determined that heterogeneous chemical reactions on the surfaces of aerosols, including both background and volcanically-derived sulfate aerosols, contributed more than 50% of the total O3 loss averaged globally between 69 °S and 69 °N.204 The importance of heterogeneous reactions on aerosols was first realized from the observations of polar O3 depletion on PSCs in both the Arctic and Antarctic lower stratosphere.188,211 In the presence of significant stratospheric aerosol loading following major eruptions, further reductions of the O3 column are expected.212,213 For example, after the eruption of Mt. Pinatubo, there was a significant loss of global O3 well into 1993 with the global O3 column mean dropping approximately 6% (∼18 Dobson Unit (DU)) by April of that year.68 The bulk of the O3 column loss was observed in the tropics below 28 km (ref. 214 and 215) and was as large as 20% near 24–25 km.67,216 Aside from Mt. Pinatubo, Cerro Hudson at 46 °S also erupted in August 1991, leading to an almost 50% O3 loss between 11 and 13 km over 30 days.217 The downward trend of O3 mixing ratio was driven largely by the significant increase in the available stratospheric aerosol surface area for heterogeneous reactions. The Pinatubo eruption caused the average mid-latitude stratospheric aerosol surface area to jump by a factor of 20 by 1992, from about 1.0 μm2 cm−3 to 20 μm2 cm−3,193 as illustrated in Fig. 6. The peak aerosol surface area was as high as 35 μm2 cm−3 by the end of 1991.218 As a result, the ratio of ClO/Cly increased by a factor of 3 (Fig. 6), consistent with the aforementioned (R1)–(R3). On the other hand, the NOx/NOy ratio was reduced, as expected due to the heterogeneous hydrolysis of N2O5 on stratospheric aerosol surfaces (R4) as well as the trapping of HNO3via(R1) and (R2).219 This column reduction in NOx, in particular NO2, reached as high as 40% at northern mid-latitudes by October 1991.220 By April 1992, a similar decrease in NO2 column was also observed in southern mid-latitudes221 as measured in SAGE II. Similarly, El Chichón's major eruption in 1982 also led to a ∼50% drop in NO2 column and most likely contributed to the substantial loss of stratospheric O3 between 1982 and 1983.79,222 As NO2 was reduced substantially, HNO3 was observed to increase up to 50% (ref. 223) and 30%,224 respectively, between 1991 and early 1993 at both northern and southern mid-latitudes.
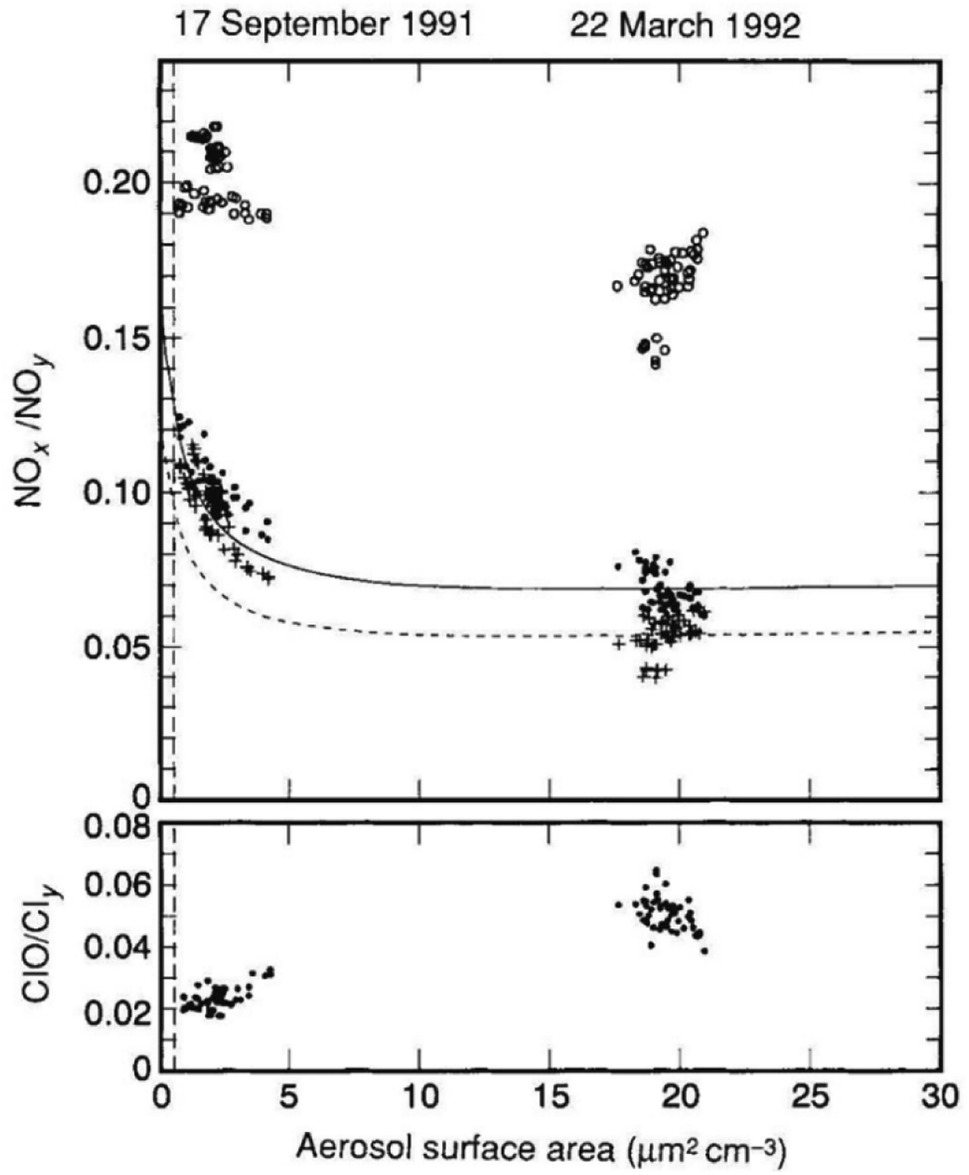 | ||
| Fig. 6 Measurements of ratios of NOx/NOy and ClO/Cly (open circles) versus the stratospheric aerosol surface area (solid circles) from the NASA Airborne Arctic Stratospheric Expedition II (AASE II) following Mt. Pinatubo's eruption in June 1991. Simulations of aerosol heterogeneous chemistry via(R4) are also represented with crosses. Reprinted with permission of the publisher from Fahey et al., Nature, 1993, 363, 509–514. | ||
Despite the general reduction in NO2 column in both hemispheres after Mt. Pinatubo's eruption, there was a spatial and temporal disparity in the global O3 loss as measured by TOMS (Fig. 7). In particular, the stratospheric O3 depletion was mostly concentrated in the NH while there was an observed increase in the O3 column up to ∼10% at the southern middle to high latitudes till the end of 1992.225–227 Aquila et al. (2013) determined that the positive O3 anomaly in the SH was induced by the enhanced extratropical downwelling, a direct result of stratospheric heating,90–92 coupled with the downward direction of the BDC at the time of the eruption. This increase in the southern O3 concentration counteracted the O3 depletion due to sulfate aerosol heterogeneous chemistry resulting in an overall increase in the O3 column mean in the SH.93 The discrepancy between the observed spatial distribution of NO2 and O3 columns was most likely because of the shorter timescale of NOx chemical perturbation compared to that of O3 depletion.
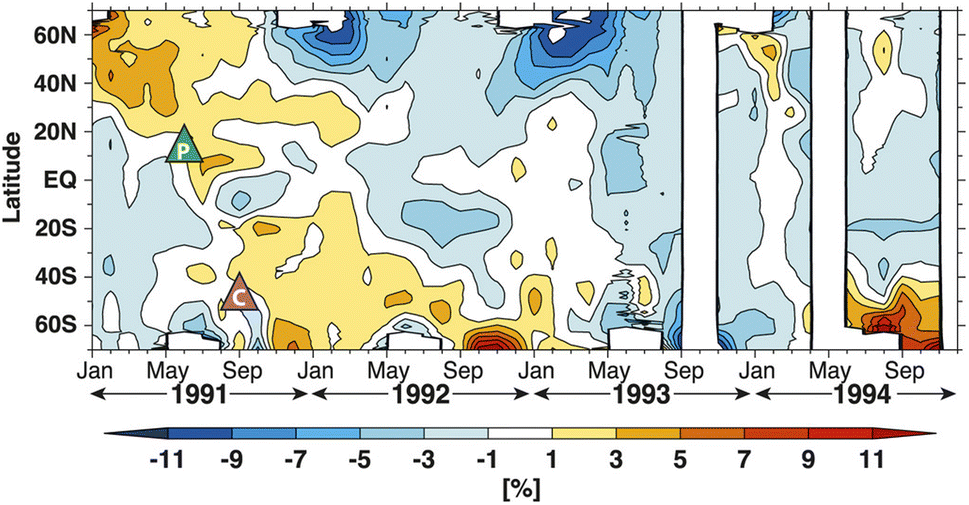 | ||
| Fig. 7 Zonal mean ozone column change (%) compared to the 1979–1990 baseline from TOMS observation. The green and purple triangles marked the locations of the volcanic eruptions of Mt. Pinatubo (June 1991) and Cerro Hudson (August 1991), respectively. © American Meteorological Society. Used with permission from V. Aquila, L. D. Oman, R. Stolarski, A. R. Douglass and P. A. Newman, Journal of the Atmospheric Sciences, 2013, 70, 894–900. | ||
| Aerosol | Sample type | Gas-phase species | RHa (%) | Temp. (K) [pressure]b | Gas concentration (molecule cm−3) | Initial uptake coefficient (γo) | Experimental techniquec | Ref. | Pub. year |
|---|---|---|---|---|---|---|---|---|---|
| a Dry condition is denoted as RH (%) < 5 if not specified by the studies. If the sample was generated from aqueous slurry and then dried under vacuum, RH (%) < 5*. b Pressure is only specified for studies not conducted at ambient pressure. c A full list of experimental techniques are included at the end of the paper. d See the referenced papers for the full range of studied RH. e Heated and unheated powders that was previously mixed with ethanol. f Steady-state uptake coefficient. g CaCO3 layers were exposed to HCl first for 8 h at room temperature before being exposed to ClONO2. h The true uncertainty of the uptake coefficient values may be a factor of two to four due to particle shape assumption. | |||||||||
| α-Al2O3 | Particle | ClONO2 | <5 | 195–230 | (1–10) × 10−7 Torr | 0.02 | AFT-EIMS | 235 | 1997 |
| HCl | [1.0 Torr] | (1–10) × 10−6 Torr | |||||||
| Al2O3 | Powder | HNO3 | <5 | 298 | 6.5 × 10¹⁰ to 1.3 × 10¹² | 0.13 ± 0.033 | Knudsen-MS | 247 | 2001 |
| α-Al2O3 | Powder | HNO3 | <5* | 298, 295 | n/a | (9.7 ± 0.5) × 10−5 | Knudsen-MS | 255 and 256 | 2001 |
| α-Al2O3 | Powder | HNO3 | <5 | 296 | 1014 | (4 ± 1) × 10−8 | FTIR | 257 | 2001 |
| γ-Al2O3 | Powder | HNO3 | <5* | 298 | 1 × 10¹¹ to 2 × 10¹³ | 0.13 ± 0.02 | Knudsen-MS/DRIFTS | 258 | 2004 |
| TiO2 | Aerosol | N2O5 | 5 ± 1 | 296 ± 2 | (1–5) × 1013 | (1.2 ± 0.2) × 10−3 | AFT-CLD | 259 | 2014 |
| 23 ± 2 | (0.7 ± 0.1) × 10−3 | ||||||||
| 45 ± 3 | (1.5 ± 0.3) × 10−3 | ||||||||
| 60 ± 3 | (3.0 ± 1.4) × 10−3 | ||||||||
| TiO2 | Aerosol | ClONO2 | 7 ± 1 | 296 ± 2 | 1.7 × 10¹³ | 1.2 × 10⁻³ | AFT-CLD | 260 | 2016 |
| 33 ± 3 | |||||||||
| TiO2 | Aerosol | HO2 | 11 ± 1 | 293 ± 3 | 1.6 × 10⁹ | (2.1 ± 0.1) × 10−2 | AFT-FAGE | 261 | 2018 |
| 30 ± 1 | (2.5 ± 0.2) × 10−2 | ||||||||
| 45 ± 1 | (2.9 ± 0.5) × 10−2 | ||||||||
| 66 ± 1 | (3.6 ± 0.7) × 10−2 | ||||||||
| CaCO3 | Powder | HNO3 | <5 | 298 | 1010 to 1013 | 0.071 | Knudsen-MS | 244 | 1995 |
| CaCO3 | Pellet | HNO3 | <5 | 298 | 1010 to 1013 | 0.06 | Knudsen-MS | 244 | 1995 |
| >5 | 0.15 ± 0.03 | ||||||||
| CaCO3 | Powder | HNO3 | <5 | 298 | 1 × 10¹¹ | 1.4 × 10⁻⁵ | Knudsen-MS | 245 | 2000 |
| CaCO3 | Powder | HNO3 | <5* | 295 | 1 × 10¹² | (2.5 ± 0.1) × 10−4 | Knudsen-MS DRIFTS | 246 | 2000 |
| CaCO3 | Powder | HNO3 | <5* | 298 | 6.5 × 10¹⁰ to 1.3 × 10¹² | 0.10 ± 0.025 | Knudsen-MS | 247 | 2001 |
| 0.18 ± 0.045 | |||||||||
| CaCO3 | Powder | HNO3 | <5 | 296 | 6.5 × 10¹⁰ | (2 ± 1) × 10−3 | Knudsen-MS | 248 | 2005 |
| CaCO3 | Aerosol | HNO3 | 33 | 296 | 1012 | 0.11 | AFTb-denuder | 249 | 2006 |
| CaCO3 | Powder | HNO3 | <5 | 300 ± 1 | (3–7) × 1011 | 0.3 | Knudsen-MS | 250 | 2006 |
| CaCO3 | Particle | HNO3 | 40 | 298 | ∼(2–6) × 1011 | 0.06 | PS-SFR SEM/EDX | 262 | 2008 |
| 80 | 0.21 | ||||||||
| CaCO3 | Particle | HNO3 | <5 | 298 ± 1 | 5.2 × 10¹⁰ to 7.8 × 10¹³ | 0.013 ≤ γo ≤ 0.14 | Particle-FTIR | 184 | 2020 |
| CaCO3 | Layer | HNO3 | <5* | 215 ± 2 | n/a | (2.5 ± 1.8) × 10−4 | Coated-wall FT-CIMS | 177 | 2020 |
| [1.7 Torr] | |||||||||
| CaCO3 | Powder | HCl | <5 | 300 ± 1 | 6 × 10¹¹ | 0.13 | Knudsen-MS | 250 | 2006 |
| CaCO3 | Particle | HCl | <5 | 298 ± 1 | 7.0 × 10¹¹ to 1.6 × 10¹⁴ | 0.0011 ≤ γo ≤ 0.012 | Particle-FTIR | 184 | 2020 |
| CaCO3 | Aerosol | HCl | <5 | 298 ± 1 | 5.4 × 10¹² | 0.013 ± 0.001 | AFT-CIMS | 184 | 2020 |
| CaCO3 | Layer | HCl | <5* | 215 ± 2 | 7.2 × 10¹¹ | (7.2 ± 5) × 10−5 | Coated-wall FT-CIMS | 178 | 2020 |
| [1.7 Torr] | |||||||||
| CaCO3 | Layer | HCl | <5 | 200 ± 2 | 5.4 × 10¹⁴ to 3.6 × 10¹⁷ | (3.0 ± 0.6) × 10−12 to (3.3 ± 0.6) × 10−7 | Flask-CIMS | 178 | 2020 |
| CaCO3 | Layer | HCl | <5* | 298 | n/a | (9.8 ± 9) × 10−5 | Coated-wall FT-CIMS | 178 | 2020 |
| ClONO2 | 215 ± 2 | ||||||||
| [1.7 Torr] | |||||||||
| CaCO3 | Aerosol | HCl | <5 | 207 ± 3 | 3.6 × 10¹² | 0.076 ± 0.009 | AFT-CIMS | 263 | 2021 |
| CaCO3 | Powder | N2O5 | <5* | 298 ± 2 | (4.0 ± 1.0) × 1011 | 0.12 ± 0.04 | Knudsen-MS | 251 | 2006 |
| 0.021 ± 0.006 | |||||||||
| CaCO3 | Aerosol | N2O5 | <1 | 290 | 2.5 × 10¹⁵ | (1.9 ± 0.2) × 10−4 | Chamber-FTIR | 252 | 2006 |
| CaCO3 | Powder | N2O5 | 0* | 296 ± 2 | 3 × 10⁹ to 2 × 10¹⁰ | 0.026 ± 0.008 | Knudsen-MS | 253 | 2008 |
| 0.05 ± 0.02 | |||||||||
| CaCO3 | Aerosol | N2O5 | 0* | 296 ± 2 | (1–40) × 1012 | (4.8 ± 0.7) × 10−3 | AFT-CLD | 254 | 2009 |
| 29 ± 2 | (5.3 ± 1.0) × 10−3 | ||||||||
| 58 ± 3 | (11.3 ± 1.6) × 10−3 | ||||||||
| 71 ± 4 | (19.4 ± 2.2) × 10−3 | ||||||||
As a common catalysis material and one of the main components of space shuttle solid-fueled rocket motors exhaust,228 Al2O3 heterogeneous chemistry has been studied in the past for its potential stratospheric impact. There is also abundant industrial experience in producing Al2O3 nanoparticles229,230 that would provide great groundwork if Al2O3 aerosols were to be used for SAI deployment. However, besides the potential of Al2O3's absorption of outgoing terrestrial LW radiation and thus warming the stratosphere,231 Al2O3 was predicted to cause substantial damage to stratospheric O3 (ref. 232–234) upon release in the atmosphere. Specifically, Molina et al. (1997) determined experimentally that (R1) occurred more efficiently on Al2O3 particles with an uptake coefficient (γ) of 0.02 than on background sulfate aerosols (γ < 0.0001) under similar conditions.235 This would most likely increase chlorine activation that leads to additional stratospheric O3 depletion.
Besides Al2O3 aerosols, other components of mineral dust particles,236,237 including TiO2, have also been investigated in terms of their heterogeneous chemistry impact on stratospheric O3 as listed in Table 2. Since TiO2 is a well-known efficient photocatalyst that could, for example, convert NOx species to HNO3, its heterogeneous reaction with NO2 has been studied extensively to remove NOx from the troposphere.238–241 However, very little data exist for TiO2 aerosol chemistry with relevant stratospheric gases. Tang et al. (2014) reported the first experimental measurement of the heterogeneous reaction of airborne TiO2 particles with N2O5 gas, an important NOx reservoir species, at ambient conditions over a range of relevant relative humidities (RH) for the lower stratosphere (RH < 40%).242
CaCO3, one of the most reactive constituents of mineral dust,237 was also proposed and studied as a SAI alternative to sulfate aerosols.140,142,143,161 Yet there is a lack of reliable kinetics data for CaCO3 aerosol heterogeneous chemistry in the lower stratosphere, the intended region of SAI application.142 Therefore, it is essential to experimentally measure the uptake coefficients of relevant gases on CaCO3 aerosol surface under stratospheric conditions.243 Up until recently, there have been numerous studies on the heterogeneous reactions between CaCO3 and NOx reservoir species, such as HNO3 (ref. 184 and 244–250) and N2O5,251–254 at ambient conditions in the context of urban pollution. However, due to variations in experimental techniques and conditions, the uptake coefficients of HNO3 and N2O5 on the surface of CaCO3 particles vary over a few orders of magnitude, 10−5 < γHNO3 < 0.3 and 10−4 < γN2O5 < 0.1, respectively (Table 2). Besides, only a few of those studies experimented with airborne CaCO3 particles,249,252,254 a technique that reduces experimental diffusion limitations and is a better representation of aerosols used in the case of SAI application than, e.g., studying particles deposited on a surface. In addition, there are just two room temperature studies on the uptake of HCl, a ClOx reservoir species, on CaCO3 particles, where only Huynh and McNeill (2020) explored the reaction of CaCO3 aerosols using an aerosol flow tube (AFT) coupled with a quadrupole chemical ionization mass spectrometer (CIMS).184 Building upon the understanding of CaCO3 heterogeneous chemistry at ambient conditions, two experimental studies were recently conducted at stratospheric temperature to further explore the gas uptake on CaCO3 particles. Dai et al. (2020) performed experiments on a range of reactions at 200 K and 1.6 Torr with a coated-wall flow tube coupled with a CIMS. The authors determined both the HNO3 and HCl uptake coefficient values on the surface of CaCO3 layers to be very small, ∼10−5 < γo < 10−4 for initial uptake coefficients (γo) and ∼10−12 < γss < 10−7 for steady-state uptake coefficients (γss).178 Huynh and McNeill (2021) derived the initial uptake of HCl on the surface of airborne CaCO3 aerosols at 207 K and ambient pressure to be γo ∼0.076,263 at least three orders of magnitude higher. Again, the difference in experimental techniques may have contributed to the disparity in γo values. The measured gas uptake in Dai et al. (2020) may also have been inhibited by the diffusion limitations associated with a coated-wall AFT or by a residual organic coating on CaCO3.237,264 By using the same aerosol generation process and experimental method (AFT-CIMS) between their ambient and stratospheric studies, Huynh and McNeill (2021) also determined that the heterogeneous reaction between CaCO3 aerosols and HCl gas proceeds more efficiently under stratospheric conditions.
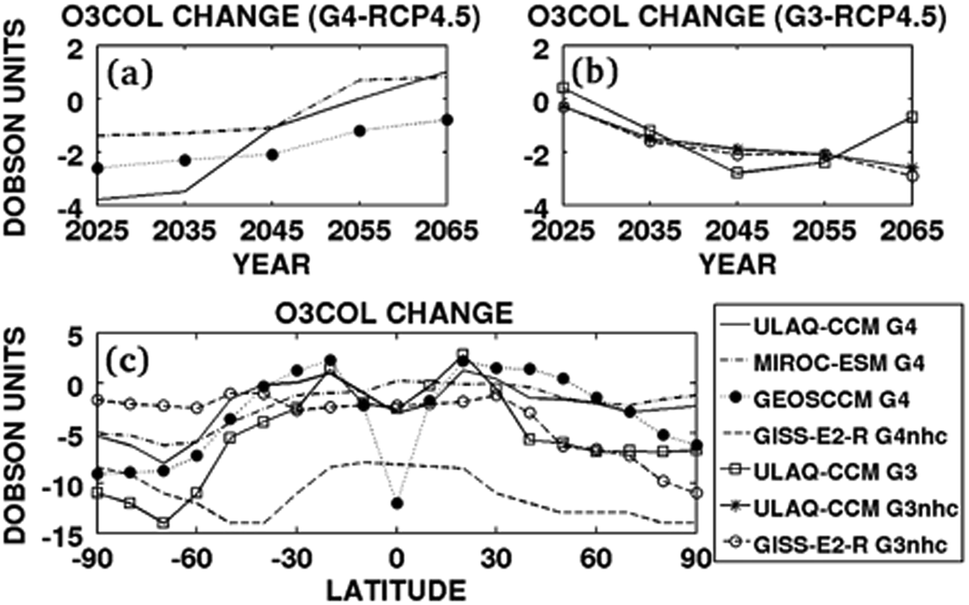 | ||
| Fig. 8 Modeling simulations of global O3 column changes in (a) G4 and (b) G3 with respect to the base case RCP4.5 over time. (c) Zonally and time-averaged column ozone changes (2040–2049). Reprinted with permission of the publisher from Pitari et al., J. Geophys. Res., 2014, 119, 2629–2653. | ||
Al2O3 particles, a potential alternative to sulfate, had their impact on global O3 levels explored by Weisenstein and co-authors (2015) via a 2-D chemistry-transport-aerosol model.142 As seen in Fig. 9, for the range of tested Al2O3 particle sizes, between 80 nm and 240 nm in radius, coated or uncoated with existing aqueous sulfate in the stratosphere, there was significant O3 depletion at middle and high latitudes in both hemispheres (∼6–10%), albeit less than that caused by sulfate. The modelled O3 loss scales inversely with the Al2O3 particle size, with 240 nm Al2O3 particles causing the least damage to the O3 level compared to all tested aerosol materials, confirming that aerosol size is an important factor in designing SAI aerosol. Although the application of Al2O3 aerosols in SAI should be investigated more in depth in a 3-D transport model, this 2015 study suggests that Al2O3 particles of a suitable size may be able to limit damages to stratospheric O3 compared to sulfate. The study also modelled the use of diamond particles, but, in addition to economic considerations, heterogeneous reactions on diamond have not been studied.
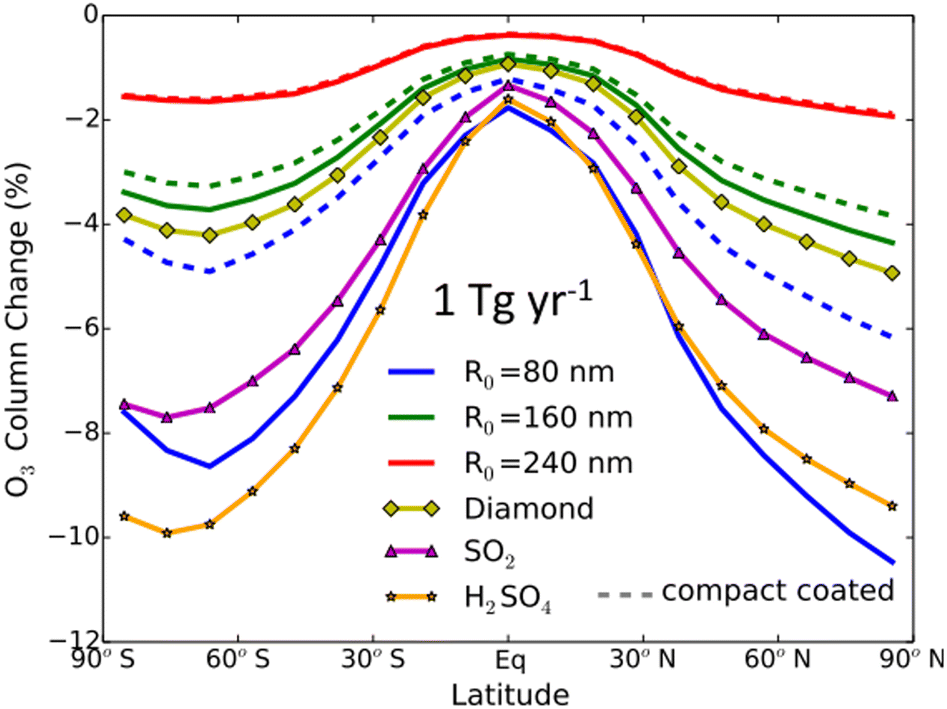 | ||
| Fig. 9 Average O3 column change per year as a function of latitudes with an annual injection rate of 1 Tg of Al2O3 monomers of 80 nm (blue), 160 nm (green), 240 nm (red), 160 nm diamond monomers (dark yellow), SO2 (magenta), and H2SO4 (orange). Reprinted from Weisenstein et al., Atmos. Chem. Phys., 2015, 15, 11835–11859. Distributed under a Creative Commons Attribution 4.0 License (CC BY 4.0) https://creativecommons.org/licenses/by/4.0/. | ||
TiO2 particles were experimentally studied then applied by Tang et al. (2014)242 in their chemistry-climate model. The authors used a range of uptake coefficient values of N2O5 on TiO2 particles, 0.001 to 0.005, where the lower limit was derived experimentally and the upper limited was estimated based on stratospheric conditions. N2O5 stratospheric concentration was projected to reduce by 30% in the presence of stratospheric TiO2 particles compared to ∼90% in the presence of Pinatubo's level sulfate aerosols. Heterogeneous chlorine activation on TiO2 particles has not been studied experimentally and, therefore, was not included in the 2014 model. As a result, the impact of TiO2 particles on stratospheric O3 is still uncertain.
For CaCO3 particles, commonly used as a proxy for mineral dust, Keith et al. (2016) analyzed the effects of stratospheric CaCO3 injection on O3 loss by investigating the perturbations of CaCO3 heterogeneous chemistry to individual O3 catalytic cycles. For a CaCO3 injection rate of 5.6 Tg per year,143 ∼20% of the peak sulfate level post Pinatubo's eruption,75 the fraction of total O3 loss due to the NOx cycle was drastically reduced by 10% in the lower stratosphere (∼12–30 km), while that due to the other catalytic cycles, such as ClOx, HOx and BrOx, became more prominent in the same region. These cycle shifts were consistent with the aerosol heterogeneous chemistry expressed earlier via(R1)–(R4). The annual average O3 column increased by 6.4% in this CaCO3 SAI scenario despite some O3 loss in the lower stratosphere and upper troposphere, compared to the general O3 loss caused by other studied materials including Al2O3, diamond, and sulfate. However, the authors only included CaCO3 reactions with the following acidic gases: HCl, HBr, HNO3, and H2SO4, using estimated mechanisms and rate coefficients in the aerosol transport model. The other important NOx and ClOx reservoir species, N2O5 and ClONO2, respectively, whose reactions on aerosol surfaces disrupt stratospheric photochemical cycles and lead to ozone depletion (R1)–(R4), were not included in the 2016 modeling study. More importantly, there are uncertainties in that 2016 estimate of O3 stratospheric chemical processes since there was little understanding of CaCO3 aerosol chemical kinetics in the stratosphere at the time.
Following experimental studies of CaCO3 heterogeneous chemistry under stratospheric conditions as summarized in Table 2, Dai and co-authors also modelled the impact of CaCO3 heterogeneous chemistry on the O3 column as shown in Fig. 10. A wide range of global O3 column change, between −5% to +25%, was estimated based on various assumptions of trace gas uptake on CaCO3 aerosols. Applying the HCl uptake coefficient determined in Huynh and McNeill (2021), there was estimated to be about 5% reduction in the O3 column at the middle to high latitudes in the SH. Overall, additional experimental studies are needed to measure the uptake of stratospherically relevant gases on CaCO3 aerosols under realistic SAI conditions. Nevertheless, coupled with a minimal rate of stratospheric heating (<0.2 K) as discussed in Section 2, the potentially limited stratospheric O3 loss makes CaCO3 a promising alternative compared to other proposed aerosols.
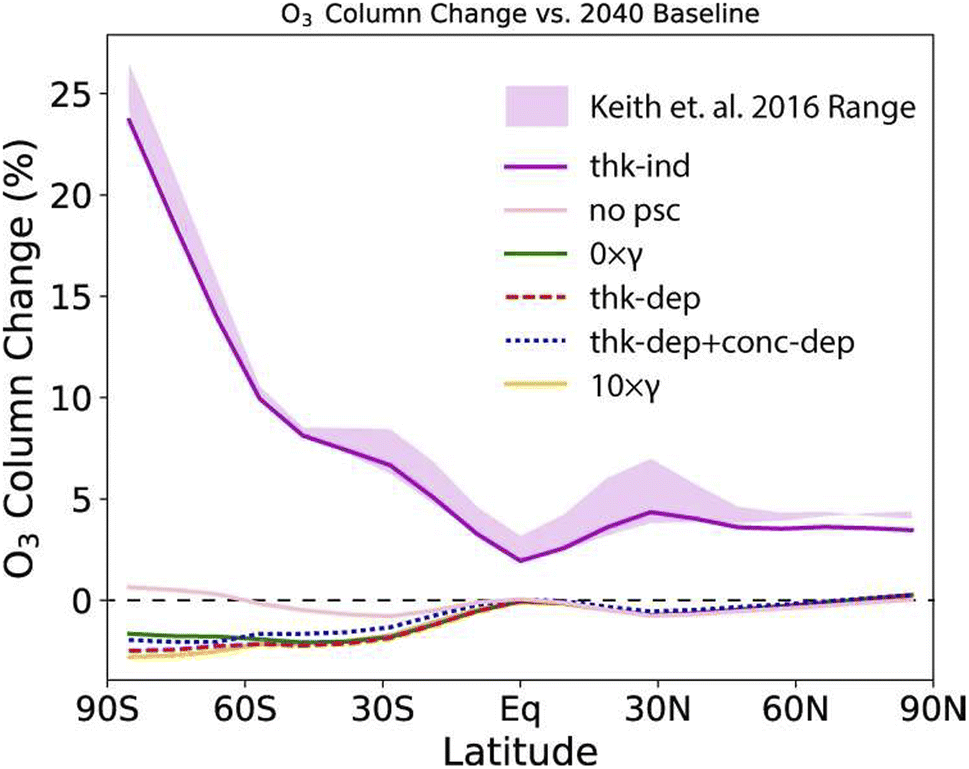 | ||
| Fig. 10 O3 column change compared to the 2040 baseline under various assumptions of CaCO3 aerosol heterogeneous chemistry measured in a coated-wall flow tube coupled with a CIMS (Table 2). The gas uptake coefficients were calculated both dependently (denoted with thik-dep) or independently (thik-ind) of CaCO3 layer thickness. Reprinted from Dai et al., Commun. Earth Environ., 2020, 1, 1–9. Distributed under a Creative Commons Attribution 4.0 International License (CC BY 4.0) https://creativecommons.org/licenses/by/4.0/. | ||
3.2 Tropospheric ozone
Tropospheric O3 level is controlled by STE, atmospheric water vapor level, and the following reaction sequence as summarized by Xia et al. (2017).| NO2 + hν (λ < 420 nm) → NO + O(3P) | (R5) |
| O(3P) + O2 + M → O3 + M | (R6) |
Tropospheric O3 production is driven by NO2 photolysis followed by a three-body reaction (R5) and (R6). NO2 production depends on the oxidation of NO by reaction with peroxy radicals in the atmosphere (e.g., (R7) and (R8)) where R represents a generic organic group such as CH3.
| HO2 + NO → NO2 + OH | (R7) |
| RO2 + NO → NO2 + RO | (R8) |
RO2 is produced via oxidation of volatile organic compounds (VOCs) with OH which is formed via O3 photolysis and the subsequent reaction with tropospheric H2O vapor (R9) and (R10).
| O3 + hν (λ < 320 nm) → O(3P) + O2 | (R9) |
| O(1D) + H2O → 2OH | (R10) |
Since the global surface temperature is cooled across all SAI scenarios, we expect tropospheric H2O vapor concentration to decrease with reduced solar radiation,128 which in turn slows down OH production as well as O3 loss via(R10) and (R9), respectively. Furthermore, since stratospheric O3 is very likely depleted as discussed previously in Section 3.1, more UV radiation could reach the troposphere and increase the rates of photochemical reactions, affecting both O3 production (R5) and O3 consumption (R9).267,268
Following Mt. Pinatubo's eruption, tropospheric O3 level was observed to decline significantly at both middle and high latitudes in 1992 and 1993.269,270 Tang et al. (2013) speculated that the tropospheric O3 decrease was largely driven by a significant reduction in the STE of O3, at a maximum of about −70 Tg per year in January 1993 (Fig. 11a).88 The decline in the global mean tropospheric O3 column peaked at 1.9 DU in November 1992 as illustrated in Fig. 11b. The change in O3 STE is driven by changes in either stratospheric O3 concentration or the strength of the BDC that is responsible for the exchange of air masses between the stratosphere and the troposphere. As seen in Fig. 11c, there is no statistically significant difference in the global downward air mass flux at 100 hPa after the volcanic eruption, further reinforcing that stratospheric O3 depletion was mainly responsible for the decrease in the O3 STE. An increase in tropospheric photochemical O3 production in 1991–1995 was estimated to compensate for ∼67% of the decrease in the O3 STE flux. As a result, O3 level was projected to go up in some tropical regions.88 This regional increase in surface level O3 is consistent with TOMS data from the period of 1979–1995.270
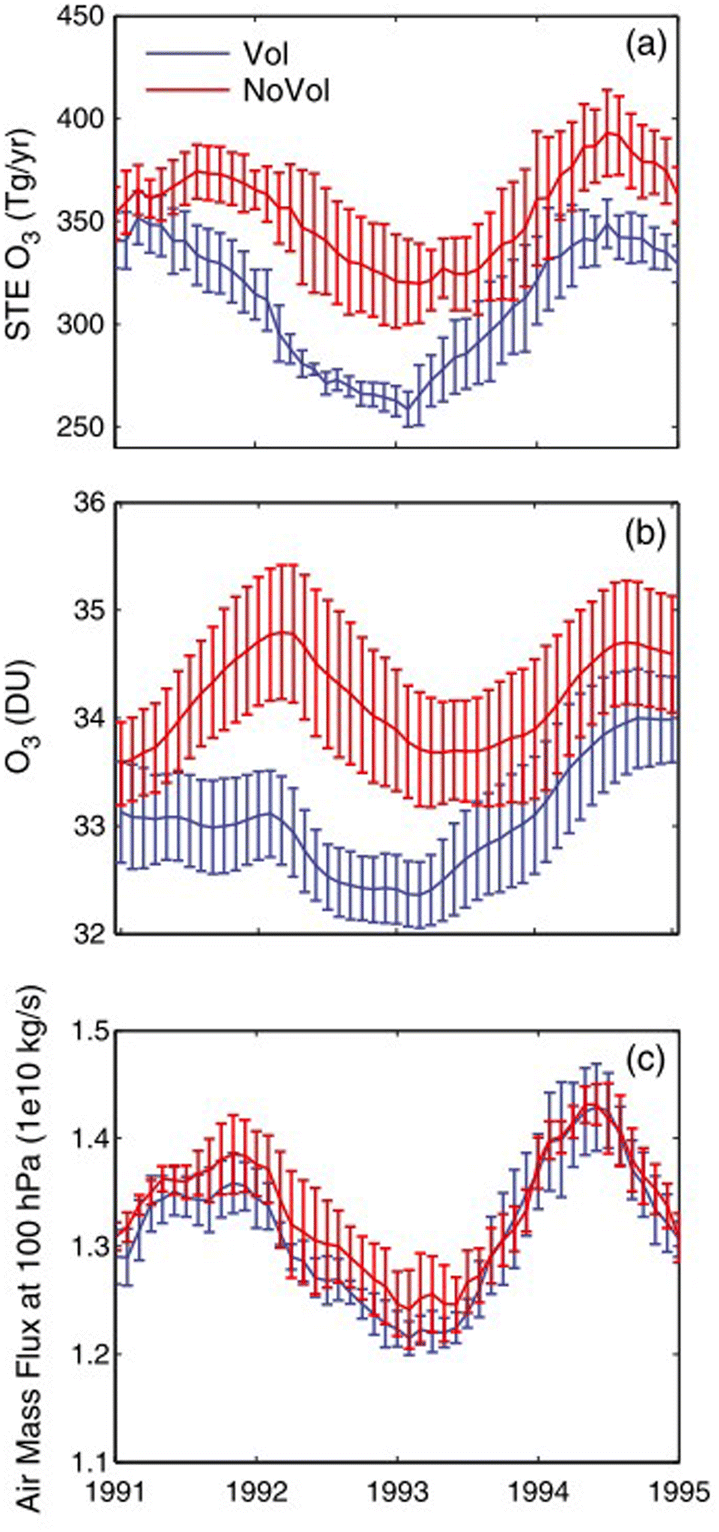 | ||
| Fig. 11 12 Month running means of global (a) STE O3 fluxes, (b) tropospheric O3 columns, and (c) downward air mass fluxes at 100 hPa for the period of 1991–1995 for both volcanic (Vol) and non-volcanic (NoVol) scenarios. Reprinted with permission of the publisher from Tang et al., Geophys. Res. Lett., 2013, 40, 5553–5558. | ||
For the SAI simulation of injecting 8 Tg per year of sulfate aerosols over a 50 year period (Table 1), Xia et al. (2017) also reported a global reduction in surface O3 level except with a regional increase in the tropics across all latitudes.89 In this study the dominant pathway was determined to be the reduction of H2O vapor in the atmosphere, accounting for ∼90% of the overall reduction in O3 loss. The reduction in tropospheric O3 loss dominated in the tropics and thus led to an increase in surface O3 level there (+1.2 ppb), while the reduced STE of O3 dominated at middle to high latitudes, resulting in surface O3 decrease (−1.6 ppb). The regional differences in surface O3 concentration are due to characteristics of SAI simulation (injection location, frequency, etc.) As an air pollutant and a GHG, both potential increases and decreases in tropospheric and surface O3 should be considered in future SAI research planning and deployments.
4 Other climate effects
4.1 Hydrological cycle
As global warming continues due to the projected increase in anthropogenic emissions of CO2 in the next few decades, atmospheric moisture content is expected to increase due to higher evaporation rate, leading to an enhancement in precipitation rates. The predicted rise in both heavier rainfalls and their frequency may increase the risk of flooding especially over the monsoonal regions.271–273 It is, therefore, important to investigate to what extent climate geoengineering proposals such as SAI would influence the hydrological cycle.156,274–276 Trenberth et al. (2007) investigated the hydrological response to previous major volcanic eruptions with a special focus on Mt. Pinatubo's eruption (June 1991). According to historical records, from October 1991 to September 1992 the land precipitation was about three standard deviations below normal, while the river discharge into the oceans was almost four standard deviations below normal.153 The record decrease in precipitation and thus freshwater sources imply a potential risk for widespread drought in SAI scenarios. In fact, Haywood et al. (2013) suggested that the volcanic eruptions in the NH contributed significantly to the Sahelian drought in the 1970–1990s.275 In 2015, Iles and Gerberl277 also detected significant regional differences in the streamflow volume of large rivers globally following explosive eruptions, prompting additional research on the regional hydrological responses to SAI. In a 2019 study, Simpson and co-authors180 explored the hydroclimate responses for different regions across the globe by simulating sulfate SAI under the most severe forcing scenario, RCP8.5 (Table 1). Fig. 12 below from their study illustrates the projected precipitation changes from offsetting the increase in global mean surface temperature over many 20 year periods starting in 2020 until 2095.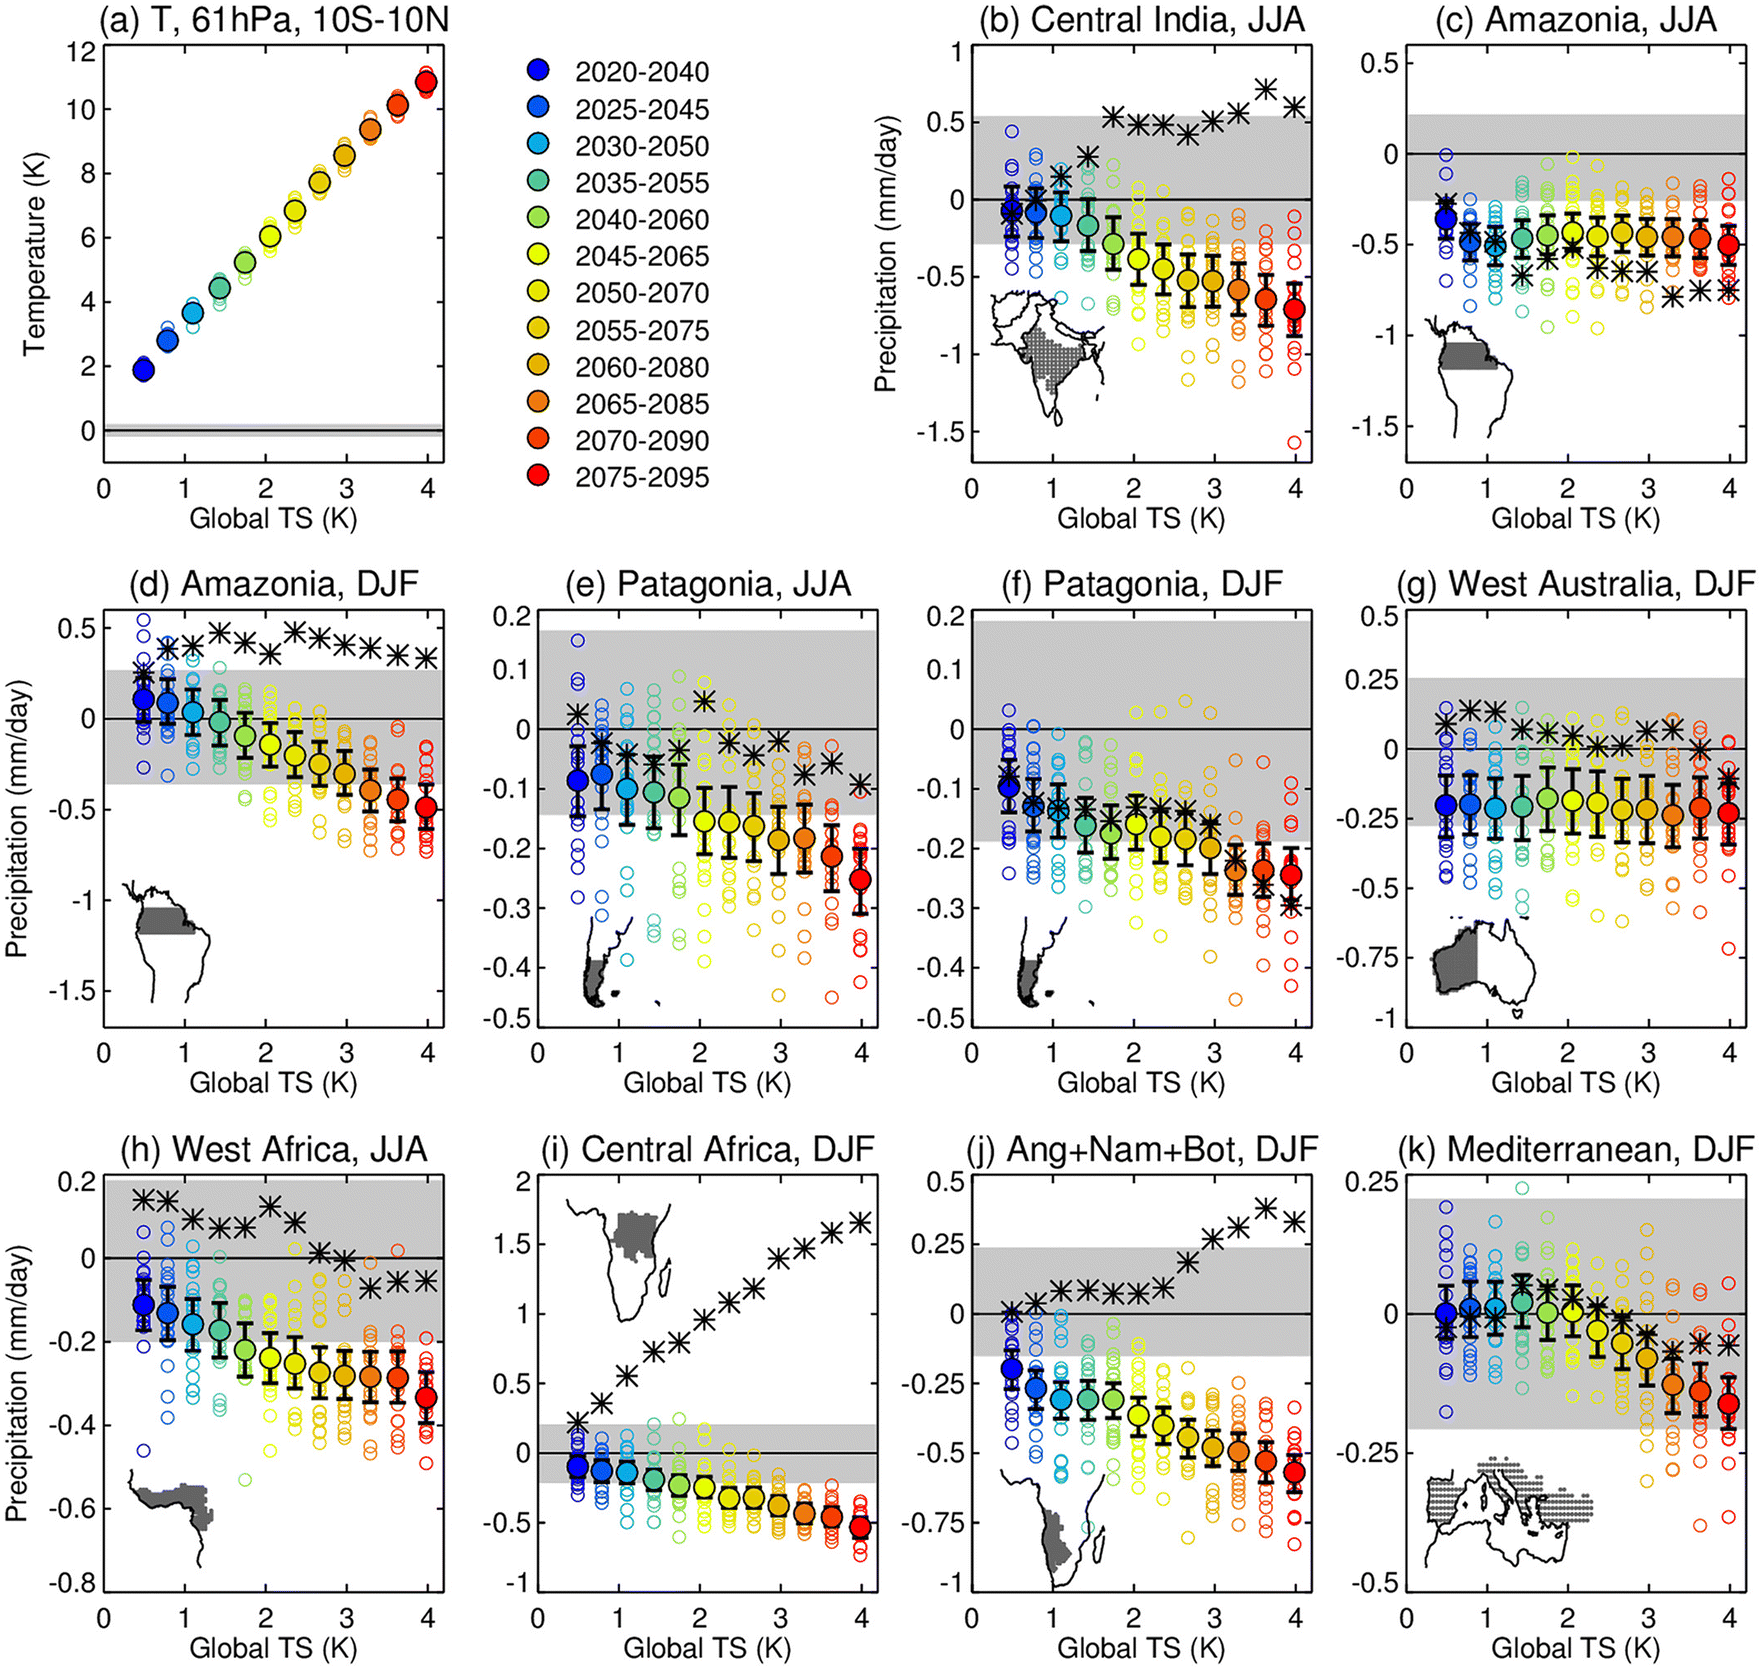 | ||
| Fig. 12 (a) Zonal mean stratospheric temperature at 61 hPa. (b)–(k) Precipitation anomalies as a function of globally averaged temperature anomalies (RCP8.5-BASE), where RCP8.5 represents years 2075–2095 of a three-member ensemble run from 2010 to 2099 under RCP8.5 forcings and BASE are 2010–2030 simulations under RCP8.5 forcings. The illustrated regions were all modelled to sustain significant drying. Reprinted with permission of the publisher from Simpson et al., J. Geophys. Res. Atmos., 2019, 124, 12587–12616. | ||
As illustrated in Fig. 12, there seems to be a linear correlation between the negative precipitation change and the globally averaged temperature anomalies278 for most regions. Since the study assumes that SAI is required to offset more global warming over time, the modelled areas are projected to get drier with a steeper reduction in precipitation. However, there are exceptions in the following regions: Amazonia in the summer (JJA) (Fig. 13c), West Australia and Mediterranean in the winter (DJF) (Fig. 12g and k). The reason for these exceptions is currently unclear. The study also observed that stratospheric heating in the tropics, which was caused by the significant loading of stratospheric sulfate aerosols as discussed previously in Section 2, reduced precipitation in regions of climatologically high precipitation, including monsoonal regions such as central India. Despite uncertainties (e.g., precipitation biases) in the 2019 model, the projected trend of reduced precipitation over most of the globe from the application of SAI is consistent with historical observations after volcanic eruptions. Besides stratospheric warming, there are also additional mechanisms that could be responsible for changes in the hydrological cycle, including the aerosol–cloud interactions as covered in Section 2. Overall, depending on the SAI scenarios, changes to both global and regional hydrological cycles could vary and, therefore, this is an active research area of SAI modeling studies.270
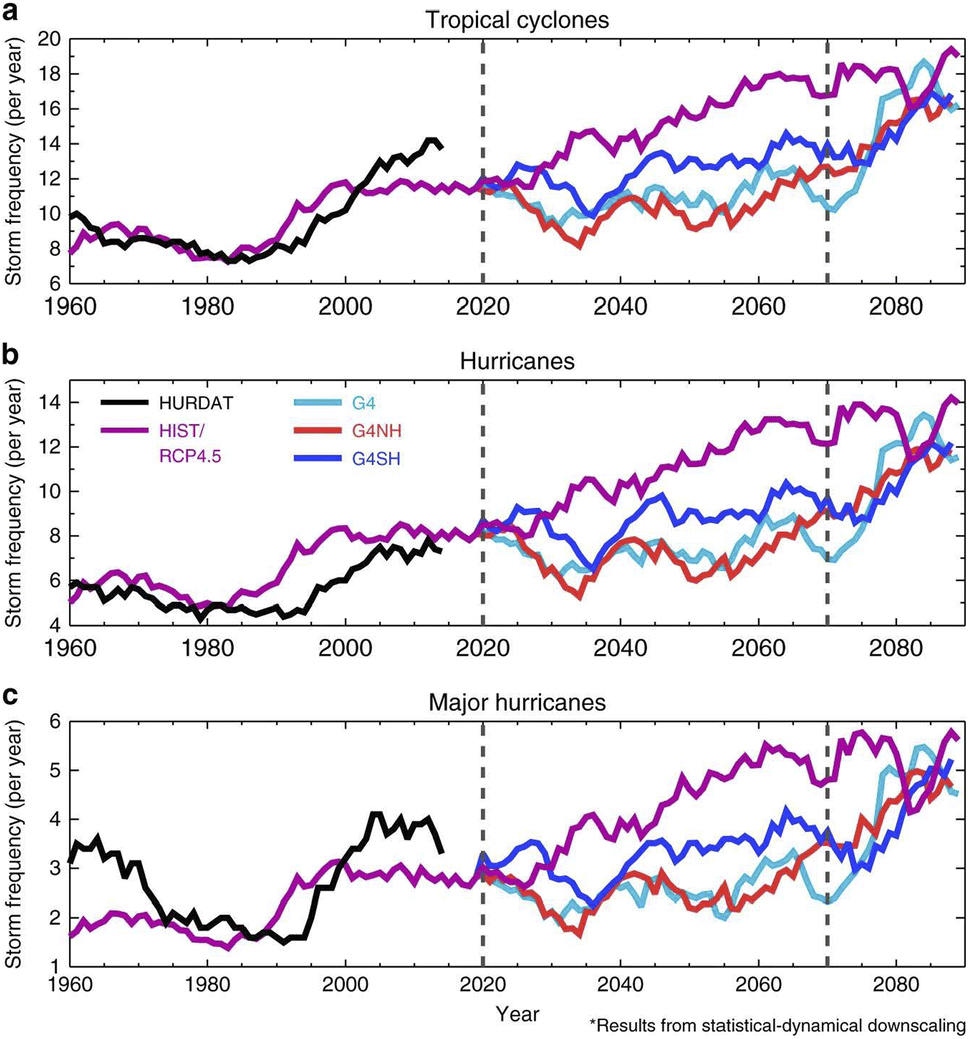 | ||
| Fig. 13 Storm frequencies were modelled with a statistical dynamical downscaling method. (a) North Atlantic tropical cyclones (max windspeed > 20 m s−1), (b) hurricanes (max windspeed > 37 m s−1), and (c) major hurricanes (max windspeed > 96 m s−1) were simulated for both the SAI 2020–2070 period and the period after SAI was stopped abruptly (2070–2090). HURDAT is the historical observations of storm tracking for 1960–2014, while RCP4.5 represents the base case scenario. G4 is a global SAI scenario, whereas G4NH and G4SH are hemisphere-specific SAI scenarios. More simulation details and results are included in Table 1. Reprinted from Jones et al., Nat. Commun., 2017, 8, 1–10. Distributed under a Creative Commons Attribution 4.0 International License (CC BY 4.0) https://creativecommons.org/licenses/by/4.0/. | ||
4.2 Tropical cyclones
In addition to the hydrological cycles, other climate effects of SAI application have been explored, notably how it would affect extreme weather events such as tropical cyclones (TC) and hurricanes.176,279,280 Irvine et al. (2019) determined that the global warming caused by a two-fold increase of CO2 over a 130 year period would be halved, if the solar constant is reduced by 1% by SAI over the same period.280 Not accounting for stratospheric aerosol chemistry, Irvine et al. simulated that SAI in this case offset most of the increase in TC intensity with <0.4% of land surface experiencing climate risks such as extreme precipitation. Other modeling studies have determined that volcanic eruptions could shift the Intertropical convergence zone (ITCZ) which, coupled with the change in surface temperature, affects TC activity.176,279,281 Applying that hypothesis to SAI applications, Moore et al. (2015)279 estimated that for both G3 and G4 scenarios of GeoMIP182 stratospheric sulfate aerosol loading ameliorated the intensity and frequency of Atlantic hurricanes as well as reduced coastal floor risk during the SAI simulated period (Table 1). Nevertheless, there was no clear evidence that SAI would be able to mitigate the predicted increase in storm surge events as severe as Hurricane Katrina (2005) under RCP4.5 scenario. Similarly, Jones et al. (2017)176 also estimated how SAI would affect North Atlantic TC frequency and intensity compared to the same base case (RCP4.5) with a general circulation model (GCM). In addition to simulating a relatively uniform global distribution of stratospheric sulfate aerosols (G4), the 2017 paper also studied the impacts on TCs of regional SAI applications, specifically in the NH (G4NH) and in the SH (G4SH) (Table 1) using three different approaches. First, by training the model with historical TC observations, the model predicted a significant reduction in the North Atlantic storm frequency (TCs per year) for G4NH scenario, consistent with observations of attenuated TC activity after the eruptions of Mt. Pinatubo and El Chíchon.282,283 On the other hand, G4SH was predicted to increase the storm frequency by more than 50% over the 50 year SAI period. G4 was also modelled to increase the numbers of TCs per year but not significantly (<20%). The model also yielded relatively similar predictions when simulated with meteorological parameters known to affect TC activity, including wind shear over the main storm development region, precipitation, and relative sea surface temperature.284–286 Lastly, by employing a downscaling model the authors investigated not only the frequency but also the intensity of different storm categories (TC, hurricanes, and major hurricanes) as illustrated in Fig. 13.This statistical-dynamical downscaling algorithm predicted an increasing trend for TC activity for the base case scenario, RCP4.5, compared to the stable trend from the previous two approaches. The disparity between a downscaling simulation and the previous two GCM simulations have also been observed in other studies, and origin of the discrepancy remains unclear.287–289 The third simulation also projected that all SAI scenarios lowered the storm frequency during the entire SAI period, with G4 and G4NH having the strongest reduction capability (up to 50%). Despite the varying results across three simulations during the SAI implementation period, immediately after SAI was abruptly stopped the numbers of TCs were all modelled to return to the base case level over a 20 year period. Despite the positive predictions of both the 2015 and 2017 models on SAI's ability to reduce the frequency and intensity of TCs, they both focused on the Northern Atlantic region only. A recent study by Pausata and Camargo (2019)281 suggested that volcanic eruptions do not reduce TC activity but rather redistribute the TCs globally, prompting similar research before we could ascertain SAI true impact on such extreme weather events. Additionally, future studies should consider the likely difference between regional and global SAI applications on other extreme weather events (e.g., heat waves).
4.3 Biodiversity
As a general threat to biodiversity, global warming has been determined to elevate sea surface temperatures, that in turn has caused widespread coral bleaching.290–292 In addition, the rapid rise in global CO2 levels has led to an unprecedented rate of ocean acidification, further destroying the coral communities via calcification.293,294 Besides coral reefs, other marine and terrestrial biodiversity are also at risk of extinction since they are estimated to not be able to adapt to the rapid rate of climate change.295,296 Trisos et al. (2018)297 explored the impacts of SAI implementation on a variety of global biodiversity hotspots by modeling their climate velocities, specifically the rate of change in precipitation and temperature in km per year (Fig. 14). Defined as the rates and directions that isotherms shift over time, the velocity of climate change has been demonstrated to be a good predictor of the geographical shifts of both marine and terrestrial species.298–302 As illustrated in Fig. 14, Trisos and co-authors simulated the temperature velocities for different climate scenarios, including the global SAI scenario GeoMIP G4 over a 50 year geoengineering period, 2020–2069, and its 10 year sudden termination period starting in 2070. Fig. 14a highlights that most of the world's biodiversity hotspots are in the tropics, a region that has been predicted to suffer significant climate change effects such as increasing intensity of the hydrological cycle.156,271,272,274 During G4 implementation, terrestrial species were modelled to sustain decreasing precipitation (Fig. 14b) and almost stable temperature across all studied categories (amphibians, birds, mammals, and reptiles) as shown in Fig. 14d. The reduction in climate velocities for land species once climate geoengineering is implemented compared to the base case RCP4.5 signifies a mitigation to the warming-induced habitat migration. The first decade of implementing G4 has an even stronger effect on tropical marine species (corals, fish, and mangroves) with considerable negative temperature velocities (Fig. 14c). However, during the next 40 year G4 continuation period, the climate velocities for all species return to the same levels as those of RCP4.5, implying that G4 only provides a short-term relief to the climate change effects on the biodiversity hotspots. Once G4 is terminated in 2070, the marine and terrestrial species over the next decade were predicted to experience extreme temperature velocities that are 2–4 times higher than both historical trends and RCP4.5 scenario. Especially poorly dispersing species, such as corals and amphibians, were modelled to be at an increased risk of extinction in the scenario of SAI sudden termination, as they would be due to climate change.303 SAI modelling studies have looked at how different SAI implementation schemes may impact the environment.109,136 As a result, it is unlikely for SAI implementation to be terminated abruptly given its negative effect as pointed out in this study. Regardless, it is important to note that SAI has the ability to negatively affect the global biodiversity hotspots even more than the rapid rise in GHGs concentrations, if not designed properly. | ||
| Fig. 14 Climate velocities for global diversity hotspots for different climate scenarios. (a) The locations represent the top 10% most species-rich areas where a given taxonomic group is found. (b) Precipitation velocities for terrestrial biodiversity hotspots. Temperature velocities for (c) marine biodiversity hotspots and (d) terrestrial biodiversity hotspots. Reprinted with permission of the publisher from Trisos et al., Nat. Ecol. Evol., 2018, 2, 475–482. | ||
5 Governance and economics
Any successful application of SRM would, by design, impact the climate and ecosystems of multiple nations. Therefore, multinational cooperation and agreement should be sought out before such a deployment.304 The National Academies of Sciences, Engineering, and Medicines reported in their 2021 study305 that almost one thirds of all geoengineering studies from 1983 to 2020 was on governance, economics or social sciences. However, there is limited diversity both in the research community for solar geoengineering and in relevant public engagement.306–308 In addition, there is still little to no governance and economic frameworks in place as summarized by Flegal et al. (2019).309 Such frameworks would entail guidelines and regulations regarding the scope and responsibility of SRM research, including regional and global deployment and maintenance. In 2019, MacMartin and co-authors310 examined the technical dimensions of an SAI deployment that will most likely affect the on-going decisions of whether to continue SAI and, if so, how to continue. The study suggested that some SAI uncertainties could be managed via a feedback system as demonstrated in previous modeling studies.311–314 For example, the amount of aerosol injection needed could be adjusted during the SAI implementation process based on how much of the ‘observed’ global mean temperature we aim to offset.314 However, before SAI application there are still several important questions that lack a systematic response, including the following: who should decide when and where the SAI deployment should be? Who will be paying for the research cost, initial and ongoing deployment cost? What is the termination plan? Who will shoulder the compensation costs in the scenario that SAI causes unexpected major health or environmental impacts? Etc. A detailed review of ethical aspects of SRM has previously been covered by Preston et al. (2013), where potential concerns regarding different stages of SRM was analyzed.The potential impacts of SRM deployment are estimated to be most severe for communities vulnerable to climate change, such as coastal areas and those around the tropics.305 Within the past decade, Solar Radiation Management Governance Initiative (SRMGI), now known as the DEGREES (DEveloping Governance REsearch and Evaluation for SRM) Initiative, has administered grants to teams of 21 developing countries to research the impacts of SRM on their respective communities.315 So far, this NGO funding effort has facilitated modeling studies of SAI regional impacts on climate extremes (e.g., droughts)316–318 and health risks319 in Africa, the Middle East, and Southeast Asia to name a few.
In terms of governance, there have been proposals attempting to establish a hypothetical framework to govern the SRM process, including but not limited to research, aerosol production, deployment, and ongoing maintenance.320–324 The general consensus is the need to expand SRM research beyond North American and European institutions and to begin assessing the possibility and applicability of SRM through a formally established governance.305 It has been suggested that SRM or SAI research should be restricted to only numerical modeling and laboratory studies until multinational governance is established and adequate public outreach has been made.
Previously two preliminary SAI outdoor experiments were proposed and unsuccessfully attempted: the Stratospheric Particle Injection for Climate Engineering (SPICE) study and the Stratospheric Controlled Perturbation Experiment (SCoPEx). Mainly funded by the UK Engineering and Physical Sciences Research Council (EPSRC), the SPICE study had to postpone their first field trial in 2011 to spray H2O at 1 km altitude due to backlash from NGOs and environmental groups.325 In 2021, the first ScoPEx dry run in Sweden to test their instruments platform without injecting any particles received major pushbacks from local environmental groups as well as the indigenous community.326 Despite having created an independent advisory board, ScoPEx has received general backlash including an open petition327 signed by global environmental groups prior to their first attempt at outdoor experiments. In general, SAI research field experiments may continue to face scrutiny in the absence of international agreements and oversight.
Besides governance, the potential costs regarding implementation and maintenance of SAI have also been discussed in a few comprehensive studies.328–330 McClellan and Keith et al. (2012) determined that there is existing technology capable of delivering millions of tons of SO2 to the stratosphere. The authors estimated that it would cost about $5–8 billion annually to use new aircraft designs or ∼$5 billion per year to use Boeing 747 Class airplanes to deliver 5 Mt of SO2 annually to an altitude range between 20 and 30 km. This SAI implementation was estimated to zero out the anticipated increase in RF over a 50 year period starting in 2012.328 Smith and Wagner (2018) also recommended an aircraft-based aerosol delivery system. Yet they concluded that existing technologies either could not reach the required altitude of at least 20 km (e.g., military, or commercial transport aircraft) or are too expensive to use (e.g., NASA's high-altitude aircrafts). Including all development and operating costs, the 2018 study evaluated that about $2.25 billion per year is needed to inject ∼0.2 Mt of SO2 yearly starting in 2033 over a 15 year period to halve the projected global warming caused by anthropogenic GHG emissions.330 Nonetheless, none of the studies so far included the costs of monitoring and measuring the impacts of SAI application and any other indirect costs, suggesting it to be at the lower end of the true costs. In addition, the estimates did not consider potential costs of remediation associated with possible unintended consequences of SAI implementation. Overall, SAI implementation and maintenance costs are functions of the designed scenario, including the duration, aerosol injection amount as well as injection location.
6 Conclusions and future research
Since its conception until today, SAI has prompted advanced modeling studies, many of which fully coupled different climate processes, including atmosphere, ocean, and land surface models. However, model simulations are necessarily limited in complexity compared to the real atmosphere and may not predict unintended consequences if the process in question is not represented in the model. Models necessarily involve many assumptions about poorly constrained processes such as aerosol microphysics and stratospheric chemistry.105,106 For example, the refractive indices of many solid aerosols, the main alternatives to commonly studied sulfate aerosols, were empirically calculated,161 reflecting uncertainties in the estimates of solid aerosols' radiative effects on both the level of stratospheric heating and changes in stratospheric water vapor.82,140 The injected aerosol size and their temporal evolution (e.g., via coagulation), despite being included in many modeling studies as listed in Table 1, have only been considered in the context of their radiative effects. The chemical evolution of injected aerosols over its stratospheric lifetime have not been accounted for, even though the aerosol size, especially surface area density, will inevitably transform due to the saturation of products on the aerosol surface upon reacting with traces gases250 in the stratosphere. Therefore, the radiative impacts of aerosols require further research, especially because the extent to which aerosols could influence the Earth's albedo dictates the characteristics of SAI deployment, including aerosol injection rate, frequency, location as well as SAI implementation duration.62,280,331Besides uncertainties about aerosol microphysics, so far few lab experiments have been conducted to characterize the stratospheric chemistry of proposed SAI aerosols,178,184,259,263 most of which have only been studied at ambient conditions as summarized in Table 2. Aerosol heterogeneous chemistry with stratospheric NOx and ClOx reservoir species (e.g., HNO3, N2O5, and HCl) greatly affects global O3 level as discussed in Section 3, and thus should be experimentally measured to provide reliable kinetic data for SAI modeling studies. As seen in Table 2, the wide range of measured gas uptake on aerosol surface, for example CaCO3, is a result of not only by the various experimental techniques but also assumptions about the available aerosol surface area. Measurements involving airborne aerosol instead of powder provide a more accurate representation of the available surface sites for gas uptake upon aerosol release in the stratosphere. Our stratospheric temperature study of HCl uptake on airborne CaCO3 aerosols with AFT-CIMS263 sets up a good standard for other low-temperature experimental studies of aerosol heterogeneous chemistry. However, our current experimental technique is only applicable of measuring the initial gas uptake on aerosol surface. It is also essential to measure long-term gas uptakes to derive stratospheric lifetime of the studied aerosol. Dai et al. (2020) is the first study to measure long-term HCl uptake on the surface of CaCO3 powder.178 However, there are diffusion limitations when using a flask or a coated-wall flow tube technique as in their experiments, suggesting uncertainties with the results. Water plays an important role in increasing the reactivity of CaCO3 aerosols and this should be explored under stratospheric conditions. Nevertheless, since there is only a trace amount of water in the lower stratosphere, 4 × 10⁻⁴ Torr H2O vapor,194 we do not expect a significant increase in gas uptake by CaCO3 aerosol.
Together with the stratospheric chemical effects, downstream processes once the injected aerosols are transported to the troposphere, such as aerosol–cloud interactions and gravitational settling, have been projected to induce major climatic effects notably on the hydrological cycles,156,274,276 extreme weather events,62,176,279 and biodiversity297,332 at both regional and global levels (Section 4). Although there are uncertainties in the modeling results due to variations in model parameters (e.g., aerosol size distribution, stratospheric transport, etc.),106,333 SAI was often determined to offset the negative impacts of climate change. Nevertheless, some studies projected that the abrupt termination of SAI would result in far more detrimental effects on the climate than the rise in anthropogenic GHGs emissions334,335 (e.g., biodiversity loss),297 assuming no reduction in projected GHGs concentrations were made during the SAI period. Additionally, other studies such as Proctor et al. (2018) speculated that even the implementation of SAI provided little to no relief to the anticipated heat-induced stress on global agriculture from climate change.177
In addition to climate effects, there are also uncertainties about public health impacts of SAI aerosols. Effiong and Neitzel (2016)336 characterized both occupational and public exposures to different SAI materials, including sulfate and alternatives (e.g., BC, Al2O3, etc.). The study suggested that adverse health impacts are anticipated considering inhalation of suspended particles coupled with digestion of sedimented particles in water and food sources.337–339 Since the toxicity of many of these aerosols are not well-studied and some of them are not routinely measured in the ambient atmosphere, the public exposure limits have not been formally established.
Overall, various SAI modeling studies over the past few decades have projected an array of climate and social impacts, intended and unintended. To minimize uncertainties associated with SAI, the chemical kinetics of proposed aerosols under stratospheric conditions need to be explored experimentally. Concurrently, atmospheric models should account for both physical and chemical evolutions of aerosols over its stratospheric lifetime to improve the modeling estimates of stratospheric aerosol loading impacts particularly on cirrus clouds,164,340 stratospheric water vapor and transport,102,128 stratospheric temperature, and ozone chemistry.89,102,142,143,178,265 Questions such as how to measure SAI impacts regionally and globally, how to dynamically adjust SAI parameters as a result of its observed effects, or how to terminate SAI, have been considered but remain open.105,314 Addressing these concerns systematically should assist in setting up a multinational governance framework on scientific research, SAI deployment and termination scenarios, all of which are crucial to reliably consider SAI as a formal option to battle climate change.
Abbreviations
| AASE II | Airborne arctic stratospheric experiment-II |
| AER-2D | Atmospheric and environmental research inc. 2D model |
| (CCM) SOCOLv2.0 | Chemistry climate model solar climate ozone links version 2.0 |
| AFT | Aerosol flow tube |
| AOD | Aerosol optical depth |
| BC | Black carbon |
| BDC | Brewer–Dobson circulation |
| CCN | Cloud condensation nuclei |
| CCT | Cirrus cloud thinning |
| CFCs | Chlorofluorocarbons |
| CIMS | Chemical ionization mass spectrometer |
| CLD | Chemiluminescence detector |
| FAGE | Fluorescence assay by gas expansion |
| DRIFTS | Diffuse reflectance infrared Fourier transform spectroscopy |
| DU | Dobson unit |
| ECHAM5-HAM | Fifth-generation atmospheric general circulation model |
| EIMS | Electron ionization mass spectrometer |
| ENSO | El Niño-Southern Oscillation |
| FTIR | Fourier transform infrared spectroscopy |
| GeoMIP | Geoengineering model intercomparison project |
| GEOSCCM | Goddard earth observing system chemistry climate model |
| GHG | Greenhouse gas |
| GISS ModelE2 | NASA's Goddard institute for space studies model E2 |
| IGCM | University of reading intermediate general circulation model |
| IPCC | Intergovernmental panel on climate change |
| ITCZ | Intertropical convergence zone |
| LW | Longwave |
| MCB | Marine cloud brightening |
| MIROC-ESM-CHEM | Earth system model based on model for interdisciplinary research on climate |
| MPI ESM | Max Planck institute earth system model |
| NDC | Nationally determined contributions |
| NH | Northern hemisphere |
| PSCs | Polar stratospheric clouds |
| PS-SFR | Particle-on-substrate stagnation flow reactor |
| RCP | Representative concentration pathway |
| RF | Radiative forcing |
| QBO | Quasi-biennial oscillation |
| RFG | Radiative forcing geoengineering |
| SAG | Surface albedo geoengineering |
| SAGE-II | Stratospheric aerosol and gas experiments-II |
| SAI | Stratospheric aerosol injection |
| ScoPEx | Stratospheric controlled perturbation experiment |
| SEM/EDX | Scanning electron microscopy/energy-dispersed X-ray spectrometer |
| SH | Southern hemisphere |
| SPICE | Stratospheric particle injection for climate engineering |
| STE | Stratosphere–troposphere exchange |
| SRM | Solar radiation management |
| SW | Shortwave |
| SWV | Stratospheric water vapor |
| TC | Tropical cyclones |
| TOA | Top-of-atmosphere |
| TOMS | Total ozone mapping spectrometer |
| TTL | Tropical tropopause layer |
| UHI | Urban heat islands |
| WACCM3 | Whole atmosphere community climate model version 3 |
| ULAQ-CCM | University of L'Aquila climate-chemistry coupled model |
| HadGEM2 | Hadley center global environment model version 2 |
| RRTM | Rapid radiative transfer model |
| CESM CAM4-chem | Community earth system model-community atmospheric model 4 |
| CNRM-ESM2-1 | Centre national de recherches meteorologiques earth system model of second generation |
| ISPL-CM6A-LR | Institut Pierre-Simon Laplace climate model for CMIP6-low resolution |
| UKESM1-0-LL | U.K. earth system model |
Author contributions
All authors wrote and edited the paper.Conflicts of interest
The authors declare there are no conflicts of interest.Acknowledgements
The authors gratefully acknowledge the Eutopia Foundation for support of this work and for the reviewers for the careful review of the paper.References
- IPCC, Climate Change 2014: Synthesis Report. Contribution of Working Groups I, II and III to the Fifth Assessment Report of the Intergovernmental Panel on Climate Change, IPCC, Geneva, Switzerland, 2014 Search PubMed.
- IPCC (Intergovernmental Panel on Climate Change), Climate Change 2013: The Physical Science Basis, Cambridge University Press, Cambridge, United Kingdom, 2013 Search PubMed.
- USGCRP (U.S. Global Change Research Program), Climate Science Special Report: Fourth National Climate Assessment, Volume I, 2018, vol. 1 Search PubMed.
- D. Habeeb, J. Vargo and B. Stone, Nat. Hazards, 2015, 76, 1651–1665 CrossRef.
- IPCC, 2012: Managing the Risks of Extreme Events and Disasters to Advance Climate Change Adaptation. A Special Report of Working Groups I and II of the Intergovernmental Panel on Climate Change, ed. C. B. Field, V. Barros, T. F. Stocker, D. Qin, D. J. Dokken, K. L. Ebi, M. D. Mastrandrea, K. J. Mach, G.-K. Plattner, S. K. Allen, M. Tignor and P. M. Midgley, Cambridge University Press, Cambridge, UK and New York, NY, USA, 2012 Search PubMed.
- R. J. Millar, J. S. Fuglestvedt, P. Friedlingstein, J. Rogelj, M. J. Grubb, H. D. Matthews, R. B. Skeie, P. M. Forster, D. J. Frame and M. R. Allen, Nat. Geosci., 2017, 10, 741–747 CrossRef CAS.
- P. Goodwin, A. Katavouta, V. M. Roussenov, G. L. Foster, E. J. Rohling and R. G. Williams, Nat. Geosci., 2018, 11, 102–107 CrossRef CAS.
- K. B. Tokarska and N. P. Gillett, Nat. Clim. Change, 2018, 8, 296–299 CrossRef CAS.
- J. Rogelj, M. Den Elzen, N. Höhne, T. Fransen, H. Fekete, H. Winkler, R. Schaeffer, F. Sha, K. Riahi and M. Meinshausen, Nature, 2016, 534, 631–639 CrossRef CAS PubMed.
- S. Fujimori, X. Su, J. Y. Liu, T. Hasegawa, K. Takahashi, T. Masui and M. Takimi, Springerplus, 2016, 5, 1–11 CrossRef PubMed.
- H. Benveniste, O. Boucher, C. Guivarch, H. Le Treut and P. Criqui, Environ. Res. Lett., 2018, 13, 14022 CrossRef.
- Y. N. Ou, G. Iyer, L. Clarke, J. Edmonds, A. A. Fawcett, N. Hultman, J. R. McFarland, M. Binsted, R. Cui, C. Fyson, A. Geiges, S. Gonzales-Zuñiga, M. J. Gidden, N. Höhne, L. Jeffery, T. Kuramochi, J. Lewis, M. Meinshausen, Z. Nicholls, P. Patel, S. Ragnauth, J. Rogelj, S. Waldhoff, S. Yu and H. McJeon, Science, 2021, 374, 693–695 CrossRef CAS PubMed.
- J. Rogelj, O. Fricko, M. Meinshausen, V. Krey, J. J. J. Zilliacus and K. Riahi, Nat. Commun., 2017, 8, 1–12 CrossRef PubMed.
- N. A. of S. and N. A. of E. Institute of Medicine, Policy Implications of Greenhouse Warming: Mitigation, Adaptation, and the Science Base, National Academies Press, Washington, DC, 1992 Search PubMed.
- T. M. Lenton and N. E. Vaughan, Atmos. Chem. Phys., 2009, 9, 5539–5561 CrossRef CAS.
- J. von Neumann, Fortune, 1955, 106–108 Search PubMed.
- D. L. Mitchell and W. Finnegan, Environ. Res. Lett., 2009, 4, 045102 CrossRef.
- P. J. Crutzen, Clim. Change, 2006, 77, 211–220 CrossRef CAS.
- T. Chen, W. B. Rossow and Y. Zhang, J. Clim., 2000, 13, 264–286 CrossRef.
- T. Storelvmo and N. Herger, J. Geophys. Res., 2014, 119, 2375–2389 CrossRef CAS.
- T. Storelvmo, W. R. Boos and N. Herger, Philos. Trans. R. Soc., A, 2014, 372(2031) DOI:10.1098/rsta.2014.0116.
- J. E. Kristjánsson, H. Muri and H. Schmidt, Geophys. Res. Lett., 2015, 42, 10807–10815 CrossRef.
- T. Storelvmo, J. E. Kristjansson, H. Muri, M. Pfeffer, D. Barahona and A. Nenes, Geophys. Res. Lett., 2013, 40, 178–182 CrossRef CAS.
- J. E. Penner, C. Zhou and X. Liu, Geophys. Res. Lett., 2015, 42, 8775–8782 CrossRef.
- B. Gasparini and U. Lohmann, J. Geophys. Res.: Atmos., 2016, 121, 4877–4893 CrossRef.
- C. Tully, D. Neubauer, N. Omanovic and U. Lohmann, Atmos. Chem. Phys., 2022, 22, 11455–11484 CrossRef CAS.
- B. Gasparini, Z. McGraw, T. Storelvmo and U. Lohmann, Environ. Res. Lett., 2020, 15, 054002 CrossRef.
- P. J. Irvine, A. Ridgwell and D. J. Lunt, J. Geophys. Res.: Atmos., 2011, 116, 24112 CrossRef.
- A. Ridgwell, J. S. Singarayer, A. M. Hetherington and P. J. Valdes, Curr. Biol., 2009, 19, 146–150 CrossRef CAS PubMed.
- R. M. Hamwey, Mitig. Adapt. Strateg. Glob. Change, 2007, 12, 419–439 CrossRef.
- A. Rosenfeld, J. Romm, H. Akbari and A. Lloyd, MIT Technol. Rev., 1997, 100(2), pp. 52–59 Search PubMed.
- H. Akbari, S. Menon and A. Rosenfeld, Clim. Change, 2008, 94, 275–286 CrossRef.
- J. Mandal, Y. Yang, N. Yu and A. P. Raman, Joule, 2020, 4, 1350–1356 CrossRef.
- T. R. Loveland, B. C. Reed, J. F. Brown, D. O. Ohlen, Z. Zhu, L. Yang and J. W. Merchant, Int. J. Remote Sens., 2000, 21, 1303–1330 CrossRef.
- H. Taha, Energy Build., 1997, 25, 99–103 CrossRef.
- A. Trlica, L. R. Hutyra, C. L. Schaaf, A. Erb and J. A. Wang, Earth's Future, 2017, 5, 1084–1101 CrossRef.
- M. Z. Jacobson and J. E. Ten Hoeve, J. Clim., 2012, 25, 1028–1044 CrossRef.
- K. W. Oleson, G. B. Bonan and J. Feddema, Geophys. Res. Lett., 2010, 37, 3701 CrossRef.
- Heat Island Cooling Strategies | Heat Island Effect | US EPA, https://www.epa.gov/heatislands/heat-island-cooling-strategies, (accessed 12 July 2021) Search PubMed.
- J. Latham, Nature, 1990, 347, 339–340 CrossRef.
- J. Latham, Atmos. Sci. Lett., 2002, 3, 52–58 CrossRef.
- S. Twomey, J. Atmos. Sci., 1977, 34, 1149–1152 CrossRef.
- B. A. Albrecht, Science, 1989, 245, 1227–1230 CrossRef CAS PubMed.
- J. Latham, P. Rasch, C.-C. Chen, L. Kettles, A. Gadian, A. Gettelman, H. Morrison, K. Bower and T. Choularton, Philos. Trans. R. Soc., A, 2008, 366, 3969–3987 CrossRef PubMed.
- K. J. Noone, E. Öström, R. J. Ferek, T. Garrett, P. V. Hobbs, D. W. Johnson, J. P. Taylor, L. M. Russell, R. C. Flagan, J. H. Seinfeld, C. D. O'Dowd, M. H. Smith, P. A. Durkee, K. Nielsen, J. G. Hudson, R. A. Pockalny, L. De Bock, R. E. Van Grieken, R. F. Gasparovic and I. Brooks, J. Atmos. Sci., 2000, 57, 2729–2747 CrossRef.
- D. A. Randall, J. A. Coakley Jr., C. W. Fairall, R. A. Kropfli and D. H. Lenschow, Bull. Am. Meteorol. Soc., 1984, 65, 1290–1301 CrossRef.
- P. J. Rasch, J. Latham and C.-C. (J. ) Chen, Environ. Res. Lett., 2009, 4, 045112 CrossRef.
- Y. C. Chen, M. W. Christensen, L. Xue, A. Sorooshian, G. L. Stephens, R. M. Rasmussen and J. H. Seinfeld, Atmos. Chem. Phys., 2012, 12, 8223–8235 CrossRef CAS.
- A.-I. Partanen, H. Kokkola, S. Romakkaniemi, V.-M. Kerminen, K. E. J. Lehtinen, T. Bergman, A. Arola and H. Korhonen, J. Geophys. Res.: Atmos., 2012, 117, 2203 CrossRef.
- A. Jones, J. Haywood and O. Boucher, J. Geophys. Res.: Atmos., 2009, 114, 10106 Search PubMed.
- H. M. Horowitz, C. Holmes, A. Wright, T. Sherwen, X. Wang, M. Evans, J. Huang, L. Jaeglé, Q. Chen, S. Zhai and B. Alexander, Geophys. Res. Lett., 2020, 47, e2019GL085838 CrossRef CAS PubMed.
- G. Cooper, D. Johnston, J. Foster, L. Galbraith, A. Neukermans, R. Ormond, J. Rush, Q. Wang, G. Cooper, D. Johnston, J. Foster, L. Galbraith, A. Neukermans, R. Ormond, J. Rush and Q. Wang, Int. J. Geosci., 2013, 4, 78–97 CrossRef.
- A. K. L. Jenkins, P. M. Forster and L. S. Jackson, Atmos. Chem. Phys., 2013, 13, 1659–1673 CrossRef.
- A. K. L. Jenkins and P. M. Forster, Atmos. Sci. Lett., 2013, 14, 164–169 CrossRef.
- H. Muri, U. Niemeier and J. E. Kristjánsson, Geophys. Res. Lett., 2015, 42, 2951–2960 CrossRef.
- K. Bower, T. Choularton, J. Latham, J. Sahraei and S. Salter, Atmos. Res., 2006, 82, 328–336 CrossRef CAS.
- H. Korhonen, K. S. Carslaw and S. Romakkaniemi, Atmos. Chem. Phys., 2010, 10, 4133–4143 CrossRef CAS.
- L. Ahlm, A. Jones, W. C. Stjern, H. Muri, B. Kravitz and J. E. Kristjánsson, Atmos. Chem. Phys., 2017, 17, 13071–13087 CrossRef CAS.
- C. W. Stjern, H. Muri, L. Ahlm, O. Boucher, J. N. S. Cole, D. Ji, A. Jones, J. Haywood, B. Kravitz, A. Lenton, J. C. Moore, U. Niemeier, S. J. Phipps, H. Schmidt, S. Watanabe and J. E. Kristjánsson, Atmos. Chem. Phys., 2018, 18, 621–634 CrossRef CAS.
- R. Wood, Atmos. Chem. Phys., 2021, 21, 14507–14533 CrossRef CAS.
- P. J. Irvine, B. Kravitz, M. G. Lawrence and H. Muri, Wiley Interdiscip. Rev. Clim. Change, 2016, 7, 815–833 CrossRef.
- M. K. Mcnutt, W. Abdalati, K. Caldeira, S. C. Doney, P. G. Falkowski, S. Fetter, J. R. Fleming, S. P. Hamburg, M. G. Morgan and J. E. Penner, Climate Intervention: Reflecting Sunlight to Cool Earth, The National Academies Press, Washington, D.C., 2015 Search PubMed.
- P. J. Irvine, B. Kravitz, M. G. Lawrence, D. Gerten, C. Caminade, S. N. Gosling, E. J. Hendy, B. T. Kassie, W. D. Kissling, H. Muri, A. Oschlies and S. J. Smith, Earth's Future, 2017, 5, 93–106 CrossRef.
- M. G. Lawrence, S. Schäfer, H. Muri, V. Scott, A. Oschlies, N. E. Vaughan, O. Boucher, H. Schmidt, J. Haywood and J. Scheffran, Nat. Commun., 2018, 9, 1–19 CrossRef CAS PubMed.
- M. I. Budyko, Tellus, 1977, 29, 193–204 CrossRef.
- K. Labitzke and M. P. McCormick, Geophys. Res. Lett., 1992, 19, 207–210 CrossRef.
- W. B. Grant, J. Fishman, E. V. Browell, V. G. Brackett, D. Nganga, A. Minga, B. Cros, R. E. Veiga, C. F. Butler, M. A. Fenn and G. D. Nowicki, Geophys. Res. Lett., 1992, 19, 1109–1112 CrossRef CAS.
- M. P. McCormick, L. W. Thomason and C. R. Trepte, Nature, 1995, 373, 399–404 CrossRef CAS.
- M. J. Mills, J. H. Richter, S. Tilmes, B. Kravitz, D. G. Macmartin, A. A. Glanville, J. J. Tribbia, J. F. Lamarque, F. Vitt, A. Schmidt, A. Gettelman, C. Hannay, J. T. Bacmeister and D. E. Kinnison, J. Geophys. Res.: Atmos., 2017, 122, 13061–13078 CAS.
- S. Driscoll, A. Bozzo, L. J. Gray, A. Robock and G. Stenchikov, J. Geophys. Res.: Atmos., 2012, 117, 17105 CrossRef.
- R. B. Stothers, Science, 1984, 224, 1191–1198 CrossRef CAS PubMed.
- L. L. Stowe, R. M. Carey and P. P. Pellegrino, Geophys. Res. Lett., 1992, 19, 159–162 CrossRef.
- C. S. Long and L. L. Stowe, Geophys. Res. Lett., 1994, 21, 2215–2218 CrossRef.
- G. K. Yue, M. P. McCormick and E. W. Chiou, J. Geophys. Res.: Atmos., 1991, 96, 5209–5219 CrossRef.
- M. P. McCormick and R. E. Veiga, Geophys. Res. Lett., 1992, 19, 155–158 CrossRef.
- K. Labitzke, B. Naujokat and M. P. McCormick, Geophys. Res. Lett., 1983, 10, 24–26 CrossRef.
- D. E. Parker and J. L. Brownscombe, Nature, 1983, 301, 406–408 CrossRef.
- E. G. Dutton and J. R. Christy, Geophys. Res. Lett., 1992, 19, 2313–2316 CrossRef.
- D. J. Hofmann and S. Solomon, J. Geophys. Res., 1989, 94, 5029 CrossRef CAS.
- F. J. Dentener and P. J. Crutzen, J. Geophys. Res.: Atmos., 1993, 98, 7149–7163 CrossRef CAS.
- P. Heckendorn, D. Weisenstein, S. Fueglistaler, B. P. Luo, E. Rozanov, M. Schraner, L. W. Thomason and T. Peter, Environ. Res. Lett., 2009, 4, 045108 CrossRef.
- A. E. Dessler, M. R. Schoeberl, T. Wang, S. M. Davis and K. H. Rosenlof, Proc. Natl. Acad. Sci. U. S. A., 2013, 110, 18087–18091 CrossRef CAS PubMed.
- M. M. Joshi, A. J. Charlton and A. A. Scaife, Geophys. Res. Lett., 2006, 33, L09806 CrossRef.
- A. C. Maycock, M. M. Joshi, K. P. Shine and A. A. Scaife, J. Clim., 2013, 26, 545–561 CrossRef.
- A. J. Ferraro, E. J. Highwood and A. J. Charlton-Perez, Environ. Res. Lett., 2014, 9, 014001 CrossRef CAS.
- B. Kravitz, A. Robock, D. T. Shindell and M. A. Miller, J. Geophys. Res.: Atmos., 2012, 117(D9), D09203 CrossRef.
- A. C. Jones, J. M. Haywood and A. Jones, Atmos. Chem. Phys., 2016, 16, 2843–2862 CrossRef CAS.
- Q. Tang, P. G. Hess, B. Brown-Steiner and D. E. Kinnison, Geophys. Res. Lett., 2013, 40, 5553–5558 CrossRef CAS.
- L. Xia, P. J. Nowack, S. Tilmes and A. Robock, Atmos. Chem. Phys., 2017, 17, 11913–11928 CrossRef CAS.
- S. Kinne, O. B. Toon and M. J. Prather, Geophys. Res. Lett., 1992, 19, 1927–1930 CrossRef CAS.
- G. Pitari and E. Mancini, Nat. Hazards Earth Syst. Sci., 2002, 2, 91–108 CrossRef.
- V. Aquila, L. D. Oman, R. S. Stolarski, P. R. Colarco and P. A. Newman, J. Geophys. Res.: Atmos., 2012, 117, 6216 CrossRef.
- V. Aquila, L. D. Oman, R. Stolarski, A. R. Douglass and P. A. Newman, J. Atmos. Sci., 2013, 70, 894–900 CrossRef.
- L. Millán, M. L. Santee, A. Lambert, N. J. Livesey, F. Werner, M. J. Schwartz, H. C. Pumphrey, G. L. Manney, Y. Wang, H. Su, L. Wu, W. G. Read and L. Froidevaux, Geophys. Res. Lett., 2022, 49, e2022GL099381 CrossRef PubMed.
- H. Vömel, S. Evan and M. Tully, Science, 2022, 377, 1444–1447 CrossRef PubMed.
- Y. Zhu, C. G. Bardeen, S. Tilmes, M. J. Mills, X. Wang, V. L. Harvey, G. Taha, D. Kinnison, R. W. Portmann, P. Yu, K. H. Rosenlof, M. Avery, C. Kloss, C. Li, A. S. Glanville, L. Millán, T. Deshler, N. Krotkov and O. B. Toon, Commun. Earth Environ., 2022, 3, 1–7 CrossRef.
- P. Sellitto, A. Podglajen, R. Belhadji, M. Boichu, E. Carboni, J. Cuesta, C. Duchamp, C. Kloss, R. Siddans, N. Bègue, L. Blarel, F. Jegou, S. Khaykin, J. B. Renard and B. Legras, Commun. Earth Environ., 2022, 3, 1–10 CrossRef.
- A. F. Bais, C. S. Zerefos, I. C. Ziomas, N. Zoumakis, H. T. Mantis, D. J. Hofmann and G. Fiocco, Atmos. Ozone, 1985, 353–356 Search PubMed.
- H. T. Mantis, C. S. Zerefos, A. Baise, I. Ziomas and A. Kelessis, Arch. Meteorol., Geophys. Bioclimatol., Ser. B, 1986, 36, 135–145 CrossRef.
- J. F. Gleason, P. K. Bhartia, J. R. Herman, R. McPeters, P. Newman, R. S. Stolarski, L. Flynn, G. Labow, D. Larko, C. Seftor, C. Wellemeyer, W. D. Komhyr, A. J. Miller and W. Planet, Science, 1993, 260, 523–526 CrossRef CAS PubMed.
- J. R. Herman and D. Larko, J. Geophys. Res.: Atmos., 1994, 99, 3483–3496 CrossRef CAS.
- G. Pitari, V. Aquila, B. Kravitz, A. Robock, S. Watanabe, I. Cionni, N. Luca, G. Genova, E. Mancini and S. Tilmes, J. Geophys. Res., 2014, 119, 2629–2653 CrossRef CAS.
- Ultraviolet Radiation in Antarctica: Measurements and Biological Effects, ed. C. S. Weiler and P. A. Penhale, American Geophysical Union, Washington, D. C., 1994, vol. 62 Search PubMed.
- J. C. van der Leun, X. Tang and M. Tevini, Environmental Effects of Ozone Depletion: 1998 Assessment, 1998 Search PubMed.
- D. G. MacMartin, B. Kravitz, J. C. S. Long and P. J. Rasch, Earth's Future, 2016, 4, 543–548 CrossRef.
- B. Kravitz and D. G. MacMartin, Nat. Rev. Earth Environ., 2020, 1, 64–75 CrossRef.
- S. Tilmes, D. Visioni, A. Jones, J. Haywood, R. Séférian, P. Nabat, O. Boucher, E. M. Bednarz and U. Niemeier, Atmos. Chem. Phys., 2022, 22, 4557–4579 CrossRef CAS.
- A. Robock, D. G. MacMartin, R. Duren and M. W. Christensen, Clim. Change, 2013, 121, 445–458 CrossRef.
- D. G. Macmartin, B. Kravitz, S. Tilmes, J. H. Richter, M. J. Mills, J. F. Lamarque, J. J. Tribbia and F. Vitt, J. Geophys. Res.: Atmos., 2017, 122, 12574–12590 CAS.
- WMO, Scientific Assessment of Ozone Depletion, GAW Report No. 278, Geneva, Switzerland, 2022, p. 56 Search PubMed.
- S. D. Eastham, D. K. Weisenstein, D. W. Keith and S. R. H. Barrett, Atmos. Environ., 2018, 187, 424–434 CrossRef CAS.
- S. Madronich, S. Tilmes, B. Kravitz, D. G. MacMartin and J. H. Richter, Atmos, 2018, 9, 432 CrossRef CAS.
- D. W. Keith, Annu. Rev. Energy Environ., 2003, 25, 245–284 CrossRef.
- J. Reynolds, Anthr. Rev., 2014, 2(2), 174–191 Search PubMed.
- D. McLaren, Earth's Future, 2016, 4, 596–602 CrossRef.
- M. M. K. Austin and B. A. Converse, J. Environ. Psychol., 2021, 78, 101690 CrossRef.
- D. A. Dana, AESS Interdiscip. Environ. Stud. Sci. Ser., 2021, 165–181 Search PubMed.
- T. M. Andrews, A. W. Delton and R. Kline, Ecol. Econ., 2022, 196, 107421 CrossRef.
- T. L. Cherry, S. Kroll, D. M. McEvoy, D. Campoverde and J. Moreno-Cruz, Environ. Polit., 2022, 32(2), 362–370 CrossRef.
- H. D. Matthews and K. Caldeira, Proc. Natl. Acad. Sci. U. S. A., 2007, 104, 9949–9954 CrossRef CAS PubMed.
- J. F. Tjiputra, A. Grini and H. Lee, J. Geophys. Res.: Biogeosci., 2016, 121, 2–27 CrossRef CAS.
- D. W. Keith, G. Wagner and C. L. Zabel, Nat. Clim. Change, 2017, 7, 617–619 CrossRef.
- K. S. Lauvset, J. Tjiputra and H. Muri, Biogeosciences, 2017, 14, 5675–5691 CrossRef.
- J. T. Fasullo, S. Tilmes, J. H. Richter, B. Kravitz, D. G. MacMartin, M. J. Mills and I. R. Simpson, Nat. Geosci., 2018, 11, 910–914 CrossRef CAS.
- D. P. Keller, E. Y. Feng and A. Oschlies, Nat. Commun., 2014, 5, 1–11 Search PubMed.
- M. Plazzotta, R. Séférian and H. Douville, Earth's Future, 2019, 7, 664–676 CrossRef CAS.
- A. Parker and P. J. Irvine, Earth's Future, 2018, 6, 456–467 CrossRef.
- B. J. Soden, R. T. Wetherald, G. L. Stenchikov and A. Robock, Science, 2002, 296, 727–730 CrossRef CAS PubMed.
- J. Haywood and O. Boucher, Rev. Geophys., 2000, 38, 513–543 CrossRef CAS.
- S. Kremser, L. W. Thomason, M. von Hobe, M. Hermann, T. Deshler, C. Timmreck, M. Toohey, A. Stenke, J. P. Schwarz, R. Weigel, S. Fueglistaler, F. J. Prata, J. P. Vernier, H. Schlager, J. E. Barnes, J. C. Antuña-Marrero, D. Fairlie, M. Palm, E. Mahieu, J. Notholt, M. Rex, C. Bingen, F. Vanhellemont, A. Bourassa, J. M. C. Plane, D. Klocke, S. A. Carn, L. Clarisse, T. Trickl, R. Neely, A. D. James, L. Rieger, J. C. Wilson and B. Meland, Rev. Geophys., 2016, 54, 278–335 CrossRef.
- J. X. Sheng, D. K. Weisenstein, B. P. Luo, E. Rozanov, A. Stenke, J. Anet, H. Bingemer and T. Peter, J. Geophys. Res., 2015, 120, 256–276 CrossRef CAS.
- P. J. Crutzen, Geophys. Res. Lett., 1976, 3, 73–76 CrossRef CAS.
- W. R. Stockwell and J. G. Calvert, Atmos. Environ., 1983, 17, 2231–2235 CrossRef CAS.
- F. Lehner, A. P. Schurer, G. C. Hegerl, C. Deser and T. L. Frölicher, Geophys. Res. Lett., 2016, 43, 2851–2858 CrossRef.
- S. Tilmes, J. H. Richter, M. J. Mills, B. Kravitz, D. G. MacMartin, R. R. Garcia, D. E. Kinnison, J. F. Lamarque, J. Tribbia and F. Vitt, J. Geophys. Res.: Atmos., 2018, 123, 4654–4673 CrossRef CAS.
- S. Tilmes, J. H. Richter, M. J. Mills, B. Kravitz, D. G. Macmartin, F. Vitt, J. J. Tribbia and J. F. Lamarque, J. Geophys. Res.: Atmos., 2017, 122, 12591–12615 CAS.
- D. Visioni, D. G. MacMartin, B. Kravitz, S. Tilmes, M. J. Mills, J. H. Richter and M. P. Boudreau, Geophys. Res. Lett., 2019, 46, 7790–7799 CrossRef.
- C. A. Brock, H. H. Jonsson, J. C. Wilson, J. E. Dye, D. Baumgardner, S. Borrmann, M. C. Pitts, M. T. Osborn, R. J. DeCoursey and D. C. Woods, Geophys. Res. Lett., 1993, 20, 2555–2558 CrossRef.
- D. M. Murphy, K. D. Froyd, I. Bourgeois, C. A. Brock, A. Kupc, J. Peischl, G. P. Schill, C. R. Thompson, C. J. Williamson and P. Yu, Atmos. Chem. Phys., 2021, 21, 8915–8932 CrossRef CAS.
- A. J. Ferraro, E. J. Highwood and A. J. Charlton-Perez, Geophys. Res. Lett., 2011, 38, 24706 CrossRef.
- F. D. Pope, P. Braesicke, R. G. Grainger, M. Kalberer, I. M. Watson, P. J. Davidson and R. A. Cox, Nat. Clim. Change, 2012, 2, 713–719 CrossRef CAS.
- D. K. Weisenstein, D. W. Keith and J. A. Dykema, Atmos. Chem. Phys., 2015, 15, 11835–11859 CrossRef CAS.
- D. W. Keith, D. K. Weisenstein, J. A. Dykema and F. N. Keutsch, Proc. Natl. Acad. Sci. U. S. A., 2016, 113, 14910–14914 CrossRef CAS PubMed.
- A. Lacis, J. Hansen and M. Sato, Geophys. Res. Lett., 1992, 19, 1607–1610 CrossRef.
- F. P. J. Valero and P. Pilewskie, Geophys. Res. Lett., 1992, 19, 163–166 CrossRef CAS.
- P. B. Russell, J. M. Livingston, E. G. Dutton, R. F. Pueschel, J. A. Reagan, T. E. DeFoor, M. A. Box, D. Allen, P. Pilewskie, B. M. Herman, S. A. Kinne and D. J. Hofmann, J. Geophys. Res.: Atmos., 1993, 98, 22969–22985 CrossRef.
- P. J. Rasch, S. Tilmes, R. P. Turco, A. Robock, L. Oman, C.-C. (J. ) Chen, G. L. Stenchikov and R. R. Garcia, Philos. Trans. R. Soc., A, 2008, 366, 4007–4037 CrossRef CAS PubMed.
- F. Benduhn and M. G. Lawrence, J. Geophys. Res.: Atmos., 2013, 118, 7905–7921 CrossRef.
- U. Lohmann and J. Feichter, Atmos. Chem. Phys., 2005, 5, 715–737 CrossRef CAS.
- U. Lohmann, Geophys. Res. Lett., 2002, 29, 11 CrossRef.
- P. J. DeMott, A. J. Prenni, X. Liu, S. M. Kreidenweis, M. D. Petters, C. H. Twohy, M. S. Richardson, T. Eidhammer and D. C. Rogers, Proc. Natl. Acad. Sci. U. S. A., 2010, 107, 11217–11222 CrossRef CAS PubMed.
- P. J. Rasch, P. J. Crutzen and D. B. Coleman, Geophys. Res. Lett., 2008, 35(2) DOI:10.1029/2007GL032179.
- K. E. Trenberth and A. Dai, Geophys. Res. Lett., 2007, 34(15) DOI:10.1029/2007GL030524.
- A. Robock, L. Oman and G. L. Stenchikov, J. Geophys. Res.: Atmos., 2008, 113, 16101 CrossRef.
- A. Jones, J. Haywood, O. Boucher, B. Kravitz and A. Robock, Atmos. Chem. Phys., 2010, 10, 5999–6006 CrossRef CAS.
- S. Tilmes, J. Fasullo, J. F. Lamarque, D. R. Marsh, M. Mills, K. Alterskjær, H. Muri, J. E. Kristjánsson, O. Boucher, M. Schulz, J. N. S. Cole, C. L. Curry, A. Jones, J. Haywood, P. J. Irvine, D. Ji, J. C. Moore, D. B. Karam, B. Kravitz, P. J. Rasch, B. Singh, J. H. Yoon, U. Niemeier, H. Schmidt, A. Robock, S. Yang and S. Watanabe, J. Geophys. Res.: Atmos., 2013, 118, 11036–11058 Search PubMed.
- K. Sassen, Science, 1992, 257, 516–519 CrossRef CAS PubMed.
- A. Schmidt, K. S. Carslaw, G. W. Mann, A. Rap, K. J. Pringle, D. V. Spracklen, M. Wilson and P. M. Forster, Atmos. Chem. Phys., 2012, 12, 7321–7339 CrossRef CAS.
- P. Forster, V. Ramaswamy, P. Artaxo, T. Berntsen, R. Betts, D. W. Fahey, J. Haywood, J. Lean, D. C. Lowe, G. Myhre, J. Nganga, R. Prinn, G. Raga, M. Schulz and R. Van Dorland, in Climate Change 2007: The Physical Science Basis. Contribution of Working Group I to the Fourth Assessment Report of the Intergovernmental Panel on Climate Change, ed. S. Solomon, D. Qin, M. Manning, Z. Chen, M. Marquis, K. B. Averyt, M. Tignor and H. L. Miller, Cambridge University Press, Cambridge, United Kingdom and New York, NY, USA, 2007 Search PubMed.
- A. Laor and B. T. Draine, Astrophys. J., 1993, 402, 441 CrossRef.
- J. A. Dykema, D. W. Keith and F. N. Keutsch, Geophys. Res. Lett., 2016, 43, 7758–7766 CrossRef CAS.
- C. E. Jung, C. W. Chagnon and J. E. Manson, J. Meteorol., 1961, 18, 81–108 CrossRef.
- X. Tie, G. P. Brasseur, B. Briegleb and C. Granier, J. Geophys. Res., 1994, 99, 20545 CrossRef.
- M. Kuebbeler, U. Lohmann and J. Feichter, Geophys. Res. Lett., 2012, 39, 23803 CrossRef.
- G. L. Stenchikov, I. Kirchner, A. Robock, H.-F. Graf, J. C. Antuña, R. G. Grainger, A. Lambert and L. Thomason, J. Geophys. Res.: Atmos., 1998, 103, 13837–13857 CrossRef CAS.
- N. G. Andronova, E. V. Rozanov, F. Yang, M. E. Schlesinger and G. L. Stenchikov, J. Geophys. Res.: Atmos., 1999, 104, 16807–16826 CrossRef.
- S. Ramachandran, V. Ramaswamy, G. L. Stenchikov and A. Robock, J. Geophys. Res.: Atmos., 2000, 105, 24409–24429 CrossRef.
- U. Niemeier, H. Schmidt and C. Timmreck, Atmos. Sci. Lett., 2011, 12, 189–194 CrossRef.
- C. R. Trepte, R. E. Veiga and M. P. McCormick, J. Geophys. Res.: Atmos., 1993, 98, 18563–18573 CrossRef.
- M. H. Hitchman, M. McKay and C. R. Trepte, J. Geophys. Res.: Atmos., 1994, 99, 20689–20700 CrossRef.
- M. A. Thomas, M. A. Giorgetta, C. Timmreck, H. F. Graf and G. Stenchikov, Atmos. Chem. Phys., 2009, 9, 3001–3009 CrossRef CAS.
- J. P. Pinto, R. P. Turco and O. B. Toon, J. Geophys. Res.: Atmos., 1989, 94, 11165–11174 CrossRef.
- M. Sato, J. E. Hansen, M. P. McCormick and J. B. Pollack, J. Geophys. Res.: Atmos., 1993, 98, 22987–22994 CrossRef.
- Y. Fujii, J. Atmos. Sol.–Terr. Phys., 2011, 73, 643–652 CrossRef CAS.
- S. Tilmes, R. R. Garcia, D. E. Kinnison, A. Gettelman and P. J. Rasch, J. Geophys. Res.: Atmos., 2009, 114(D12) DOI:10.1029/2008JD011420.
- A. C. Jones, J. M. Haywood, N. Dunstone, K. Emanuel, M. K. Hawcroft, K. I. Hodges and A. Jones, Nat. Commun., 2017, 8, 1–10 CrossRef CAS PubMed.
- J. Proctor, S. Hsiang, J. Burney, M. Burke and W. Schlenker, Nature, 2018, 560, 480–483 CrossRef CAS PubMed.
- Z. Dai, D. K. Weisenstein, F. N. Keutsch and D. W. Keith, Commun. Earth Environ., 2020, 1, 1–9 CrossRef.
- D. Visioni, D. G. Macmartin, B. Kravitz, O. Boucher, A. Jones, T. Lurton, M. Martine, M. J. Mills, P. Nabat, U. Niemeier, R. Séférian and S. Tilmes, Atmos. Chem. Phys., 2021, 21, 10039–10063 CrossRef CAS.
- M. Meinshausen, S. J. Smith, K. Calvin, J. S. Daniel, M. L. T. Kainuma, J.-F. Lamarque, K. Matsumoto, S. A. Montzka, S. C. B. Raper, K. Riahi, A. Thomson, G. J. M. Velders and D. P. P. van Vuuren, Clim. Change, 2011, 109, 213–241 CrossRef CAS.
- S. Tilmes, M. J. Mills, U. Niemeier, H. Schmidt, A. Robock, B. Kravitz, J. F. Lamarque, G. Pitari and J. M. English, Geosci. Model Dev., 2015, 8, 43–49 CrossRef.
- B. Kravitz, A. Robock, O. Boucher, H. Schmidt, K. E. Taylor, G. Stenchikov and M. Schulz, Atmos. Sci. Lett., 2011, 12, 162–167 CrossRef.
- W. Smith, Environ. Res. Lett., 2020, 15, 114004 CrossRef.
- H. N. Huynh and V. F. McNeill, J. Phys. Chem. A, 2020, 124, 3886–3895 CrossRef CAS PubMed.
- T. C. Bond, S. J. Doherty, D. W. Fahey, P. M. Forster, T. Berntsen, B. J. Deangelo, M. G. Flanner, S. Ghan, B. Kärcher, D. Koch, S. Kinne, Y. Kondo, P. K. Quinn, M. C. Sarofim, M. G. Schultz, M. Schulz, C. Venkataraman, H. Zhang, S. Zhang, N. Bellouin, S. K. Guttikunda, P. K. Hopke, M. Z. Jacobson, J. W. Kaiser, Z. Klimont, U. Lohmann, J. P. Schwarz, D. Shindell, T. Storelvmo, S. G. Warren and C. S. Zender, J. Geophys. Res.: Atmos., 2013, 118, 5380–5552 CrossRef CAS.
- B. Kravitz, D. G. MacMartin and K. Caldeira, Geophys. Res. Lett., 2012, 39, 11801 CrossRef.
- L. M. Mercado, N. Bellouin, S. Sitch, O. Boucher, C. Huntingford, M. Wild and P. M. Cox, Nat, 2009, 458, 1014–1017 CrossRef CAS PubMed.
- S. Solomon, R. R. Garcia, F. S. Rowland and D. J. Wuebbles, Nature, 1986, 321, 755–758 CrossRef CAS.
- M. J. Molina, T. L. Tso, L. T. Molina and F. C. Y. Wang, Science, 1987, 238, 1253–1257 CrossRef CAS PubMed.
- J. P. D. Abbatt and M. J. Molina, J. Phys. Chem., 1992, 96, 7674–7679 CrossRef CAS.
- J. P. D. Abbatt and M. J. Molina, Geophys. Res. Lett., 1992, 19, 461–464 CrossRef CAS.
- D. R. Hanson and A. R. Ravishankara, J. Phys. Chem., 1992, 96, 2682–2691 CrossRef CAS.
- D. W. Fahey, S. R. Kawa, E. L. Woodbridge, P. Tin, J. C. Wilson, H. H. Jonsson, J. E. Dye, D. Baumgardner, S. Borrmann, D. W. Toohey, L. M. Avallone, M. H. Proffitt, J. Margitan, M. Loewenstein, J. R. Podolske, R. J. Salawitch, S. C. Wofsy, M. K. W. Ko, D. E. Anderson, M. R. Schoeber and K. R. Chan, Nature, 1993, 363, 509–514 CrossRef CAS.
- D. W. Fahey, E. R. Keim, K. A. Boering, C. A. Brock, J. C. Wilson, H. H. Jonsson, S. Anthony, T. F. Hanisco, P. O. Wennberg, R. C. Miake-Lye, R. J. Salawitch, N. Louisnard, E. L. Woodbridge, R. S. Gao, S. G. Donnelly, R. C. Wamsley, L. A. Del Negro, S. Solomon, B. C. Daube, S. C. Wofsy, C. R. Webster, R. D. May, K. K. Kelly, M. Loewenstein, J. R. Podolske and K. R. Chan, Science, 1995, 270, 70–74 CrossRef CAS.
- G. Taubes, Science, 1993, 260, 1580–1583 CrossRef CAS PubMed.
- S. E. Strahan and A. R. Douglass, Geophys. Res. Lett., 2018, 45, 382–390 CrossRef CAS.
- L. M. Western, M. K. Vollmer, P. B. Krummel, K. E. Adcock, P. J. Fraser, C. M. Harth, R. L. Langenfelds, S. A. Montzka, J. Mühle, S. O'Doherty, D. E. Oram, S. Reimann, M. Rigby, I. Vimont, R. F. Weiss, D. Young and J. C. Laube, Nat. Geosci., 2023, 16, 309–313 CrossRef CAS.
- R. L. Thompson, L. Lassaletta, P. K. Patra, C. Wilson, K. C. Wells, A. Gressent, E. N. Koffi, M. P. Chipperfield, W. Winiwarter, E. A. Davidson, H. Tian and J. G. Canadell, Nat. Clim. Change, 2019, 9, 993–998 CrossRef CAS.
- H. Tian, R. Xu, J. G. Canadell, R. L. Thompson, W. Winiwarter, P. Suntharalingam, E. A. Davidson, P. Ciais, R. B. Jackson, G. Janssens-Maenhout, M. J. Prather, P. Regnier, N. Pan, S. Pan, G. P. Peters, H. Shi, F. N. Tubiello, S. Zaehle, F. Zhou, A. Arneth, G. Battaglia, S. Berthet, L. Bopp, A. F. Bouwman, E. T. Buitenhuis, J. Chang, M. P. Chipperfield, S. R. S. Dangal, E. Dlugokencky, J. W. Elkins, B. D. Eyre, B. Fu, B. Hall, A. Ito, F. Joos, P. B. Krummel, A. Landolfi, G. G. Laruelle, R. Lauerwald, W. Li, S. Lienert, T. Maavara, M. MacLeod, D. B. Millet, S. Olin, P. K. Patra, R. G. Prinn, P. A. Raymond, D. J. Ruiz, G. R. van der Werf, N. Vuichard, J. Wang, R. F. Weiss, K. C. Wells, C. Wilson, J. Yang and Y. Yao, Nat, 2020, 586, 248–256 CrossRef CAS PubMed.
- W. G. Mankin, M. T. Coffey and A. Goldman, Geophys. Res. Lett., 1992, 19, 179–182 CrossRef CAS.
- L. Wallace and W. Livingston, Geophys. Res. Lett., 1992, 19, 1209 CrossRef CAS.
- A. Tabazadeh and R. P. Turco, Science, 1993, 260, 1082–1086 CrossRef CAS PubMed.
- S. Kutterolf, T. H. Hansteen, A. Freundt, H. Wehrmann, K. Appel, K. Krüger and W. Pérez, Earth Planet. Sci. Lett., 2015, 429, 234–246 CrossRef CAS.
- C. M. Vidal, N. Métrich, J. C. Komorowski, I. Pratomo, A. Michel, N. Kartadinata, V. Robert and F. Lavigne, Sci. Rep., 2016, 6, 1–13 CrossRef PubMed.
- J. Eric Klobas, D. M. Wilmouth, D. K. Weisenstein, J. G. Anderson and R. J. Salawitch, Geophys. Res. Lett., 2017, 44, 7490–7499 CrossRef CAS.
- H. Brenna, S. Kutterolf and K. Krüger, Sci. Rep., 2019, 9, 1–14 CrossRef PubMed.
- G. A. Millard, T. A. Mather, D. M. Pyle, W. I. Rose and B. Thornton, Geophys. Res. Lett., 2006, 33, 19815 CrossRef.
- W. I. Rose, G. A. Millard, T. A. Mather, D. E. Hunton, B. Anderson, C. Oppenheimer, B. F. Thornton, T. M. Gerlach, A. A. Viggiano, Y. Kondo, T. M. Miller and J. O. Ballenthin, J. Geophys. Res.: Atmos., 2006, 111, 20206 CrossRef.
- G. P. Brasseur, C. Granier and S. Walters, Nature, 1990, 348, 626–628 CrossRef CAS.
- J. M. Rodriguez, M. K. W. Ko and N. D. Sze, Nature, 1991, 352, 134–137 CrossRef CAS.
- S. Solomon, G. H. Mount, R. W. Sanders, R. O. Jakoubek and A. L. Schmeltekopf, Science, 1988, 242, 550–555 CrossRef CAS PubMed.
- M. Prather, J. Geophys. Res.: Atmos., 1992, 97, 10187–10191 CrossRef.
- G. Brasseur and C. Granier, Science, 1992, 257, 1239–1242 CrossRef CAS PubMed.
- D. J. Hofmann, S. J. Oltmans, J. M. Harris, W. D. Komhyr, J. A. Lathrop, T. DeFoor and D. Kuniyuki, Geophys. Res. Lett., 1993, 20, 1555–1558 CrossRef.
- M. R. Schoeberl, P. K. Bhartia, E. Hilsenrath and O. Torres, Geophys. Res. Lett., 1993, 20, 29–32 CrossRef CAS.
- D. J. Hofmann, S. J. Oltmans, W. D. Komhyr, J. M. Harris, J. A. Lathrop, A. O. Langford, T. Deshler, B. J. Johnson, A. Torres and W. A. Matthews, Geophys. Res. Lett., 1994, 21, 65–68 CrossRef CAS.
- T. Deshler, A. Adriani, G. P. Gobbi, D. J. Hofmann, G. Di Donfrancesco and B. J. Johnson, Geophys. Res. Lett., 1992, 19, 1819–1822 CrossRef CAS.
- R. G. Grainger, A. Lambert, C. D. Rodgers, F. W. Taylor and T. Deshler, J. Geophys. Res.: Atmos., 1995, 100, 16507–16518 CrossRef CAS.
- M. J. Mills, A. O. Langford, T. J. O'Leary, K. Arpag, H. L. Miller, M. H. Proffitt, R. W. Sanders and S. Solomon, Geophys. Res. Lett., 1993, 20, 1187–1190 CrossRef CAS.
- P. V. Johnston, R. L. McKenzie, J. G. Keys and W. A. Matthews, Geophys. Res. Lett., 1992, 19, 211–213 CrossRef CAS.
- M. Koike, Y. Kondo, W. A. Matthews, P. V. Johnston and K. Yamazaki, Geophys. Res. Lett., 1993, 20, 1975–1978 CrossRef CAS.
- P. V. Johnston and R. L. McKenzie, J. Geophys. Res.: Atmos., 1989, 94, 3473–3486 CrossRef CAS.
- C. R. Webster, R. D. May, M. Allen, L. Jaeglé and M. P. McCormick, Geophys. Res. Lett., 1994, 21, 53–56 CrossRef CAS.
- M. Koike, N. B. Jones, W. A. Matthews, P. V. Johnston, R. L. McKenzie, D. Kinnison and J. Rodriguez, Geophys. Res. Lett., 1994, 21, 597–600 CrossRef CAS.
- C. S. Zerefos, K. Tourpali and A. F. Bais, J. Geophys. Res.: Atmos., 1994, 99, 25741–25746 CrossRef.
- W. J. Randel, F. Wu, J. M. Russell, J. W. Waters and L. Froidevaux, J. Geophys. Res.: Atmos., 1995, 100, 16753–16764 CrossRef CAS.
- W. J. Randel and F. Wu, J. Atmos. Sci., 1996, 53, 2546–2559 CrossRef.
- M. J. Prather, M. M. García, A. R. Douglass, C. H. Jackman, M. K. W. Ko and N. D. Sze, J. Geophys. Res.: Atmos., 1990, 95, 18583–18590 CrossRef.
- T. Hinklin, B. Toury, C. Gervais, F. Babonneau, J. J. Gislason, R. W. Morton and R. M. Laine, Chem. Mater., 2003, 16, 21–30 CrossRef.
- T. Tsuzuki and P. G. McCormick, J. Mater. Sci., 2004, 39, 5143–5146 CrossRef CAS.
- M. N. Ross and P. M. Sheaffer, Earth's Future, 2014, 2, 177–196 CrossRef CAS.
- C. H. Jackman, D. B. Considine and E. L. Fleming, J. Geophys. Res.: Atmos., 1996, 101, 12523–12529 CrossRef CAS.
- C. H. Jackman, D. B. Considine and E. L. Fleming, Geophys. Res. Lett., 1998, 25, 907–910 CrossRef CAS.
- M. Y. Danilin, R.-L. Shia, M. K. W. Ko, D. K. Weisenstein, N. D. Sze, J. J. Lamb, T. W. Smith, P. D. Lohn and M. J. Prather, J. Geophys. Res.: Atmos., 2001, 106, 12727–12738 CrossRef CAS.
- M. J. Molina, L. T. Molina, R. Zhang, R. F. Meads and D. D. Spencer, Geophys. Res. Lett., 1997, 24, 1619–1622 CrossRef CAS.
- F. Hanisch and J. N. Crowley, Atmos. Chem. Phys., 2003, 3, 119–130 CrossRef CAS.
- C. R. Usher, A. E. Michel and V. H. Grassian, Chem. Rev., 2003, 103, 4883–4939 CrossRef CAS PubMed.
- T. Ibusuki and K. Takeuchi, J. Mol. Catal., 1994, 88, 93–102 CrossRef CAS.
- Y. Ohko, Y. Nakamura, A. Fukuda, S. Matsuzawa and K. Takeuchi, J. Phys. Chem. C, 2008, 112, 10502–10508 CrossRef CAS.
- M. Ndour, B. D’Anna, C. George, O. Ka, Y. Balkanski, J. Kleffmann, K. Stemmler and M. Ammann, Geophys. Res. Lett., 2008, 35(5) DOI:10.1029/2007GL032006.
- Y. Bedjanian and A. El Zein, J. Phys. Chem. A, 2012, 116, 1758–1764 CrossRef CAS PubMed.
- D. P. Dee, S. M. Uppala, A. J. Simmons, P. Berrisford, P. Poli, S. Kobayashi, U. Andrae, M. A. Balmaseda, G. Balsamo, P. Bauer, P. Bechtold, A. C. M. Beljaars, L. van de Berg, J. Bidlot, N. Bormann, C. Delsol, R. Dragani, M. Fuentes, A. J. Geer, L. Haimberger, S. B. Healy, H. Hersbach, E. V. Hólm, L. Isaksen, P. Kållberg, M. Köhler, M. Matricardi, A. P. McNally, B. M. Monge-Sanz, J.-J. Morcrette, B.-K. Park, C. Peubey, P. de Rosnay, C. Tavolato, J.-N. Thépaut and F. Vitart, Q. J. R. Meteorol. Soc., 2011, 137, 553–597 CrossRef.
- D. R. Hanson, A. R. Ravishankara and S. Solomon, J. Geophys. Res.: Atmos., 1994, 99, 3615–3629 CrossRef CAS.
- F. F. Fenter, F. Caloz and M. J. Rossi, Atmos. Environ., 1995, 29, 3365–3372 CrossRef CAS.
- G. M. Underwood, P. Li, C. R. Usher and V. H. Grassian, J. Phys. Chem. A, 2000, 104, 819–829 CrossRef CAS.
- A. L. Goodman, G. M. Underwood and V. H. Grassian, J. Geophys. Res.: Atmos., 2000, 105, 29053–29064 CrossRef CAS.
- F. Hanisch and J. N. Crowley, J. Phys. Chem. A, 2001, 105, 3096–3106 CrossRef CAS.
- E. R. Johnson, J. Sciegienka, S. Carlos-Cuellar and V. H. Grassian, J. Phys. Chem. A, 2005, 109, 6901–6911 CrossRef CAS PubMed.
- A. Vlasenko, S. Sjogren, E. Weingartner, K. Stemmler, H. W. Gäggeler and M. Ammann, Atmos. Chem. Phys., 2006, 6, 2147–2160 CrossRef CAS.
- C. Santschi and M. J. Rossi, J. Phys. Chem. A, 2006, 110, 6789–6802 CrossRef CAS PubMed.
- F. Karagulian, C. Santschi and M. J. Rossi, Atmos. Chem. Phys., 2006, 6, 1373–1388 CrossRef CAS.
- P. K. Mogili, P. D. Kleiber, M. A. Young and V. H. Grassian, Atmos. Environ., 2006, 40, 7401–7408 CrossRef CAS.
- C. Wagner, F. Hanisch, N. Holmes, H. de Coninck, G. Schuster and J. N. Crowley, Atmos. Chem. Phys., 2008, 8, 91–109 CrossRef CAS.
- C. Wagner, G. Schuster and J. N. Crowley, Atmos. Environ., 2009, 43, 5001–5008 CrossRef CAS.
- G. M. Underwood, C. H. Song, M. Phadnis, G. R. Carmichael and V. H. Grassian, J. Geophys. Res.: Atmos., 2001, 106, 18055–18066 CrossRef CAS.
- G. M. Underwood, P. Li, H. Al-Abadleh and V. H. Grassian, J. Phys. Chem. A, 2001, 105, 6609–6620 CrossRef CAS.
- A. L. Goodman, E. T. Bernard and V. H. Grassian, J. Phys. Chem. A, 2001, 105, 6443–6457 CrossRef CAS.
- S. Seisel, C. Börensen, R. Vogt and R. Zellner, Phys. Chem. Chem. Phys., 2004, 6, 5498–5508 RSC.
- M. J. Tang, P. J. Telford, F. D. Pope, L. Rkiouak, N. L. Abraham, A. T. Archibald, P. Braesicke, J. A. Pyle, J. McGregor, I. M. Watson, R. A. Cox and M. Kalberer, Atmos. Chem. Phys., 2014, 14, 6035–6048 CrossRef.
- M. Tang, J. Keeble, P. J. Telford, F. D. Pope, P. Braesicke, P. T. Griffiths, N. Luke Abraham, J. McGregor, I. Matt Watson, R. Anthony Cox, J. A. Pyle and M. Kalberer, Atmos. Chem. Phys., 2016, 16, 15397–15412 CrossRef CAS.
- D. R. Moon, G. S. Taverna, C. Anduix-Canto, T. Ingham, M. P. Chipperfield, P. W. Seakins, M. T. Baeza-Romero and D. E. Heard, Atmos. Chem. Phys., 2018, 18, 327–338 CrossRef CAS.
- Y. Liu, E. R. Gibson, J. P. Cain, H. Wang, A. V. H. Grassian and A. Laskin, J. Phys. Chem. A, 2008, 112, 1561–1571 CrossRef CAS PubMed.
- H. N. Huynh and V. F. McNeill, ACS Earth Space Chem., 2021, 5, 1896–1901 CrossRef CAS.
- C. R. Usher, A. E. Michel, D. Stec and V. H. Grassian, Atmos. Environ., 2003, 37, 5337–5347 CrossRef CAS.
- S. Tilmes, R. Müller and R. Salawitch, Science, 2008, 320, 1201–1204 CrossRef CAS PubMed.
- B. C. O'Neill, C. Tebaldi, D. P. Van Vuuren, V. Eyring, P. Friedlingstein, G. Hurtt, R. Knutti, E. Kriegler, J. F. Lamarque, J. Lowe, G. A. Meehl, R. Moss, K. Riahi and B. M. Sanderson, Geosci. Model Dev., 2016, 9, 3461–3482 CrossRef.
- S. Tilmes, D. E. Kinnison, R. R. Garcia, R. Salawitch, T. Canty, J. Lee-Taylor, S. Madronich and K. Chance, Atmos. Chem. Phys., 2012, 12, 10945–10955 CrossRef CAS.
- P. J. Nowack, N. L. Abraham, P. Braesicke and J. A. Pyle, Atmos. Chem. Phys., 2016, 16, 4191–4203 CrossRef CAS.
- S. J. Oltmans, A. S. Lefohn, H. E. Scheel, J. M. Harris, H. Levy, I. E. Galbally, E. G. Brunke, C. P. Meyer, J. A. Lathrop, B. J. Johnson, D. S. Shadwick, E. Cuevas, F. J. Schmidlin, D. W. Tarasick, H. Claude, J. B. Kerr, O. Uchino and V. Mohnen, Geophys. Res. Lett., 1998, 25, 139–142 CrossRef CAS.
- A. C. Fusco and J. A. Logan, J. Geophys. Res.: Atmos., 2003, 108, 4449 CrossRef.
- K. E. Trenberth, Clim. Change, 1999, 42, 327–339 CrossRef.
- K. E. Trenberth, A. Dai, R. M. Rasmussen and D. B. Parsons, Bull. Am. Meteorol. Soc., 2003, 84, 1205–1218 CrossRef.
- I. M. Held and B. J. Soden, J. Clim., 2006, 19, 5686–5699 CrossRef.
- G. Bala, P. B. Duffy and K. E. Taylor, Proc. Natl. Acad. Sci. U. S. A., 2008, 105, 7664–7669 CrossRef CAS PubMed.
- J. M. Haywood, A. Jones, N. Bellouin and D. Stephenson, Nat. Clim. Change, 2013, 3, 660–665 CrossRef CAS.
- I. R. Simpson, S. Tilmes, J. H. Richter, B. Kravitz, D. G. MacMartin, M. J. Mills, J. T. Fasullo and A. G. Pendergrass, J. Geophys. Res.: Atmos., 2019, 124, 12587–12616 CrossRef CAS.
- C. E. Iles and G. C. Hegerl, Nat. Geosci., 2015, 8, 838–842 CrossRef CAS PubMed.
- D. G. MacMartin, W. Wang, B. Kravitz, S. Tilmes, J. H. Richter and M. J. Mills, J. Geophys. Res.: Atmos., 2019, 124, 1233–1247 CrossRef.
- J. C. Moore, A. Grinsted, X. Guo, X. Yu, S. Jevrejeva, A. Rinke, X. Cui, B. Kravitz, A. Lenton, S. Watanabe and D. Ji, Proc. Natl. Acad. Sci. U. S. A., 2015, 112, 13794–13799 CrossRef CAS PubMed.
- P. Irvine, K. Emanuel, J. He, L. W. Horowitz, G. Vecchi and D. Keith, Nat. Clim. Change, 2019, 9, 295–299 CrossRef.
- F. S. R. Pausata and S. J. Camargo, Proc. Natl. Acad. Sci. U. S. A., 2019, 116, 7732–7737 CrossRef CAS PubMed.
- A. T. Evan, J. Geophys. Res.: Atmos., 2012, 117, D06101 Search PubMed.
- A. Guevara-Murua, E. J. Hendy, A. C. Rust and K. V. Cashman, Geophys. Res. Lett., 2015, 42, 9425–9432 CrossRef.
- M. Latif, N. Keenlyside and J. Bader, Geophys. Res. Lett., 2007, 34(1), L01710 CrossRef.
- G. Villarini and G. A. Vecchi, J. Clim., 2013, 26, 3231–3240 CrossRef.
- N. J. Dunstone, D. M. Smith, B. B. B. Booth, L. Hermanson and R. Eade, Nat. Geosci., 2013, 6, 534–539 CrossRef CAS.
- K. A. Emanuel, Proc. Natl. Acad. Sci. U. S. A., 2013, 110, 12219–12224 CrossRef CAS PubMed.
- S. J. Camargo, J. Clim., 2013, 26, 9880–9902 CrossRef.
- K. J. E. Walsh, S. J. Camargo, G. A. Vecchi, A. S. Daloz, J. Elsner, K. Emanuel, M. Horn, Y.-K. Lim, M. Roberts, C. Patricola, E. Scoccimarro, A. H. Sobel, S. Strazzo, G. Villarini, M. Wehner, M. Zhao, J. P. Kossin, T. LaRow, K. Oouchi, S. Schubert, H. Wang, J. Bacmeister, P. Chang, F. Chauvin, C. Jablonowski, A. Kumar, H. Murakami, T. Ose, K. A. Reed, R. Saravanan, Y. Yamada, C. M. Zarzycki, P. L. Vidale, J. A. Jonas and N. Henderson, Bull. Am. Meteorol. Soc., 2015, 96, 997–1017 CrossRef.
- B. E. Brown, Coral Reefs, 1997, 16, S129–S138 CrossRef.
- O. Hoegh-Guldberg, Mar. Freshwater Res., 1999, 50, 839–866 Search PubMed.
- A. J. Edwards, S. Clark, H. Zahir, A. Rajasuriya, A. Naseer and J. Rubens, Mar. Pollut. Bull., 2001, 42, 7–15 CrossRef CAS PubMed.
- C. Langdon and M. J. Atkinson, J. Geophys. Res.: Oceans, 2005, 110, 1–16 CrossRef.
- N. C. S. Chan and S. R. Connolly, Global Change Biol., 2013, 19, 282–290 CrossRef PubMed.
- C. A. Schloss, T. A. Nuñez and J. J. Lawler, Proc. Natl. Acad. Sci. U. S. A., 2012, 109, 8606–8611 CrossRef CAS PubMed.
- R. T. Corlett and D. A. Westcott, Trends Ecol. Evol., 2013, 28, 482–488 CrossRef PubMed.
- C. H. Trisos, G. Amatulli, J. Gurevitch, A. Robock, L. Xia and B. Zambri, Nat. Ecol. Evol., 2018, 2, 475–482 CrossRef PubMed.
- S. R. Loarie, P. B. Duffy, H. Hamilton, G. P. Asner, C. B. Field and D. D. Ackerly, Nature, 2009, 462, 1052–1055 CrossRef CAS PubMed.
- I.-C. Chen, J. K. Hill, R. Ohlemüller, D. B. Roy and C. D. Thomas, Science, 2011, 333, 1024–1026 CrossRef CAS PubMed.
- M. T. Burrows, D. S. Schoeman, L. B. Buckley, P. Moore, E. S. Poloczanska, K. M. Brander, C. Brown, J. F. Bruno, C. M. Duarte, B. S. Halpern, J. Holding, C. V. Kappel, W. Kiessling, M. I. O'Connor, J. M. Pandolfi, C. Parmesan, F. B. Schwing, W. J. Sydeman and A. J. Richardson, Science, 2011, 334, 652–655 CrossRef CAS PubMed.
- M. L. Pinsky, B. Worm, M. J. Fogarty, J. L. Sarmiento and S. A. Levin, Science, 2013, 341, 1239–1242 CrossRef CAS PubMed.
- M. T. Burrows, D. S. Schoeman, A. J. Richardson, J. G. Molinos, A. Hoffmann, L. B. Buckley, P. J. Moore, C. J. Brown, J. F. Bruno, C. M. Duarte, B. S. Halpern, O. Hoegh-Guldberg, C. V. Kappel, W. Kiessling, M. I. O'Connor, J. M. Pandolfi, C. Parmesan, W. J. Sydeman, S. Ferrier, K. J. Williams and E. S. Poloczanska, Nat, 2014, 507, 492–495 CrossRef CAS PubMed.
- B. Sandel, L. Arge, B. Dalsgaard, R. G. Davies, K. J. Gaston, W. J. Sutherland and J.-C. Svenning, Science, 2011, 334, 660–664 CrossRef CAS PubMed.
- UN Environment Programme, Conference of the Parties to the Convention on Biological Diversity, Tenth meeting, Nagoya, Japan, 2010, pp. 82–353 Search PubMed.
- National Academies of Sciences, Engineering, and Medicine, Reflecting Sunlight: Recommendations for Solar Geoengineering Research and Research Governance, The National Academies Press, Washington, DC, 2021 Search PubMed.
- H. J. Buck, A. R. Gammon and C. J. Preston, Hypatia, 2014, 29, 651–669 CrossRef.
- D. E. Winickoff, J. A. Flegal and A. Asrat, Nat. Clim. Change, 2015, 5, 627–634 CrossRef.
- S. Jinnah, S. Nicholson and J. Flegal, Ethics Policy Environ., 2018, 21, 362–381 CrossRef.
- J. A. Flegal, A. M. Hubert, D. R. Morrow and J. B. Moreno-Cruz, Annu. Rev. Environ. Resour., 2019, 44, 399–423 CrossRef.
- D. G. MacMartin, P. J. Irvine, B. Kravitz and J. B. Horton, Clim. Policy, 2019, 19, 1325–1339 CrossRef.
- B. Kravitz, D. G. MacMartin, D. T. Leedal, P. J. Rasch and A. J. Jarvis, Environ. Res. Lett., 2014, 9, 044006 CrossRef.
- D. G. MacMartin, B. Kravitz and P. J. Rasch, Geophys. Res. Lett., 2015, 42, 7156–7161 CrossRef.
- B. Kravitz, D. G. Macmartin, H. Wang and P. J. Rasch, Earth Syst. Dyn., 2016, 7, 469–497 CrossRef.
- B. Kravitz, D. G. MacMartin, M. J. Mills, J. H. Richter, S. Tilmes, J.-F. Lamarque, J. J. Tribbia and F. Vitt, J. Geophys. Res.: Atmos., 2017, 122, 12616–12634 CAS.
- Putting Developing Countries at the Centre of the SRM Conversation, https://www.degrees.ngo/, (accessed 3 August 2023) Search PubMed.
- A. E. Alamou, E. Obada, E. I. Biao, E. B. J. Zandagba, C. Y. Da-Allada, F. K. Bonou, E. Baloïtcha, S. Tilmes, P. Irvine, A. Sharifi, C. Feng, J. Yang, A. E. Alamou, E. Obada, E. I. Biao, E. Babadjidé, J. Zandagba, C. Y. Da-Allada, F. K. Bonou, E. Baloïtcha, S. Tilmes and P. J. Irvine, Atmos, 2022, 13, 234 CrossRef CAS.
- M. L. Tan, L. Juneng, H. Kuswanto, H. X. Do and F. Zhang, Water, 2023, 15, 1089 CrossRef.
- I. Pinto, C. Jack, C. Lennard, S. Tilmes and R. C. Odoulami, Geophys. Res. Lett., 2020, 47, e2019GL086047 CrossRef.
- C. J. Carlson, R. Colwell, M. S. Hossain, M. M. Rahman, A. Robock, S. J. Ryan, M. S. Alam and C. H. Trisos, Nat. Commun., 2022, 13, 1–9 Search PubMed.
- S. Schäfer, P. J. Irvine, A. M. Hubert, D. Reichwein, S. Low, H. Stelzer, A. Maas and M. G. Lawrence, Nat. Clim. Change, 2013, 3, 766 CrossRef.
- J. L. Reynolds, Clim. Law, 2015, 182–209 Search PubMed.
- A. A. Rahman, P. Artaxo, A. Asrat and A. Parker, Nature, 2018, 556, 22–24 CrossRef CAS PubMed.
- R. Rayfuse, in The Oxford Handbook of Law, Regulation and Technology, 2017, pp. 799–822 Search PubMed.
- J. L. Reynolds, Proc. R. Soc. A, 2019, 475(2229) DOI:10.1098/rspa.2019.0255.
- P. MacNaghten and R. Owen, Nature, 2011, 479, 293 CrossRef CAS PubMed.
- Why A Landmark Experiment Into Dimming the Sun Got Canceled | Grist, https://grist.org/science/who-gets-to-decide-if-we-study-solar-geoengineering-after-the-scopex-project-canceled/, (accessed 28 June 2021) Search PubMed.
- Open Letter to SCoPEx Advisory Committee – Geoengineering Monitor, https://www.geoengineeringmonitor.org/2019/08/open-letter-scopex/, (accessed 28 June 2021) Search PubMed.
- J. McClellan, D. W. Keith and J. Apt, Environ. Res. Lett., 2012, 7, 034019 CrossRef.
- R. Moriyama, M. Sugiyama, A. Kurosawa, K. Masuda, K. Tsuzuki and Y. Ishimoto, Mitig. Adapt. Strateg. Glob. Change, 2016, 22, 1207–1228 CrossRef.
- W. Smith and G. Wagner, Environ. Res. Lett., 2018, 13, 124001 CrossRef.
- U. Niemeier and C. Timmreck, Atmos. Chem. Phys., 2015, 15, 9129–9141 CrossRef CAS.
- K. Dagon and D. P. Schrag, Clim. Change, 2019, 153, 235–251 CrossRef.
- C. L. Curry, J. Sillmann, D. Bronaugh, K. Alterskjaer, J. N. S. Cole, D. Ji, B. Kravitz, J. E. Kristjánsson, J. C. Moore, H. Muri, U. Niemeier, A. Robock, S. Tilmes and S. Yang, J. Geophys. Res.: Atmos., 2014, 119, 3900–3923 CrossRef.
- A. Jones, J. M. Haywood, K. Alterskjær, O. Boucher, J. N. S. Cole, C. L. Curry, P. J. Irvine, D. Ji, B. Kravitz, J. Egill Kristjánsson, J. C. Moore, U. Niemeier, A. Robock, H. Schmidt, B. Singh, S. Tilmes, S. Watanabe and J.-H. Yoon, J. Geophys. Res.: Atmos., 2013, 118, 9743–9752 CrossRef.
- K. E. McCusker, K. C. Armour, C. M. Bitz and D. S. Battisti, Environ. Res. Lett., 2014, 9, 024005 CrossRef.
- U. Effiong and R. L. Neitzel, Environ. Health, 2016, 15, 7 CrossRef PubMed.
- R. Baan, K. Straif, Y. Grosse, B. Secretan, F. El Ghissassi and V. Cogliano, Lancet Oncol., 2006, 7, 295–296 CrossRef PubMed.
- B. Kravitz, A. Robock, L. Oman, G. Stenchikov and A. B. Marquardt, J. Geophys. Res.: Atmos., 2009, 114, 14109 CrossRef.
- K. Caldeira, G. Bala and L. Cao, Annu. Rev. Earth Planet. Sci., 2013, 41, 231–256 CrossRef CAS.
- D. Visioni, G. Pitari, G. Di Genova, S. Tilmes and I. Cionni, Atmos. Chem. Phys., 2018, 18, 14867–14887 CrossRef CAS.
Footnote |
| † Electronic supplementary information (ESI) available. See DOI: https://doi.org/10.1039/d3ea00134b |
| This journal is © The Royal Society of Chemistry 2024 |