 Open Access Article
L-Tyrosine derived fluorescent molecular probes as solvent mediated flip-flop halide (iodide/fluoride) sensors and reversible chromogenic pH indicators†
Navnita
Kumar‡
and
Sanjay K.
Mandal
 *
*
Department of Chemical Sciences, Indian Institute of Science Education and Research Mohali, Sector 81, Manauli PO, S.A.S. Nagar, Mohali, Punjab 140306, India. E-mail: sanjaymandal@iisermohali.ac.in
First published on 4th January 2021
Abstract
In this work, we have developed two single-molecular probes, (S)-3-(4-hydroxyphenyl)-2-((4-nitrobenzyl)amino)propanoic acid (H2Tyr-4-nitro, 1) and (S)-3-(4-hydroxyphenyl)-2-((3-nitrobenzyl)amino)propanoic acid (H2Tyr-3-nitro, 2), from cheap and readily available L-tyrosine and demonstrated their use as (i) a solvent mediated differential fluorescent sensor for iodide in aqueous methanol and fluoride in aqueous DMSO and (ii) a reversible chromogenic pH indicator in DMSO. A flip-flop halide sensor also acting as a pH indicator is unprecedented.
In recent years, the progress in supramolecular chemistry has opened new avenues in the field of sensing multiple analytes and physical observables (pH, temperature, etc.) using a single-molecular probe. However, the complexity related to the working of these probes makes their obtainment quite challenging. Only few multiple sensing fluorescent probes have been reported for the ratiometric detection of different cations1 or different anions2 or cation with anions3 or metal-ions along with proteins or amino acids or sugar4 along with physical parameters like temperature.5 A few solvent mediated multiple-analyte sensors has been reported.6 On the other hand, some probes acting as pH indicators have also been documented.7 However, to the best of our knowledge, a single-molecular probe acting as both a solvent mediated differential halide sensor and an optical pH indicator is unprecedented. The design of such new multiple-action molecular probes is important for budding new tools for sensing multiple analytes and observables and for the basic understanding of the mechanism of their action. We initiated our work towards this direction by formulating L-tyrosine derived fluorescent probes and exploring their role as halide sensors and pH indicators. Two fluorophores (phenol and 3- or 4-nitrobenzyl groups) that have been judiciously put together in a single molecule are attributed to its triple mode of action. Herein, we report simple L-tyrosine derived fluorescent probes (S)-3-(4-hydroxyphenyl)-2-((4-nitrobenzyl)amino)propanoic acid (H2Tyr-4-nitro, 1)8 and (S)-3-(4-hydroxyphenyl)-2-((3-nitrobenzyl)amino)propanoic acid (H2Tyr-3-nitro, 2) and their abilities to act as solvent mediated differential halide fluorescent sensors and reversible chromogenic pH indicators. The functionalization of the L-tyrosine introduces an enhancement of the fluorescence intensity similar to the enhancement reported in the literature.9 These are synthesized via the combination of L-tyrosine and 4-nitrobenzaldehyde or 3-nitrobenzaldehyde moieties, respectively, in a single pot (see experimental details and Scheme S1, ESI†). In each case, the synthesis starts with the condensation of monosodium salt of L-tyrosine (prepared in situ from L-tyrosine and NaOH) with the corresponding aldehyde in a methanol
![[thin space (1/6-em)]](https://www.rsc.org/images/entities/char_2009.gif) :
:![[thin space (1/6-em)]](https://www.rsc.org/images/entities/char_2009.gif) water mixture (v/v 1
water mixture (v/v 1![[thin space (1/6-em)]](https://www.rsc.org/images/entities/char_2009.gif) :
:![[thin space (1/6-em)]](https://www.rsc.org/images/entities/char_2009.gif) 1). The resultant Schiff base is further reduced using sodium borohydride. The desired product is obtained by the addition of glacial acetic acid to the sodium salt of the reduced Schiff base in 80% yield. These are fully characterized using M.P., 1H NMR and FTIR spectroscopy, and HRMS data (see ESI†).
1). The resultant Schiff base is further reduced using sodium borohydride. The desired product is obtained by the addition of glacial acetic acid to the sodium salt of the reduced Schiff base in 80% yield. These are fully characterized using M.P., 1H NMR and FTIR spectroscopy, and HRMS data (see ESI†).
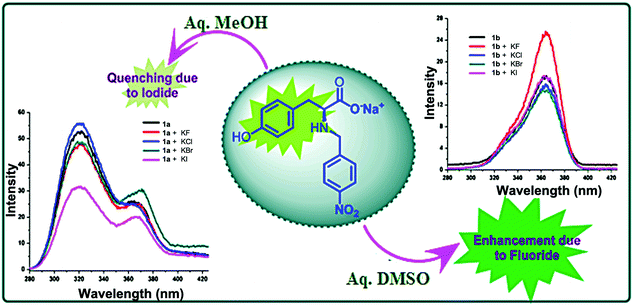
The photo-excitation of 1 in aq. DMSO at 220 nm yields a fluorescence spectrum with an emission maximum at 365 nm. On adding various anions, a significant change was observed in the fluorescence intensity (an enhancement) of the probe only for fluoride ion (Fig. S1, ESI†). To analyze the role of a solvent in anion sensing, fluorescence spectrum of 1 in aq. methanol was desired. However, insolubility of 1 in aq. methanol inhibited us from doing so. On the other hand, utilization of the fact that the monosodium salt of 1 is soluble in both aq. DMSO and aq. methanol solves the problem. When excited at 220 nm, the fluorescence spectrum of monosodium salt of 1 in aq. methanol (1a) shows an emission maximum at 320 nm with a hump at 365 nm while in aq. DMSO (1b) shows an emission maximum at 365 nm. On adding various anions, 1a shows selective quenching of fluorescence intensity by iodide ion whereas 1b shows selective enhancement of fluorescence intensity by fluoride anion (Fig. 1). With the subsequent addition of iodide to 1a, a sequential decrease in the main peak at 320 nm and an increase in the hump at 365 nm are observed (Fig. S2, ESI†). The percentage decrease at 320 nm is well observed (Fig. S3, ESI†). On the other hand, an addition of fluoride ion to 1b gradually increases its fluorescence intensity at 365 nm (Fig. S4, ESI†). The increase in the fluorescence intensity of 1b is a two-step process (Fig. S5, ESI†) indicating the involvement of two different interactions at different concentrations (vide infra). In the case of 1a and 1b, the detection limit for iodide ion is 3.28 ppm (2.59 × 10⁻⁵ M) (see Fig. S6 and Tables S1, S2, ESI†) and for fluoride ion is 0.14 ppm (7.28 × 10⁻⁶ M), respectively (see Fig. S7 and Tables S3, S4, ESI†). These values are comparable to those reported in the literature for each analyte.10 The homologous nature of the anion sensing abilities of 1 and its anionic form 1b in aq. DMSO nullifies the role of sodium ion and strengthens the part played by the solvent in sensing various halides. This differential halide ion sensing using the same probe in different solvents can be accredited to the variation in the orientation of the probe depending on the extent and type of interaction between both the probe and the halide ion with a particular solvent, which further depends on the polarity of the solvent.
 | ||
| Fig. 1 Quenching of fluorescence in 1a upon the addition of iodide ion and enhancement of fluorescence in 1b upon the addition of fluoride ion. | ||
Having established the solvent-dependent sensing behaviour of 1, for the positional effect of the nitro group, a second probe H2Tyr-3-nitro (2) was considered under similar conditions. When excited at 220 nm, the fluorescence spectrum of monosodium salt of 2 in aq. methanol (2a) shows a peak at 310 nm with a hump at 365 nm while in aq. DMSO (2b) shows a peak at 368 nm. On adding one equivalent of iodide ion to 2a, a much higher fluorescence quenching (68%) compared to that of 1a (43%) is observed (Fig. S8, ESI†). Similarly, the addition of one equivalent of fluoride ion to 2b causes 188% enhancement in fluorescence intensity compared to 72% by 1b (Fig. S9, ESI†). This indicates that the sensitivity of 2b is much more towards fluoride ions than 1b. On successive addition of iodide to 2a and fluoride to 2b further changes in the intensity of the probe are seen (Fig. S10 and S11, ESI†). However, for 2a and 2b, the detection limits are 4.66 ppm (3.67 × 10⁻⁵ M) for iodide (see Fig. S12 and Tables S5, S6, ESI†) and 0.19 ppm (1.01 × 10⁻⁵ M) for fluoride, (see Fig. S13 and Tables S7, S8, ESI†), respectively, which are quite similar to those of 1a and 1b. Based on the above data 2a/2b is slightly better than 1a/1b, emphasizing that both fluoride and iodide ions interact with the nitrobenzyl group of the probes where a stronger positive dipole is generated in 2a/2b compared to that in 1a/1b due to the meta vs. para position of the nitro group.
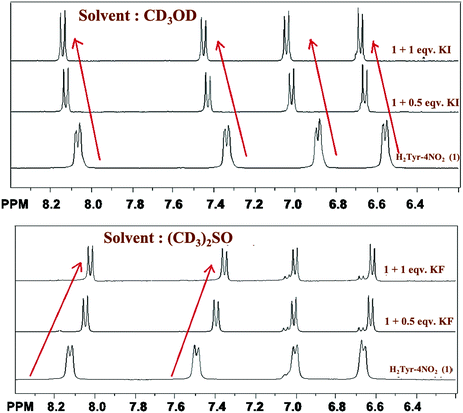
For a deeper understanding of the mechanism of this differential sensing, a titration between the anions and the probe was performed by 1H NMR spectroscopy. The 1H NMR titrimetry (see Fig. 2) between iodide ion and NaHTyr-4-nitro in CD3OD shows a downfield shift of all the aromatic protons (including protons of both nitrobenzyl and phenyl rings) whereas that between fluoride ion and NaHTyr-4-nitro in (CD3)2SO shows an upfield shift of the protons of nitrobenzyl rings with a slight change in the protons of the phenyl ring (peaks at 6.65). Hence, the fluoride sensing can be ascribed to the anion–π interaction11 between fluoride ion and the nitrobenzyl ring along with the hydrogen bonding between the NH group and fluoride ion. The presence of both these interactions further supports the two-step process observed in the enhancement of fluorescence intensity suggesting an increase in the electron density of the nitrobenzyl ring due to through-bond effects on the addition of fluoride ion to 1b and thus supports an upfield shift of protons as shown in Fig. 2 (bottom). The anion–π interaction is more prominent in DMSO, as it does not interact with any halide and thus enhances the anion–π interaction. However, in the case of methanol the interaction between the solvent and the halide (especially fluoride due to its small size and high electro negativity) diminishes the extent of anion–π interactions. The iodide ion being larger in size does not show much interaction with the solvent. The formation of a hydrophobic cavity by the probe in methanol (vide infra) helps in iodide sensing and also brings a downfield shift of all aromatic protons (through-space effects), which polarize the C–H bonds in proximity to the hydrogen bond, creating the partial positive charge. The 1H NMR shift observed in each case can be further enlightened by the predicted structures obtained through MM2 calculation (Chem 3D) for energy minimization. As can be seen in Fig. S14 in the ESI,† the formation of hydrogen bonds in methanol brings two molecules of the probe together forming a cavity (which is well observed in the space-fill model). This cavity is suitable for the iodide to fit in, and thus, the decrease in the electron density of the aromatic region causes a deshielding effect. On the other hand, in DMSO no such cavity is observed in the structure of the probe (see Fig. S15, ESI†) and thus the fluoride ion is being sensed by the anion–π interaction. With the above-mentioned facts, a probable mechanism for the solvent assisted differential sensing of halides is summarized in Scheme S2 (ESI†).
 | ||
| Fig. 2 1H NMR titrimetry of NaHTyr-4-nitro with KI (top) and KF (bottom) as an analyte in CD3OD and (CD3)2SO, respectively. | ||
From the NMR titrimetry as well as MM2 calculation it is clear that in iodide sensing both nitrobenzyl and phenol groups of the probe contribute equally while for fluoride sensing the role of the nitrobenzyl group appears to be more important compared to that of the phenol group. To consolidate this fact, the hydroxy group in 1 was replaced with a hydrogen to obtain (S)-2-((4-nitrobenzyl)amino)-3-phenylpropanoic acid (HPhe4-nitro, 3); the details of its synthesis and characterization are provided in the ESI.† On excitation at 220 nm, the fluorescence spectrum of monosodium salt of 3 in aq. methanol (3a) shows peaks at 338 nm and 362 nm while in aq. DMSO (3b) shows a peak at 365 nm. The change in the fluorescence intensity of 3a due to iodide ion and that of 3b due to fluoride ion is shown in Fig. S16–S19 in the ESI.† For 3a/3b, the detection limits are 11.77 ppm (9.27 × 10⁻⁵ M) for iodide (see Fig. S20 and Tables S9, S10, ESI†) and 0.58 ppm (3.04 × 10⁻⁵ M) for fluoride (see Fig. S21 and Tables S11, S12, ESI†), respectively.
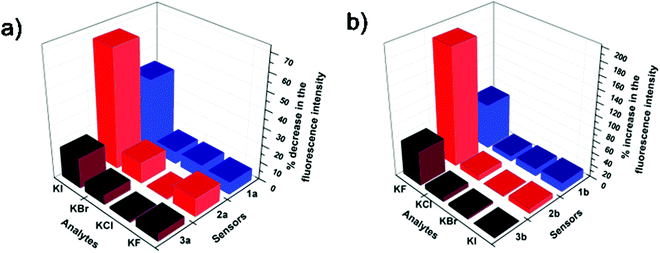
A comparison of the halide sensing abilities of the three probes in aq. DMSO and aq. methanol (Fig. 3) clearly indicates the superiority of the L-tyrosine based sensor over the L-phenylalanine based sensor in both fluoride and iodide sensing. Practically, these probes can be used to detect urinary iodine concentration, which is generally detected using a very complex Sandell–Koltoff method.12 The aq. methanolic solution of probes would be an easy way for the detection of urinary iodide concentrations. The aq. DMSO solution of these probes can also be used to detect fluoride ions in ground water as higher concentrations of fluoride can cause great damage to dental structures.13
 | ||
| Fig. 3 Comparison of halide sensing abilities of (a) 1a, 2a and 3a in aq. methanol and (b) 1b, 2b and 3b in aq. DMSO. | ||
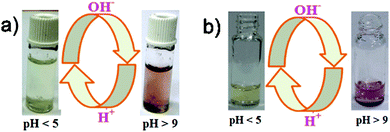
Apart from being flip-flop sensors, 1 and 2 also act as optical pH indicators. These are the first examples of flip-flop sensors also acting as pH indicators. The effect of pH on the absorption response of probes 1 and 2 in DMSO was analysed in the pH range of 2–14. At pH 2 the color of the DMSO solution of 1 and 2 is yellow and at pH greater than 9 it is pink (Fig. 4). A distinct change in the color with a change in pH that is visible to the naked eye clearly makes probe 1 a good contender for a broad range pH indicator, especially the intense color change from acidic pH to basic pH and vice versa (going from yellow to pink in color and vice versa).
The absorption spectrum of 1 at pH 9 shows a peak at 512 nm while this peak is not observed at pH 2 (Fig. S22, ESI†). Similarly, a peak at 574 nm in the absorption spectrum of basic solution of 2 diminishes at acidic pH (Fig. S23, ESI†). This variation in the absorption maxima of 1 and 2 is attributed to the change in the electronic distribution in the probe due to the positional effect of the nitro group.
This pH dependent change in color (Fig. 5) and the UV-vis absorption pattern (Fig. 6) were reversible even after several cycles of chronological alternative addition of HCl and NaOH. This suggests that both 1 and 2 in DMSO are reversible optical pH indicators. To verify the stability of the chromogenic sensor towards pH variation, its DMSO solution was adjusted back and forth between pH 5 and pH 9 with HCl and NaOH solutions, respectively. The corresponding UV pattern indicates the good sensitivity of the material towards pH switching (Fig. 6). The pH indicator is quite stable in this pH range. It is also clear that the pH of the medium can be switched to acidic and basic range several times repeatedly without much degradation of its changing chromogenic character.
 | ||
| Fig. 6 Reversible changes in the UV-absorption of DMSO solution of (a) probe 1 at 512 nm and (b) probe 2 at 574 nm. | ||
Similar to a few pH indicators reported earlier, indicators 1 and 2 also consist of both an acidic H-bond donor moiety and a basic H-bond acceptor moiety. The hydrogen bonding ability (or deprotonation/protonation ability) of the indicator may fine-tune its internal charge transfer (ICT) state responsible for the distinct color change.7e,f The attachment of a 4-nitrobenzyl group to L-tyrosine further enhances the effect, and thus the naked eye chromogenic effect can be ascribed to it.
A probable mechanism of the pH indicating behavior of 1 is summarized in Scheme 1. The pH of the creamish DMSO solution of H2Tyr-4-nitro (1) is ∼5. On addition of a base, the deprotonation of the carboxylic acid (more acidic than phenol) of the sensor takes place (pH ∼ 9) giving rise to a colorless solution. On further addition of the base, the pH rises above 9 and the solution turns pink due to the deprotonation of the phenolic group of the sensor. On the other hand, in an acidic DMSO solution (pH < 2), the amino group of 1 is protonated, generating a yellow color. The mechanism can be corroborated with the pKa values of tyrosine as well. In L-tyrosine, the pKa1 of the α-CO2H group is 2.20, pKa2 of the α-NH3+ group is 9.11 and the pKa of the phenolic group (sidechain) is 10.11. A similar mechanism for 2 is expected.
In conclusion, two new L-tyrosine derived fluorescent probes, H2Tyr-4-nitro (probe 1) and H2Tyr-3-nitro (probe 2), were synthesized and explored for their unique applications. Both the probes act as an iodide sensor in aq. methanol and a fluoride sensor in aq. DMSO. The homologous nature of the anion sensing abilities of 1 or 2 and its monosodium salt nullifies the role of sodium ion and strengthens the part played by the solvent. Fluoride sensing is accredited to the anion–π interaction and hydrogen bonding, whereas iodide sensing is via a hydrophobic cavity formation, which is supported by the NMR titrimetry and MM2 calculations, providing a clear understanding of the process. The positional effect of a nitro group in the benzyl part of the probes (para vs. meta) is evaluated as well. Using the same probe to detect two different anions by just changing the solvent of the solution makes these probes efficient, cost effective and multifunctional. In addition to this, both 1 and 2 in DMSO also act as reversible broad range optical pH indicators. An acid–base pH conversion or vice versa is clearly visible to the naked eye (yellow to pink or vice versa). This further adds another dimension to the multi-functionality of these probes.
Funding for this work was provided by IISER Mohali. N. K. is grateful to MHRD, India, for a research fellowship. Both fluorescence and NMR facilities at IISER Mohali are gratefully acknowledged.
Conflicts of interest
There are no conflicts to declare.Notes and references
- (a) Q. Tang, S. Liu, Y. Liu, J. Miao, S. Li, L. Zhang, Z. Shi and Z. Zheng, Inorg. Chem., 2013, 52, 2799–2801 CrossRef CAS; (b) S. A. El-Safty, A. A. Ismail, H. Matsunaga, T. Hanaoka and F. Mizukam, Adv. Funct. Mater., 2008, 18, 1485–1500 CrossRef CAS; (c) Y. Li, M. Ashizawa, S. Uchidaa and T. Michinobu, Polym. Chem., 2012, 3, 1996–2005 RSC; (d) D. Jiménez, R. Martínez-Máñez, F. Sancenón and J. Soto, Tetrahedron Lett., 2004, 45, 1257–1259 CrossRef; (e) I. H. Komatsu, D. Citterio, Y. Fujiwara, K. Minamihashi, Y. Araki, M. Hagiwara and K. Suzuki, Org. Lett., 2005, 7, 2857–2859 CrossRef; (f) D. Mikami, T. Ohki, K. Yamaji, S. Ishihara, D. Citterio, M. Hagiwara and K. Suzuki, Anal. Chem., 2004, 76, 5726–5733 CrossRef CAS; (g) M. Schmittel and H.-W. Lin, Angew. Chem., Int. Ed., 2007, 46, 893–896 CrossRef CAS.
- (a) R. M. Duke, E. B. Veale, F. M. Pfeffer, P. E. Krugerc and T. Gunnlaugsson, Chem. Soc. Rev., 2010, 39, 3936–3953 RSC; (b) T. Ema, K. Okuda, S. Watanabe, T. Yamasaki, T. Minami, N. A. Esipenko and P. Anzenbacher, Jr., Org. Lett., 2014, 16, 1302–1305 CrossRef CAS; (c) P. A. Gale and C. Caltagirone, Chem. Soc. Rev., 2015, 44, 4212–4227 RSC; (d) J. J. Lavigne and E. V. Anslyn, Angew. Chem., Int. Ed., 2001, 40, 3118–3130 CrossRef CAS.
- (a) J. Wu, B. Kwon, W. Liu, E. V. Anslyn, P. Wang and J. S. Kim, Chem. Rev., 2015, 115, 7893–7943 CrossRef CAS; (b) S. Goswami, S. Das, K. Aich, D. Sarkar and T. K. Mondal, Tetrahedron Lett., 2013, 54, 6892–6896 CrossRef CAS; (c) Z. Dong, X. Le, P. Zhou, C. Dong and J. Ma, New J. Chem., 2014, 38, 1802–1808 RSC; (d) D. Guo, Z. Dong, C. Luo, W. Zan, S. Yan and X. Yao, RSC Adv., 2014, 4, 5718–5725 RSC; (e) M. Kumar, N. Kumar and V. Bhalla, Chem. Commun., 2013, 49, 877–879 RSC.
- (a) M. H. Lee, J. S. Kim and J. L. Sessler, Chem. Soc. Rev., 2015, 44, 4185–4191 RSC; (b) B. Daly, J. Ling and A. P. de Silva, Chem. Soc. Rev., 2015, 44, 4203–4211 RSC; (c) B. T. Nguyen and E. V. Anslyn, Coord. Chem. Rev., 2006, 250, 3118–3127 CrossRef CAS; (d) H. Komatsu, T. Miki, D. Citterio, T. Kubota, Y. Shindo, K. Yoshichiro, K. Oka and K. Suzuki, J. Am. Chem. Soc., 2005, 127, 10798–10799 CrossRef CAS.
- A. Balamurugan, V. Kumar and M. Jayakannan, Chem. Commun., 2014, 50, 842–845 RSC.
- (a) P. S. Hariharan, N. Hari and S. P. Anthony, Inorg. Chem. Commun., 2014, 48, 1–4 CrossRef CAS; (b) P. Kumari, M. K. Bera, S. Malik and B. K. Kuila, ACS Appl. Mater. Interfaces, 2015, 7, 12348–12354 CrossRef CAS; (c) J.-A. Hua, Y. Zhao, Y.-S. Kang, Y. Lu and W.-Y. Sun, Dalton Trans., 2015, 44, 11524–11532 RSC.
- (a) J. Han and K. Burgess, Chem. Rev., 2010, 110, 2709–2728 CrossRef CAS; (b) L. Zhu, Z. Yuan, J. T. Simmons and K. Sreenath, RSC Adv., 2014, 39, 20398–20440 RSC; (c) A. J. Rodríguez, C. R. Zamarreño, I. R. Matías, F. J. Arregui, R. F. D. Cruz and D. A. May-Arrioja, Sensors, 2014, 14, 4060–4073 CrossRef; (d) T. Jokic, S. M. Borisov, R. Saf, D. A. Nielsen, M. Kühl and I. Klimant, Anal. Chem., 2012, 84, 6723–6730 CrossRef CAS; (e) X. He, S. Hu, K. Liu, Y. Guo, J. Xu and S. Shao, Org. Lett., 2006, 8, 333–336 CrossRef CAS; (f) A. Khorshidi, N. Mardazad and Z. Shaabanzadeh, Tetrahedron Lett., 2014, 55, 3873–3877 CrossRef CAS.
- N. Kumar, S. Khullar and S. K. Mandal, Dalton Trans., 2015, 44, 1520–1525 RSC.
- (a) R. M. Clark, B. J. Carey, T. Daeneke, P. Atkin, M. Bhaskaran, K. Latham, I. S. Cole and K. Kalantar-zadeh, Nanoscale, 2015, 7, 16763–16772 RSC; (b) E. P. Nguyen, B. J. Carey, C. J. Harrison, P. Atkin, K. J. Berean, E. D. Gaspera, J. Z. Ou, R. B. Kaner, K. Kalantar-zadeh and T. Daeneke, Nanoscale, 2016, 8, 16276–16283 RSC.
- (a) L. Li, Y. Ji and X. Tang, Anal. Chem., 2014, 86, 10006–10009 CrossRef CAS; (b) M. N. Abbas, A.-L. A. Radwan, G. A. Nawwar, N. Zine and A. Errachid, Anal. Methods, 2015, 7, 930–942 RSC; (c) D. Masih, S. M. Aly, E. Alarousu and O. F. Mohammed, J. Mater. Chem. A, 2015, 3, 6733–6738 RSC; (d) R. Patil, K. Tayade, S. K. Sahoo, J. Singh, N. Singh, D. Hundiwale and A. Kuwar, J. Mol. Recognit., 2014, 27, 683–688 CrossRef CAS.
- (a) P. Gamez, T. J. Mooibroek, S. J. Teat and J. Reedijk, Acc. Chem. Res., 2007, 40, 435–444 CrossRef CAS; (b) R. Frański, B. Gierczyk and G. Schroeder, J. Am. Soc. Mass Spectrom., 2009, 20, 257–262 CrossRef; (c) S. Chakravarty, Z. Sheng, B. Iverson and B. Moore, FEBS Lett., 2012, 586, 4180–4185 CrossRef CAS; (d) C. Garau, A. Frontera, D. Quinonero, P. Ballester, A. Costa and P. M. Deya, ChemPhysChem, 2003, 4, 1344–1348 CrossRef CAS; (e) G. Gil-Ramirez, E. C. Escudero-Adan, J. Benet-Buchholz and P. Ballester, Angew. Chem., Int. Ed., 2008, 47, 4114–4118 CrossRef CAS; (f) Y. S. Rosokha, S. V. Lindeman, S. V. Rosokha and J. K. Kochi, Angew. Chem., Int. Ed., 2004, 43, 4650–4652 CrossRef CAS; (g) P. deHoog, P. Gamez, I. Mutikainen, U. Turpeinen and J. Reedijk, Angew. Chem., 2004, 116, 5939–5941 CrossRef; (h) H. T. Chifotides and K. R. Dunbar, Acc. Chem. Res., 2013, 46, 894–906 CrossRef CAS; (i) D.-X. Wang and M.-X. Wang, J. Am. Chem. Soc., 2013, 135, 892–897 CrossRef CAS; (j) A. Robertazzi, F. Krull, E.-W. Knapp and P. Gamez, CrystEngComm, 2011, 13, 3293–3300 RSC; (k) B. L. Schottel, H. T. Chifotides and K. R. Dunbar, Chem. Soc. Rev., 2008, 37, 68–83 RSC.
- E. B. Sandell and I. M. Kolthoff, Microchim. Acta, 1937, 1, 9–25 CrossRef CAS.
- M. Kleerekoper, Endocrinol. Metab. Clin. North Am., 1998, 27, 441–452 CrossRef CAS.
Footnotes |
| † Electronic supplementary information (ESI) available: Experimental details, Fig. S1–S23, Tables S1–S12 and Schemes S1, S2. See DOI: 10.1039/d0ma00589d |
| ‡ Current address: Department of Chemistry and Biochemistry, University of California Los Angeles, 607 Charles E. Young Drive East Box 951569, Los Angeles, CA 90095-1569, USA. |
| This journal is © The Royal Society of Chemistry 2021 |


