Rapid separation and on-line detection by coupling high performance liquid chromatography with surface-enhanced Raman spectroscopy†
Wei Wang,
Minmin Xu*,
Qinghua Guo,
Yaxian Yuan*,
Renao Gu and
Jianlin Yao*
College of Chemistry, Chemical Engineering and Materials Science, Soochow University, Suzhou, 215123, China. E-mail: xumm@suda.edu.cn; yuanyaxian@suda.edu.cn; jlyao@suda.edu.cn
First published on 12th May 2015
Abstract
Rapid separation and detection of analytes have been the focus of a growing body of investigation for potential applications including food safety and environment science. However, the development of a robust analytical technique for simultaneous rapid separation and on-line detection remains a formidable challenge. Herein, we report a rational design based on the combination of high performance liquid chromatography (HPLC) and surface-enhanced Raman spectroscopy (SERS) for the rapid separation and on-line detection of multi-analytes. In particular, a plasmonic nanoparticle-modified capillary (NPMC) is fabricated through a self-assembly process and connected to a HPLC effluent-end port. After separation by HPLC, the analytes are adsorbed onto plasmonic nanoparticles in the capillary and then detected by SERS. The resulting HPLC-SERS coupled detection system can simultaneously achieve rapid separation and provide on-line molecular structural information of multi-analytes. In addition, we also demonstrate the on-line detection of a pesticide molecule (thiram) in an orange using this combined system. Importantly, the detection limit can be down to 10−7 mol L−1. These findings indicate that our coupled HPLC-SERS system offers a promising analytical technique in modern analytical science and technology.
Introduction
Since its discovery in 1971, high performance liquid chromatography (HPLC) has shown great promise in a broad range of applications, including the analysis of organometallic and metal coordination compounds in chemistry,1 detection of flavonoids in food safety,2 and analysis of glycoprotein carbohydrates in biochemistry.3 Generally, commercial HPLC detectors mainly include ultraviolet-visible detector (UVD), fluorescence detector (FD) and differential refractive index detector (RID). Despite their usefulness for qualitative analysis, these detectors cannot obtain the detailed structural information of an analyte or discriminate between analytes with highly similar molecular structures.4Alternatively, vibrational spectroscopy can provide detailed structural information for definitive analyte identification. Therefore, the on-line coupling of HPLC and vibrational spectroscopic techniques can not only be useful for analyte separation, but also for the identification of the analyte through its structural information. To date, the on-line coupling of liquid chromatography with several vibrational spectroscopic techniques, including Fourier transform infrared (FT-IR) and Raman spectroscopy (RS) analysis, has been successfully achieved.5–16 Although FT-IR and RS can effectively eliminate spectroscopic interferences and give fingerprint information of molecular structures, they suffer from relatively low detection sensitivity, thus limiting their use in the identification of trace amounts of analytes.
In the past few decades, surface enhanced Raman spectroscopy (SERS), which is capable of greatly amplifying the Raman signals of Raman-active molecules that are located at the near field of the plasmonic substrate surface, has emerged as a highly sensitive surface analytical tool for qualitatively and semi-quantitatively monitoring trace amounts of analytes.17–20 The first demonstration of detection by the combination of HPLC and SERS was reported by Freeman and coworkers,21 who obtained a linear response range between 100 ppb and 50 ppm, which significantly improved the sensitivity of normal Raman spectroscopy but with poor reproducibility and stability. In the follow-up experiments, the HPLC-SERS combination system was successfully used for the separation and detection of various analytes including purine bases,22,23 banned drugs,24,25 pesticides,26 and illicit drugs.27,28 However, most of the detection systems rely on off-line mode, thereby limiting further progress in rapid separation and detection.29,30 Therefore, the development of a simple approach that allows for simultaneous rapid separation and on-line detection of analytes is highly desirable.
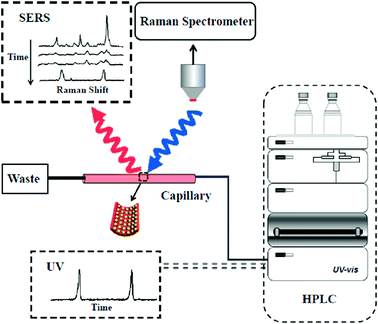
Herein, we developed a new on-line analysis technique for the rapid separation and detection of analytes by coupling HPLC with SERS (Scheme 1). A nanoparticle-modified capillary (NPMC) was first fabricated by self-assembly of plasmonic Au@Ag nanoparticles onto the inner wall of the capillary. Subsequently, the as-prepared NPMC was connected to a HPLC effluent-end port. Then, analytes were passed into the capillary, which served as a SERS-active substrate. The HPLC-SERS coupling system was employed for the rapid separation and on-line detection of multiple analytes, including pesticides.
Experimental section
General
(3-Aminopropyl)trimethoxysilane (APTMS, 97%) and tetramethylthiuram disulfide (thiram, 97%) were purchased from Alfa Aesar and Acros Organics, respectively. 1,4-Benzenedithiol (97%) was obtained from TCI Co., Ltd. Acetonitrile and methanol used in the HPLC system were of chromatographic purity. Other chemicals were of analytical reagent grade and used as received. Water purified with a Millipore system (≥18.2 MΩ cm) was used for all the experiments.Characterizations
Scanning electron microscopy (SEM) and transmission electron microscopy (TEM) images were recorded using a Hitachi S-4700 and TECNAI F30, respectively. UV-vis absorption measurements were carried out on a Cary 60 2.00 version spectrometer from Agilent.HPLC experiments were performed on an Agilent 1260 HPLC system, equipped with a manual injector, a Waters Sunfire C18 Column (5 μm, 4.6 × 150 mm2) and a DAD detector. The HPLC was controlled through the Agilent ChemStation software.
SERS experiments were carried out on a LabRam HR800 micro-Raman system from Horiba Jobin Yvon with a He–Ne laser source (632.8 nm). The objective magnification was 50× with a long focus distance of about 8 mm. The slit width was 100 μm and the confocal hole was 400 μm. The laser power on the sample was about 5 mW with full power on the active substrate after the laser irradiation.
Preparation of Au nanoparticles
Spherical gold nanoparticles with a diameter of 55 nm were synthesized according to Frens' approach.31 Typically, 100 mL of HAuCl4 (0.01 wt%) was added to a round-bottom flask (250 mL) and then heated to boiling with vigorous stirring. Subsequently, 0.75 mL of sodium citrate (1 w/v%) was quickly injected into the solution. The color of the solution changed from yellow to wine red within 3 min. After 15 min, the mixture was cooled to room temperature.Preparation of Au@Ag nanoparticles
The Au@Ag nanoparticles were synthesized through the method described in the literature with a slight modification.32 Briefly, 30 mL of the as-prepared 55 nm Au nanoparticles solution was mixed with 3 mL of ascorbic acid (0.1 mol L−1) in a round-bottom flask with vigorous stirring. Subsequently, 123 μL of silver nitrate (0.01 wt%) was diluted to 7 mL with water and then added into the above mentioned mixture at a speed of 28 mL h−1. The color of the solution changed from wine red to orange yellow, indicating the formation of the Ag shell. The mixture was stirred for another 30 min to obtain an Ag shell with a thickness of 7 nm.Preparation of SERS-active glass capillaries
The SERS-active capillary was prepared according to our previous publication.33 Capillaries (inside diameter: 0.8–1.1 mm, length: 90 mm) were first washed with aqua regia and hot piranha solution (H2SO4![[thin space (1/6-em)]](https://www.rsc.org/images/entities/char_2009.gif) :
:![[thin space (1/6-em)]](https://www.rsc.org/images/entities/char_2009.gif) H2O2 in a 7
H2O2 in a 7![[thin space (1/6-em)]](https://www.rsc.org/images/entities/char_2009.gif) :
:![[thin space (1/6-em)]](https://www.rsc.org/images/entities/char_2009.gif) 3 ratio by volume), followed by rinsing with water and drying under nitrogen gas. The cleaned glass capillaries were immersed in a 10−3 mol L−1 APTMS solution for 12 h to functionalize the inner surface with amino groups. After drying at 120 °C for 30 min, the resulting capillaries were filled with a concentrated solution containing Au or Au@Ag nanoparticles and were allowed to stand for 2 h to obtain NPMCs.
3 ratio by volume), followed by rinsing with water and drying under nitrogen gas. The cleaned glass capillaries were immersed in a 10−3 mol L−1 APTMS solution for 12 h to functionalize the inner surface with amino groups. After drying at 120 °C for 30 min, the resulting capillaries were filled with a concentrated solution containing Au or Au@Ag nanoparticles and were allowed to stand for 2 h to obtain NPMCs.
Combination of HPLC and SERS system
The effluent-end port of the Agilent 1260 system was connected to the NPMC through a Teflon pipe with a proper diameter. Firstly, 20 μL of sample solution was injected into the HPLC system. A mixture of CH3OH and H2O in 50![[thin space (1/6-em)]](https://www.rsc.org/images/entities/char_2009.gif) :
:![[thin space (1/6-em)]](https://www.rsc.org/images/entities/char_2009.gif) 50 ratio was used as the eluent. Samples were separated in the column by the eluent and passed to the HPLC DAD detector. A chromatogram was recorded with time. Each effluent liquid containing a compound then separately passed through the pipe and finally flowed to the NPMC, which was placed at the platform of the Raman system. SERS spectra were recorded every minute. It should be noted that a new capillary was used to replace the old one during the interval time of each compound to eliminate the memory effect.
50 ratio was used as the eluent. Samples were separated in the column by the eluent and passed to the HPLC DAD detector. A chromatogram was recorded with time. Each effluent liquid containing a compound then separately passed through the pipe and finally flowed to the NPMC, which was placed at the platform of the Raman system. SERS spectra were recorded every minute. It should be noted that a new capillary was used to replace the old one during the interval time of each compound to eliminate the memory effect.
Results and discussion
Synthesis and SERS investigation of NPMC
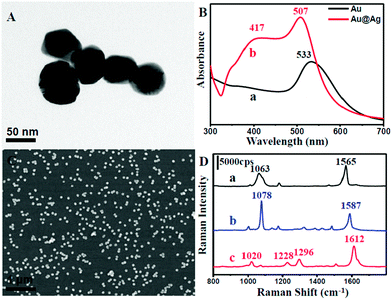
In a typical process, uniform spherical-shaped Au nanoparticles with an average diameter of 55 nm were first synthesized by a modified method (Fig. S1 in ESI†).31 Subsequently, an epitaxial growth was carried out to obtain an Ag shell on the surface of the Au core in the presence of ascorbic acid and AgNO3 solution. Fig. 1A displays a typical TEM image of the as-prepared Au@Ag nanoparticles. It could be observed that the diameter was about 70 nm, indicating that the shell thickness was around 7 nm. The Au@Ag core–shell structure was further confirmed by UV-vis absorption spectroscopy (Fig. 1B) and cyclic voltammetry (CV) analysis (Fig. S2†). The UV-vis spectra clearly indicate that a characteristic peak of Ag centred at 417 nm appears, suggesting the existence of Ag.34 Moreover, the absorption band at 533 nm shifted to 507 nm, which might be attributed to an incomplete encapsulation, that is, to shells containing pinholes on their surfaces. To further confirm this, we examined the CV of the as-prepared core–shell structure on a glassy carbon electrode (GC) in 0.5 mol L−1 of an aqueous solution of H2SO4 with a scan rate of 50 mV s−1 and scan range from −0.4 V to 1.6 V. As shown in Fig. S2,† a group of redox peaks at about 1.2 V and 0.8 V on the first cycle could be observed owing to the oxidation and reduction of Au, while Ag redox peaks were located at around 0.6 V and 0.3 V. With increasing the number of scanning laps, the Ag redox peaks became weaker and finally disappeared. This might be due to the collapse of the Ag shell on the core–shell nanoparticles under a high electric potential. This further revealed that the Au@Ag nanoparticles contained pinholes and they could serve as excellent SERS-active substrates owing to the strong coupling effect between the two metals.As mentioned above, the NPMC was prepared through a self-assembly procedure.33 The amine-functionalized silane was first employed to modify the inner surface of the capillaries. The Au@Ag nanoparticles were easily attached onto the inner surface of the capillaries through the strong interaction between NH2 group and metal surface, indicated by the colour change of the glass from transparent to orange yellow (Fig. S3†). To date, various approaches have been developed for depositing a metal film onto the inner wall of the capillaries.35–39 However, they often suffered from poor particle distribution and weak binding on the wall, thus influencing the detection performance. In stark contrast, our self-assembly method for the fabrication of NPMC can enable a SERS substrate with more uniform particle distribution (Fig. 1C). Significantly, nanoparticles have a stronger force due to strong bonding and do not easily drop-off when flushed by water.
We further evaluated the SERS activity of the NPMC. Three types of molecules (1,4-benzenedithiol, 4-aminothiophenol, and 4,4-bipyridine) were employed as Raman probes due to their well-documented Raman activity. Fig. 1D shows the SERS spectra of 1,4-benzenedithiol, 4-aminothiophenol, and 4,4-bipyridine with a concentration of 10−3 mol L−1 on the NPMC. From curve (a) in Fig. 1D, the high intense characteristic peaks of 1,4-benzenedithiol at 1565 cm−1 and 1063 cm−1 can be clearly observed, which correspond to CC stretching vibrations and sensitive stretching vibrations of the substituent on the benzene ring, respectively. Similarly, curve (b) and (c) exhibit strong intensity in the characteristic peak of 4-aminothiophenol (CS stretching vibration (1078 cm−1) and CC stretching vibration (1587 cm−1)), and 4,4-bipyridine (CC stretching vibration (1612 cm−1), ring CC stretch (1296 cm−1), CH in-plane bending (1228 cm−1) and pyridine ring breathing vibration (1020 cm−1)), respectively. These obtained SERS spectra unambiguously indicated that NPMC can serve as an excellent SERS substrate, thus paving an avenue for subsequent detection in HPLC-SERS systems.
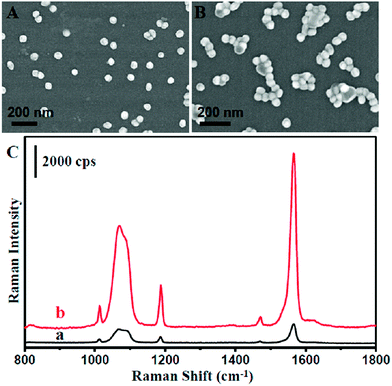
To maximize the SERS activity for high sensitivity detection, we further optimized the as-prepared NPMC. It is well known that the highest SERS activity originated from the Raman molecules located at the ‘hot spot’, which often occurred at the gaps of plasmonic nanoparticle aggregation due to the strong coupling between nanoparticles.40–44 An aqueous solution of NaCl was introduced to treat the NPMC. Consequently, the aggregation of Au@Ag nanoparticles occurred on the inner surface of the capillary, as shown in Fig. 2A and B. As anticipated, the SERS intensity was significantly improved after treating the as-prepared Au@Ag NPMC with an aqueous solution of NaCl compared to the untreated counterpart (Fig. 2C). We reasoned that the aggregation of Au@Ag nanoparticles on the capillary was induced by the halide ions.45,46 To validate our hypothesis, we next treated the capillary with a KCl aqueous solution (Fig. S4†). As a result, an aggregation of nanoparticles and improved SERS intensities were also observed after treatment with KCl solution. In addition, we calculated the SERS enhancement factor (EF) before and after the optimization according to the following equation:
| EF = (ISERS/Ibulk) × (Nbulk/Nsurf) |
As a result, the EF factor changed from 1.3 × 10⁵ to 6.9 × 10⁵. All this information suggests that halide ions play an important role in the aggregation of the nanoparticles on the capillary, thus boosts the SERS activity.
Separation and on-line detection of multi-analytes by HPLC-SERS combination system
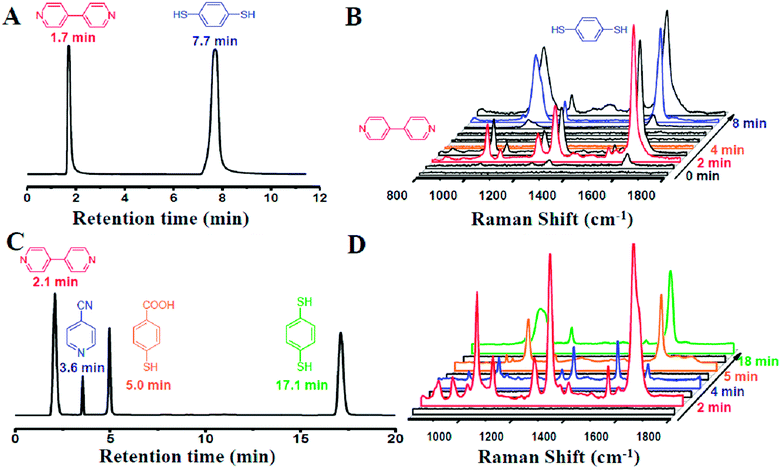
Our designed HPLC-SERS system relied on a plasmonic NPMC, which was connected to the effluent-end port of the HPLC by a Teflon pipe and served as a SERS substrate for detection, as illustrated in Scheme 1. In a typical process, samples were first injected into the HPLC system, which was followed by separation of different analytes by their different retention times when flowing through the column, and then they were adsorbed onto the nanoparticles in the capillary. Finally, the SERS spectra were recorded for the determination of different analytes.To investigate the capability of the HPLC-SERS system in separation and on-line detection of multi-analytes, we first injected a solution containing 4,4-bipyridine and 1,4-benzenedithiol with each concentration of 10−3 mol L−1 into the combined system. These two molecules were separated at the column by the eluent (CH3CN–H2O 50![[thin space (1/6-em)]](https://www.rsc.org/images/entities/char_2009.gif) :
:![[thin space (1/6-em)]](https://www.rsc.org/images/entities/char_2009.gif) 50) with a flow rate of 1 mL min−1. As shown in Fig. 3A, the retention time of 4,4-bipyridine and 1,4-benzenedithiol identified by the chromatogram were 1.7 min and 7.7 min, respectively.
50) with a flow rate of 1 mL min−1. As shown in Fig. 3A, the retention time of 4,4-bipyridine and 1,4-benzenedithiol identified by the chromatogram were 1.7 min and 7.7 min, respectively.
At 2 min, 4,4-bipyridine arrived firstly and adsorbed onto the surface of the NPMC. Strong characteristic SERS signals of 4,4-bipyridine could be observed (Fig. 3B). Subsequently, 1,4-benzenedithiol appeared into the NPMC. On a separate note, the two probes in the same capillary might cause a memory effect. The competitive adsorption of the two probes on the same substrate might result in complicated SERS signals, thereby limiting the detection. To overcome this problem, a new capillary was applied to the system at the interval of the two retention times at 4 min. At 8 min, we could clearly observe a characteristic SERS peak of 1,4-benzenedithiol (Fig. 3B). To further confirm it, we also tested another binary solution containing 4,4-bipyridine and 4-aminothiophenol with the eluent CH3CN–H2O (30![[thin space (1/6-em)]](https://www.rsc.org/images/entities/char_2009.gif) :
:![[thin space (1/6-em)]](https://www.rsc.org/images/entities/char_2009.gif) 70 v/v). In this 4,4-bipyridine and 4-aminothiophenol combined system, 4,4-bipyridine had a prolonged retention time due to the decreased ratio of acetonitrile in the eluent. Similarly, the strong SERS signals of 4,4-bipyridine and 4-aminothiophenol were detected at 3 min and 7 min, respectively (Fig. S5†).
70 v/v). In this 4,4-bipyridine and 4-aminothiophenol combined system, 4,4-bipyridine had a prolonged retention time due to the decreased ratio of acetonitrile in the eluent. Similarly, the strong SERS signals of 4,4-bipyridine and 4-aminothiophenol were detected at 3 min and 7 min, respectively (Fig. S5†).
In an attempt to probe the versatility of the HPLC-SERS system for rapid separation and on-line detection, we further used the system for four component analytes. A quaternary system containing 4,4-bipyridine, 4-cyanopyridine, 4-mercaptobenzoic acid and 1,4-benzenedithiol was chosen as the starting mixture of analytes. Inspiringly, these four molecules were well separated through the column in HPLC by CH3CN–H2O (50![[thin space (1/6-em)]](https://www.rsc.org/images/entities/char_2009.gif) :
:![[thin space (1/6-em)]](https://www.rsc.org/images/entities/char_2009.gif) 50 v/v), as evidenced by the results of the chromatogram shown in Fig. 3C. In addition, the strong SERS signals of each molecule could be clearly observed simultaneously at corresponding time (Fig. 3D). These results clearly proved the feasibility of our HPLC-SERS combination system for the rapid separation and on-line detection of multi-analytes.
50 v/v), as evidenced by the results of the chromatogram shown in Fig. 3C. In addition, the strong SERS signals of each molecule could be clearly observed simultaneously at corresponding time (Fig. 3D). These results clearly proved the feasibility of our HPLC-SERS combination system for the rapid separation and on-line detection of multi-analytes.
HPLC-SERS system for thiram detection
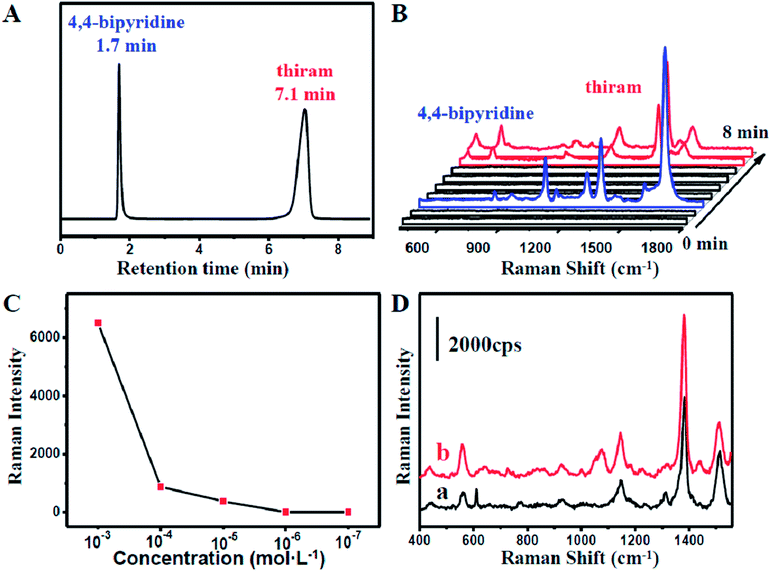
Nowadays, the health problems caused by the abuse of pesticides have aroused widespread concern. The excessive use of pesticides has stimulative effects on skin and mucosa. Therefore, monitoring of pesticides and the residues is of great significance in modern food safety and environment science. Tetramethylthiuram disulfide (thiram) is one of the commonly used pesticides.The capability of our coupled HPLC-SERS system in the separation and detection offers an opportunity for monitoring the pesticides in a mixture. Tentative experiments on the extraction and on-line detection of a mixture, including thiram and 4,4-bipyridine, were performed. As shown in Fig. 4A, the thiram molecules were successfully separated from 4,4-bipyridine molecules. Moreover, strong characteristic SERS signals (Fig. S6†) were recorded at 8 min when the thiram molecules with injecting concentrations higher than 10−5 mol L−1 passed into the capillary from the HPLC system (Fig. 4B). This further indicated that our coupled HPLC-SERS system could be applicable to on-line thiram detection under a sample concentration higher than 10−5 mol L−1 (Fig. S7†). In comparison, negligible SERS signals of thiram with the HPLC sample concentration lower than 10−5 mol L−1 could be detected during a short period after the thiram molecules flowed into the capillary (Fig. 4C). To further improve the SERS intensity, the effluent liquid containing thiram molecules was maintained for about 5 min in the NPMC for incubation. Interestingly, obvious SERS signals could be detected by the capillary in some hot spot areas. Significantly, the detection limit could be as low as 10−7 mol L−1, as shown in Fig. 4D.
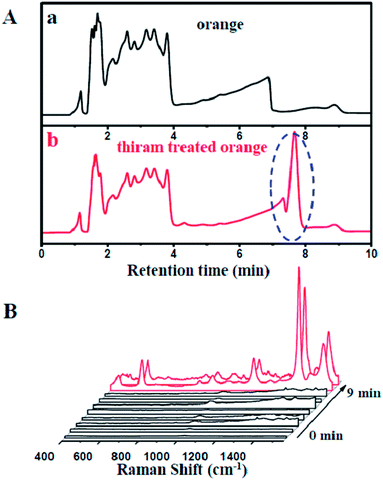
To shed more light on the rapid separation and on-line detection of our coupled HPLC-SERS system, we employed a thiram-treated orange as a testing sample. A fresh orange was acquired from the market and a part of the orange peel was extracted directly by methanol (Fig. S8†), followed by treatment with thiram solution. As shown in Fig. 5A, the thiram molecules could be effectively separated from the orange at around 7 min. Moreover, strong SERS signals of the thiram molecules could be clearly observed (Fig. 5B). It was demonstrated that the HPLC-SERS coupling system could significantly be utilized for the effective separation and on-line detection of compounds in real samples.
Conclusions
In conclusion, we have developed a novel analytical tool by coupling HPLC with SERS spectroscopic analysis for the rapid separation and on-line detection of multi-analytes. By taking advantages of the effective separation by HPLC and highly sensitive detection by SERS analysis, we demonstrated that our coupled HPLC-SERS system could be used for thiram monitoring with a detection limit of 10−7 mol L−1. Our investigation suggests that this combined HPLC-SERS system offers a new exciting opportunity for the rapid separation and structural recognition of complex samples in food science and environmental monitoring.Acknowledgements
This project is financially supported by the National Nature Science Foundation of China (nos 21033007, 21173155, 21303115 and 21473118), the National Instrumentation Program (2011YQ031240402). The partial financial support from a Project Funded by the Priority Academic Program Development of Jiangsu Higher Education Institutions (PAPD). Natural Science Foundation of Jiangsu Province (BK2012187), the Natural Science Fundamental Research Project of Jiangsu Colleges and Universities (12KJD150011) are gratefully acknowledged. We also thank Dr Sanyang Han for his helpful discussion.Notes and references
- B. R. Willeford and H. Veening, J. Chromatogr. A, 1982, 251, 61–88 CrossRef CAS.
- H. M. Merken and G. R. Beecher, J. Agric. Food Chem., 2000, 48, 577–599 CrossRef CAS PubMed.
- K. R. Anumula, Anal. Biochem., 2006, 350, 1–23 CrossRef CAS PubMed.
- J. C. Lindon, J. K. Nicholson and J. D. Wilson, J. Chromatogr. B: Biomed. Sci. Appl., 2000, 748, 233–258 CrossRef CAS.
- M. Holtz, P. K. Dasgupta and G. Zhang, Anal. Chem., 1999, 71, 2934–2938 CrossRef CAS.
- R. J. Dijkstra, A. N. Bader, G. P. Hoornweg, U. A. T. Brinkman and C. Gooijer, Anal. Chem., 1999, 71, 4575–4579 CrossRef CAS.
- J. J. Gagel and K. Biermann, Anal. Chem., 1987, 59, 1266–1272 CrossRef CAS.
- J. Yang and P. R. Griffiths, Proc. SPIE, 1993, 2089, 336–337 CAS.
- A. J. Lange and P. R. Griffiths, Appl. Spectrosc., 1993, 47, 403–410 CrossRef CAS.
- A. J. Lange, P. R. Griffiths and D. J. J. Frase, Anal. Chem., 1991, 63, 782–787 CrossRef CAS.
- A. H. Dekmezian and T. Morioka, Anal. Chem., 1989, 61, 458–461 CrossRef CAS.
- M. A. Castles, L. V. Azarraga and L. A. Carreira, Appl. Spectrosc., 1986, 40, 673–680 CrossRef CAS.
- M. W. Raynor, K. D. Bartle and B. W. Cook, J. High Resolut. Chromatogr., 1992, 15, 361–366 CrossRef CAS PubMed.
- J. A. J. Jansen, Fresenius' J. Anal. Chem., 1990, 337, 398–402 CrossRef CAS.
- A. M. Robertson, D. Farnan, D. Littlejohn, M. Brown, C. J. Dowle and E. Goodwin, Anal. Proc., 1993, 30, 268–271 CAS.
- M. M. Mottaleb, B. G. Cooksey and D. Littlejohn, Fresenius' J. Anal. Chem., 1997, 358, 536–538 CrossRef CAS.
- K. Kneipp, Y. Wang, H. Kneipp, L. Perelman, I. Itzkan, R. R. Dasari and M. S. Feld, Phys. Rev. Lett., 1997, 78, 1667–1670 CrossRef CAS.
- J. F. Li, Y. F. Huang, Y. Ding, Z. L. Yang, S. B. Li, X. S. Zhou, F. R. Fan, W. Zhang, Z. Y. Zhou, D. Y. Wu, B. Ren, Z. L. Wang and Z. Q. Tian, Nature, 2010, 464, 392–395 CrossRef CAS PubMed.
- S. M. Nie and S. Emory, Science, 1997, 275, 1102–1106 CrossRef CAS PubMed.
- X. M. Qian and S. M. Nie, Chem. Soc. Rev., 2008, 37, 912–920 RSC.
- R. D. Freeman, R. M. Hammaker, C. E. Meloan and W. G. Fateley, Appl. Spectrosc., 1988, 42, 456–460 CrossRef CAS.
- R. Sheng, F. Ni and T. M. Cotton, Anal. Chem., 1991, 63, 437–442 CrossRef CAS.
- C. Carrillo-Carrion, S. Armenta, B. M. Simonet, M. Valcarcel and B. Lendl, Anal. Chem., 2011, 83, 9391–9398 CrossRef CAS PubMed.
- L. M. Cabalin, A. Ruperez and J. J. Laserna, Talanta, 1993, 40, 1741–1747 CrossRef CAS.
- L. M. Cabalin, A. Ruperez and J. J. Laserna, Anal. Chim. Acta, 1996, 318, 203–210 CrossRef CAS.
- C. Carrillo-Carrion, B. M. Simonet, M. Valcarcel and B. Lendl, J. Chromatogr. A, 2012, 1225, 55–61 CrossRef CAS PubMed.
- B. Sägmüller, B. Schwarze, G. Brehm, G. Trachta and S. Schneider, J. Mol. Struct., 2003, 661, 279–290 CrossRef.
- G. Trachta, B. Schwarze, B. Sägmüller, G. Brehm and S. Schneider, J. Mol. Struct., 2004, 693, 175–185 CrossRef CAS PubMed.
- S. A. Soper, K. L. Ratzlaff and T. Kuwana, Anal. Chem., 1990, 62, 1438–1444 CrossRef CAS.
- F. Ni, L. Thomas and T. M. Cotton, Anal. Chem., 1989, 61, 888–894 CrossRef CAS.
- G. Frens, Nature Phys. Sci., 1973, 241, 20–22 CrossRef CAS PubMed.
- B. H. Liu, G. M. Han, Z. P. Zhang, R. Y. Liu, C. L. Jiang, S. H. Wang and M. Y. Han, Anal. Chem., 2012, 84, 255–261 CrossRef CAS PubMed.
- W. W. Wang, Q. H. Guo, M. M. Xu, Y. X. Yuan, R. A. Gu and J. L. Yao, J. Raman Spectrosc., 2014, 45, 736–744 CrossRef CAS PubMed.
- J. Rodriguez-Fernandez, J. Perez-Juste, F. J. G. de Abajo and L. M. Liz-Marzan, Langmuir, 2006, 22, 7007–7010 CrossRef CAS PubMed.
- M. Mohebbi, R. Fedosejevs, V. Gopal and J. A. Harrington, Appl. Opt., 2002, 41, 7031–7035 CrossRef CAS.
- H. K. Park, J. K. Yoon and K. Kim, Langmuir, 2006, 22, 1626–1629 CrossRef CAS PubMed.
- J. W. Lee, H. B. Lee, K. Kim and K. S. Shin, Anal. Bioanal. Chem., 2010, 397, 557–562 CrossRef CAS PubMed.
- J. W. Lee, K. Kim and K. S. Shin, Vib. Spectrosc., 2010, 53, 121–125 CrossRef CAS PubMed.
- Y. B. Guo, M. K. Khaing Oo, K. Reddy and X. D. Fan, ACS Nano, 2012, 6, 381–388 CrossRef CAS PubMed.
- K. Kneipp, H. Kneipp, R. Manoharan, I. Itzkan, R. R. Dasari and M. S. Feld, Bioimaging, 1998, 6, 104–110 CrossRef CAS.
- A. M. Michaels, J. Jiang and L. E. Brus, J. Phys. Chem. B, 2000, 104, 11965–11971 CrossRef CAS.
- H. X. Xu, E. J. Bjerneld, M. Kall and L. Borjesson, Phys. Rev. Lett., 1999, 83, 4357–4360 CrossRef CAS.
- K. Kneipp, H. Kneipp, R. R. Dasari and M. S. Feld, Indian J. Phys., 2003, 7B, 39–47 Search PubMed.
- K. A. Willets and R. P. Van Duyne, Annu. Rev. Phys. Chem., 2007, 58, 267–297 CrossRef CAS PubMed.
- A. M. Michaels, M. Nirmal and L. E. Brus, J. Am. Chem. Soc., 1999, 121, 9932–9939 CrossRef CAS.
- K. A. Bosnick, J. Jiang and L. E. Brus, J. Phys. Chem. B, 2002, 106, 8096–8099 CrossRef CAS.
Footnote |
| † Electronic supplementary information (ESI) available. See DOI: 10.1039/c5ra05562h |
| This journal is © The Royal Society of Chemistry 2015 |

