Hydrogenated black TiO2 nanowires decorated with Ag nanoparticles as sensitive and reusable surface-enhanced Raman scattering substrates†
Yufeng Shanab,
Yong Yang*ab,
Yanqin Caoab,
Hao Yinc,
Nguyen Viet Longab and
Zhengren Huangab
aState Key Laboratory of High Performance Ceramics and Superfine Microstructures, Shanghai Institute of Ceramics, Chinese Academy of Sciences, 1295 Dingxi Road, Shanghai 200050, China. E-mail: yangyong@mail.sic.ac.cn; Fax: +86-21-52414219; Tel: +86-21-52414321
bGraduate School of the Chinese Academy of Sciences, Beijing, China
cShanghai Youlan Electronic Technology Co, Ltd, 350 Xianxia Road, Shanghai 200050, China
First published on 30th March 2015
Abstract
Recently, surface-enhanced Raman scattering (SERS) has been the subject of great interest because of its ultrasensitive, rapid and nondestructive analysis, detection, and imaging. Highly sensitive, stable and recyclable substrates are of great importance in fulfilling the practical potential of the technique in various fields, such as trace analysis, diagnosis and criminal investigation. In this work, we introduce wafer-scale Ag-modified hydrogenated black TiO2 nanowires as active SERS substrate by hydrogenation. The Ag/H–TiO2 NWs substrates deliver a relative enhancement factor of up to ∼102 compared with the substrate before hydrogenation and a detection limitation improved by at least three orders of magnitude compared with R6G detection. Moreover, hydrogenated TiO2/Ag also exhibits outstanding stability, and is recyclable by self-cleaning under UV irradiation. The excellent SERS performance is ascribed to the abundant surface electronic states induced by the hydrogenated amorphous layers and trivalent titanium, and more photogenerated charge carriers may contribute to the chemical and electromagnetic enhancement. The relative standard deviation (RSD) value for Raman signals less than 0.15 confirms the reproducibility of the hydrogenated composite SERS substrate. Therefore, the hybrid SERS substrates have great advantages in self-cleaning, reproducibility and stability, making them promising candidates for sensitive and recyclable SERS detection.
1. Introduction
Surface-enhanced Raman scattering (SERS) has been extensively explored in analysis, chemistry, and biology as a fast and ultrasensitive technique for nondestructive acquisition of structural information from chemical and biological molecules.1–7 Noble metals (mainly Au and Ag) are well-known SERS-active substrates and enhance the Raman scattering resulting from the localized surface plasma resonance significantly. However, metal substrates have disadvantages, such as high cost, low stability, and lack of reusability, that have greatly limited their applications for SERS sensors. Moreover, most of the synthetic techniques, such as vacuum evaporation, nanosphere lithography, and electron beam lithography, that are used to fabricate metal nanostructures with sufficiently high SERS activity to meet practical demands are technologically challenging, expensive and produce disposable sensors.8Recent studies on semiconductor-noble metal nanocomposites showed that they are effective for creating highly stable, recyclable, cheap and easy to prepare substrates. In particular, semiconductors such as TiO2 and ZnO have received intense interest because they are photocatalytically self-cleaning, which makes the SERS substrate recyclable.9–13 In addition, it is generally accepted that semiconductors themselves also contribute to the SERS activity by the charge-transfer (CT) mechanism, namely semiconductor-induced chemical enhancement related to the surface state energy level.12,14–17 However, the chemical enhancement of semiconductor-based SERS substrates is still considerably weaker than that of metals, and there are inefficient hot spots ascribed to the large gaps in the noble metal nanomaterial. Recently, to overcome these problems, more attention has been paid to the modification and modulation of the morphology, structure, electronic state, and pattern of semiconductors.2,10,18,19
In this work, we present SERS-active substrates with TiO2 nanowires (NWs)/Ag nanoparticle (NP) composites on a Ti mesh scaffold. Hydrogenation was used to modulate the electronic states as well as the photoresponse of TiO2. Although a wide variety of techniques are available to achieve hydrogenated TiO2,20–22 the controllable solid-state reaction of NaBH4 and crystalline TiO2 is a facile general hydrogenation method for large-scale production.23 Hydrogenated TiO2 nanomaterials exhibit enhanced light absorption and significantly improved photocatalysis resulting from disordered surface layers,20,24 and even trivalent Ti ions or oxygen vacancies in the TiO2 lattice, which produce extra electronic states near the conduction band minimum (CBM) and valence band maximum (VBM).21,25 These abundant and varied surface states of hydrogenated TiO2 are favorable for TiO2-to-molecule CT and TiO2-to-Ag NP CT,19 as illustrated in Fig. 1. Electrons are excited from the valence band to surface states near the conduction band in TiO2 by laser irradiation, and they then migrate to organic molecules or Ag NPs leading to increased contributions to chemical and electromagnetic enhancement. As a result, a larger increase in the Raman signal can be achieved on composites of hydrogenated TiO2 NWs and Ag NPs. Moreover, because the standard electrode potential for the Ti4+/Ti3+ balanced half reaction is −0.092 V, which is much more negative than that for Ag2O/Ag (+0.342 V), the Ag NPs would be chemically protected by Ti3+ and not be degraded, prolonging the substrate lifetime. Furthermore, SERS substrates are usually disposable and non-recyclable;26–28 therefore, it is desirable to develop a reusable SERS substrate to save money and conserve resources. Here, we will present a hybrid SERS substrate for SERS sensors in practical applications that exhibits great advantages in sensitivity, recyclability, and stability.
2. Experimental section
2.1. Materials and instruments
The 100 mesh titanium scaffold (250 μm thick) was purchased from Shanghai Youlan Electronic Technology Co., Ltd. Analytical grade anhydrous glucose, NaOH, AgNO3, NaBH4, R6G and titanium nanocrystalline powders were supplied by Aladdin Co., Ltd and were used as received without further purification. The as-prepared substrates were characterized with a FEI Sirion 200 field emission scanning electron microscope (FESEM) with an accelerating voltage of 10.0 kV. Transmission electron microscopy (TEM) and high-resolution TEM images were obtained on a JEOL JEM-2100F field emission source transmission electron microscope with an accelerating voltage of 200 kV. UV-vis diffuse reflectance spectra were recorded on a PE lambda 950 spectrometer. Photoluminescence emission (PL) spectra were measured on a Fluoromax-4 (Horiba Jobin Yvon) spectrofluorometer. A Bruker EPR ELEXSY 500 spectrometer was used to obtain the electron paramagnetic resonance (EPR) spectra. SERS spectra were collected on an inVia Raman microscope (Renishaw) with an excitation wavelength of 514 nm at a laser power of 1% (full power of 30 mW) and a thermal dispersive spectrometer equipped with a 532 nm laser at a laser power of 2 mW. The photocatalysis experiments were conducted by exposing the substrate to a 500 W high-pressure mercury lamp, and the distance from the substrate to the light source was about 10 cm.2.2. Synthesis of TiO2 NWs on a Ti mesh scaffold
Commercial Ti wire mesh is covered with a dense carbon coating, and must be washed alternately with dilute hydrofluoric acid and sodium hydroxide solution to acquire a clean, burnished Ti mesh. A single-crystalline TiO2 scaffold on the Ti mesh scaffold was synthesized by a literature method.29,30 Typically, a 2 × 2 cm piece of Ti mesh was placed on the bottom of a 50 mL Teflon-lined pressure vessel with aqueous 2.5 M NaOH (30 mL). After the vessel was heated at 150 °C for 15 h, sodium titanate nanowires spread over the Ti mesh skeleton. The Ti mesh covered with nanowires was immersed in aqueous 1 M HCl for 1 h to exchange Na+ with H+ and convert the sodium titanate nanowires to hydrogen titanate nanowires. Finally, the mesh was rinsed with deionized (DI) water and heated at 450 °C for 2 h to obtain TiO2 nanowires on the Ti mesh scaffold.2.3. Deposition of Ag NPs on TiO2 NWs
The Ag NPs were deposited on the TiO2 nanowires by the reduction of [Ag(NH3)2]+ with glucose. First, dilute ammonia solution was added dropwise to AgNO3 solution until it turned transparent. The final concentration of Ag+ was adjusted to 0.1 M. Second, a piece of scaffold substrate was immersed in this solution for 30 min to reach the adsorption–desorption equilibrium of [Ag(NH3)2]+ ions. The substrate was dried under a flow of N2, and then dipped in DI water for 30 s. The substrate was placed in glucose solution (30 mL) and heated in a water bath at 50 °C for 1 h to obtain TiO2 NWs decorated with Ag NPs (TiO2 NWs/Ag NPs) on a Ti mesh scaffold.2.4. Hydrogenation of Ag NPs/TiO2 NW scaffold
The substrate was cut into two pieces, and one of them was sealed in a quartz tube under vacuum with NaBH4 (0.5 g) and was calcinated at 300 °C for 3 h. The as-obtained substrate was rinsed thoroughly with DI water three times to remove excess NaBH4, and allowed to dry under ambient conditions. Two substrates (with or without hydrogenation) were compared to investigate the effect of hydrogenation on the SERS properties.3. Results and discussion
SEM images were used to determine the morphology of TiO2 NWs derived from Ti mesh grid with or without hydrogenation. Fig. 2a shows the Ti mesh grid treated by the alkaline hydrothermal method. Each titanium wire with a length of ∼100 μm is woven into a net and covered with a fuzzy layer of TiO2 NWs. The tough irregular surface shown in Fig. 2b suggests a 3D stacked structure of nanowires, which is favorable for loading more Ag nanoparticles and improving sensitivity of the substrates in trace analysis. Fig. 2c reveals uniform nanowires with an average diameter of about 20 nm. Hydrogenation thickened the TiO2 NWs from 30 to 40 nm in diameter, as shown in Fig. 2d.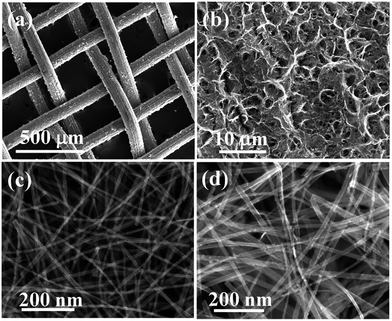 | ||
| Fig. 2 SEM images: (a) Ti mesh scaffold coated with TiO2 NWs, (b) 3D TiO2 NW nanostructures, (c) TiO2 NWs, and (d) hydrogenated TiO2 NWs. | ||
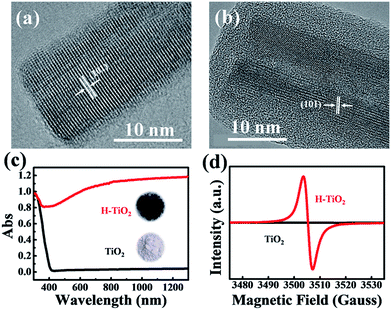
To explore the morphology and structural evolution during hydrogenation treatment, high-resolution TEM (HRTEM) images were obtained (Fig. 3a and b). Before hydrogenation, the as-prepared TiO2 NWs with a diameter of about 15 nm exhibited excellent crystallinity and a clean surface, as shown by the unambiguous fringes. The distance between the adjacent lattice planes was 0.376 nm, indicating a (101) facet of the anatase phase. However, the hydrogenation generated a unique structure of a crystalline core coated with an amorphous shell. The fringes were indistinct and a thick amorphous layer (∼4 nm) covered the TiO2 NWs. The phase of the single crystal core was still anatase TiO2, as shown by the spacing of the exposed crystallographic plane. The diameter of the nanowire increased to ∼27 nm, probably because of the deformation and destruction of the crystal lattice and the appearance of the amorphous layer.
For convenience, to characterize the physical properties of the TiO2 NWs, a large amount of TiO2 NWs were prepared from titanium nanopowders by alkaline hydrothermal treatment, where the reaction conditions and subsequent processing procedure were exactly the same as that of Ti mesh grids. Fig. 3c presents the UV-vis-NIR absorption spectra of hydrogenated and non-hydrogenated TiO2 NWs. The original TiO2 NWs possess an absorption edge at 400 nm, corresponding to 3.1 eV, which is the typical bandgap absorption edge of nano anatase TiO2. However, the hydrogenated TiO2 (H–TiO2) NWs have an absorption edge extended to ∼500 nm and significantly increased light absorption from 400 nm to the near infrared region. This is in good agreement with the color change of the nanowires from white to black, as indicated by the inset photographs in Fig. 3c. Highly sensitive electron paramagnetic resonance (EPR; detection limit up to 10−8 M) was used to examine unpaired electrons. Fig. 3d shows the EPR signals of TiO2 NWs and the corresponding hydrogenated product. No resonance peaks in TiO2 were observed, indicating no detectable Ti3+ species. After hydrogenation with NaBH4, an intense EPR signal of H–TiO2 at g = 1.998 appears. The g values are attributed to the paramagnetic oxygen vacancies  and Ti3+ species originating from the reduction of Ti4+ by H atoms.23 Many reports have shown that both disordered surface layers and trivalent titanium ions increase light absorption for the following reasons. (1) Hydrogen atoms in the amorphous layers can interact strongly with the Ti 3d and O 2p electrons, leading to a considerable contribution to the mid-gap electronic states between the valence band maximum (VBM) and conduction band minimum (CBM).31,32 (2) The surface lattice disorder caused by hydrogenation induces a tail state band and causes an upward shift of the VBM to narrow the bandgap of TiO2.20,24,33 (3) Ti3+ and oxygen vacancies bring in CBM tails from Ti3+ 3d1 and VBM tails from O 2p states.34 These abundant surface states lead to a longer life time for light-excited e–h pairs and promote an effective electron transfer to adsorbed molecules or Ag nanoparticles, which can be verified by the photoluminescence (PL) measurements (Fig. S1†).
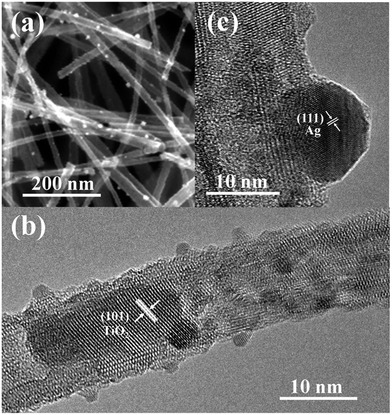
The morphology and structure of Ag-modified TiO2 NWs scaffold were also investigated by SEM and TEM. The SEM image in Fig. 4a shows that Ag NPs coated the TiO2 nanowires, similar to many reports of metal NP deposition on nanoarrays.10,35,36 Discrete Ag nanoparticles with a low distribution density cannot create hot spots generated by closely adjacent nanoparticles. However, we focused on the effect on the SERS activity of the hydrogenation of substrate. Fig. 4b shows a TEM image of a single Ag-modified NW remover from the Ti mesh scaffold substrate by ultrasonic oscillation, and small nanoparticles are closely attached to the surface of TiO2 NWs. Fig. 4c gives a high-resolution TEM (HRTEM) image of an Ag NP, which belonged to a (111) facet of cubic-phase Ag, based on the spacing of adjacent fringes.
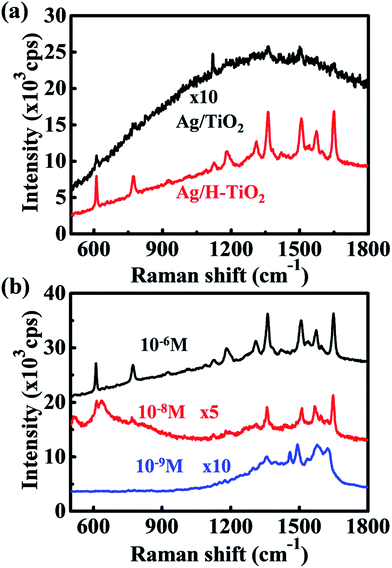
The widely used efficient bio-indicator, R6G, was selected as a probe molecule to evaluate the SERS-activity of the as-prepared substrates.37 To achieve sufficient coverage of a monolayer on the Ag and TiO2 surface, the substrates were immersed in R6G ethanol solution of different concentrations for 30 min, and then washed and dried under ambient conditions. Fig. 5a presents the SERS spectra of Ag/TiO2 NWs and Ag/H–TiO2 NWs collected under the same test conditions. For the Ag/TiO2 NW substrate, only several sporadic peaks located at 610, 1120, 1361 and 1501 cm−1 were distinguished. Most of the characteristic vibration bands were drowned in the fluorescent background of R6G, which indicates only a small proportion of the adsorbed R6G molecules on the limited number of hot spots contributed to the SERS. However, the hydrogenated Ag/H–TiO2 substrate displayed significantly enhanced Raman peaks for the R6G molecule with a better signal-to-noise ratio. The relative enhancement factor (EF) of Ag/H–TiO2 to Ag/TiO2 was calculated to be ∼102. In the literature, the absolute EF describes an important aspect of the SERS substrate performance for comparison with other SERS substrates. Here, the absolute EF was also evaluated to be ∼1 × 10⁸, and details of the calculation method based on Fig. S2 are presented in the ESI.† The SERS performance of the H–TiO2/Ag composite substrate exceeded that of other recent results,38 where hot spots generated by closely packed Ag NPs are predominant. Fig. 5b shows the SRES spectra of R6G adsorbed on Ag/H–TiO2 NWs from ethanol solutions with various concentrations. The Raman peaks of R6G were still clearly visible, even when the analyte solution was diluted to 10−9 M. Meanwhile, Fig. S3† shows a dilute solution with a concentration as low as 10−7 M. None of the Raman peaks of R6G were observed on the Ag/TiO2 NW substrate. Therefore, the hydrogenated TiO2 NWs/Ag scaffold demonstrated greatly improved sensitivity and increased detection limits. The hot spots originating from single Ag nanoparticles discretely grown on TiO2 NWs are inadequate for making the TiO2/Ag scaffold a sensitive SERS substrate; however, hydrogenation is an effective method for activating the limited hot spots by adding more photogenerated electrons to the Fermi sea of Ag NPs, enabling powerful chemical enhancement by promoting more electron-to-molecule migration. The enhancement of the CT-dominated Ag/H–TiO2 substrates is comparable or even superior to that of the reported Ag/TiO2 substrates resulting from the nano-gaps between Ag NPs inducing hot spots in the literature.39,40
As most metal-based SERS substrates are non-recyclable, searching for reusable substrates is important for reducing consumption of resources and costs for practical applications. Hydrogenated TiO2 NWs, which have excellent photocatalytic properties, in our SERS substrate, endow our substrates with better recyclability. After the substrates were analyzed by SERS, they were immersed in deionized water and irradiated with a 500 W high-pressure mercury lamp for 10 min to accomplish self-cleaning. The cleaned substrate could be used again to detect dye molecules. Fig. 6 shows the results of the reversible SERS behavior of the Ag/H–TiO2 composite NWs over three cycles. After UV light irradiation, R6G was detected from the Ag/H–TiO2 substrate. Because the degradation products are small molecules, including CO2 and H2O, which can be removed from the substrate by washing, the SERS substrate was free of contamination. Fig. S4† indicates that although the substrate was reused at least 16 times to detect R6G molecules, no obvious signal loss of the Raman spectra was detected.
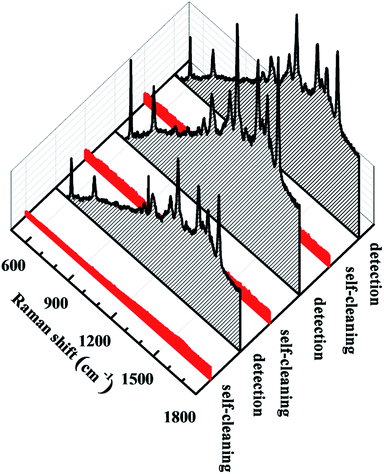 | ||
| Fig. 6 Raman spectra of R6G recorded over three cycles indicating the reversible SERS behavior of the Ag/H–TiO2 NW substrate. | ||
The mechanism of the photocatalytic process is illustrated in Fig. S5.† Under UV irradiation, electron–hole pairs are generated in TiO2 NWs by the transition of the valence electrons to the conduction band, and the photogenerated electrons migrate to Ag NPs through the Ag/H–TiO2 interface.41,42 When electrons are scavenged by molecular oxygen to produce reactive oxygen radicals and holes are captured by H2O molecules to form hydroxyl radicals (HO˙), organic molecules will react with these oxidizing agents and be degraded to small inorganic molecules like CO2 and H2O. The large number of surface states induced by the amorphous layer and trivalent titanium in the Ag/H–TiO2 substrate allow the separation and transfer of electron–hole pairs. Furthermore, the strong interaction between Ag nanoparticles and TiO2 NWs (Fig. 4) would inhibit the recombination of the excited electrons and holes, and increase the photocatalytic performance of the substrate.
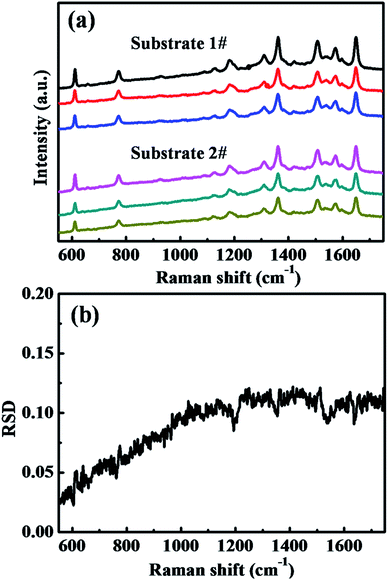
Reproducibility is another crucial factor for evaluating SERS performance. To confirm that the composite substrates of hydrogenated TiO2 and Ag NPs show reproducible and stable SERS performance, two separate substrates (substrates 1 and 2) prepared via the same treatment were measured. Fig. 7a shows the Raman spectra of R6G molecules, randomly collected from three different locations on each substrate. The relative standard deviation (RSD) of the major Raman peaks is an effective parameter for evaluating the reproducibility of the SERS signals, and Fig. 7b shows the corresponding RSD spectrum derived from these Raman spectra in Fig. 7a.43 All the calculations are based on the raw SERS spectra and no data preprocessing, including background removal, was observed. The maximum RSD value for both of the major SERS peaks and spectrum background was less than 0.15, indicating that the Ag/H–TiO2 substrates also have good reproducibility and stability for SERS applications. In addition, we also compared the SERS activity of composite substrates prepared at least 6 months ago with that of the newly prepared substrate (Fig. S6†). The SERS spectra of 10−6 M R6G on the freshly prepared sample and on the sample stored for at least 6 months showed that no significant change in Raman intensity occurred in the SERS spectra obtained on the substrate stored for 6 months, which confirms the stability of our SERS substrates.
4. Conclusions
Wafer-scale TiO2 nanowires on a Ti mesh scaffold deposited with dispersive spherical Ag nanoparticles were synthesized. Hydrogenation by a facile and versatile NaBH4 method was used to obtain a hydrogenated TiO2 NWs/Ag SERS substrate. The hydrogenated TiO2 NWs/Ag scaffold suggests a new strategy to realize the preparation of a SERS substrate with greatly improved sensitivity. Hydrogenation is an effective method for boosting the light harvesting efficiency, including visible and near infrared light, by introducing amorphous shells and trivalent titanium, which generates abundant mid-gap electronic states between the VBM and CBM. More electrons are photo-excited and transferred to molecules or Ag NPs to promote both chemical and electromagnetic enhancement. The as-prepared Ag/H–TiO2 NW substrates deliver a relative enhancement factor of up to ∼102 compared with the non-hydrogenated substrate, and the detection limit was improved by at least three orders of magnitude. Moreover, our experiments have confirmed that Ag/H–TiO2 composites also have self-cleaning properties and are stable and give reproducible results. Therefore our hybrid SERS substrates have superior sensitivity, recyclability, reproducibility and stability as SERS sensors for practical applications.Acknowledgements
This study was supported by a fund from the National Natural Science Foundation of China (NSFC, Contract no. 51471182).Notes and references
- D. Qi, L. Lu, L. Wang and J. Zhang, J. Am. Chem. Soc., 2014, 136, 9886–9889 CrossRef CAS PubMed.
- J. Ni, R. J. Lipert, G. B. Dawson and M. D. Porter, Anal. Chem., 1999, 71, 4903–4908 CrossRef CAS.
- X. Qian, J. Li and S. Nie, J. Am. Chem. Soc., 2009, 131, 7540–7541 CrossRef CAS PubMed.
- W.-H. Hsiao, H.-Y. Chen, Y.-C. Yang, Y.-L. Chen, C.-Y. Lee and H.-T. Chiu, ACS Appl. Mater. Interfaces, 2011, 3, 3280–3284 CAS.
- Y. Yang, Z.-Y. Li, K. Yamaguchi, M. Tanemura, Z. Huang, D. Jiang, Y. Chen, F. Zhou and M. Nogami, Nanoscale, 2012, 4, 2663–2669 RSC.
- Y. Yang, M. Tanemura, Z. Huang, D. Jiang, Z.-Y. Li, Y.-P. Huang, G. Kawamura, K. Yamaguchi and M. Nogami, Nanotechnology, 2010, 21, 325701 CrossRef PubMed.
- Y. Yang, J. Shi, T. Tanaka and M. Nogami, Langmuir, 2007, 23, 12042–12047 CrossRef CAS PubMed.
- Z. Dai, G. Wang, X. Xiao, W. Wu, W. Li, J. Ying, J. Zheng, F. Mei, L. Fu and J. Wang, J. Phys. Chem. C, 2014, 118(39), 22711–22718 CAS.
- X. Li, H. Hu, D. Li, Z. Shen, Q. Xiong, S. Li and H. J. Fan, ACS Appl. Mater. Interfaces, 2012, 4, 2180–2185 CAS.
- E.-Z. Tan, P.-G. Yin, T.-T. You, H. Wang and L. Guo, ACS Appl. Mater. Interfaces, 2012, 4, 3432–3437 CAS.
- X. Jiang, X. Li, X. Jia, G. Li, X. Wang, G. Wang, Z. Li, L. Yang and B. Zhao, J. Phys. Chem. C, 2012, 116, 14650–14655 CAS.
- G. Sinha, L. E. Depero and I. Alessandri, ACS Appl. Mater. Interfaces, 2011, 3, 2557–2563 CAS.
- Z. Mao, W. Song, L. Chen, W. Ji, X. Xue, W. Ruan, Z. Li, H. Mao, S. Ma and J. R. Lombardi, J. Phys. Chem. C, 2011, 115, 18378–18383 CAS.
- X. Wang, W. Shi, G. She and L. Mu, Phys. Chem. Chem. Phys., 2012, 14, 5891–5901 RSC.
- L. Yang, X. Jiang, W. Ruan, B. Zhao, W. Xu and J. R. Lombardi, J. Phys. Chem. C, 2008, 112, 20095–20098 CAS.
- A. Musumeci, D. Gosztola, T. Schiller, N. M. Dimitrijevic, V. Mujica, D. Martin and T. Rajh, J. Am. Chem. Soc., 2009, 131, 6040–6041 CrossRef CAS PubMed.
- L. Yang, X. Jiang, W. Ruan, J. Yang, B. Zhao, W. Xu and J. R. Lombardi, J. Phys. Chem. C, 2009, 113, 16226–16231 CAS.
- X. Hu, G. Meng, Q. Huang, W. Xu, F. Han, K. Sun, Q. Xu and Z. Wang, Nanotechnology, 2012, 23, 385705 CrossRef PubMed.
- L. Yang, Y. Zhang, W. Ruan, B. Zhao, W. Xu and J. R. Lombardi, J. Raman Spectrosc., 2010, 41, 721–726 Search PubMed.
- X. Chen, L. Liu, Y. Y. Peter and S. S. Mao, Science, 2011, 331, 746–750 CrossRef CAS PubMed.
- A. Naldoni, M. Allieta, S. Santangelo, M. Marelli, F. Fabbri, S. Cappelli, C. L. Bianchi, R. Psaro and V. Dal Santo, J. Am. Chem. Soc., 2012, 134, 7600–7603 CrossRef CAS PubMed.
- X. Jiang, Y. Zhang, J. Jiang, Y. Rong, Y. Wang, Y. Wu and C. Pan, J. Phys. Chem. C, 2012, 116, 22619–22624 CAS.
- H. Tan, Z. Zhao, M. Niu, C. Mao, D. Cao, D. Cheng, P. Feng and Z. Sun, Nanoscale, 2014, 6, 10216–10223 RSC.
- X. Chen, L. Liu, Z. Liu, M. A. Marcus, W.-C. Wang, N. A. Oyler, M. E. Grass, B. Mao, P.-A. Glans and Y. Y. Peter, Sci. Rep., 2013, 3, 1510 Search PubMed.
- W. Wang, Y. R. Ni, C. H. Lu and Z. Z. Xu, RSC Adv., 2012, 2, 8286–8288 RSC.
- W. Smith, Chem. Soc. Rev., 2008, 37, 955–964 RSC.
- I. Yoon, T. Kang, W. Choi, J. Kim, Y. Yoo, S.-W. Joo, Q.-H. Park, H. Ihee and B. Kim, J. Am. Chem. Soc., 2008, 131, 758–762 CrossRef PubMed.
- H. Chen, Y. Wang and S. Dong, J. Raman Spectrosc., 2009, 40, 1188–1193 CrossRef CAS PubMed.
- X. Peng and A. Chen, Adv. Funct. Mater., 2006, 16, 1355–1362 CrossRef CAS PubMed.
- J. M. Baik, M. H. Kim, C. Larson, X. Chen, S. Guo, A. M. Wodtke and M. Moskovits, Appl. Phys. Lett., 2008, 92, 242111 CrossRef PubMed.
- Z. Wang, C. Yang, T. Lin, H. Yin, P. Chen, D. Wan, F. Xu, F. Huang, J. Lin and X. Xie, Adv. Funct. Mater., 2013, 23, 5444–5450 CrossRef CAS PubMed.
- J. Lu, Y. Dai, H. Jin and B. Huang, Phys. Chem. Chem. Phys., 2011, 13, 18063–18068 RSC.
- L. Liu, Y. Y. Peter, X. Chen, S. S. Mao and D. Shen, Phys. Rev. Lett., 2013, 111, 065505 CrossRef.
- Y. Zhao, T. Hou, Y. Li, K. S. Chan and S.-T. Lee, Appl. Phys. Lett., 2013, 102, 171902 CrossRef PubMed.
- E. Galopin, J. Barbillat, Y. Coffinier, S. Szunerits, G. Patriarche and R. Boukherroub, ACS Appl. Mater. Interfaces, 2009, 1, 1396–1403 CAS.
- S. Deng, H. Fan, X. Zhang, K. P. Loh, C. Cheng, C. Sow and Y. Foo, Nanotechnology, 2009, 20, 175705 CrossRef CAS PubMed.
- Y. Peng, L. Qiu, C. Pan, C. Wang, S. Shang and F. Yan, Electrochim. Acta, 2012, 75, 399–405 CrossRef CAS PubMed.
- H. Fang, C. X. Zhang, L. Liu, Y. M. Zhao and H. J. Xu, Biosens. Bioelectron., 2015, 64, 434–441 CrossRef CAS PubMed.
- L. He, D. Riassetto, P. Bouvier, L. Rapenne, O. Chaix-Pluchery, V. Stambouli and M. Langlet, J. Photochem. Photobiol., A, 2014, 277, 1–11 CrossRef CAS PubMed.
- Y. Zhao, L. Sun, M. Xi, Q. Feng, C. Jiang and H. Fong, ACS Appl. Mater. Interfaces, 2014, 6, 5759–5767 CAS.
- Y. Zhou, J. Chen, L. Zhang and L. Yang, Eur. J. Inorg. Chem., 2012, 3176–3182 CrossRef CAS PubMed.
- Y. Zheng, L. Zheng, Y. Zhan, X. Lin, Q. Zheng and K. Wei, Inorg. Chem., 2007, 46, 6980–6986 CrossRef CAS PubMed.
- Z. Y. Bao, D. Y. Lei, R. Jiang, X. Liu, J. Dai, J. Wang, H. L. Chan and Y. H. Tsang, Nanoscale, 2014, 6, 9063–9070 RSC.
Footnote |
| † Electronic supplementary information (ESI) available: Photoluminescent spectra, SERS spectra collected on Ag/TiO2 NWs, schematic diagram of the photocatalytic mechanism, and EF calculation method. See DOI: 10.1039/c5ra04352b |
| This journal is © The Royal Society of Chemistry 2015 |


