
 Open Access Article
 This Open Access Article is licensed under a Creative Commons Attribution-Non Commercial 3.0 Unported Licence
Electrical properties of Sb2O3-modified BiScO3–PbTiO3-based piezoelectric ceramics
Long Xueab,
Qian Weic,
Zujian Wangb,
Xiaoming Yangb,
Xifa Long b and
Chao He*b
b and
Chao He*b
aCollege of Chemistry and Materials Science, Fujian Normal University, Fuzhou, 350117, China
bKey Laboratory of Optoelectronic Materials Chemistry and Physics, Fujian Institute of Research on the Structure of Matter, Chinese Academy of Sciences, Fuzhou, 350002, China. E-mail: hehcao@fjirsm.ac.cn
cInstitute of Acoustics, Chinese Academy of Sciences, Beijing, 100190, China
First published on 2nd April 2020
Abstract
Compared with pure Pb-based perovskite ferroelectric materials, BiMeO3–PbTiO3 (Me = Sc3+, In3+, and Yb3+) systems have remarkable advantages in their Curie temperatures. As a member of this group, the BiScO3–PbTiO3 (BS–PT) solid solution has drawn considerable attention from scientists for its high Curie temperature and excellent piezoelectric coefficient. However, BS–PT ceramics still have some shortcomings, such as high dielectric loss and low mechanical quality factor, which make them unsuitable for high-temperature applications. Herein, we report the effect of the addition of complex ions on the electrical properties of BS–PT ceramics. Sb2O3-doped 0.36BiScO3–0.64PbTi0.97Fe0.03O3 + 1 mol% MnO2 (BS–PTFMn + x% Sb2O3) ceramics were fabricated and their electrical properties were studied. BS–PTFMn + 0.75% Sb2O3 had an optimal piezoelectric coefficient, exhibiting  which indicates that Sb2O3 doping can improve the piezoelectric properties of the BS–PT ceramics, exhibiting a “soft” effect of Sb2O3 doping. In addition, the thermal depolarization temperature (Td) of BS–PTFMn + 0.75% Sb2O3 ceramics remained above 300 °C, such as 325 °C for BS–PTFMn + 0.75% Sb2O3. It was concluded that the piezoelectric properties of BS–PT ceramics were enhanced by the addition of Sb2O3.
1. Introduction
High-temperature piezoelectric materials have received unprecedented attention due to the urgent demand for high-temperature piezoelectric sensors and actuators in aerospace, automobile, oil and gas exploration fields.1–3 The commercial lead–zirconium–titanium (PZT) piezoelectric ceramics have been studied for decades and are widely used in piezoelectric sensors and transducers due to their outstanding piezoelectric properties, such as d33 = 285 pC N−1 for PZT-4, d33 = 375 pC N−1 for PZT-5A.4 Nevertheless, their curie temperatures, TC, are below 380 °C.5,6 It is generally believed that the safe usage temperature range cannot exceed half of the Curie temperature in bulk PZT-based piezoelectric materials because of the depolarization caused by the thermal activation. Therefore, the traditional PZT-based piezoelectric ceramics cannot be used in the environments above 200 °C.4,5 This is far from enough for today's industrial demands. Therefore, the development of new high-temperature-stable piezoelectric materials is an extremely urgent need.In 2001, Eitel Richard first reported Bi(Me)O3–PbTiO3 (Me = Sc, In, Yb, Mg/Ti, Fe and Ga) systems, which have a perovskite structure and high Curie temperature.7–12 Among them, BiScO3–PbTiO3 (BS–PT) ceramics have drawn considerable attention because of their large piezoelectric coefficient (d33 = 460 pC N−1) and high Curie temperature (TC = 450 °C) near the morphotropic phase boundary (MPB), and have a good application prospect at high temperatures.13,14 However, the thermal degradation of BS–PT ceramics occurs at 250 °C, which limits their applications at high temperatures.15,16 Moreover, BS–PT ceramics have a high dielectric loss, resulting in high energy consumption and heat dissipation in the use of high-power electronic devices.17
Previously, numerous studies were involved in controlling the reduction of dielectric loss, improving the electrical properties and thermal stability by the addition of a third element,18–20 such as Pb(Mg1/3Nb2/3)O3 (PMN), BaTiO3 (BT), and Pb(Mn1/3Sb2/3)O3 (PMS). It is reported that the defects and oxygen vacancies generated by the multi-valence elements, such as Mn and Fe, can diffuse to the domain boundaries and reduce the total energy of the ceramics, leading to the pinning behavior of the motion of 180° domain and effective reduction of the dielectric loss.17,21 Chen et al. reported that 0.36BiScO3–0.64Pb(Ti0.97Fe0.03)O3 + 1 mol% MnO2 ceramics exhibited a high Curie temperature (TC = 492 °C) and low dielectric loss (tan![[thin space (1/6-em)]](https://www.rsc.org/images/entities/char_2009.gif) δ = 0.006).21 Unfortunately, its d33 significantly deteriorated (d33 = 238 pC N−1) and the dielectric constant significantly decreased (εr = 815). Mixed Mn and Sb elements are usually used to modify commercial PZT-based piezoelectric ceramics because the mixed Mn and Sb can synchronously enhance kp, Qm, εr, and d33.22–24 Therefore, in this study, Sb2O3 was added to 0.36BiScO3–0.64Pb(Ti0.97Fe0.03)O3 + 1 mol% MnO2 ceramics. The effects of Sb2O3 content doping on the phase structure, dielectric, piezoelectric, ferroelectric and electromechanical coupling properties of 0.36BiScO3–0.64Pb(Ti0.97Fe0.03)O3 + 1 mol% MnO2 ceramics were investigated.
δ = 0.006).21 Unfortunately, its d33 significantly deteriorated (d33 = 238 pC N−1) and the dielectric constant significantly decreased (εr = 815). Mixed Mn and Sb elements are usually used to modify commercial PZT-based piezoelectric ceramics because the mixed Mn and Sb can synchronously enhance kp, Qm, εr, and d33.22–24 Therefore, in this study, Sb2O3 was added to 0.36BiScO3–0.64Pb(Ti0.97Fe0.03)O3 + 1 mol% MnO2 ceramics. The effects of Sb2O3 content doping on the phase structure, dielectric, piezoelectric, ferroelectric and electromechanical coupling properties of 0.36BiScO3–0.64Pb(Ti0.97Fe0.03)O3 + 1 mol% MnO2 ceramics were investigated.
2. Experimental procedure
2.1 Sample preparation
In this study, 0.36BiScO3–0.64Pb(Ti0.97Fe0.03)O3 + 1 mol% MnO2 + x mol% Sb2O3 (x = 0, 0.25, 0.5, 0.75, 1, and 1.5) (BS–PTFMn + x% Sb2O3) were prepared by a conventional solid-state method. The oxide powders, Bi2O3 (99.5%), Sc2O3 (99.99%), PbO (99.9%), TiO2 (99.5%), Sb2O3 (99.5%), Fe2O3 (99.5%) and MnO2 (99.5%), were accurately weighed and mixed according to the desired stoichiometric compositions. In addition, 3 wt% excess Bi2O3 was added to compensate for the volatilization of bismuth at high temperatures. The weighed powder was put into an agate grinding tank with an agate ball and anhydrous ethanol as the ball-mill medium for the ball milling. The ball milling was used with a planetary ball mill for 24 hours. After ball-milling, the mixed powder was dried, pressed into blocks and placed in a crucible, and calcined at 750 °C for 4 h. The calcination of blocks can reduce the distance of the powders, which is conducive to matter diffusion, the uniformity of a reaction and the reduction in the calcination temperature and time. Then, small amounts of MnO2 and Sb2O3 were added to the calcined mixture and ground in alcohol for 24 hours. After drying, the calcined powders were granulated with 5% polyvinyl alcohol binder (PVA) and then pressed into pellets of 10 mm in diameter and 1 mm in thickness under 200 MPa. The green pellets were heated at 550 °C for 4 h to remove PVA. Furthermore, the green pellets were placed in an Al2O3 crucible and sintered at 1000–1100 °C for 3 h, while embedded in the calcined powders for preventing the evaporation of Bi and Pb.2.2 Characterization methods
The crystalline phase of sintered samples was analyzed using an X-ray diffractometer (Miniflex 600, Rigaku, Japan) with Cu-Kα1, Kα2 mixing radiation, operating at 40 kV and 40 mA, in the 2θ range of 10–60° with a step size of 0.05° and 0.5 s per step. The fractured surface morphologies of the obtained ceramic samples were characterized by scanning electron microscopy (SEM, SU8010, Hitachi, Japan). The sintered samples were polished to the thickness of 0.5 mm, and then coated with a silver paste for electrical characterization. The samples were placed in a silicon oil at 120 °C and poled for 20 min under a DC electric field of 40 kV cm−1. The electrical properties of poled samples were tested after placement for 24 h. The piezoelectric coefficients d33 were measured using a quasi-static d33 meter (Institute of Acoustics, Chinese Academy of Sciences, model ZJ-4AN). The planar electromechanical coupling factor (kp) and the mechanical quality factor (Qm) were calculated according to the resonance and anti-resonance methods using an impedance analyzer (E4990A, Agilent Technologies, USA). The dielectric constant (εr) and dielectric loss (tanδ) as functions of temperature were also measured using the impedance analyzer. The polarization–electric field (P–E) hysteresis loops, current–electric field (I–E) loops and strain–electric field (S–E) curves were obtained using an aix-ACCT TF2000 analyzer with a frequency of 1 Hz. The resistivity of ceramics was measured using an electrometer/high resistance meter (Keithley 6517B, USA).
3. Results and discussion
3.1 Structure and phase analysis
Fig. 1(a) shows the XRD patterns of sintered ceramic samples with different Sb2O3 contents. All the samples presented a pure perovskite structure without any clear trace of impurity phases, indicating stable perovskite solid solutions. Since the radii of Fe3+ ion (0.645 Å for CN = 6) and Mn3+ ion (0.645 Å for CN = 6) are similar to Ti4+ radius (0.605 Å for CN = 6), Fe3+ and Mn3+ were likely to replace Ti4+ in BO6 octahedral perovskite structures.25 In addition, though Sb is a multivalent element, more Sb5+ can be formed in the sintering process. It is expected that Sb5+ will most likely enter into the B-site to substitute Ti4+ because the radius of Sb5+ ion (0.60 Å for CN = 6) is close to that of Ti4+ ion (0.605 Å for CN = 6). Moreover, oxygen vacancies can be formed in Fe3+ and Mn3+ doped BS–PT ceramics due to the substitution of Ti4+ with low ionic valence (Fe3+ as an example: ).21 Therefore, the BS–PT ceramics can maintain charge neutrality after Sb2O3 doping. It also can be seen that the ceramic samples gradually transformed from a tetragonal phase to a rhombohedral phase as Sb2O3 doping increased (Fig. 1(a)). In order to clearly observe the view of (002)c diffraction peaks in the range of 2θ = 43–46°, it was enlarged as shown in Fig. 1(b). It is intuitively revealed that there was a phase transition. In addition, the lattice parameters calculated using Jade 5.0 based on the XRD results are shown in Fig. 1(c). It can be seen that the c/a value continuously decreases from 1.03 to 1 with the increase in the Sb2O3 content, also clearly confirming the phase transition. A similar change in structure was found in Sb-doped PMN–PT ceramics.26 The diffraction index (hkl) labeled in Fig. 1 refers to the cubic perovskite structure.
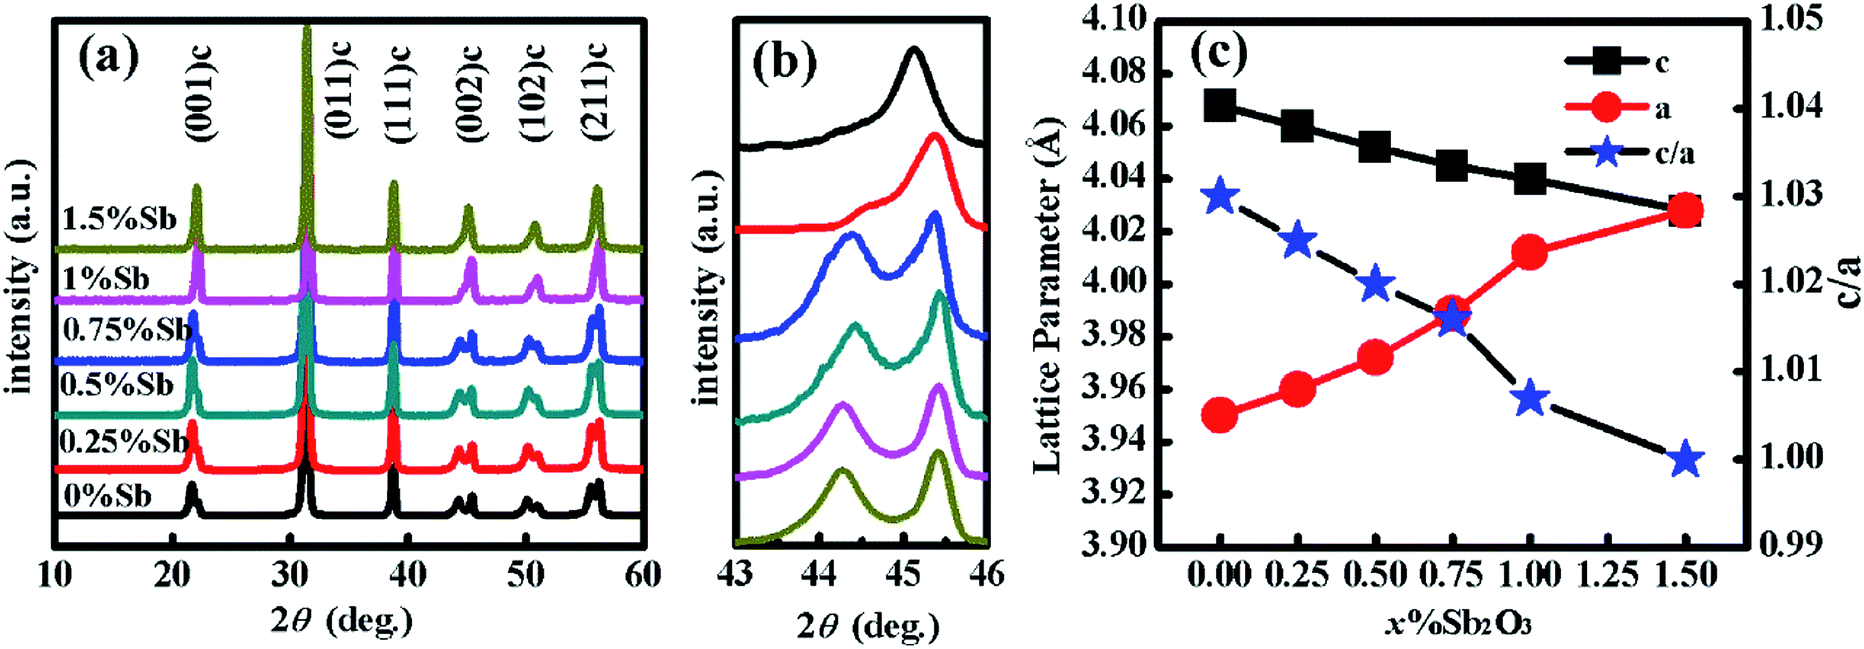 | ||
| Fig. 1 (a) XRD patterns of BS–PTFMn + x% Sb2O3 ceramics. (b) The enlarged view of XRD patterns at 2θ = 43–46. (c) Lattice parameters as function of Sb2O3 content. | ||
Fig. 2 shows the SEM images of the fractured surface of BS–PTFMn + x% Sb2O3 ceramics with different Sb2O3 contents. These images clearly show the grain and grain boundary of ceramic samples without any holes, indicating that the samples were well-sintered and have high densities. It can be easily seen that the average grain size (d) of an undoped sample is about 10 μm. However, the average grain size rapidly decreased from 10 μm to 2 μm with the increase in Sb2O3 incorporation. The detailed grain size is listed in Table 1. Clearly, grain growth can be controlled by the addition of Sb2O3. The Sb ions could not be completely dissolved into the solid solution as the doping amount of Sb2O3 increased to 1.5% in this study. The extra Sb2O3 diffused into the grain boundary, which prevented the movement of the grain boundary during the sintering process and hindered the growth of grain, leading to the reduction of grain size of Sb-doped samples.27 Therefore, the average grain size decreased rapidly at this composition. In addition, the Archimedes method was used to calculate the actual density (ρ1) of ceramic samples, while the theoretical density (ρ2) was calculated based on the XRD data. The calculated results showed that the relative density (ρr) of ceramic samples was 96.5–98.6%, indicating a high density of ceramic samples. The results are listed in Table 1. The density of the ceramic samples reached the maximum at x = 0.75 with a grain size of 5.0 μm. The interlayer and porosity were created when extra Sb2O3 diffused into the grain boundary, such as x = 1.50.
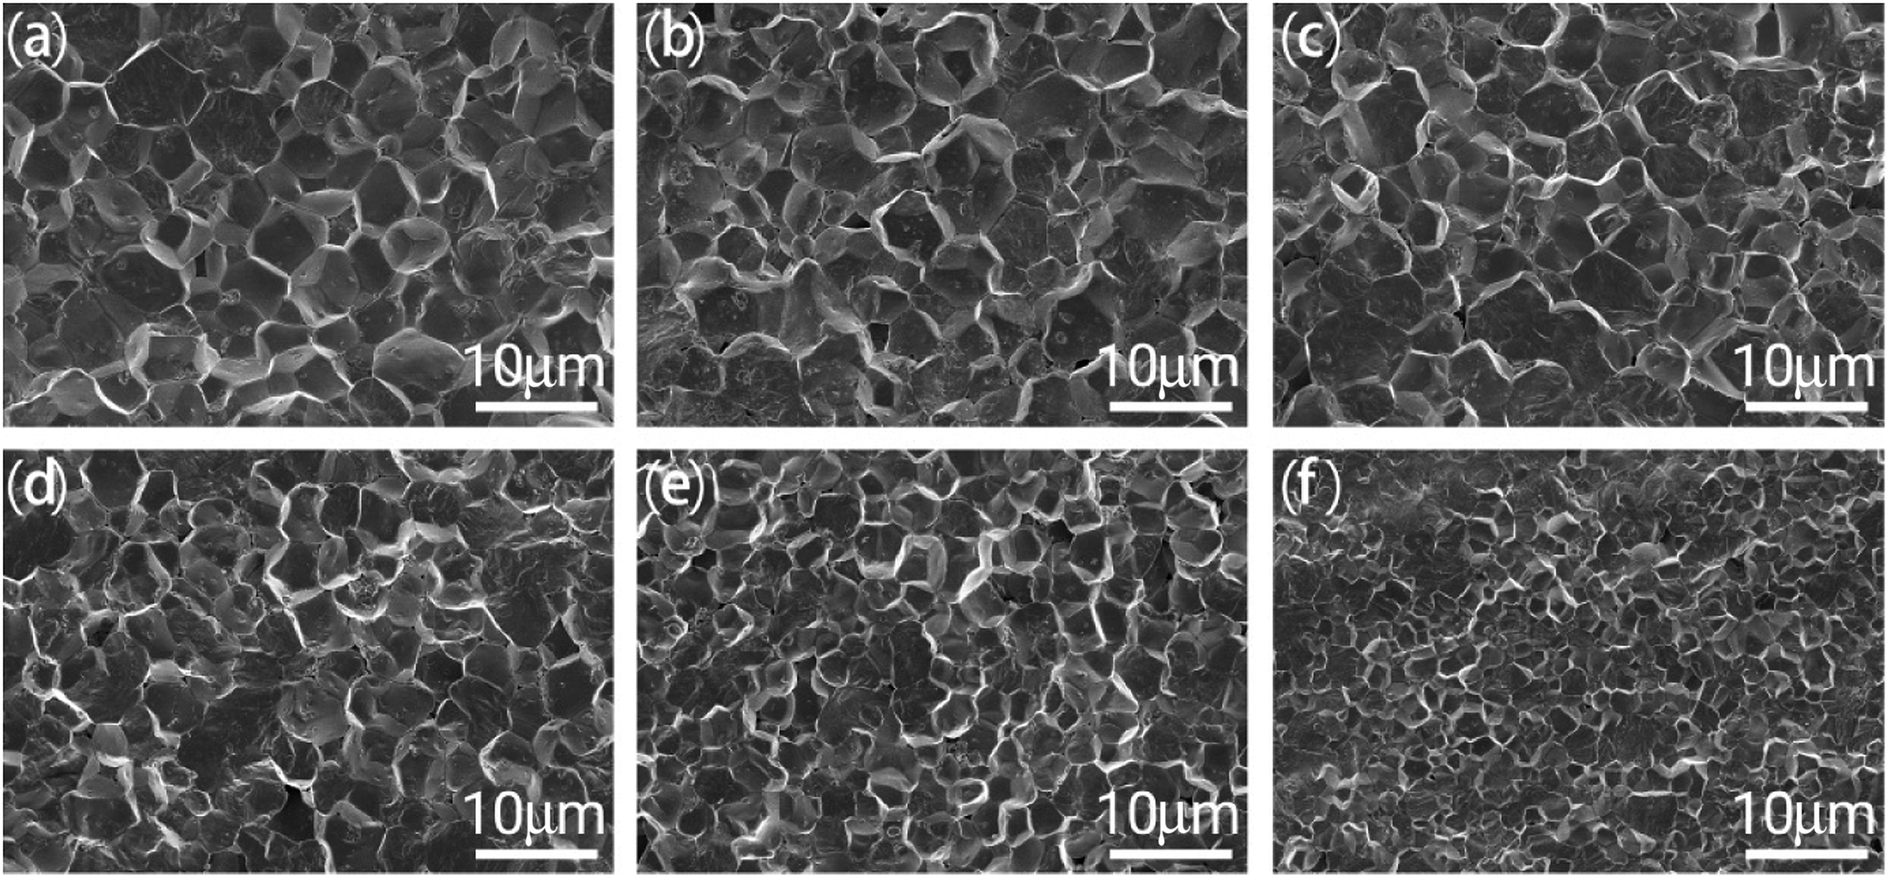 | ||
| Fig. 2 SEM micrographs of fracture surface of BS–PTFMn + x% Sb2O3 ceramics: (a) 0% Sb2O3, (b) 0.25% Sb2O3, (c) 0.5% Sb2O3, (d) 0.75% Sb2O3, (e) 1% Sb2O3, (f) 1.5% Sb2O3. | ||
| Composition | d (μm) | ρ1 (g cm−3) | ρ2 (g cm−3) | ρr (%) |
|---|---|---|---|---|
| x = 0.00 | 10 | 7.23 | 7.45 | 97.1 |
| x = 0.25 | 9 | 7.25 | 7.44 | 97.4 |
| x = 0.50 | 8 | 7.28 | 7.41 | 98.2 |
| x = 0.75 | 5 | 7.32 | 7.42 | 98.6 |
| x = 1.00 | 3 | 7.27 | 7.43 | 97.8 |
| x = 1.50 | 2 | 7.22 | 7.48 | 96.5 |
3.2 Dielectric properties
Fig. 3 shows the temperature dependence of dielectric constant (εr) and dielectric loss (tanδ) of BS–PTFMn + x% Sb2O3 ceramics. The values of dielectric constant (εr) at room temperature increased first and then decreased with the increase in Sb2O3, as shown in Table 2. The maximum of εr appeared at BS–PTFMn + 0.75% Sb2O3 ceramics. The increase in the dielectric constant is related to the decrease in the grain size (see Table 1). G. Arlt et al. reported that the width of the domain is proportional to the square root of the grain size in ferroelectric ceramics.28 It is reasonable to conclude that the domain density increases when the grain size decreases. In addition, the dielectric constant is mainly affected by the extrinsic contribution originated from the movement of the domain wall.29,30 Therefore, the extrinsic contribution to dielectric response can be enhanced if the density of domain walls increases, resulting in the enhancement of the dielectric constant. Therefore, the dielectric constant increased first, as shown in Table 2. When the Sb2O3 doping content further increased, the dielectric constant decreased because the extra Sb2O3 doping diffused into the grain boundaries, which hindered the movement of the electric domain.26,30 In polycrystalline ferroelectric ceramics, the relationship between dielectric properties and grain size is very common and correspondingly observed.31,32
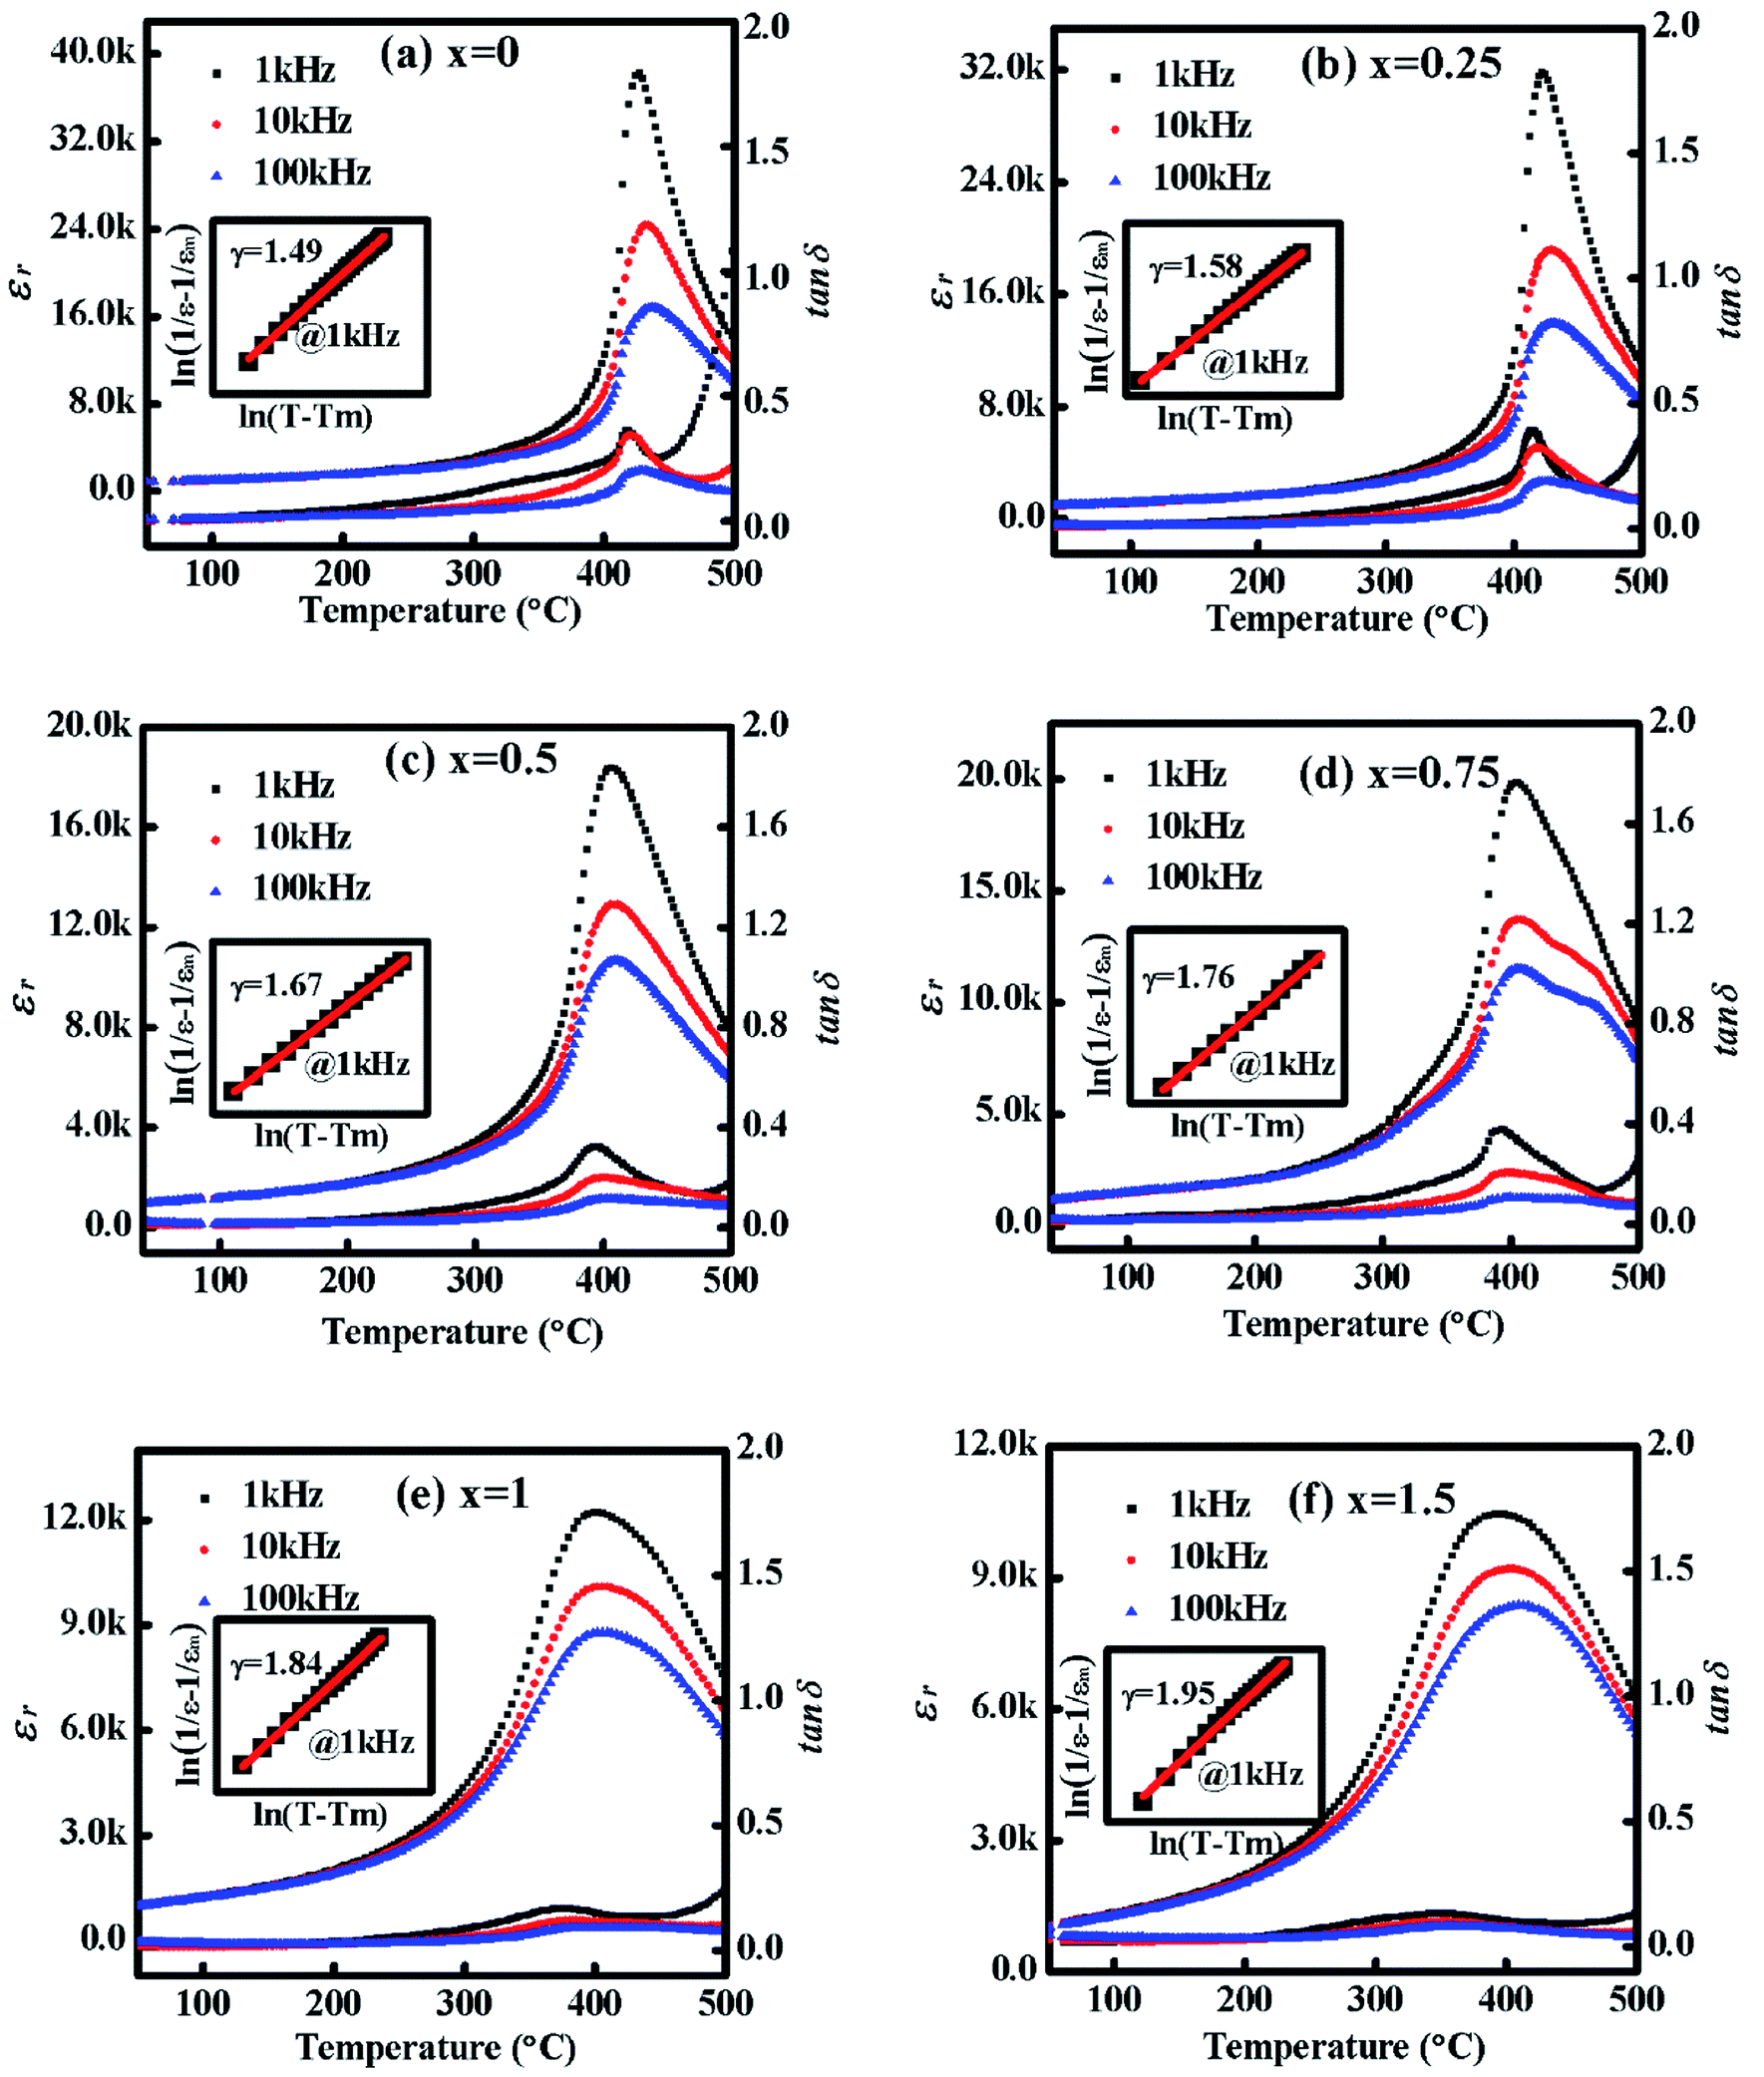 | ||
| Fig. 3 Temperature dependence of dielectric properties (εr, tanδ) of BS–PTFMn + x% Sb2O3 ceramics: (a) 0% Sb2O3 (b) 0.25% Sb2O3, (c) 0.5% Sb2O3, (d) 0.75% Sb2O3, (e) 1% Sb2O3, (f) 1.5% Sb2O3. The insets show the fitting result using semi-empirical Curie–Weiss law. | ||
| Composition | Tc (°C) | εr | tanδ |
Pr (μC cm−2) | Ec (kV cm−1) | d33 (pC N−1) | kp | Qm | Td (°C) |
|---|---|---|---|---|---|---|---|---|---|
| x = 0.00 | 425 | 920 | 0.008 | 17 | 28 | 230 | 0.39 | 180 | 380 |
| x = 0.25 | 422 | 960 | 0.009 | 20 | 26 | 260 | 0.42 | 141 | 365 |
| x = 0.50 | 407 | 1000 | 0.009 | 21 | 23 | 270 | 0.43 | 125 | 350 |
| x = 0.75 | 404 | 1230 | 0.014 | 24 | 22 | 305 | 0.45 | 93 | 325 |
| x = 1.00 | 400 | 1060 | 0.015 | 24 | 24 | 280 | 0.40 | 86 | 310 |
| x = 1.50 | 394 | 1050 | 0.018 | 29 | 25 | 240 | 0.36 | 72 | 300 |
Tm, defined as the temperature of the maximum of εr, is considered as the Curie temperature TC. It is clearly seen that Curie temperature is sensitive to Sb doping (listed in Table 2), and decreased linearly from 425 °C to 394 °C with the increase in Sb doping. Chen et al. reported that 0.36BiScO3–0.64Pb(Ti0.97Fe0.03)O3 + 1 mol% MnO2 ceramics exhibit a high Curie temperature of 492 °C.21 There are two main reasons for the gap of Curie temperature between our results and those of previous reported. The first reason is that the deviation of components was induced by Pb and Bi volatilizing during the synthesis process. The second reason is the doping of complex ions. It is well known that Fe and Mn elements have multiple valence states. The Curie temperature can be affected by the change in the valence of Fe and Mn ions. The effects of complex ions on the variation of Curie temperature require further studies.
The peak of maximum εr became wider and wider as Sb2O3 increased, exhibiting a diffuse phase transition. In addition, with the increase in the Sb2O3 doping, Tm shifted to a high temperature as frequencies increased, showing frequency dispersion. It is indicated that BS–PTFMn + x% Sb2O3 ceramics exhibit a typical relaxor behavior as Sb2O3 is doped. The relaxor behavior of Sb-doped BS–PTFMn ceramics at a phase transition can be described by the modified Curie–Weiss law:33
|
ln(1/ε − 1/εm) + lnC = γln(T − Tm)
| (1) |
3.3 Ferroelectric and piezoelectric properties
Fig. 4(a) shows the polarization–electric field (P–E) hysteresis loops of BS–PTFMn + x% Sb2O3 ceramics. The P–E hysteresis loops were measured under an electric field of ±70 kV cm−1 at room temperature with a frequency of 1 Hz. According to the P–E hysteresis loops, the variation of the values of remnant polarization (Pr) and coercive field (Ec) was obtained, as shown in Fig. 4(c). The value of Pr gradually increased as the Sb content increased. However, the value of Ec decreased first and reached a minimum value (22 kV cm−1) at x = 0.75. When the Sb2O3 doping content was higher than 0.75, the value of Ec increased slightly. The first decrease in Ec was mainly due to the “soft” doping of Sb2O3, while the second increase was mainly due to the excessive Sb2O3 at the grain boundary.36 Fig. 4(b) shows the I–E loops of all the samples at room temperature. The clear positive and negative current peaks, which correspond to the switching of polarization reveals the well-shaped saturated ferroelectric hysteresis loops, confirming the high quality of P–E hysteresis loops.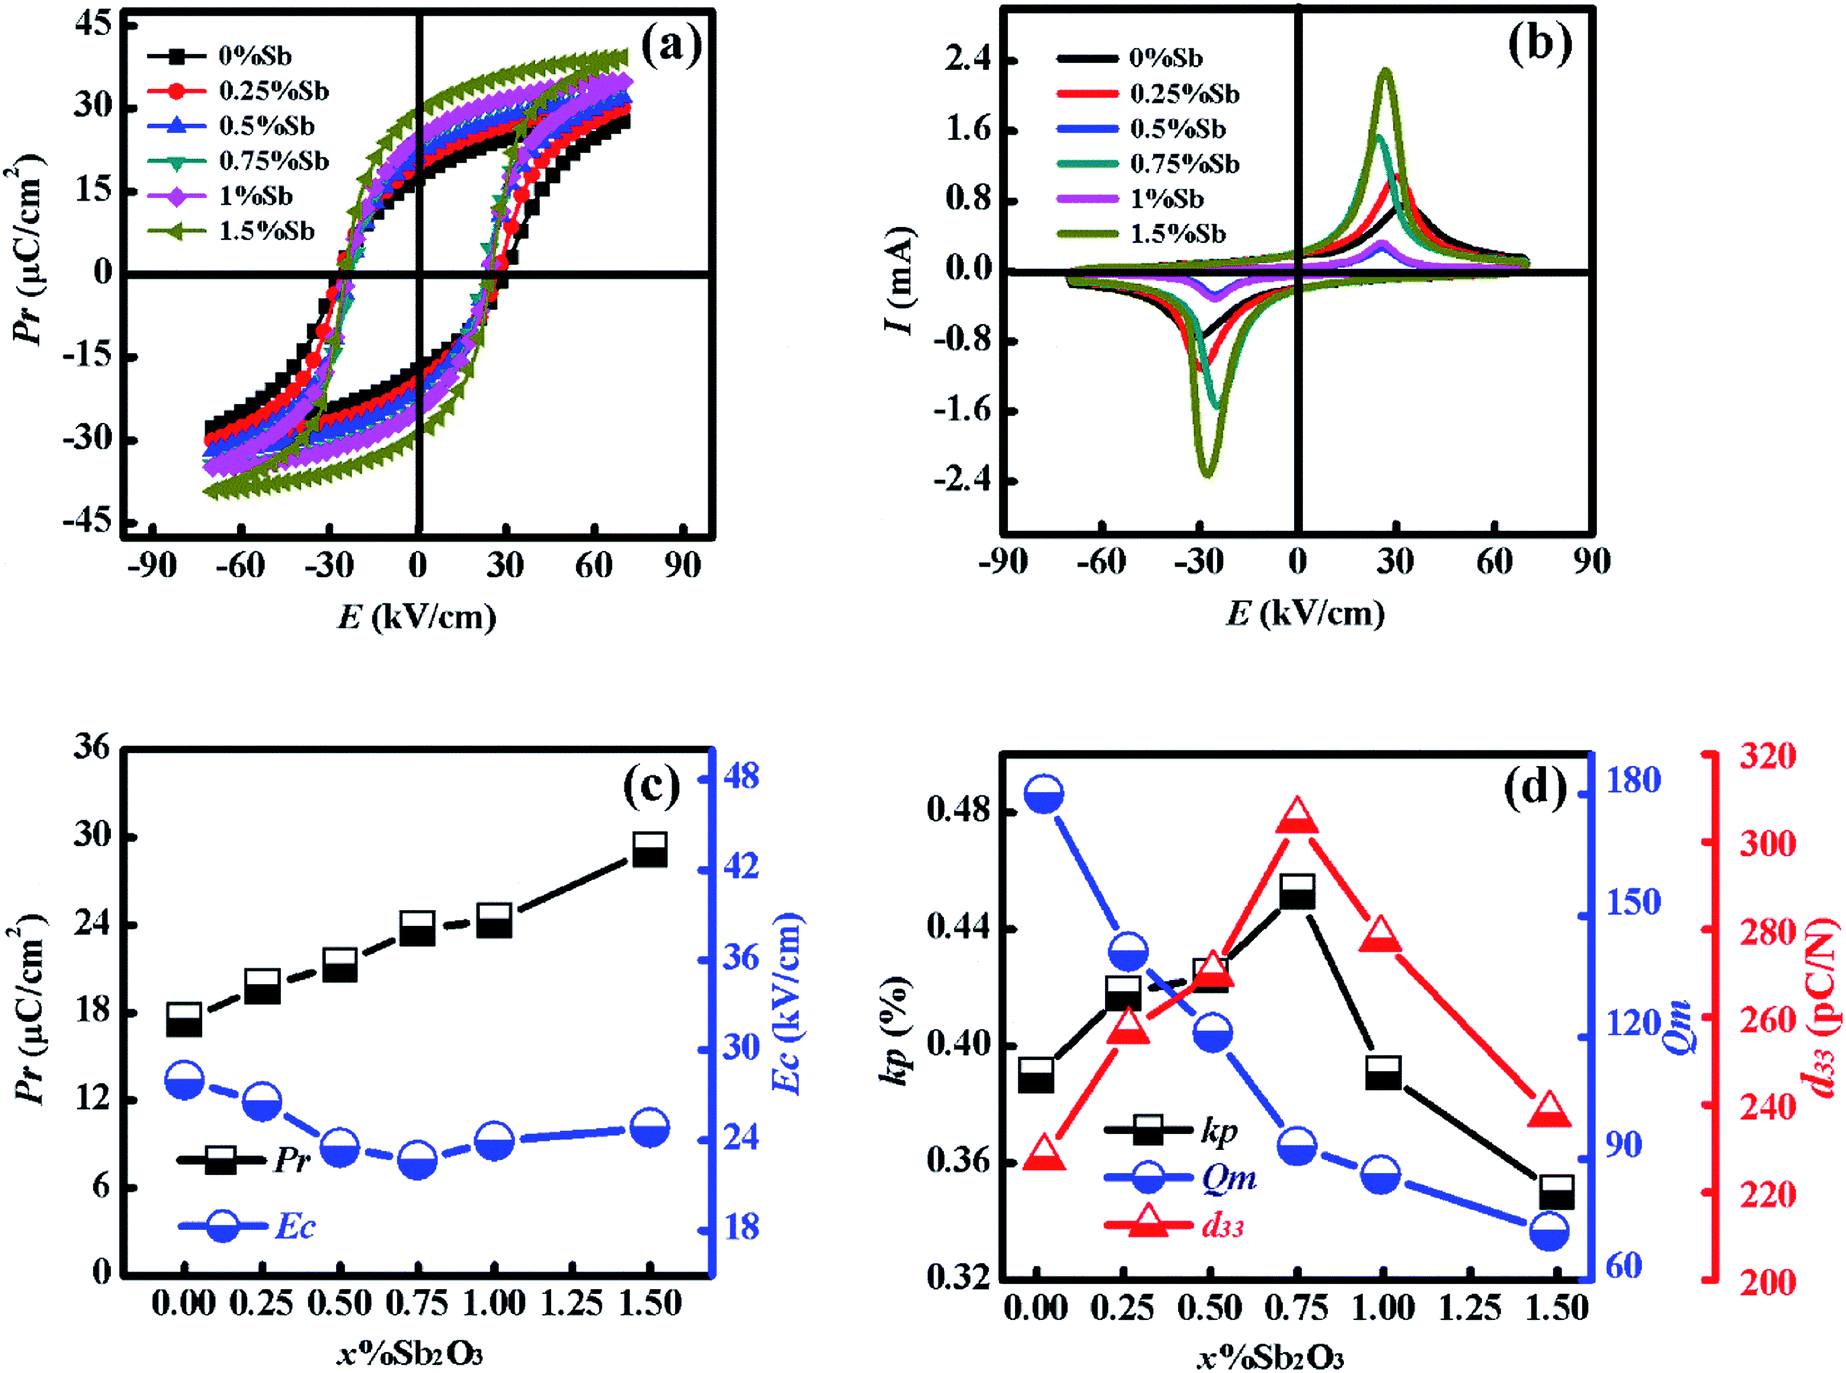 | ||
| Fig. 4 (a) Polarization–electric field (P–E) hysteresis and (b) current–electric field (I–E) loops, (c) Pr and Ec, (d) d33, kp and Qm as a function of Sb2O3 content of BS–PTFMn + x% Sb2O3 ceramics. | ||
The tendency of piezoelectric coefficient (d33), planar electromechanical coupling factor (kp), and mechanical quality factor (Qm) as a function of the Sb2O3 doping content are shown in Fig. 4(d). The variation of d33 shows an opposite trend compared to that of Ec, showing optimal properties at x = 0.75 (305 pC N−1), which indicates that Sb2O3 doping can improve the piezoelectric properties of BS–PT-based ceramics. Similarly, the value of kp showed the same tendency, exhibiting the maximum at x = 0.75%. However, the value of Qm monotonously declined from 180 to 70 as Sb2O3 increased, showing typical characteristics of a “soft” modifier. The detailed ferroelectric and piezoelectric properties are listed in Table 2. The optimal piezoelectric properties appeared for BS–PTFMn + 0.75% Sb2O3 ceramics, exhibiting εr = 1230, tanδ = 0.014, Ec = 22 kV cm−1, kp = 0.45 and d33 = 305 pC N−1. It is well known that Sb2O3 is a type of soft doping in which Sb5+ will replace Ti4+ ions, reducing the formation of lead vacancy, which leads to the domain movement becoming easier.37 Compared with undoped samples, the enhancement of d33 can be explained by a qualitative formula: d33 ∼ Q33εrε0Pr for the piezoelectric materials,38 where ε0 is the dielectric permittivity of free space, and Q33 is the electrostriction coefficient. The d33, εr, Pr are interrelated, showing high εr and high Pr for high piezoelectricity. All values of εr, Pr and d33 showed the same change as Sb2O3 increased to 0.75%. Therefore, the variation of d33 conforms to the formula. There are two reasons for an appreciable reduction of d33 upon further increase of Sb2O3. The one is that extra Sb2O3 doping diffused into the grain boundaries, which hindered the movement of the electric domain, reducing the extrinsic contribution to piezoelectricity. The other is due to the phase transition from the tetragonal phase to the rhombohedral phase, as shown in Fig. 1. The complex perovskite ferroelectrics exhibit optimal piezoelectricity near the MPB region. It has been reported that BS–PT based ceramics exhibit optimal piezoelectricity in the MPB region close to the tetragonal phase.14 Therefore, the d33 decreased when the structure changed to the rhombohedral phase.
Fig. 5 shows the unipolar strain vs. electric field (S–E) curves of BS–PTFMn + x% Sb2O3 ceramics measured under an electric field of 70 kV cm−1. The unipolar strain first increased with the increase in the Sb2O3 content, the maximum strain of 0.31% was obtained at BS–PTFMn + 0.75% Sb2O3 ceramics, and then decreased. For the undoped samples, a relatively small strain resulted from the reduction of the external effect, which was mainly due to the domain pinning caused by Fe/Mn doping.21 While the increase in strain after Sb2O3 doping was attributed to releasing the domain wall pinning effect, which lead to an easier switch of the non-180° domain wall.36 In addition, the large-signal piezoelectric coefficient  was calculated using the formula,
  from the S–E curves, as shown in Fig. 5(b). It was found that the variation of
  with the Sb2O3 content was similar to that of the value of d33 measured by a quasi-static d33 meter. The maximum value of
  was 442 pm V−1 for BS–PTFMn + 0.75% Sb2O3 ceramics. The value of
  was about 1.45-fold the d33 value (305 pC N−1). The piezoelectric contributions of the ferroelectric materials contain two aspects: one is the intrinsic contribution due to the lattice distortion; the other is an extrinsic contribution due to the ferroelectric non-180° domain switching. The domain wall motion under a high electric field may provide a more extrinsic contribution to the overall piezoelectric properties. Accordingly, the large-signal
  value is larger than that derived from the quasi-static piezoelectric meter.39,40
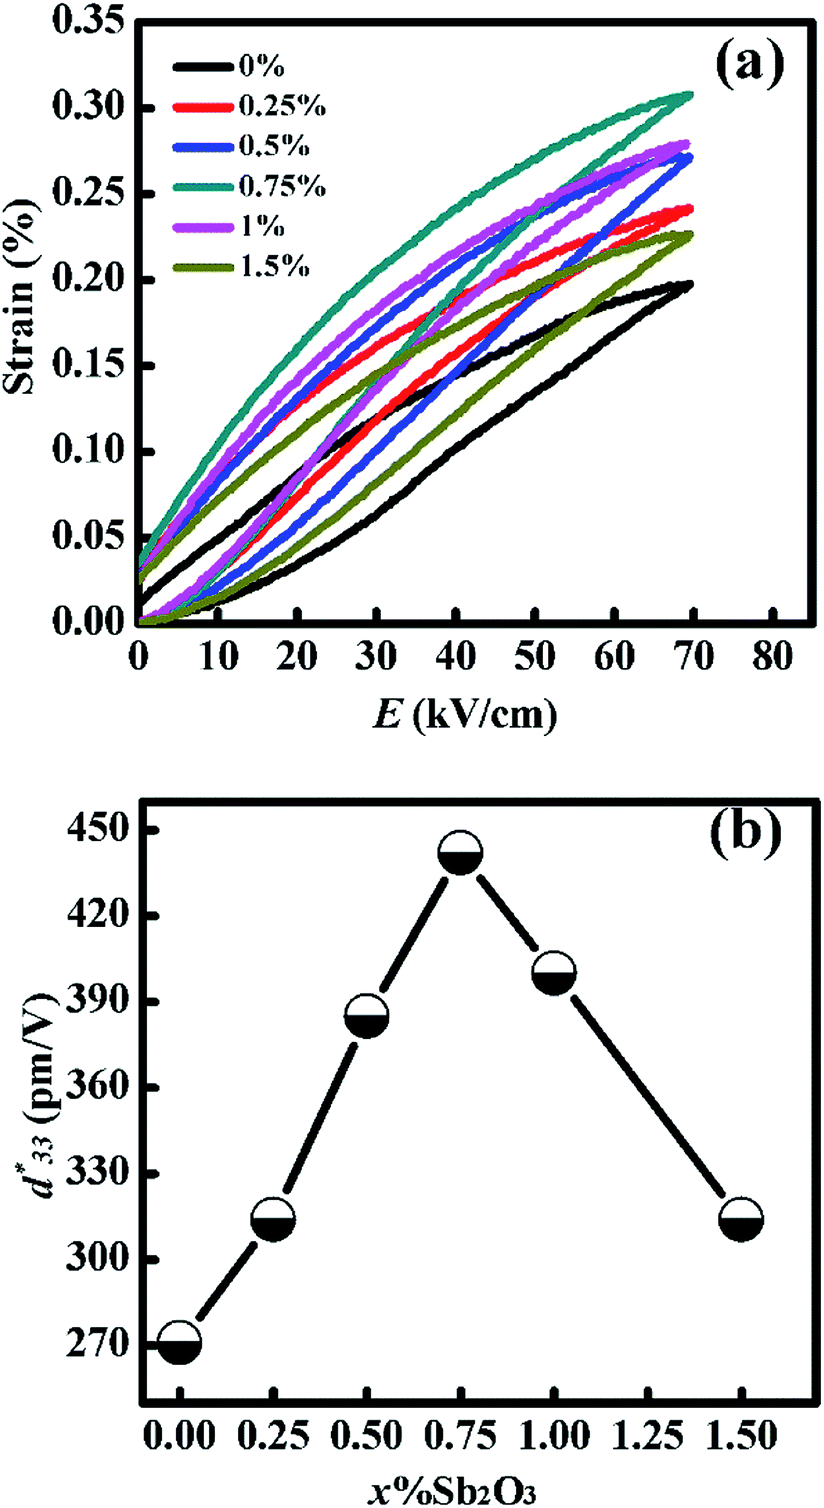 | ||
Fig. 5 (a) Unipolar strain vs. electric field (S–E) curves of BS–PTFMn + x% Sb2O3 ceramics at room temperature, (b)  as a function of Sb2O3 content. as a function of Sb2O3 content. | ||
3.4 Thermal stability
Thermal stability is interesting for sensors and actuators in various industrial applications. The temperature dependence of the P–E hysteresis loops of the BS–PTFMn + 0.75% Sb2O3 ceramics was measured with a frequency of 1 Hz, as shown in Fig. 6(a). BS–PTFMn + 0.75% Sb2O3 ceramics exhibited Pr = 24 μC cm−2 and Ec = 22 kV cm−1 at room temperature. It was found that the P–E loops maintained a good square-shaped loop as the temperature increased, and there was no obvious leakage current caused by the reduction of the ceramic volume resistivity under high temperatures. At 300 °C, it is clearly seen that BS–PTFMn + 0.75% Sb2O3 ceramics maintained the values of Pr and Ec as high as 20 μC cm−2 and 8.5 kV cm−1, respectively. Fig. 6(b) shows the temperature dependence of the I–E loops of BS–PTFMn + 0.75% Sb2O3 ceramics. It is easily seen that standard I–E loops are shown below 300 °C. At 300 °C, the current curves fluctuated with several peaks under a high electric field, indicating that the leakage current starts to increase. Therefore, it is indicated that the ferroelectric properties of BS–PTFMn + 0.75% Sb2O3 ceramics start to degenerate at this temperature.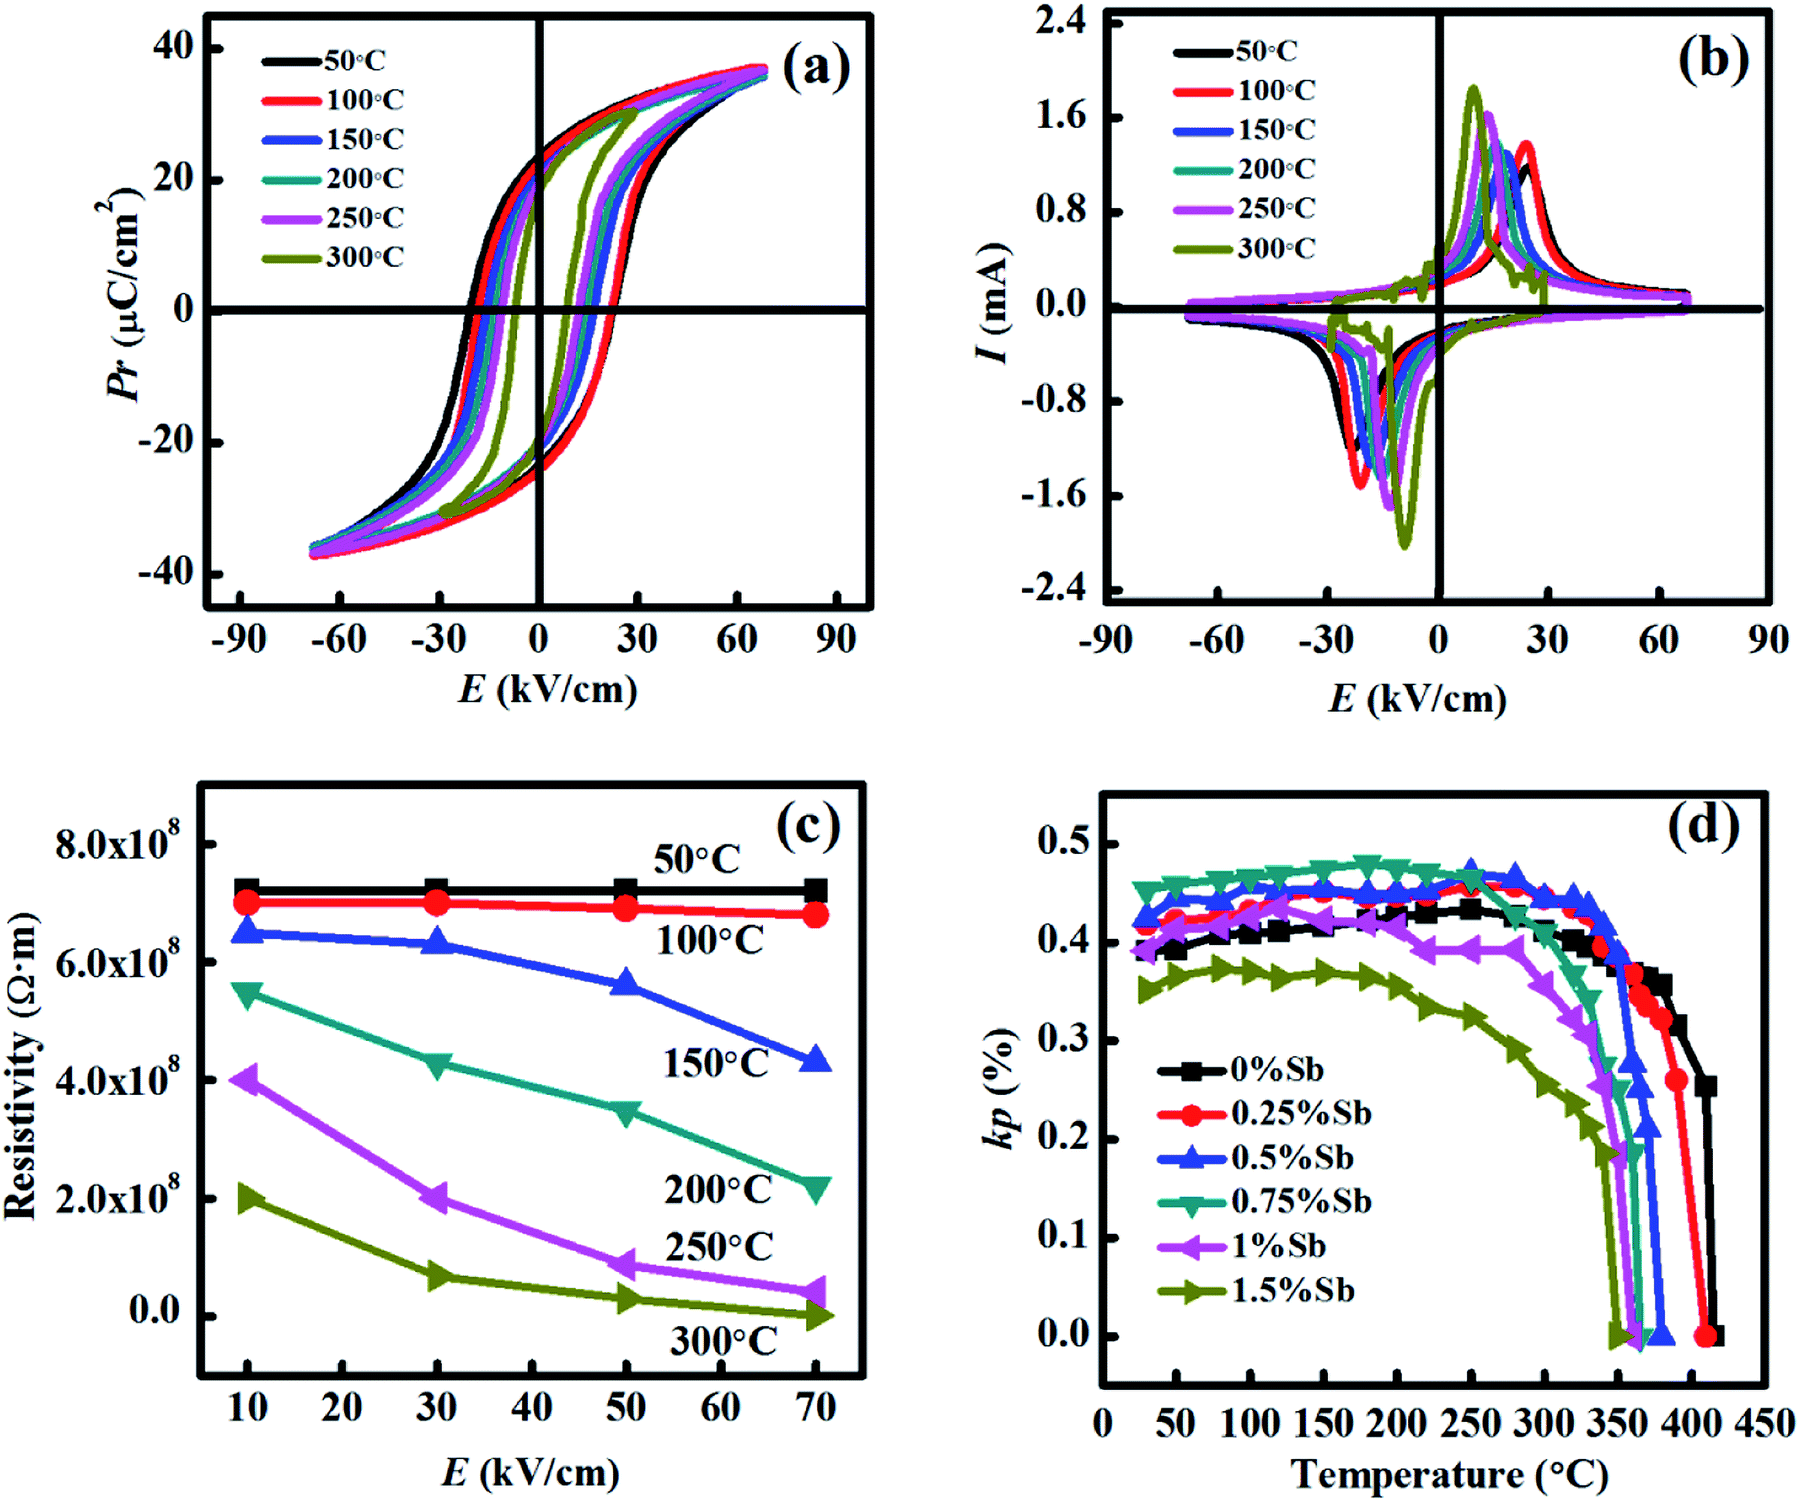 | ||
| Fig. 6 (a) Temperature dependence of P–E hysteresis loops, (b) temperature dependence of I–E loops, (c) changes in resistivity, and (d) temperature dependence of kp of BS–PTFMn + 0.75% Sb2O3 ceramics. | ||
The high resistivity is necessary for high-temperature applications, particularly under a high electric field. The resistivity of BS–PTFMn + 0.75% Sb2O3 ceramics under a high electric field is shown in Fig. 6(c). It can be easily seen that the resistivity does not change at room temperature although the electric field was as high as 70 kV cm−1, showing the resistivity of 7.2 × 10⁸ Ω m, which satisfies the poling condition without any breakdown. The resistivity gradually decreased as the temperature increased. At 350 °C, though resistivity declined a lot under 70 kV cm−1, the resistivity under 10 kV cm−1 still maintained the value of 2.0 × 10⁸ Ω m, showing a feature of an insulator. It is known that thermal stability is much affected by the large conductance in applications because it must work repeatedly under high temperatures. Therefore, the degradation of resistivity is responsible for the degradation of the piezoelectric performance of piezoelectric ceramics. It is concluded that the high resistivity of the BS–PTFMn + 0.75% Sb2O3 ceramics is in favor of the enhancement of the thermal stability of BS–PT ceramics.
To further characterize the temperature stability of the samples, the temperature dependence of kp of the BS–PTFMn + x% Sb2O3 ceramics was measured (Fig. 6(d)). In this study, the value of the thermal depolarization temperature (Td) of each sample was calculated, as listed in Table 2. Mostly, the fluctuation of the piezoelectric coefficient is required to be less than 10% for the industrial applications of piezoelectric ceramics. Therefore, Td is defined as the temperature at which the value of kp dropped by 10%. It can be easily seen that the Td value of BS–PTFMn + x% Sb2O3 ceramics decreased slightly as the Sb2O3 content increased, which was consistent with the change in the Curie temperature. However, Td of all samples was still above 300 °C. For example, BS–PTFMn + 0.75% Sb2O3 ceramics exhibited Td of 325 °C.
Table 3 shows the comparison of the electrical properties of BS–PTFMn + x% Sb2O3 and other BS–PT based ceramics. Compared with these systems with high d33 (≥300 pC N−1), BS–PTFMn + 0.75% Sb2O3 ceramics exhibited a relatively low dielectric loss. In addition, BS–PTFMn + 0.75% Sb2O3 ceramics exhibited the highest d33 among these systems with a low dielectric loss (≤1.5%). Therefore, the complex ion doping can improve the piezoelectric properties of BS–PT based ceramics. In addition, BS–PTFMn + 0.75% Sb2O3 ceramics exhibited a relatively high depolarization temperature. These results also confirm that the BS–PTFMn + x% Sb2O3 ceramics are promising piezoelectric materials for high-temperature applications.
| Sample | Tc (°C) | εr | tanδ |
d33 (pC N−1) | kp | Td (°C) | Ref. |
|---|---|---|---|---|---|---|---|
| 0.36BS–0.64 PT | 450 | 2010 | 4% | 460 | 0.56 | 250 | 14 |
| 0.36BS–0.64PTM | 428 | 865 | 1% | 254 | 0.47 | 230 | 17 |
| Fe:0.35BS–0.6PT–0.05PZN |
440 | 1350 | 1.5% | 220 | 0.33 | — | 41 |
| 0.10BT–0.36BS–0.54 PT | 393 | 1890 | 8% | 350 | — | — | 19 |
| 0.10PMN–0.30BS–0.60 PT | 320 | 1000 | 4% | 210 | 0.32 | — | 18 |
| 0.07PMS–0.33BS–0.60 PT | 330 | 993 | 1.4% | 225 | 0.38 | — | 20 |
| BS–PTFMn + 0.75% Sb2O3 | 404 | 1230 | 1.4% | 305 | 0.45 | 325 | This work |
4. Conclusions
The dielectric, ferroelectric, piezoelectric, and electromechanical coupling properties of the BS–PTFMn + x% Sb2O3 ceramics are presented in this study. The addition of Sb2O3 leads to BS–PTFMn + x% Sb2O3 ceramics transformed from the tetragonal phase to the rhombohedral phase. The relaxation enhancement was caused by the increase in Sb2O3, which was attributed to the increase in disorder in the perovskite structure. The BS–PTFMn + 0.75% Sb2O3 ceramics possessed optimal piezoelectric properties at room temperature, exhibiting Although the Curie temperature of the system dropped slightly when Sb2O3 content increased, the thermal depolarization temperature (Td) of BS–PTFMn + x% Sb2O3 ceramics remained above 300 °C, such as 325 °C for BS–PTFMn + x% Sb2O3 ceramics. These results also confirmed that doping with Sb2O3 can improve the piezoelectric properties of BS–PT piezoelectric ceramics. The results indicated that the dielectric constant, piezoelectric coefficient, electromechanical coupling factor increased and mechanical quality factor decreased after Sb2O3 doping. Therefore, the role of “soft” doping is the main effect of Sb2O3 on electrical performance. The enhanced piezoelectric properties and good thermal stabilities indicated that the BS–PTFMn + x% Sb2O3 ceramics are promising for high-temperature piezoelectric applications.
Conflicts of interest
There are no conflicts of interest to declare.Acknowledgements
This work was supported by the National Natural Science Foundation of China (41874214, 51902307); the Strategic Priority Research Program of the Chinese Academy of Sciences (XDB20000000); the Science and Technology Project of Fujian Province (2018H0044, 2019H0052); the Youth Innovation Promotion Association CAS and the Youth Talents Plan of Institute of Acoustics, Chinese Academy of Sciences (QNYC201734).References
- S. J. Zhang and F. P. Yu, Piezoelectric materials for high temperature sensors, J. Am. Ceram. Soc., 2011, 94, 3153–3170 CrossRef CAS.
- S. J. Zhang, X. N. Jiang, M. Lapsley, P. Moses and T. R. Shrout, Piezoelectric accelerometers for ultrahigh temperature application, Appl. Phys. Lett., 2010, 96, 013506 CrossRef.
- D. Damjanovic, Materials for high temperature piezoelectric transducers, Curr. Opin. Solid State Mater. Sci., 1998, 3, 469–473 CrossRef CAS.
- J. F. Tressler, S. Alkoy and R. E. Newnham, Piezoelectric sensors and sensor materials, J. Electroceram., 1998, 2, 257–272 CrossRef CAS.
- R. C. Turner, P. A. Fuierer, R. E. Newnham and T. R. Shrout, Materials for high temperature acoustic and vibration sensors: a review, Appl. Acoust., 1998, 41, 299–324 CrossRef.
- B. Noheda, D. E. Cox, G. Shirane, J. A. Gonzalo, L. E. Cross and S. E. Park, A monoclinic ferroelectric phase in the Pb(Zr1-xTix)O3 solid solution, Appl. Phys. Lett., 1999, 74, 2059–2061 CrossRef CAS.
- R. E. Eitel, C. A. Randall, T. R. Shrout, P. W. Rehrig, W. Hackenberger and S. E. Park, New high temperature morphotropic phase boundary piezoelectrics based on Bi(Me)O3–PbTiO3 ceramics, Jpn. J. Appl. Phys., Part 1, 2001, 40, 5999–6002 CrossRef CAS.
- M. R. Suchomel and P. K. Davies, Predicting the position of the morphotropic phase boundary in high temperature PbTiO3-Bi(B′B′′)O3 based dielectric ceramics, J. Appl. Phys., 2004, 96, 4405–4410 CrossRef CAS.
- Z. Q. Hu, J. G. Chen, M. Y. Li, X. T. Li, G. X. Liu and S. X. Dong, Morphotropic phase boundary and high temperature dielectric, piezoelectric, and ferroelectric properties of (1-x)Bi(Sc3/4In1/4)O3-xPbTiO3 ceramics, J. Appl. Phys., 2011, 110, 064102 CrossRef.
- S. J. Zhang, R. Xia, C. A. Randall, T. R. Shrout, R. Duan and R. F. Speyer, Dielectric and piezoelectric properties of niobium-modified BiInO3-PbTiO3 perovskite ceramics with high Curie temperatures, J. Mater. Res., 2005, 20, 2067–2071 CrossRef CAS.
- F. Gao, R. Z. Hong and J. J. Liu, Phase formation and characterization of high Curie temperature xBiYbO3–(1-x)PbTiO3 piezoelectric ceramics, J. Eur. Ceram. Soc., 2009, 29, 1687–1693 CrossRef.
- J. R. Cheng, W. Zhu, N. Li and L. E. Cross, Fabrication and characterization of xBiGaO3-(1-x)PbTiO3: a high temperature reduced Pb-content piezoelectric ceramic, Mater. Lett., 2003, 57, 2090–2094 CrossRef CAS.
- R. E. Eitel, S. J. Zhang, T. R. Shrout, C. A. Randall and I. Levin, Phase diagram of the perovskite system (1-x)BiScO3-xPbTiO3, J. Appl. Phys., 2004, 96, 2828–2831 CrossRef CAS.
- R. E. Eitel, C. A. Randall, T. R. Shrout and S. E. Park, Preparation and characterization of high temperature perovskite ferroelectrics in the solid-solution (1-x)BiScO3- xPbTiO3, Jpn. J. Appl. Phys., Part 1, 2002, 41, 2099–2104 CrossRef CAS.
- B. Kowalski and A. Sehirlioglu, High temperature limitation due to onset of depoling in BiScO3-PbTiO3, J. Appl. Phys., 2017, 121, 064106 CrossRef.
- S. W. Gotmare, S. O. Leontsev and R. E. Eitel, Thermal degradation and aging of high-temperature piezoelectric ceramics, J. Am. Ceram. Soc., 2010, 93, 1965–1969 CAS.
- J. G. Chen, Z. Q. Hu, H. D. Shi, M. Y. Li and S. X. Dong, High-power piezoelectric characteristics of manganese-modified BiScO3-PbTiO3 high-temperature piezoelectric ceramics, J. Phys. D: Appl. Phys., 2012, 45, 465303 CrossRef.
- J. Ryu, S. Priya, C. Sakaki and K. Uchino, High power piezoelectric characteristics of BiScO3-PbTiO3-Pb(Mn1/3Nb2/3)O3, Jpn. J. Appl. Phys., Part 1, 2002, 41, 6040–6044 CrossRef CAS.
- H. Qiao, C. He, Z. Wang, X. Li, Y. Liu and X. Long, Improved electrical properties of BaTiO3 modified BiScO3-PbTiO3 ceramics with high Curie temperature, Ceram. Int., 2017, 43, 11463–11468 CrossRef CAS.
- B. L. Deng, Q. Wei, C. He, Z. J. Wang, X. M. Yang and X. F. Long, Effect of Pb(Mn1/3Sb2/3)O3 addition on the electrical properties of BiScO3-PbTiO3 piezoelectric ceramics, J. Alloys Compd., 2019, 790, 397–404 CrossRef CAS.
- G. Chen, G. X. Jin, C. M. Wang and J. R. Cheng, Reduced dielectric loss and strain hysteresis in Fe and Mn commodified high-temperature BiScO3-PbTiO3 ceramics, J. Am. Ceram. Soc., 2014, 97, 3890–3896 CrossRef.
- M. M. Nadoliisky, T. K. Vassileva and P. B. Vitkov, Dielectric, piezoelectric and pyroelectric properties of PbZrO3-PbTiO3-Pb(Mn1/3Sb2/3)O3 ferroelectric system, Ferroelectrics, 1992, 129, 141–146 CrossRef CAS.
- Z. G. Zhu, N. Z. Zheng, G. R. Li and Q. R. Yin, Dielectric and electrical conductivity properties of PMS-PZT ceramics, J. Am. Ceram. Soc., 2006, 89, 717–719 CrossRef CAS.
- Y. K. Gao, Y. H. Chen, J. Ryu, K. Uchino and D. Viehland, Eu and Yb substituent effects on the properties of Pb(Zr0.52Ti0.48)O3-Pb(Mn1/3Sb2/3)O3 ceramics: development of a new high-power piezoelectric with enhanced vibrational velocity, Jpn. J. Appl. Phys., Part 1, 2001, 40, 687–693 CrossRef CAS.
- W. M. Zhu and Z. G. Ye, Improved dielectric and ferroelectric properties of high curie temperature (1-x)BiFeO3-xPbTiO3 Ceramics by aliovalent ionic substitution, Appl. Phys. Lett., 2006, 89, 232904 CrossRef.
- H. Abid, S. Nidhi, J. J. Abhilash, D. Komal, G. Sahil and K. Binay, Improvement in dielectric, piezoelectric and ferroelectric properties of 0.64PMN–0.36PT ceramics by Sb modification, J. Mater. Sci., 2017, 28, 14298–14307 Search PubMed.
- Z. Ren and Z. G. Ye, Effects of Mn-Doping on PIN-PMN-PT ceramics with MPB composition, Ferroelectrics, 2014, 464, 130–135 CrossRef CAS.
- G. Arlt, D. Hennings and G. Dewith, Dielectric properties of fine-grained barium titanate ceramics, J. Appl. Phys., 1985, 58, 1619–1625 CrossRef CAS.
- T. Hoshina, K. Takizawa and J. Li, Domain size effect on dielectric properties of barium titanate ceramics, Jpn. J. Appl. Phys., 2008, 47, 7607 CrossRef CAS.
- Y. A. Huang, B. Lu and Y. X. Zou, Grain size effect on dielectric, piezoelectric and ferroelectric property of BaTiO3 ceramics with fine grains, J. Inorg. Mater., 2018, 33(7), 767 CrossRef.
- G. Viola, K. B. Chong, M. Eriksson, Z. J. Shen, J. T. Zeng and Q. R. Yin, Effect of grain size on domain structures, dielectric and thermal depoling of Nd-substituted bismuth titanate ceramics, Appl. Phys. Lett., 2013, 103, 182903 CrossRef.
- Z. Ai, Y. Hou, M. Zheng and M. Zhu, Effect of grain size on the phase structure and electrical properties of PZT-PNZN quaternary systems, J. Alloys Compd., 2014, 617, 222 CrossRef CAS.
- X. G. Tang, K. H. Chew and H. L. W. Chan, Diffuse phase transition and dielectric tunability of Ba(ZryTi1-y)O3 relaxor ferroelectric ceramics, Acta Mater., 2004, 52, 5177–5183 CrossRef CAS.
- T. Shi, L. Xie, L. Gu and J. Zhu, Why Sn doping significantly enhances the dielectric properties of Ba(Ti1-xSnx)O3, Sci. Rep., 2014, 5, 8606 CrossRef PubMed.
- Y. H. Jiang, Y. Zhao, B. Q. Qin, Y. Z. Jiang, W. Shi, L. H. Li, D. Q. Xiao and J. G. Zhu, Dielectric and piezoelectric properties of (1-x)(Bi1-yLiy)(Sc1-ySby)O3-xPbTiO3 high-temperature relaxor ferroelectric ceramics, Appl. Phys. Lett., 2008, 93, 022904 CrossRef.
- Q. M. Zhang, H. Wang, N. Kim and L. E. Cross, Direct evaluation of domain-wall and intrinsic contributions to the dielectric and piezoelectric response and their temperature-dependence on lead-zirconate-titanate ceramics, J. Appl. Phys., 1994, 75, 454 CrossRef CAS.
- G. H. Haertling, Ferroelectric ceramics: History and Technology, J. Am. Ceram. Soc., 1999, 82, 797–818 CrossRef CAS.
- S.-E. Park and T. R. Shrout, Characteristics of relaxor-based piezoelectric single crystals for ultrasonic transducers, IEEE Trans. Ultrason. Ferroelectr. Freq. Control, 1997, 44, 1140–1147 Search PubMed.
- J. G. Chen, T. L. Zhao, J. R. Cheng and S. X. Dong, Enhanced piezoelectric performance of (0.98-x)Bi(Sc3/4In1/4)O3-xPbTiO3-0.02Pb(Zn1/3Nb2/3)O3 ternary high temperature piezoelectric ceramics, J. Appl. Phys., 2013, 113, 5 CrossRef.
- A. Jalalian, A. M. Grishin, X. L. Wang, Z. X. Cheng and S. X. Dong, Large piezoelectric coefficient and ferroelectric nanodomain switching in Ba(Ti0.80Zr0.20)O3-0.5(Ba0.70Ca0.30)TiO3 nanofibers and thin films, Appl. Phys. Lett., 2014, 104, 103112 CrossRef.
- Q. W. Liao, X. S. Chen, X. C. Chu, F. Zeng and D. Guo, Effect of Fe Doping on the Structure and Electric Properties of Relaxor Type BSPT-PZN Piezoelectric Ceramics Near the Morphotropic Phase Boundary, Sens. Actuators, A, 2013, 201, 222–229 CrossRef CAS.
| This journal is © The Royal Society of Chemistry 2020 |