 Open Access Article
Creative Commons Attribution 3.0 Unported Licence
Mineralogical characteristics influence the structure and pozzolanic reactivity of thermally and mechano-chemically activated meta-kaolinites†
Alastair T. M.
Marsh
 *a,
Andy P.
Brown
b,
Helen M.
Freeman
a,
Anke
Neumann
 cd,
Brant
Walkley
 e,
Helen
Pendlowski
f and
Susan A.
Bernal
 a
a
aSchool of Civil Engineering, University of Leeds, Leeds, LS2 9JT, UK. E-mail: a.marsh@leeds.ac.uk
bSchool of Chemical and Process Engineering, University of Leeds, Leeds, LS2 9JT, UK
cPaul Scherrer Institut, 5232 Villigen PSI, Switzerland
dSchool of Engineering, University of Newcastle Upon Tyne, NE1 7RU, UK
eDepartment of Chemical and Biological Engineering, University of Sheffield, Sheffield, UK
fThe James Hutton Institute, Craigiebuckler, Aberdeen, UK
First published on 19th August 2024
Abstract
Increasing early age reactivity of cement replacements is a barrier to reducing the embodied carbon of blended Portland cements. Mechano-chemical activation is an emerging alternative to conventional thermal activation for clays, which can accelerate early age reactivity. Knowledge gaps on the structure and reactivity of mechano-chemically activated kaolinitic clays include the influence of Fe-bearing phases and the mineralogical characteristics of kaolinites from different sources. This study evaluated the effectiveness of mechano-chemical vs. thermal activation for an Fe-rich clay containing disordered kaolinite and 24 wt% goethite, and a low-Fe clay containing highly ordered kaolinite. In the Fe-rich clay, mechano-chemical activation simultaneously caused dehydroxylation of kaolinite to form meta-kaolinite, and dehydration of goethite to form hematite. Agglomerates of intermixed meta-kaolinite and goethite/hematite nanoparticles were shown to have similar Al and Si environments after thermal or mechano-chemical activation (as determined by STEM-EDX, 27Al and 29Si MAS nuclear magnetic resonance and electron energy loss spectroscopy). Mechano-chemical activation enhanced early age (<12 hours) reactivity for both clays. Evaluating early age reactivity by unit mass of anhydrous meta-kaolinite explains how surface-adsorbed moisture results in underperformance of mechano-chemical activation at later ageing times. External surface area alone does not predict reactivity acceleration well – edge![[thin space (1/6-em)]](https://www.rsc.org/images/entities/char_2009.gif) :
:![[thin space (1/6-em)]](https://www.rsc.org/images/entities/char_2009.gif) basal surface area of meta-kaolinite is proposed as a more relevant factor that governs early age performance of mechano-chemically activated clays. The structure–property–performance relations of mechano-chemically activated meta-kaolinites are explained through interactions of kaolinites' intrinsic mineralogical characteristics (i.e. initial particle size, aspect ratio, structural order) and extrinsic processing effects (i.e. intensive milling on structural order and physical characteristics).
basal surface area of meta-kaolinite is proposed as a more relevant factor that governs early age performance of mechano-chemically activated clays. The structure–property–performance relations of mechano-chemically activated meta-kaolinites are explained through interactions of kaolinites' intrinsic mineralogical characteristics (i.e. initial particle size, aspect ratio, structural order) and extrinsic processing effects (i.e. intensive milling on structural order and physical characteristics).
1. Introduction
Mechano-chemistry is promising as a processing or synthesis route for a diverse range of technologies needed for the low-carbon transition, including hydrogen storage, solar photovoltaics, batteries, catalysts and more.1–3 An emerging application of powder mechano-chemistry (sometimes referred to as tribo-chemistry) is in the decarbonisation of Portland cement, whose production accounts for 8% of annual global anthropogenic CO2 emissions.4 Mechano-chemical processing (typically ball-milling) has been investigated as a way to induce dehydroxylation and structural disorder in clay minerals, which then undergo a pozzolanic reaction when added to a cementitious system, enabling reduction of carbon-intensive clinker content.5 The proposed advantages of mechano-chemical activation for clay minerals, relative to the conventional route of thermal activation in a kiln or furnace, are a lower energy cost and a higher degree of structural amorphization.5Research on powder mechano-chemistry for the decarbonisation of cement has tended to focus on systems primarily containing single minerals: most often kaolinite;6–9 but also muscovite,10–12 quartz,13,14 and others. The geographical distribution of future construction partly determines which types of clays will be most important for meeting future demand for cementitious materials. Much of the world's population growth, and hence demand for cementitious materials, is anticipated in areas with Fe-rich clays (e.g. Indian sub-continent, West Africa) which contain kaolinite and additionally significant proportions of goethite and/or hematite. Activated Fe-rich kaolinitic clays can also be used in conventional blended cements,15 as well as precursors in alkali-activated cements.15,16 There is therefore a need to understand the behaviour of Fe-rich kaolinitic clays undergoing mechano-chemical activation.
The principles of mechano-chemical activation for the dehydroxylation of kaolinite are well-established, and the prototropy model17 explains the mechanism of dehydroxylation and retention of moisture in the system.6,7,18 The accumulation of strain from repeated particle collisions causes loss of long-range order for all crystallographic axes.19 In addition, intensive milling of goethite (α-FeOOH) induces dehydration and a topotactic transformation to hematite (α-Fe2O3).20,21 Yet, the exact scope, definition and defining criteria of mechano-chemical activation remains a subject of ongoing debate.1–3 The mechano-chemical dehydroxylation of kaolinite largely fulfils both the conditions of a definition provided by Kaupp:1 “breaking of intramolecular bonds directly by an external mechanical action” is the initial breaking of an (Al)–O–H bond in the octahedral sheet, which is then “followed by further chemical reactions” of the free H+ reacting with another (Al)–O–H site to form H2O molecules. Notwithstanding whether the initial breaking of the O–H bond occurs directly as a result of an external force sensu stricto, as opposed to localised heating generated by collisions, this activation route is clearly distinct from comminution (i.e. mechanical activation) which only increases the specific surface area available for dissolution.
The application of mechano-chemical activation for Fe-rich clays seems promising as a globally impactful contribution to decarbonising the cementitious materials sector. Yet there are several knowledge gaps unanswered by previous studies that have only mechano-chemically activated kaolinite and goethite separately. The extent of structural disorder and lattice substitutions in kaolinites found in Fe-rich lateritic clays are typically higher compared to kaolinites formed via other geological routes.22 The dissolution rate of meta-kaolinite in cementitious systems (particularly the dissolution of Si and Al) is a key influence on the early age hydration behaviour of blended cements: the extent of meta-kaolinite structural disorder affects the energetic driving force for dissolution, and the meta-kaolinite particle size and morphology together affect the kinetics of dissolution.23 It is unknown whether the effects of mechano-chemical activation will be lesser for Fe-rich clays compared to just kaolinites with a higher inherent structural order; or whether the presence of fine goethite and/or hematite particles could influence the composition and structure of meta-kaolinite after intensive milling. A barrier to studying the effects of mechano-chemical activation on the local Al environments in kaolinite within Fe-rich clays is the degradation of 27Al magic angle spinning (MAS) nuclear magnetic resonance (NMR) spectral quality arising from paramagnetic Fe, and ferro/ferrimagnetic Fe-oxyhydroxide bearing phases.24 As an alternative, electron energy loss spectroscopy (EELS) in a transmission electron microscope has been used to investigate local Al environments for thermal activation in Fe-rich clays,25 but has not yet been used to study mechano-chemical activation. Another knowledge gap is why the reactivity of mechano-chemically activated clays (measured either via isothermal calorimetry in blended cement pastes or compressive strength in mortars) is consistently lower than the reactivity of the same clay if thermally activated,10,26 despite apparently similar structural changes upon the formation of meta-kaolinite through both activation routes.9,18
This study aims to understand (1) the chemical and physical phenomena occurring in a natural mineral system, containing both kaolinite and goethite, caused by mechano-chemical activation, in relation to a simpler, natural reference system containing predominantly kaolinite; and (2), how these phenomena affect the activated clays' pozzolanic reactivity and hydration behaviour when used in a simulated cementitious system. Thermal and mechano-chemical treatments are therefore applied to two clays with differing geological backgrounds and Fe content. The activated clays were characterised to understand differences in phase composition (via X-ray diffraction (XRD), thermogravimetry (TG) and Fourier transform infrared spectroscopy (FTIR)), particle size and morphology (via laser diffraction, N2 sorption, scanning electron microscopy (SEM) and transmission electron microscopy (TEM)), and local coordination environments of Al, Si and Fe (via27Al and 29Si MAS NMR, electron energy loss spectroscopy (EELS) and 57Fe Mössbauer spectroscopy). The reactivity of the activated clays in a simulated cementitious system was measured using isothermal calorimetry, and differences in behaviour explained through the changes in the activated clays' structure and physical properties.
2. Materials and methods
2.1 Materials
Two kaolinitic clays were selected for this study – a purified china clay (Imerys PolwhiteE) with an Fe2O3 content of 1.1 wt% (referred to as “LoFe”), and a lithomargic clay with an Fe2O3 content of 24.4 wt% (referred to as “HiFe”). These clays were previously used to validate the use of EELS to characterise changes in Al coordination in Fe-rich kaolinitic clays;25 their phase composition was determined by quantitative XRD analysis to be 73.5 wt% kaolinite, 17.9 wt% muscovite, 5.6 wt% K-feldspar, 3.0 wt% quartz for the LoFe clay, and 62.7 wt% kaolinite, 29.0 wt% goethite, 2.7 wt% hematite, 2.6 wt% magnetite or maghemite, 1.6 wt% gibbsite, 1.0 wt% quartz, 0.3 wt% anatase for the HiFe clay. The relative uncertainty in the quantitative XRD measurements can be approximated as X0.35, where X = concentration of a given mineral in wt%., e.g. 30 wt% ±3.3, as described by Hillier.27 The chemical oxide composition of the clays was measured by X-ray fluorescence (XRF) spectrometry (Table 1), using a Rigaku ZSX Primus II, with the fused bead preparation method and a loss on ignition (LOI) heating step carried out at 900 °C for 2 hours. A conservative estimate of uncertainties for XRF measurements on clays via the fused bead method is: ±0.4 wt% for major oxides (i.e. >10 wt%); ±0.2 wt% for minor oxides (i.e. 1–10 wt%), ±0.1 wt% for trace oxides (i.e. <1 wt%).28| SiO2 | Al2O3 | Fe2O3 | K2O | TiO2 | MgO | CaO | P2O5 | Na2O | MnO | Cr2O3 | Others (<0.1 wt%) | LOI | |
|---|---|---|---|---|---|---|---|---|---|---|---|---|---|
| LoFe | 49.1 | 34.8 | 1.1 | 3.3 | — | 0.3 | 0.1 | 0.1 | 0.2 | — | — | 0.2 | 10.9 |
| HiFe | 29.5 | 25.9 | 24.4 | 0.1 | 3.1 | 0.7 | 0.5 | 0.2 | — | 0.2 | 0.1 | 0.3 | 14.9 |
2.2 Methods
Mechano-chemical activation was carried out by dry-milling the clays in air in a Retsch PM100 planetary ball mill. 10 ± 0.05 g of clay and 250 ± 0.5 g of stainless steel grinding balls (2 mm diameter) were placed in a 500 mL stainless steel milling vessel and spun at 500 rpm for 1 hour. These conditions, including a ball to powder mass ratio (BPR) of 25![[thin space (1/6-em)]](https://www.rsc.org/images/entities/char_2009.gif) :
:![[thin space (1/6-em)]](https://www.rsc.org/images/entities/char_2009.gif) 1, were shown to be effective for mechano-chemical activation of clays by Tole et al.29 The ambient temperature of the milling vessel after the mechano-chemical treatment was assessed to approximately 50 °C – this is comparable to the temperature measured by an infrared thermometer under similar milling conditions.10 After milling, the vessel was opened in a fume cupboard to minimise release of plumes of fine powders into the air. The balls were tipped onto a 1 mm sieve, and powder adhered to the balls was removed with a brush. The remnant powder left inside the milling vessel, and adhered to the vessel walls, was removed using a brush and a spatula. The name of the samples produced via these two routes are shown in Table 2.
1, were shown to be effective for mechano-chemical activation of clays by Tole et al.29 The ambient temperature of the milling vessel after the mechano-chemical treatment was assessed to approximately 50 °C – this is comparable to the temperature measured by an infrared thermometer under similar milling conditions.10 After milling, the vessel was opened in a fume cupboard to minimise release of plumes of fine powders into the air. The balls were tipped onto a 1 mm sieve, and powder adhered to the balls was removed with a brush. The remnant powder left inside the milling vessel, and adhered to the vessel walls, was removed using a brush and a spatula. The name of the samples produced via these two routes are shown in Table 2.
| Sample name | Source clay | Activation route |
|---|---|---|
| LoFe-therm | LoFe | Thermal activation |
| LoFe-mech | LoFe | Mechano-chemical activation |
| HiFe-therm | HiFe | Thermal activation |
| HiFe-mech | HiFe | Mechano-chemical activation |
Thermogravimetric (TG) curves of the as-received and activated clays were obtained using a Netzsch STA 449 F5 simultaneous thermal analyser with Netzsch QMS 403D mass spectrometry unit. The heating programme started with a 30 °C isotherm for 10 minutes, followed by a 10 °C min−1 ramp to 1000 °C. 20 mg of sample was loaded in alumina crucibles, with an N2 flow rate of 60 mL min−1. Mass spectrometry channels of mass/charge ratio of 17, 18 and 44 were used to detect the release of OH−, H2O and CO2 respectively. A beflat correction was applied to adjust for buoyancy effects. Due to initial fluctuations in the measured signal at the start of the ramp, TG curves were normalised to the mass measured at 40 °C in the heating cycle. To generate derivative (dTG) curves, the raw TG data were pre-smoothed in OriginPro software using a Loess procedure with a window of 0.1.
The activation energy of kaolinite dehydroxylation for the as-received clays was calculated using the Kissinger method.31 Differential thermogravimetric (dTG) curves were collected for heating rates of 1, 2, 5, 10 and 20 °C min−1 (see ESI Fig. S1†), and the temperatures corresponding to the dehydroxylation peak, Tp were used to construct a linear plot according to eqn (1) (see ESI Fig. S2†). The activation energy of dehydroxylation for each as-received clay was then calculated from the gradient of the linear best-fit line.
Eqn (1): the Kissinger equation. θ = heating rate (K min−1); Tp = peak temperature of dehydroxylation; EA = activation energy (kJ mol−1); R = gas constant (8.314 J K−1 mol−1). From a scatter plot, the gradient of the linear best fit line corresponds to −EA/R, from which EA can be calculated.
 | (1) |
Fourier transform infrared (FTIR) spectra of the as-received and activated clays were collected using a PerkinElmer Spectrum 2 instrument with an attenuated total reflectance (ATR) attachment. A resolution of 4 cm−1 was used, and 16 scans were collected per sample. Due to the coarser size distribution of the HiFe clay, all HiFe clay-based samples were treated by wet-grinding in isopropanol and sieving to <63 μm. No additional treatment was done for the LoFe clay-based samples, due to their smaller size distribution. Absorption bands were indexed according to Madejova and Komadel.32
Particle size distribution curves were collected using a Malvern Mastersizer 3000 laser diffraction particle size analyser. A dispersal medium of deionized water was used, with a micro spatula dose of sodium hexametaphosphate added as a dispersant. In situ ultrasonication was carried out using the in-line sonication probe at a power input of 20 W, for 5 minutes before measurement. Optical parameters of refractive index = 1.555 and absorption = 0.1 were used. Cumulative volume curves were generated from an average of 10 consecutive measurements of 4 seconds duration each. From a previous study measuring the particle size distribution of clays with the same measurement conditions, the uncertainties in d10, d50 and d90 values across three replicate measurements (using different sub-samples of clay) were in the range of 1–15%.33
N2 sorption isotherms were collected using a Micromeritics Tristar. To minimise the contribution of microporosity to surface area measurements, samples of 0.5 g mass were degassed in a Micromeritics Flowprep 060 unit for 24 hours at 135 °C under N2 flow.34 External surface areas and microporosity were calculated using the t-plot method,35 applying the Harkins and Jura thickness equation. For some clays it is known that microporosity (typically at clay platelet edges) can lead to artificially large surface area measurements when the BET method is used;36 therefore, the external surface area was calculated using the t-plot method, and the contribution of microporosity to surface area was also reported. Uncertainty in the mass measurement of each powder sample was estimated at ±50 mg (given charging effects when handling powder-containing glass tubes), leading to an estimated uncertainty in external surface area of approximately ±1%.
Secondary electron (SE) images of clay powders were taken using a Zeiss EVO 15 scanning electron microscope (SEM). Powders were tapped onto a carbon tape and sputter-coated with fine-grained iridium. An electron accelerating voltage of 20 kV was used.
27Al MAS NMR spectra were collected using a Bruker Avance III HD (500 MHz, magnetic field 11.7 T), at an operating frequency of 130.32 MHz. ZrO2 rotors of 4 mm diameter were used, with a spinning speed of νR = 12.5 kHz, an excitation pulse duration of 1.7 μs, and a relaxation delay of 10 s, with 1024 scans collected for each sample spectrum.
29Si MAS NMR spectra were collected using a Bruker Avance III HD spectrometer with a 400 MHz wide bore magnet (magnetic field 9.4 T); an operating frequency of 74.49 MHz was used, with samples spun in an alumina rotor at 6 kHz in a 7 mm solid-state NMR probe. An excitation pulse duration of 5.5 μs and a relaxation delay of 30 s were used, with 2048 scans collected for each sample spectrum. Chemical shifts were referenced to an external sample of tetramethylsilane at 0 ppm. Topspin 3.6.4 (Bruker) was used for initial phase adjustment and line broadening for both 27Al and 29Si MAS NMR spectra. Spectra were presented after constant sum normalisation.37
Scanning transmission electron microscopy (STEM) was used alongside energy dispersive spectroscopy (EDX) to identify individual mineral particles on the basis of size, morphology and elemental composition. Electron energy loss spectroscopy (EELS) at the Al K-edge was used to measure the coordination states of Al for particles of interest. A Thermofisher Titan3 Themis G2 STEM was used with a monochromator, a Thermofisher Super-X EDX detector, a Gatan OneView camera, and a Dual EELS Gatan Quantum 965 ER energy filter. Samples were prepared by dispersing in ethanol, sonicating and then drop-casting onto holey carbon film (EM resolutions). STEM operating conditions were selected in order to minimise the likelihood of damaging the beam sensitive samples, following the methods outlined in Freeman et al.38 In TEM mode, an accelerating voltage of 300 kV and a probe current of 200 pA were used, whilst limiting magnification to <185 kX maximum.
For STEM-EELS measurements, a monochromator energy spread of ca. 0.4 eV was used to achieve satisfactory energy resolution at the Al K-edge. Spectra were acquired by continuously scanning the 350 pA focussed probe over mineral plates imaged at <180 kX with an EELS collection semi-angle of 29 mrad and a convergence semi-angle of 10 mrad (as per Freeman et al.38). Any orientation dependence at the Al K-edge was minimised by acquiring spectra at a large collection angle (i.e., >10 times the characteristic scattering angle for inelastic scattering at 1560 eV energy loss) from kaolinite/meta-kaolinite plates lying flat on the carbon support film. These plates tend to lie with the c-axis normal to the film such that measurement is of plates lying in similar orientations. The dwell time of the electron probe was limited to ∼1 μs, to ensure minimal damage per dwell point. Spectra were collected for 30 s continuous scanning and then background subtracted (power law) in ‘Gatan Microscopy Suite’ software (v 3.0.1). In order to reduce spectral noise, a 40 point moving average was applied to all spectra before displaying the final results and the ‘typical’ spectrum of at least three representative spectra presented.
STEM-EDX mapping was carried out using the FEI Super-X detector and Velox software, under the same probe and acquisition conditions as for STEM-EELS. EDX spectra were used to confirm that the composition of analysed areas was consistent with that expected for kaolinite/meta-kaolinite, rather than any of the associated minerals also present in the clays.
Mössbauer spectra of the HiFe clay before and after activation were collected at both room temperature (293 K) and at low temperatures (4 K) to differentiate and quantify Fe bound in crystalline and amorphous phases.39 Spectra were collected on a MS4 Mössbauer spectrometer (SEE Co., Edina, MN, USA) equipped with a closed cycle cryostat (SHI-850, Janis Research Co., Wilmington, MA, USA). The spectrometer was operated in transmission mode with a constant acceleration of the 57Co source (Ritverc GmbH, Russia) and calibrated against a 7 μm α-Fe(0) foil. Spectral fitting was carried out with the software Recoil,40 using its Voigt-based peak fitting routine.41
3. Results and discussion
3.1 Macroscopic composition
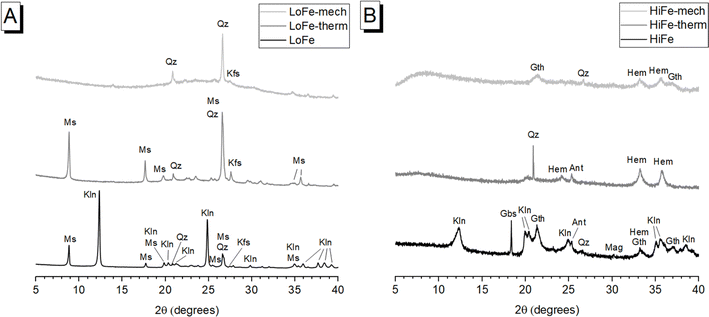
The XRD pattern of as-received LoFe clay (Fig. 1A) contained sharp diffraction peaks corresponding to kaolinite (Al2Si2O5(OH)4) (powder diffraction file (PDF) # 01-079-1570); lower intensity peaks were observed for muscovite (KAl2(AlSi3O10)(OH)2) (PDF # 01-084-1304), quartz (SiO2) (PDF# 00-046-1045) and K-feldspar (K(AlSi3O8)) (PDF# 00-019-0932). The XRD pattern of as-received HiFe clay (Fig. 1B) contained kaolinite reflections (PDF # 01-079-1570) with a broader profile, suggestive of a smaller crystallite size, and/or a more disordered structure compared to the as-received LoFe clay.25 Other peaks were attributed to associated minerals goethite (FeO(OH)) (PDF# 01-073-63522), quartz (SiO2) (PDF# 00-046-1045), gibbsite (Al(OH3)) (PDF# 01-070-2038), anatase (TiO2) (PDF# 00-021-1271), and either magnetite (Fe3O4) (PDF# 00-019-0629) or maghemite ((Fe3+0.67□0.33)Fe3+2O4, where □ denotes vacancy sites) (PDF# 00-039-1346), which are difficult to distinguish when present in minor quantities.44Thermogravimetric measurements (ESI†) showed that the kaolinite in the HiFe clay had a lower dehydroxylation activation energy, and a lower kaolinite peak dehydroxylation temperature, compared to the kaolinite in the LoFe clay (Table S1†) – both these differences also indicate a lower degree of structural order in the parent kaolinite.45,46 A greater extent of octahedral Fe3+ substitution in the HiFe clay kaolinite is expected from the laterization process,22 which in turn increases the extent of structural disorder.47,48
In terms of producing a reactive supplementary cementitious material, transformation of kaolinite to meta-kaolinite is the most significant mineralogical change in either activation process. After thermal activation, in the LoFe-therm XRD pattern (Fig. 1A) kaolinite peaks were not detectable, indicating that complete (or near-complete) dehydroxylation took place. This induced long-range structural disorder and transformed kaolinite to meta-kaolinite as shown by a diffuse intensity-hump in the range of 20–30° 2θ. In the HiFe-therm XRD pattern (Fig. 1B), most kaolinite diffraction peaks were no longer present; however, a small, broad intensity-hump at 20° 2θ could correspond to remnant kaolinite. After mechano-chemical activation, both LoFe-mech XRD pattern (Fig. 1A) and HiFe-mech XRD pattern (Fig. 1B) showed no detectable kaolinite reflections, indicating significant long-range structural disorder.
Comparing the effects of the two treatments on other minerals present in the clays is important for understanding other potential sources of pozzolanic reactivity. The most significant associated minerals by mass fraction are muscovite in the LoFe clay, and goethite in the HiFe clay. Descriptions for minor associated minerals are given in the ESI Section S2.† Muscovite diffraction peaks were still clearly visible within the LoFe-therm pattern, indicating that muscovite had not undergone significant structural transformation during thermal activation. Muscovite is a 2![[thin space (1/6-em)]](https://www.rsc.org/images/entities/char_2009.gif) :
:![[thin space (1/6-em)]](https://www.rsc.org/images/entities/char_2009.gif) 1 phyllosilicate that does undergo Al coordination changes during dehydroxylation, but unlike kaolinite it does not lose its long range order.49 However, after mechano-chemical treatment, no muscovite reflections were detectable in the XRD pattern, suggesting destruction of long-range order. Increased structural disordering of muscovite through high-energy milling has previously been reported.10,11
1 phyllosilicate that does undergo Al coordination changes during dehydroxylation, but unlike kaolinite it does not lose its long range order.49 However, after mechano-chemical treatment, no muscovite reflections were detectable in the XRD pattern, suggesting destruction of long-range order. Increased structural disordering of muscovite through high-energy milling has previously been reported.10,11
After thermal activation, goethite diffraction peaks in the HiFe clay were replaced by hematite peaks (Fe2O3) (PDF# 00-033-0664), resulting from the thermal decomposition reaction 2FeO(OH) → Fe2O3 + H2O. This indicates the goethite to hematite transformation went to completion (or near completion). An intermediate phase, ‘protohematite’, that forms immediately after the thermal decomposition of goethite,50 was not observed here as the calcination temperature of 750 °C is far higher than the dehydration temperature range of goethite (Fig. 2). After mechano-chemical treatment, broad peaks attributed to the (110) and (111) reflections of goethite, and (104) and (110) reflections of hematite, were observed together in the HiFe-mech XRD pattern, indicating only a partial dehydration of goethite to hematite. Previous studies have achieved complete transformation of goethite to hematite in a planetary ball mill, albeit at far longer milling times (e.g. 70 hours21) than the 1 hour duration used in this study.
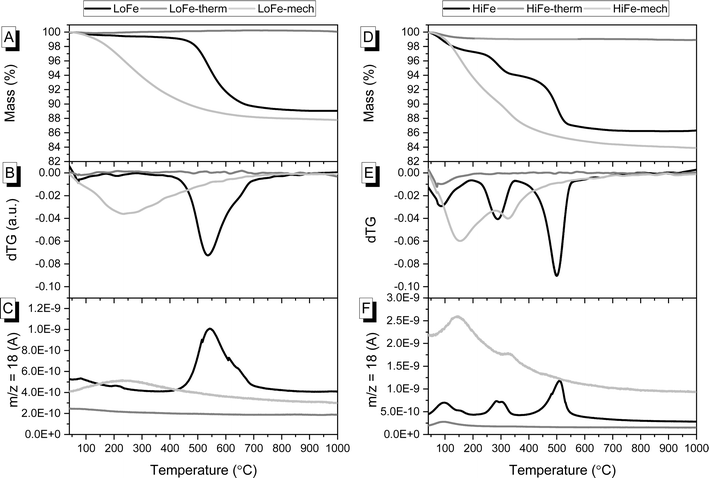 | ||
| Fig. 2 For LoFe as-received and activated clays, curves for (A) TG, (B) dTG and (C) evolved H2O. For HiFe as-received and activated clays, curves for (D) TG, (E) dTG and (F) evolved H2O. | ||
The dehydroxylation of kaolinite during activation, as well as transformations of other minerals, was confirmed with thermogravimetric analysis. The as-received LoFe clay experienced a main mass loss between 450 and 700 °C (Fig. 2A). This is highlighted by the dTG peak at 536 °C that can be attributed to the dehydroxylation of the majority kaolinite phase, with a small shoulder at 650 °C in the dTG curve that can be attributed to dehydroxylation of the ∼18 wt% muscovite (Fig. 2B).51 The dTG peaks align with peaks in the H2O signal from mass spectrometry of the evolved gas (Fig. 2C). The as-received HiFe clay experienced two main loss events: the first between 200 and 350 °C (with a dTG peak at 289 °C), attributed primarily to the thermal decomposition of goethite with a small contribution also from gibbsite (Fig. 2D and E). The second mass loss event between 350 and 600 °C (with a dTG peak at 500 °C) was attributed to the dehydroxylation of the majority kaolinite phase.
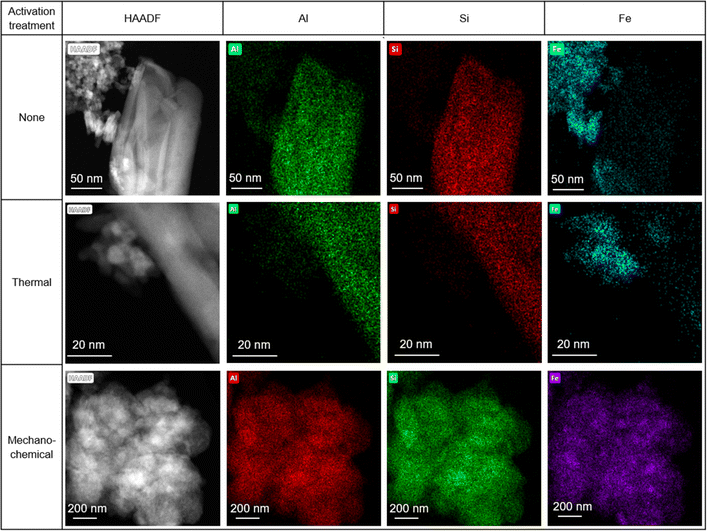
In the LoFe-therm (Fig. 2A) and HiFe-therm (Fig. 2D) TG curves there was negligible mass loss above 100 °C, indicating that the thermal treatment had successfully removed all surface water and dehydroxylated the kaolinite in both clays; and, had also dehydroxylated muscovite in the LoFe-therm clay and dehydrated goethite in the HiFe-therm clay. In the LoFe-mech and HiFe-mech curves, a loss event occurred in the range of 40–750 °C (Fig. 2B and E), corresponding to H2O evolution from surface-adsorbed water presumably generated from the mechano-chemically induced dehydroxylation (Fig. 2C and F).6 A small shoulder in the dTG curve of the HiFe-mech clay at 327 °C was attributed to the dehydroxylation of some retained goethite (Fig. 2E and F). The temperature of the goethite dehydroxylation dTG peak increased after mechano-chemical activation (from 289 °C to 327 °C) (Fig. 2E), rather than decreased as might be expected from previous studies on intensive milling of Al oxyhydroxides.52,53 The increase in goethite dehydroxylation temperature peak may be explained by substantial incorporation of Al substitutions in goethite,54 resulting from the mechano-chemical treatment; this would be consistent with the observation of a near-homogenous distribution of Fe and Al in HiFe-mech particles (shown later in Fig. 6 by STEM-EDX elemental mapping).
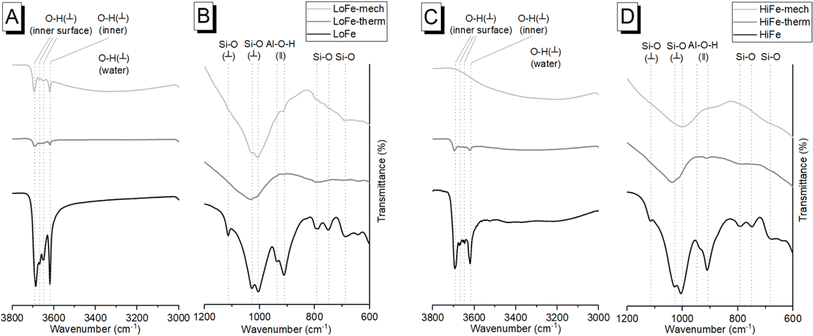
An independent confirmation of mineral dehydroxylation leading to sorbed water upon mechano-chemical activation can be obtained from FTIR spectra. For the LoFe clay spectrum, the four characteristic OH stretching bands of kaolinite were visible between 3600 and 3700 cm−1 (Fig. 3A). For both the LoFe-therm and LoFe-mech clay spectra, the intensities of all OH stretching bands in the 3600–3700 cm−1 region were reduced, along with those of the Al–O–H bending bands (937 and 911 cm−1). The LoFe-mech clay spectrum however exhibited a substantial background hump in the region of 3000–3700 cm−1, attributed to the OH stretching bands of surface-adsorbed water, and corresponding to the surface-adsorbed water released over the temperature range of 40–750 °C in the TG and dTG curves (Fig. 2). This retention of water is seen even more clearly in the HiFe-mech clay spectrum (Fig. 3C). A brief discussion on the changes relating to the aluminosilicate framework bands (Fig. 3B and D) is given in the ESI Section S3.†
The mechanism of dehydroxylation in mechano-chemical activation shares some similarities with thermal processing (i.e. calcination). Miller and Oulton17 proposed that prototropy, i.e. the migration of protons between hydroxyl groups, occurs in kaolinite during milling; a phenomenon since described in more detail.6,8,55 Calcination removes the hydroxyl groups from the system entirely (after formation of water molecules), whereas in milling, the hydroxyl groups are ‘relocated’ within the clay mineral as water either coordinated with or surface-adsorbed to the octahedral sheets.6 This retention of water has implications for applications in cementitious systems, as described later in Section 3.4.
3.2 Particle size and morphology
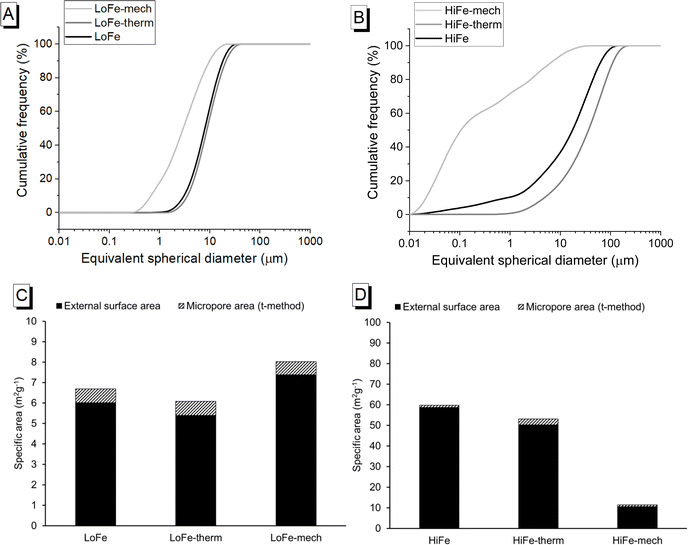
The particle size and morphology of activated clays are influential in determining the rate of reaction and the rheology of blended cement pastes containing activated clays. Thermal treatment caused a slight particle coarsening for both clays, as shown by their cumulative size distribution curves (Fig. 4A and B), and their d50 values (increasing from 8 to 9 μm, and 18 to 37 μm, for the LoFe and HiFe series respectively) (Table 3). The mechano-chemical treatment caused the particle size distribution of both clays to become significantly finer (d50 decreasing to <3 μm) (Fig. 4A and B). Reductions in d10 were proportionally much larger than those for the d50 and d90, indicating that milling is not a homogenous size reduction process and that the significant numbers of iron hydroxide/oxide nanoparticles in the HiFe clay likely intensified the size reduction of the meta-kaolinite particles in the HiFe-mech clay (further discussion is provided in Section S4 of the ESI†). The HiFe clay had a broader starting distribution of particle sizes than the LoFe clay; after the mechano-chemical treatment, HiFe-mech had a much higher proportion of extremely fine particles (71 vol% <1 μm) than LoFe-mech (18 vol% <1 μm).| Clay type | Treatment | d 10 (μm) | d 50 (μm) | d 90 (μm) |
|---|---|---|---|---|
| LoFe | None | 3 | 8 | 18 |
| Thermal | 4 | 9 | 21 | |
| Mechano-chemical | 0.7 | 3 | 10 | |
| HiFe | None | 1 | 18 | 63 |
| Thermal | 5 | 37 | 111 | |
| Mechano-chemical | 0.02 | 0.1 | 7 |
The external surface area of the as-received HiFe clay (58.7 m2 g−1) was approximately ten times higher than that of the as-received LoFe clay (6.0 m2 g−1) (Fig. 4C and D). Thermal treatment resulted in a small decrease in external surface area for both the LoFe-therm (5.4 m2 g−1) and HiFe-therm (50.2 m2 g−1) clays, consistent with the slight degree of coarsening observed in the particle size distribution curves (Fig. 4A and B). Coarsening may be expected due to some thermal aggregation between clay particles during heating at 750 °C. Full N2 isotherms are given in ESI Fig. S3.†
Despite the large differences in external surface area for the as-received clays, the mechano-chemical treatment resulted in similar external surface area values for both the LoFe-mech (7.4 m2 g−1) and HiFe-mech (10.6 m2 g−1) clays. A broadly similar phenomenon was reported after mechano-chemical activation by Klevtsov:56 a clay with a low surface area (11 m2 g−1) did not change significantly (9 m2 g−1), whereas a clay with a high surface area (60 m2 g−1) underwent a significant decrease (13 m2 g−1). The mechano-chemical treatment resulted in a finer particle distribution and a reduced external surface area. These observations can be explained by the change in particle morphology caused by mechano-chemical treatment. Fine particle agglomerates are seen in the mechano-chemically activated clays compared to both the as-received and thermally-activated clays, as shown in SEM images (Fig. 5A). The structure of individual clay platelets in the mechano-chemically activated clays were significantly disrupted compared to both the as-received and thermally-activated clays, particularly so for the HiFe-mech clay, as shown in STEM images (Fig. 5B). Cumulative porosity volume curves (calculated from the N2 desorption curves), shown in ESI Fig. S4,† indicate that HiFe-mech had a substantially lower volume of mesoporosity compared to HiFe and HiFe-therm. Lower mesoporosity volume is potentially indicative of densified aggregates, also indicated by the TEM images (Fig. 5). The changes in particle size after activation treatments observed in the SEM and TEM images (Fig. 5) were consistent with the changes observed in the size distribution curves obtained via laser diffraction (Fig. 4 and Table 3).
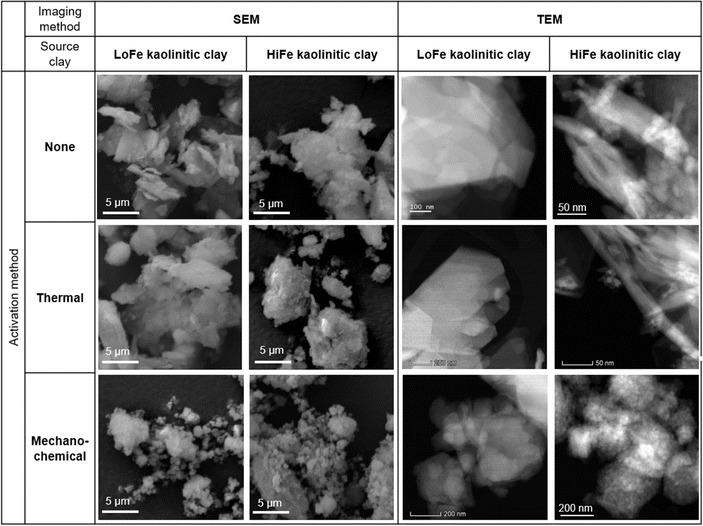 | ||
| Fig. 5 (A) SEM and (B) STEM high angle annular dark field (HAADF) images showing the size and morphology of clay particles as a function of the activation treatment adopted and type of clay. | ||
STEM-EDX maps of the as-received HiFe clay (Fig. 6) showed platelets rich in Al and Si (assigned to kaolinite) and extremely fine particles (<10 nm) rich in Fe, which were assumed to be goethite based on the prior XRD analysis (Fig. 1B). A weak signal of Fe was measured in the kaolinite particles, and a weak signal of Al was measured in the goethite particles. In the laterization process it is known that a small extent of Fe substitution for octahedral Al occurs in kaolinite, and Al substitution for Fe occurs in goethite.22 STEM-EDX maps of the HiFe-therm clay (Fig. 6) showed again platelets rich in Al and Si, and extremely fine particles rich in Fe, which were assumed to be meta-kaolinite and hematite based on the prior XRD analysis (Fig. 1B). In the STEM-EDX maps of the HiFe-mech clay (Fig. 6), a particle of ∼1 μm diameter was composed of a large number of much smaller constituent grains (∼100 nm diameter) apparently containing Al, Si and Fe. However, goethite and hematite diffraction peaks were observed in the HiFe-mech XRD pattern (Fig. 1B) and their broad profile suggests grains with nanoscale crystal sizes and likely also highly strained. The resultant material therefore appears to be an extremely fine intermixture of meta-kaolinite, goethite and hematite grains.
3.3 Coordination environments
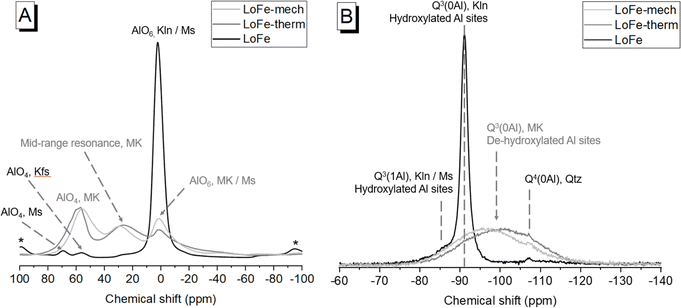
The Al and Si local environments of activated clays influence their dissolution behaviour, and hence their reactivity in cementitious systems. In the LoFe clay 27Al MAS NMR spectrum (Fig. 7A), the main AlVI resonance (δobs = 0.5 ppm) was attributed to octahedral Al in kaolinite and muscovite. A minor AlIV resonance was attributed to tetrahedral Al in muscovite (δobs = 69.0 ppm),57 and another minor AlIV resonance to K-feldspar (δobs = 55.5 ppm)58 with the additional potential for some contribution from tetrahedral Al substitutions in kaolinite.59 Dehydroxylation occurs via the reaction of two neighbouring –OH sites to release an H2O molecule, leaving behind an –O group on one site and the other site unoccupied. Conventionally, this process is expected to cause a reduction in coordination of Al sites (which occupy two thirds of available octahedral sites in kaolinite) from AlVI in kaolinite, to a mixture of AlVI, AlV and AlIV in meta-kaolinite;60 however, the precise sequence of structural changes during the dehydroxylation process is still contested.61 After the thermal and mechano-chemical treatments (Fig. 7A), the spectra exhibited AlIV and mid-range resonances of comparable intensity to the broadened AlVI resonance. As described by Marsh et al.,25 ‘mid-range resonance’ acknowledges the ongoing debate around whether this central resonance in meta-kaolinite truly arises from AlV, or is in fact AlIV having undergone a substantial deviation in chemical shift due to disorder effects.62–64 Quadrupolar broadening was observed in the LoFe-therm spectrum and attributed to distorted coordination spheres,65 as indicated by the loss of structural order in kaolinite observed from XRD patterns (Fig. 1A).In the 29Si MAS NMR spectrum (Fig. 7B) of the LoFe clay, the main resonance (δobs = −91.1 ppm) was attributed to Q3(0Al) in kaolinite, the high-field shoulder (δobs = −85.5 ppm) to Q3(1Al) in kaolinite and muscovite, and the weak Q4 resonance (δobs = −107.1 ppm) to quartz. After both activation routes, a broad Q3(0Al) (possibly with a Q4 component) resonance centred at δobs = −100 ppm for LoFe-therm, and at δobs = −97 ppm for Lo-Fe-mech, was attributed to Si tetrahedral sites in meta-kaolinite with a range of bond lengths and angles.62 The weak quartz resonance was still present in the same position, on the shoulder of the broad Q3(0Al) resonance. The changes observed are consistent with numerous previous reports on the kaolinite to meta-kaolinite transformation, through both thermal and mechano-chemical activation routes (as described by Kloprogge18 and references therein). MAS NMR measurements on the as-received or activated HiFe clays were not feasible due to the high Fe content of the HiFe clay (24.4 wt% Fe2O3), because the paramagnetic/ferrimagnetic properties of Fe and its oxides cause significant degradation of spectral quality when present in high concentrations.24
There are two main differences between the spectra for the two activation routes. Firstly, the LoFe-mech spectrum exhibited a more prominent and better-resolved AlVI resonance than the LoFe-therm spectrum (Fig. 7A) – this could indicate a marginally more ordered AlVI environment in the octahedral sheet of LoFe-mech compared to LoFe-therm. Secondly, the broad Q3(0Al) meta-kaolinite resonance was shifted further downfield for LoFe-therm compared to LoFe-mech (Fig. 7B). The same two differences between mechano-chemically and thermally activated kaolinitic clays' 27Al and 29Si MAS NMR spectra were reported by Mañosa et al.9 Lower Q3(0Al) chemical shifts have been associated with increased disorder induced over longer grinding durations.66 The positions of the Q3(0Al) resonances suggest that the meta-kaolinite tetrahedral sheet in LoFe-therm is more highly disordered than that in LoFe-mech. These two differences over the 27Al and 29Si MAS NMR spectra suggest that the local bonding environment in meta-kaolinite deviated further from the original kaolinite for the LoFe-therm clay compared to the LoFe-mech clay. This minor apparent structural difference contrasts with the more profound effects mechano-chemical treatment had on the micro- and nano-scale structure of particle sizes and morphologies, as seen in the previous section.
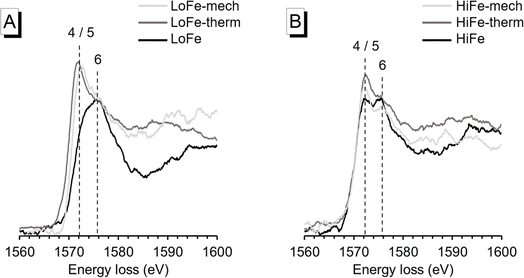
To confirm the changes in Al bonding environment, EEL spectroscopy at the Al K-edge was used and can, in contrast to solid state NMR spectroscopy, also be applied to samples with high Fe content. In agreement with 27Al MAS NMR results, EEL spectra for the LoFe-therm and LoFe-mech clays had similar profiles. The position of the main peak (∼1572 eV) is associated with 4- and/or 5-fold coordination, compared to the main peak position of the as-received LoFe clay (∼1576 eV) that is associated with 6-fold coordination25 (Fig. 8A). Similarly, the Al K-edge profiles of the HiFe-therm and HiFe-mech spectra exhibited a higher intensity of the peak associated with 4- and/or 5-fold coordination compared to the peak associated with 6-fold coordination (Fig. 8B). In contrast to LoFe clay, the as-received HiFe clay spectrum already exhibited the same two peaks; and, in contrast to the activated HiFe clays, both peaks had similar intensity. These observations are consistent with the 27Al MAS NMR spectra (Fig. 7), showing that whilst there are small differences in the local Al bonding environments between the thermally and mechano-chemically activated clays, they both possess a range of Al coordination states in a highly disordered local bonding environment.
Measuring the coordination and binding environment of Fe in the HiFe as-received and treated clays provides more insight to the transformation from goethite to hematite during the two activation routes, and the composition of the highly disordered final phases produced upon mechano-chemical activation. Hyperfine spectral parameters are provided in Table S4 of the ESI.† For the as-received HiFe clay, the room temperature (RT) Mössbauer spectrum indicates all of the Fe is present as Fe3+, given the presence of a large central doublet feature and an additional small sextet (Fig. 9A). Consistent with the HiFe clay's XRD pattern (Fig. 1B) and TG curve (Fig. 2D), magnetic ordering of the majority of Fe3+ in the low-temperature (LHT) spectrum and the associated hyperfine parameters of the sextet suggest the presence of nano-sized goethite.67 Up to 5% Fe may be present within kaolinite, given the persistence of an Fe doublet at LHT (CS: 0.45 mm s−1, QS: 0.61 mm s−1) – this would be consistent with known geochemical processes in lateritic horizons, which result in Fe3+ substitutions for Al3+ sites in the kaolinite octahedral sheet.22
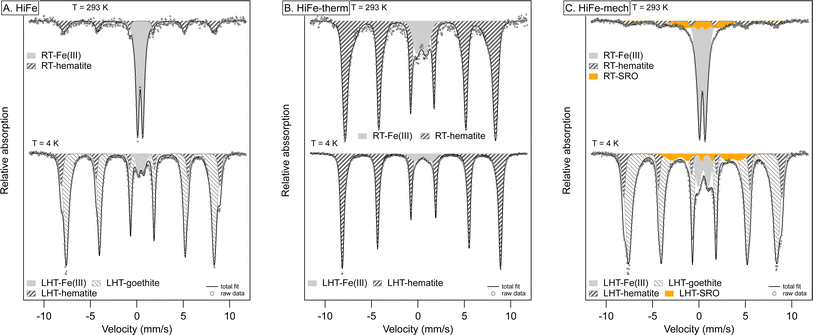 | ||
| Fig. 9 Mössbauer spectra of HiFe clay as-received (A), after thermal treatment (B) and after mechanical treatment (C). Spectra were collected at room temperature (RT: 293 K) and at low temperature (LHT: 4 K). Hyperfine parameters of the Fe components used in the fit are listed in Table S5 in the ESI.† | ||
The dominant sextet with typical hyperfine parameters for hematite (CS: 0.37 mm s−1, QS: −0.11 mm s−1, H: 49.1 T) in HiFe-therm RT Mössbauer spectrum (Fig. 9B) confirms the XRD results (Fig. 1B) that thermal treatment converted the goethite into hematite. The suggested Fe3+ octahedral substitutions within the starting kaolinite were still present in the meta-kaolinite, as indicated by a minor doublet component (3% spectral area) remaining at LHT. However, the quadrupole split (QS) value of 1.07 mm s−1 was large relative to the typical octahedral coordination in sheet silicates (QS: 0.4–0.9 mm s−1)68 and suggests an altered and disordered Fe binding environment.
After mechano-chemical treatment, the RT spectrum was very similar to that of the as-received sample and showed broadening of the hematite sextet and an additional collapsed component (orange area in Fig. 9C), both indicative of alterations and increased disorder. Similar to the HiFe-therm clay spectrum, the Fe3+ octahedral substitutions in the starting kaolinite were still present in the meta-kaolinite, albeit in a more disordered binding environment suggested by the higher QS value (1.09 mm s−1) of the Fe3+ doublet. A proportion (∼8%) of the nano-goethite was turned into a largely disordered phase with some potential similarities to short-range-order Fe phases in tropical soils,39 given the presence of a collapsed sextet at LHT (orange area in Fig. 9C). The STEM-EDX map of the HiFe-mech particles showed extensive intermixing of Al, Si and Fe (Fig. 6); whilst the Mössbauer spectrum indicates the presence of Fe3+ in highly disordered local environments, this could correspond to an intermixture of extremely fine goethite and meta-kaolinite, or possibly indicate the formation of a distinct highly disordered and highly substituted phase.
3.4 Reactivity in simulated cementitious systems
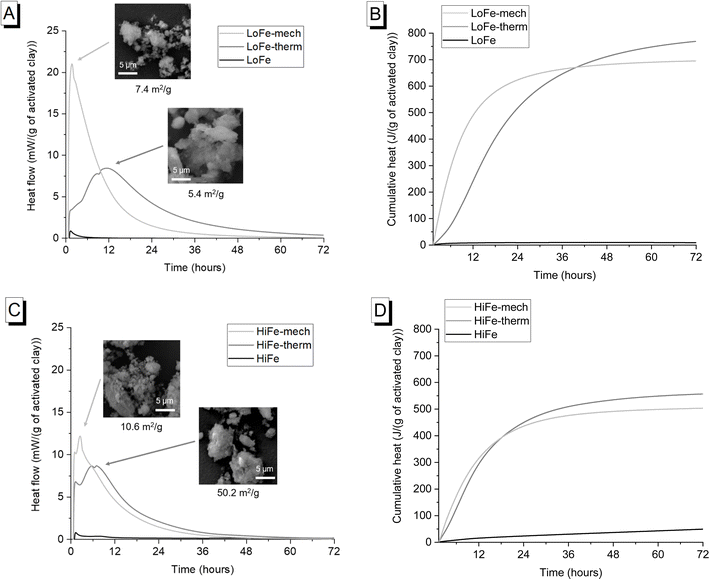
Mechano-chemical activation enhanced early age (<12 hours after mixing) heat release and therefore reactivity in the simulated cementitious systems in comparison to thermal activation (Fig. 10A and C). This acceleration at <12 hours is consistent with previous investigations of hydration kinetics using mechano-chemically and thermally activated kaolinitic clays in blended cements.26 It represents an actual increased pozzolanic reaction at early ages for the mechano-chemically activated clays, given that the R3 test measures chemical reactivity and excludes potential filler effects from additions.69The early age reactivity benefits of the mechano-chemical activation route were not sustained at later times. Cumulative heat release for the thermally-activated clay exceeded that of the mechano-chemically activated clay after 40 hours for the LoFe clays (Fig. 10B) and after 18.5 hours for the HiFe clays (Fig. 10D). A similar trend was seen in strength data, with slightly higher 28 day compressive strengths in blended cement mortars for thermal activation compared to mechano-chemical activation.10,26 All the activated clays were classified as “moderately reactive” based on their 7 day cumulative heat values, using the RILEM TC-TRM scheme43 (see ESI Fig. S5† for values). Comparing the as-received clays, heat release by 72 hours was higher for the HiFe clay than the LoFe clay, resulting from a higher extent of dissolution of kaolinite – this indicates the kaolinite in the HiFe clay has higher structural disorder and/or finer particle size70 (compared to the as-received LoFe clay), consistent with the characterisation in previous sections.
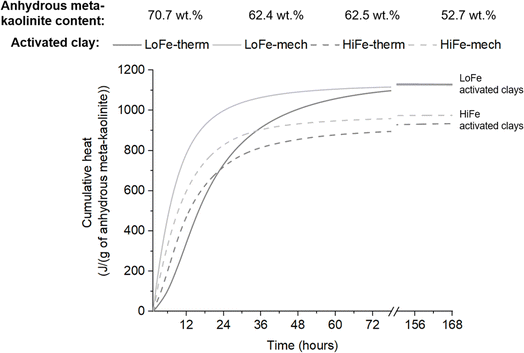
To obtain a better understanding of how activation treatment affects reaction kinetics and cumulative heat evolution, the cumulative heat curves were normalised by the mass of anhydrous meta-kaolinite in each activated clay. Anhydrous meta-kaolinite is defined here as the alumino-silicate oxide framework structure, excluding structural hydroxyls and surface adsorbed water. In thermal activation, structural hydroxyls (as well as surface adsorbed water) are removed from the system during the heating process. In mechano-chemical activation, structural hydroxyls undergo dehydroxylation but the evolved water molecules are then adsorbed onto surface sites with a range of binding energies. As a result, a minor mass proportion of the mechano-chemically activated clay is surface adsorbed moisture, whereas negligible quantities of surface adsorbed moisture are present in thermally activated clays (Fig. 2); the same phenomenon has previously been shown for thermally and mechano-chemically activated montmorillonitic clays.33 The mass proportion of anhydrous meta-kaolinite in the activated clays was estimated using TG data (description and values provided in Tables S2 and S3 in the ESI†).
The cumulative heat per unit mass of anhydrous meta-kaolinite for the two activation routes converge to very similar values for each clay at 72 hours and beyond (Fig. 11). On this basis, thermal and mechano-chemical activation of kaolinite are equally effective in cement blends at later age reactivity. It is the presence of retained moisture in the mechano-chemically activated clay that explains their slightly lower cumulative heat values (relative to the thermally activated clays) when normalised in the conventional manner per unit mass of activated clay (Fig. 10). This phenomenon explains previous observations that later age strength of blended cement mortars made with mechano-chemically activated kaolinitic clays were consistently slightly lower than those made with thermally activated kaolinitic clays;10,26i.e. they would have similar strengths when normalised to the mass proportion of anhydrous meta-kaolinite in the activated clays. The different geological origins of the two clays results in small differences in structural order (Fig. 1 and Table S1†) and local bonding environments (Fig. 7 and 8) of the kaolinites in the as-received clays. These factors may explain why the transformed, anhydrous meta-kaolinite in the activated LoFe clays is more reactive than that of the activated HiFe clays (Fig. 11).
3.5 Explanation of differences in effectiveness of mechano-chemical activation to increase early age reactivity
Reactivity of activated clays in the first 24 hours of a setting blended cement is industrially important, because sufficient strength development is typically needed in this time period to prevent delays in the construction process. The slower reactivity of thermally activated clays compared to Portland clinker limits how much Portland clinker can be replaced by calcined clays, and therefore also limits achievable reductions in embodied carbon.71 Souri et al.26 attributed the acceleration of early age hydration in blended cements containing mechano-chemically activated clay to the higher specific surface area of the clay compared to a thermally activated clay. Increased specific surface area would lead to an accelerated pozzolanic reaction and an enhanced filler effect. Indeed, the association between higher external surface area and accelerated early age reactivity holds true for the LoFe-mech clay (7.4 m2 g−1) compared to the LoFe-therm clay (5.4 m2 g−1). However, the acceleration effect cannot be explained by increased surface area alone because the HiFe-mech clay still had a moderate enhancement of early age reactivity despite having a significantly lower external surface area (10.6 m2 g−1) than the HiFe-therm clay (50.2 m2 g−1).Intensive milling of quartz leads to an increase in radicals and non-bridging oxygens on quartz surfaces,13,14,72 which could intuitively be expected to increase Si dissolution from quartz and hence increase reactivity. However, increases in strength of cementitious materials made using intensively milled quartz have been attributed to enhanced formation of reaction products around the quartz surface, rather than a contribution of soluble silica to binder phase formation.14,72 For this reason, and given the low quantities of quartz in the starting clays (<3 wt% in both LoFe and HiFe), quartz is not expected to have a meaningful impact on chemical reactivity of the mechano-chemically activated clays. Therefore, meta-kaolinite is still the most important mineral phase for explaining reactivity of these activated clays.
As kaolinite particles are fractured during milling, additional edge surfaces are formed. Klevtsov et al.56 inferred that the reduction in kaolinite crystallite size through intensive milling would increase the ratio of edge surface area to basal surface area of kaolinite. As dissolution occurs faster at edge surfaces of kaolinite compared to basal surfaces,73 a higher edge![[thin space (1/6-em)]](https://www.rsc.org/images/entities/char_2009.gif) :
:![[thin space (1/6-em)]](https://www.rsc.org/images/entities/char_2009.gif) basal surface area ratio would lead to faster dissolution per unit mass of anhydrous meta-kaolinite. In parallel, re-agglomeration occurs concurrently with fracture during intensive milling (Fig. 5). Thus, whilst the primary particle size of kaolinite and/or meta-kaolinite is decreasing during milling, the overall external surface area is governed by the formation of agglomerates. These parallel, opposing processes can help explain why the HiFe-mech clay (compared to the HiFe-therm clay) had a finer particle size distribution yet also a lower external surface area (Fig. 4), and still achieved enhanced early age reactivity (Fig. 11). A greater contribution of edge surface area, and higher edge
basal surface area ratio would lead to faster dissolution per unit mass of anhydrous meta-kaolinite. In parallel, re-agglomeration occurs concurrently with fracture during intensive milling (Fig. 5). Thus, whilst the primary particle size of kaolinite and/or meta-kaolinite is decreasing during milling, the overall external surface area is governed by the formation of agglomerates. These parallel, opposing processes can help explain why the HiFe-mech clay (compared to the HiFe-therm clay) had a finer particle size distribution yet also a lower external surface area (Fig. 4), and still achieved enhanced early age reactivity (Fig. 11). A greater contribution of edge surface area, and higher edge![[thin space (1/6-em)]](https://www.rsc.org/images/entities/char_2009.gif) :
:![[thin space (1/6-em)]](https://www.rsc.org/images/entities/char_2009.gif) basal surface area ratio, is likely to be more relevant than overall external surface area for explaining the accelerated early age reactivity in mechano-chemically activated samples, by way of promoting faster dissolution rates. Two additional factors may contribute. First, heat flow is related to the dissolution of Al and Si, which for these activated clays is provided near wholly by the meta-kaolinite. But from the STEM-EDX maps (Fig. 6), it is clear that extremely fine particles of goethite and/or hematite contribute to the external surface area of the HiFe clays. Secondly, the external surface area accessible by gaseous N2 molecules may not be equivalent to the external surface area accessible by OH− anions in an aqueous solution.
basal surface area ratio, is likely to be more relevant than overall external surface area for explaining the accelerated early age reactivity in mechano-chemically activated samples, by way of promoting faster dissolution rates. Two additional factors may contribute. First, heat flow is related to the dissolution of Al and Si, which for these activated clays is provided near wholly by the meta-kaolinite. But from the STEM-EDX maps (Fig. 6), it is clear that extremely fine particles of goethite and/or hematite contribute to the external surface area of the HiFe clays. Secondly, the external surface area accessible by gaseous N2 molecules may not be equivalent to the external surface area accessible by OH− anions in an aqueous solution.
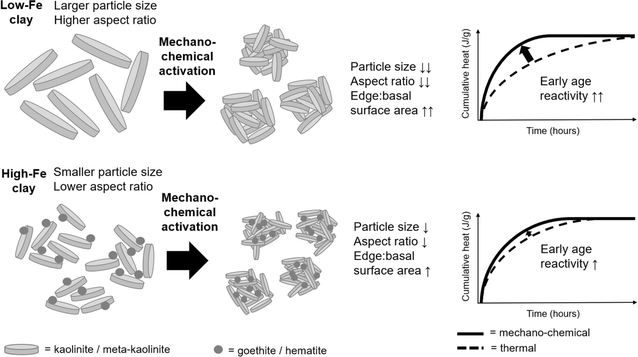
Particle aspect ratio and availability of meta-kaolinite edge sites also helps to explain why the relative acceleration effect of mechano-chemical activation compared to thermal activation was much stronger for the LoFe clay than for the HiFe clay. SEM and STEM images (Fig. 5) showed kaolinite particles were larger in the LoFe clay than the HiFe clay, plus the activation energies of dehydroxylation (Table S1†) together with the EEL spectra (Fig. 8) suggest that the kaolinite in the LoFe clay was more ordered. Thus, the edge![[thin space (1/6-em)]](https://www.rsc.org/images/entities/char_2009.gif) :
:![[thin space (1/6-em)]](https://www.rsc.org/images/entities/char_2009.gif) basal surface area is expected to be lower for the LoFe clay than for HiFe clay.70 This is consistent with the clays' dehydroxylation peak shapes in the differential thermogravimetric curves (Fig. 2). Vizcayno et al.74 state that smaller, more disordered kaolinite particles exhibit an asymmetric dTG profile weighted towards the low-temperature side, based on the lower binding energies of edge-exposed hydroxyl sites. After mechano-chemical activation, a larger relative increase in edge
basal surface area is expected to be lower for the LoFe clay than for HiFe clay.70 This is consistent with the clays' dehydroxylation peak shapes in the differential thermogravimetric curves (Fig. 2). Vizcayno et al.74 state that smaller, more disordered kaolinite particles exhibit an asymmetric dTG profile weighted towards the low-temperature side, based on the lower binding energies of edge-exposed hydroxyl sites. After mechano-chemical activation, a larger relative increase in edge![[thin space (1/6-em)]](https://www.rsc.org/images/entities/char_2009.gif) :
:![[thin space (1/6-em)]](https://www.rsc.org/images/entities/char_2009.gif) surface area for the LoFe-mech clay (due to particle size reduction and disordering) would result in a greater early age reactivity acceleration than for the HiFe-mech clay (which has reduced edge site exposure due to nanoscale agglomeration with goethite and hematite) (Fig. 11).
surface area for the LoFe-mech clay (due to particle size reduction and disordering) would result in a greater early age reactivity acceleration than for the HiFe-mech clay (which has reduced edge site exposure due to nanoscale agglomeration with goethite and hematite) (Fig. 11).
Overall, the greater relative efficacy of mechano-chemical activation (relative to thermal activation) of kaolinitic clays for enhancing early age (<12 hours) reactivity in a simulated cementitious system can largely be explained through its capability to transform kaolinite to meta-kaolinite, whilst also achieving greater reduction of particle size and potentially a higher ratio of edge![[thin space (1/6-em)]](https://www.rsc.org/images/entities/char_2009.gif) :
:![[thin space (1/6-em)]](https://www.rsc.org/images/entities/char_2009.gif) basal surface area of meta-kaolinite. However, precise effects are dependent on the different interactions of:
basal surface area of meta-kaolinite. However, precise effects are dependent on the different interactions of:
(a) ‘Intrinsic’ mineralogical characteristics, i.e. differences in particle size and morphology, and structural order in the as-received clays.
(b) ‘Extrinsic’ processing effects, i.e. differences in the effects of intensive milling on particle size and morphology, and structural order.
The enhancement in early age reactivity of a cement blended with mechano-chemical activated clays is governed by (b) but from a baseline set by (a), as is shown schematically in Fig. 12. The larger and more ordered the starting kaolinite, the more likely it is to have enhanced reactivity upon mechano-chemical activation. In addition, the presence of, and interaction with, Fe-bearing associated minerals may affect the size and structural order of the activated kaolinite (thereby affecting the extent of early age reactivity enhancement) and will reduce the long-term reactivity of the activated clay. Nonetheless for consistency, the later age performance of blended cement mortars made with mechano-chemically activated kaolinitic clays should be assessed by unit mass of anhydrous meta-kaolinite in the activated clay. While it is suggested that the edge![[thin space (1/6-em)]](https://www.rsc.org/images/entities/char_2009.gif) :
:![[thin space (1/6-em)]](https://www.rsc.org/images/entities/char_2009.gif) basal surface area of meta-kaolinite is the critical factor that governs early age performance of a mechano-chemically activated clay in a simulated cementitious system. Using atomic force microscopy to directly measure the dimensions of individual meta-kaolinite particles in mechano-chemically activated clays, and hence measure their edge
basal surface area of meta-kaolinite is the critical factor that governs early age performance of a mechano-chemically activated clay in a simulated cementitious system. Using atomic force microscopy to directly measure the dimensions of individual meta-kaolinite particles in mechano-chemically activated clays, and hence measure their edge![[thin space (1/6-em)]](https://www.rsc.org/images/entities/char_2009.gif) :
:![[thin space (1/6-em)]](https://www.rsc.org/images/entities/char_2009.gif) basal surface area ratios, could provide direct confirmation or contradiction of this proposed explanation. However, isolating individual meta-kaolinite particles from the strong agglomerates formed during the mechano-chemical treatment is expected to be challenging.
basal surface area ratios, could provide direct confirmation or contradiction of this proposed explanation. However, isolating individual meta-kaolinite particles from the strong agglomerates formed during the mechano-chemical treatment is expected to be challenging.
4. Conclusions
The effects on early (12 h) and later (7 d) age reactivity of intensively milled kaolinitic clays in simulated cementitious systems can be understood in terms of parallel processes of mechano-chemical activation (dehydroxylation of kaolinite to meta-kaolinite and increasing structural disorder) and mechanical activation (reduction of kaolinite or meta-kaolinite primary particle size, and increase in ratio of edge![[thin space (1/6-em)]](https://www.rsc.org/images/entities/char_2009.gif) :
:![[thin space (1/6-em)]](https://www.rsc.org/images/entities/char_2009.gif) basal surface area). A clay's starting characteristics, resulting from its geological formation route, also influence the effects of intensive milling. The mass of anhydrous meta-kaolinite is the key parameter that governs the later age reactivity and performance of an activated clay in cementitious systems.
basal surface area). A clay's starting characteristics, resulting from its geological formation route, also influence the effects of intensive milling. The mass of anhydrous meta-kaolinite is the key parameter that governs the later age reactivity and performance of an activated clay in cementitious systems.
The added benefit of mechano-chemical activation, insofar as enhancing early age pozzolanic reactivity, was greater for a low-Fe clay relative to an Fe-rich clay that contained kaolinite of larger particle size and greater structural order. However, mechano-chemically activated metakaolins of either origin may be valuable for cementitious products that require fast strength development with minimal clinker content (and hence minimal embodied carbon).
A challenge common to all mechano-chemical research is scale-up.75,76 This is particularly so for clay activation since cementitious materials are high volume, low value. It would be timely to test whether up-scaling solutions successfully deployed for mechano-chemical processing of other materials, particularly larger, horizontal axis ball mills77 and extruders,78 can be effective for clay activation. Once feasible solutions for up-scaled mechano-chemical activation processes have been tested, the key question of their embodied energy (especially in comparison to up-scaled thermal activation processes) can then be addressed.
Data availability
All data associated with this paper are openly available from the University of Leeds Data Repository https://doi.org/10.5518/1563.Author contributions
A. T. M. Marsh: conceptualization, investigation, resources, writing – original draft, supervision, project administration, funding acquisition; A. P. Brown: methodology, investigation, writing – review & editing; H. M. Freeman: methodology, investigation; A. Neumann: methodology, investigation, writing – review & editing; M. C. Stennett: methodology, investigation; B. Walkley: methodology; investigation; funding acquisition; writing – review & editing; H. Pendlowski: methodology, investigation; S. A. Bernal: resources, supervision, funding acquisition, writing – review & editing.Conflicts of interest
There are no conflicts to declare.Acknowledgements
This study was sponsored via the White Rose Collaboration Fund project “Enhancing analytical capabilities in soils for low-carbon technologies”, and an EPSRC Early Career Fellowship (EP/R001642/1). Thanks are given to Vicky Leadley and Dan Geddes for assistance with 27Al MAS NMR measurements, to Sreejith Krishnan for advice on XRD analysis, and to Maggie White for assistance with the Mössbauer spectroscopy measurements. Thanks are also given to Mark Hodson, Rob Mills and Amy Wright for helpful discussions around clay characterisation. All data created during this research are openly available from the University of Leeds Data Repository https://doi.org/10.5518/1563.References
- G. Kaupp, CrystEngComm, 2009, 11, 388–403 RSC
.
- P. Baláž, M. Achimovičová, M. Baláž, P. Billik, Z. Cherkezova-Zheleva, J. M. Criado, F. Delogu, E. Dutková, E. Gaffet, F. J. Gotor, R. Kumar, I. Mitov, T. Rojac, M. Senna, A. Streletskii and K. Wieczorek-Ciurowa, Chem. Soc. Rev., 2013, 42, 7571–7637 RSC
.
- R. T. O'Neill and R. Boulatov, Nat. Rev. Chem., 2021, 5, 148–167 CrossRef PubMed
.
- G. Habert, S. A. Miller, V. M. John, J. L. Provis, A. Favier, A. Horvath and K. L. Scrivener, Nat. Rev. Earth Environ., 2020, 1, 559–573 CrossRef
.
- I. Tole, K. Habermehl-Cwirzen and A. Cwirzen, Mineral. Petrol., 2019, 113, 449–462 CrossRef CAS
.
- R. L. Frost, É. Makó, J. Kristóf, E. Horváth and J. T. Kloprogge, J. Colloid Interface Sci., 2001, 239, 458–466 CrossRef CAS PubMed
.
- E. Horváth, R. L. Frost, É. Makó, J. Kristóf and T. Cseh, Thermochim. Acta, 2003, 404, 227–234 CrossRef
.
- J. Mañosa, J. C.-d. la Rosa, A. Silvello, A. Maldonado-Alameda and J. M. Chimenos, Appl. Clay Sci., 2023, 238, 106918 CrossRef
.
- J. Mañosa, A. M. Gómez-Carrera, A. Svobodova-Sedlackova, A. Maldonado-Alameda, A. Fernández-Jiménez and J. M. Chimenos, Appl. Clay Sci., 2022, 228, 106648 CrossRef
.
- V. A. Baki, X. Ke, A. Heath, J. Calabria-Holley, C. Terzi and M. Sirin, Cem. Concr. Res., 2022, 162, 106962 CrossRef CAS
.
- G. Yao, H. Zang, J. Wang, P. Wu, J. Qiu and X. Lyu, Clays Clay Miner., 2019, 67, 209–216 CrossRef CAS
.
- J. Mañosa, A. Alvarez-Coscojuela, J. Marco-Gibert, A. Maldonado-Alameda and J. M. Chimenos, Appl. Clay Sci., 2024, 250, 107266 CrossRef
.
- K. Gobindlal, Z. Zujovic, P. Yadav, J. Sperry and C. C. Weber, J. Phys. Chem. C, 2021, 125, 20877–20886 CrossRef CAS
.
- G. Yao, T. Cui, J. Zhang, J. Wang and X. Lyu, Adv. Powder Technol., 2020, 31, 4500–4509 CrossRef CAS
.
- A. Peys, V. Isteri, J. Yliniemi, A. S. Yorkshire, P. N. Lemougna, C. Utton, J. L. Provis, R. Snellings and T. Hanein, Cem. Concr. Res., 2022, 157, 106834 CrossRef CAS
.
- C. R. Kaze, G. L. Lecomte-Nana, E. Kamseu, P. S. Camacho, A. S. Yorkshire, J. L. Provis, M. Duttine, A. Wattiaux and U. C. Melo, Cem. Concr. Res., 2021, 140, 106320 CrossRef CAS
.
- J. G. Miller and T. D. Oulton, Clays Clay Miner., 1970, 18, 313–323 CrossRef CAS
.
-
J. Kloprogge, in Spectroscopic Methods in the Study of Kaolin Minerals and Their Modifications, ed. J. Kloprogge, Springer International Publishing, Cham, 2019, pp. 161–241 Search PubMed
.
- R. C. Reynolds and D. L. Bish, Am. Mineral., 2002, 87, 1626–1630 CrossRef CAS
.
- G. González, A. Sagarzazu and R. Villalba, Mater. Res. Bull., 2000, 35, 2295–2308 CrossRef
.
- J. Šubrt, L. A. Pérez-Maqueda, J. M. Criado, C. Real, J. Boháček and E. Večerníková, J. Am. Ceram. Soc., 2000, 83, 294–298 CrossRef
.
- A. Beauvais, Geochim. Cosmochim. Acta, 1999, 63, 3939–3957 CrossRef CAS
.
- A. Tironi, M. A. Trezza, A. N. Scian and E. F. Irassar, Constr. Build. Mater., 2012, 28, 276–281 CrossRef
.
- R. J. Kirkpatrick, K. A. Smith, S. Schramm, G. Turner and W.-H. Yang, Annu. Rev. Earth Planet. Sci., 1985, 13, 29–47 CrossRef CAS
.
- A. T. M. Marsh, A. P. Brown, H. M. Freeman, B. Walkley, H. Pendlowski and S. A. Bernal, Appl. Clay Sci., 2024, 255, 107402 CrossRef CAS
.
- A. Souri, H. Kazemi-Kamyab, R. Snellings, R. Naghizadeh, F. Golestani-Fard and K. Scrivener, Cem. Concr. Res., 2015, 77, 47–59 CrossRef CAS
.
-
S. Hillier, in Clay Mineral Cements in Sandstones, 1999, pp. 213–251 Search PubMed
.
- M. F. Gazulla, S. Vicente, M. Orduña and M. J. Ventura, X-Ray Spectrom., 2012, 41, 176–185 CrossRef CAS
.
- I. Tole, K. Habermehl-Cwirzen, M. Rajczakowska and A. Cwirzen, Materials, 2018, 11, 1860 CrossRef PubMed
.
- L. N. Warr, Mineral. Mag., 2021, 85, 291–320 CrossRef CAS
.
- H. E. Kissinger, Anal. Chem., 1957, 29, 1702–1706 CrossRef CAS
.
- J. Madejová and P. Komadel, Clays Clay Miner., 2001, 49, 410–432 CrossRef
.
- A. T. M. Marsh, S. Krishnan and S. A. Bernal, Cem. Concr. Res., 2024, 181, 107546 CrossRef CAS
.
- V. Metz, H. Raanan, H. Pieper, D. Bosbach and J. Ganor, Geochim. Cosmochim. Acta, 2005, 69, 2581–2591 CrossRef CAS
.
- J. H. de Boer, B. C. Lippens, B. G. Linsen, J. C. P. Broekhoff, A. van den Heuvel and T. J. Osinga, J. Colloid Interface Sci., 1966, 21, 405–414 CrossRef CAS
.
- S. Kaufhold, R. Dohrmann, M. Klinkenberg, S. Siegesmund and K. Ufer, J. Colloid Interface Sci., 2010, 349, 275–282 CrossRef CAS PubMed
.
- P. Giraudeau, I. Tea, G. S. Remaud and S. Akoka, J. Pharm. Biomed. Anal., 2014, 93, 3–16 CrossRef CAS PubMed
.
- H. M. Freeman, J. P. H. Perez, N. Hondow, L. G. Benning and A. P. Brown, Micron, 2019, 122, 46–52 CrossRef CAS PubMed
.
- A. Thompson, D. G. Rancourt, O. A. Chadwick and J. Chorover, Geochim. Cosmochim. Acta, 2011, 75, 119–133 CrossRef CAS
.
-
K. Lagarec and D. G. Rancourt, Recoil-Mössbauer Spectral Analysis Software for Windows, University of Ottawa, Ottawa, ON, 1998 Search PubMed
.
- D. G. Rancourt and J. Y. Ping, Nucl. Instrum. Methods Phys. Res., Sect. A, 1991, 58, 85–97 CrossRef
.
- C1897 − 20. Standard Test Methods for Measuring the Reactivity of Supplementary Cementitious Materials by Isothermal Calorimetry and Bound Water Measurements, ASTM International, West Conshohocken, PA, 2020 Search PubMed.
- D. Londono-Zuluaga, A. Gholizadeh-Vayghan, F. Winnefeld, F. Avet, M. Ben Haha, S. A. Bernal, Ö. Cizer, M. Cyr, S. Dolenec, P. Durdzinski, J. Haufe, D. Hooton, S. Kamali-Bernard, X. Li, A. T. M. Marsh, M. Marroccoli, M. Mrak, Y. Muy, C. Patapy, M. Pedersen, S. Sabio, S. Schulze, R. Snellings, A. Telesca, A. Vollpracht, G. Ye, S. Zhang and K. L. Scrivener, Mater. Struct., 2022, 55, 142 CrossRef CAS
.
- C. E. Mullins, J. Soil Sci., 1977, 28, 223–246 CrossRef CAS
.
- M. Földvári, J. Ther. Anal., 1997, 48, 107–119 CrossRef
.
- P. Ptáček, T. Opravil, F. Šoukal, J. Wasserbauer, J. Másilko and J. Baráček, J. Eur. Ceram. Soc., 2013, 33, 2793–2799 CrossRef
.
- G. W. Brindley, C.-C. Kao, J. L. Harrison, M. Lipsicas and R. Raythatha, Clays Clay Miner., 1986, 34, 239–249 CrossRef CAS
.
- M. M. Mestdagh, L. Vielvoye and A. J. Herbillon, Clay Miner., 1980, 15, 1–13 CrossRef CAS
.
- E. Mazzucato, G. Artioli and A. Gualtieri, Phys. Chem. Miner., 1999, 26, 375–381 CrossRef CAS
.
- A. F. Gualtieri and P. Venturelli, Am. Mineral., 1999, 84, 895–904 CrossRef CAS
.
- A. Neißer-Deiters, S. Scherb, N. Beuntner and K.-C. Thienel, Appl. Clay Sci., 2019, 179, 105168 CrossRef
.
- K. J. D. MacKenzie, J. Temuujin, M. E. Smith, P. Angerer and Y. Kameshima, Thermochim. Acta, 2000, 359, 87–94 CrossRef CAS
.
- T. C. Alex, C. Sasi Kumar, A. J. Kailath, R. Kumar, S. K. Roy and S. P. Mehrotra, Metall. Mater. Trans. B, 2011, 42, 592–603 CrossRef CAS
.
- H. D. Ruan and R. J. Gilkes, Clays Clay Miner., 1995, 43, 196–211 CrossRef CAS
.
- R. L. Frost, É. Makó, J. Kristóf and J. T. Kloprogge, Spectrochim. Acta, Part A, 2002, 58, 2849–2859 CrossRef CAS PubMed
.
- D. P. Klevtsov, V. A. Logvinenko, B. P. Zolotovskii, O. P. Krivoruchko and R. A. Buyanov, J. Therm. Anal., 1988, 33, 531–535 CrossRef
.
-
R. C. Mackenzie and S. Caillère, in Soil Components: Inorganic Components, ed. J. E. Gieseking, Springer Berlin Heidelberg, Berlin, Heidelberg, 1975, vol. 2, pp. 529–571 Search PubMed
.
- Y. Xiao, R. James Kirkpatrick, R. L. Hay, Y. J. Kim and B. L. Phillips, Mineral. Mag., 1995, 59, 47–61 CrossRef
.
- M. Mantovani, A. Escudero and A. I. Becerro, Clays Clay Miner., 2009, 57, 302–310 CrossRef CAS
.
- J. Rocha and J. Klinowski, Phys. Chem. Miner., 1990, 17, 179–186 CrossRef CAS
.
- M. Izadifar, P. Thissen, A. Steudel, R. Kleeberg, S. Kaufhold, J. Kaltenbach, R. Schuhmann, F. Dehn and K. Emmerich, Clays Clay Miner., 2020, 68, 319–333 CrossRef CAS
.
- K. J. D. MacKenzie, I. W. M. Brown, R. H. Meinhold and M. E. Bowden, J. Am. Ceram. Soc., 1985, 68, 293–297 CrossRef CAS
.
- J. McManus, S. E. Ashbrook, K. J. D. MacKenzie and S. Wimperis, J. Non-Cryst. Solids, 2001, 282, 278–290 CrossRef CAS
.
-
M. Izadifar, P. Thissen, A. Steudel, R. Kleeberg, S. Kaufhold, J. Kaltenbach, R. Schuhmann, F. Dehn and K. Emmerich, Clays and Clay Minerals, 2020 Search PubMed
.
- M. Fernández, M. D. Alba and R. M. Torres Sánchez, Colloids Surf., A, 2013, 423, 1–10 CrossRef
.
- H. Kodama, L. S. Kotlyar and J. A. Ripmeester, Clays Clay Miner., 1989, 37, 364–370 CrossRef CAS
.
-
E. Murad and J. Cashion, Mössbauer Spectroscopy of Environmental Materials and Their Industrial Utilization, Springer Science & Business Media, 2011 Search PubMed
.
- M. D. Dyar, D. G. Agresti, M. W. Schaefer, C. A. Grant and E. C. Sklute, Annu. Rev. Earth Planet. Sci., 2006, 34, 83–125 CrossRef CAS
.
- F. Avet, X. Li, M. Ben Haha, S. A. Bernal, S. Bishnoi, Ö. Cizer, M. Cyr, S. Dolenec, P. Durdzinski, J. Haufe, D. Hooton, M. C. G. Juenger, S. Kamali-Bernard, D. Londono-Zuluaga, A. T. M. Marsh, M. Marroccoli, M. Mrak, A. Parashar, C. Patapy, M. Pedersen, J. L. Provis, S. Sabio, S. Schulze, R. Snellings, A. Telesca, M. Thomas, F. Vargas, A. Vollpracht, B. Walkley, F. Winnefeld, G. Ye, S. Zhang and K. Scrivener, Mater. Struct., 2022, 55, 92 CrossRef CAS
.
- S. H. Sutheimer, P. A. Maurice and Q. Zhou, Am. Mineral., 1999, 84, 620–628 CrossRef CAS
.
- F. Zunino, Y. Dhandapani, M. Ben Haha, J. Skibsted, S. Joseph, S. Krishnan, A. Parashar, M. C. G. Juenger, T. Hanein, S. A. Bernal, K. L. Scrivener and F. Avet, Mater. Struct., 2022, 55, 234 CrossRef CAS
.
- Q. Wan, Y. Zhang and R. Zhang, Cem. Concr. Compos., 2020, 111, 103635 CrossRef CAS
.
- F. J. Huertas, L. Chou and R. Wollast, Geochim. Cosmochim. Acta, 1999, 63, 3261–3275 CrossRef CAS
.
- C. Vizcayno, R. Castelló, I. Ranz and B. Calvo, Thermochim. Acta, 2005, 428, 173–183 CrossRef CAS
.
- E. Colacino, V. Isoni, D. Crawford and F. García, Trends Chem., 2021, 3, 335–339 CrossRef CAS
.
- J. F. Reynes, V. Isoni and F. García, Angew. Chem., Int. Ed., 2023, 62, e202300819 CrossRef CAS PubMed
.
- G. Kaupp, CrystEngComm, 2006, 8, 794–804 RSC
.
- D. E. Crawford and J. Casaban, Adv. Mater., 2016, 28, 5747–5754 CrossRef CAS PubMed
.
Footnote |
| † Electronic supplementary information (ESI) available. See DOI: https://doi.org/10.1039/d4ta02545h |
| This journal is © The Royal Society of Chemistry 2024 |


