
Probing surface interactions in CdSe quantum dots with thiocyanate ligands†
Samadhan H.
Deshmukh
ac,
Sushma
Yadav
b,
Tubai
Chowdhury
 ac,
Akhil
Pathania
ac,
Sameer
Sapra
*b and
Sayan
Bagchi
*ac
ac,
Akhil
Pathania
ac,
Sameer
Sapra
*b and
Sayan
Bagchi
*ac
aPhysical and Materials Chemistry Division, National Chemical Laboratory (CSIR-NCL), Dr. Homi Bhabha Road, Pune – 411008, India. E-mail: s.bagchi@ncl.res.in
bDepartment of Chemistry, Indian Institute of Technology Delhi, Hauz Khas, New Delhi 110016, India
cAcademy of Scientific and Innovative Research (AcSIR), Ghaziabad – 201002, India
First published on 3rd July 2024
Abstract
Surface chemistry dictates the optoelectronic properties of semiconductor quantum dots (QDs). Tailoring these properties relies on the meticulous selection of surface ligands for efficient passivation. While long-chain organic ligands boast a well-understood passivation mechanism, the intricacies of short inorganic ionic ligands remain largely unexplored. This study sheds light on the surface-passivation mechanism of short inorganic ligands, particularly focusing on SCN− ions on CdSe QDs. Employing steady-state and time-resolved infrared spectroscopic techniques, we elucidated the surface-ligand interactions and coordination modes of SCN−-capped CdSe QDs. Comparative analysis with studies on CdS QDs unveils intriguing insights into the coordination behavior and passivation efficacy of SCN− ions on Cd2+ rich QD surfaces. Our results reveal the requirement of both surface-bound (strong binding) and weakly-interacting interfacial SCN− ions for effective CdSe QD passivation. Beyond fostering a deeper understanding of surface-ligand interactions and highlighting the importance of a comprehensive exploration of ligand chemistries, this study holds implications for optimizing QD performance across diverse applications.
Introduction
Colloidal quantum dots (QDs) have captured significant interest due to their unique electronic and optical properties, which can be tailored for specific applications through precise control over material selection, size, shape, and surface ligands.1–4 The high surface-to-volume ratio of QDs renders their properties susceptible to the nature of the surface.5,6 Surface-passivating ligands play a critical role in determining the QD quality, stability, and overall physical and chemical properties.7Among various QDs, cadmium selenide (CdSe) stands out for its size-tunable properties. However, long-chain organic ligands, commonly used during synthesis for nucleation and growth control (e.g., oleic acid), act as insulators, preventing close proximity of QDs and limiting their device potential.8,9 Ligand exchange strategies with shorter inorganic ligands have emerged as a promising approach for overcoming this limitation. These shorter ligands influence carrier mobility by altering the inter-QD dielectric environment and tunneling distance.10 Mobility increases significantly with decreasing ligand length, highlighting the advantage of short inorganic ligands like thiocyanate (SCN−) for enhancing electronic coupling between adjacent QDs, a crucial factor for device fabrication.2,11–15
Recent studies have demonstrated the effectiveness of thiocyanate (SCN−) anions as short capping ligands to improve device performance.2,14 While extensive research using 1H NMR spectroscopy has elucidated the interaction between oleic acid and CdSe QDs,5,16–19 the lack of hydrogen atoms in SCN− ions prevents the use of this technique. This presents a significant challenge in understanding how SCN− stabilizes QDs in solution, a crucial aspect for optimizing device performance.
In contrast to 1H NMR, SCN− exhibits a distinct spectroscopic signature in the mid-IR region due to its nitrile (C![[triple bond, length as m-dash]](https://www.rsc.org/images/entities/char_e002.gif) N) stretching. This stretching is sensitive to the local environment and features a high extinction coefficient. The CN stretching has been widely used as a spectroscopic reporter to probe the interaction of SCN− with condensed-phase media, biomolecules, and materials, including QDs.1,3,20–24 For example, in a previous study on QDs, Kagan and coworkers reported two SCN− populations (directly bound and freely diffusing) for SCN−-capped CdSe QDs.2
N) stretching. This stretching is sensitive to the local environment and features a high extinction coefficient. The CN stretching has been widely used as a spectroscopic reporter to probe the interaction of SCN− with condensed-phase media, biomolecules, and materials, including QDs.1,3,20–24 For example, in a previous study on QDs, Kagan and coworkers reported two SCN− populations (directly bound and freely diffusing) for SCN−-capped CdSe QDs.2
Our recent work on SCN−-capped CdS QDs employed FTIR and time-resolved vibrational spectroscopy to identify the ligand populations required for surface passivation.1 We observed correlations between the ligand fluctuation dynamics timescales and the strengths of the surface–ligand interactions. This revealed three distinct ligand populations: directly bound, weakly bound, and freely diffusing. Theoretical calculations further predicted that directly bound ligands bind to the Cd2+ rich (111) facet. Since Cd2+ is the preferred binding facet for SCN− in both CdS and CdSe QDs, a thorough investigation of SCN−-capped CdSe QDs is crucial to understanding the binding nature and the coordination modes of the ligands.
This work utilizes FTIR and two-dimensional infrared (2D IR) spectroscopic techniques to reveal the surface passivation mechanism of SCN−-capped CdSe QDs. We compare the surface-ligand interactions observed here with those previously reported for CdS QDs.1 Our findings reveal remarkable similarities between the two systems suggesting a potentially universal binding mechanism for SCN− on CdX (X = S and Se) QDs. Our results suggest the need for both direct surface binding and interfacial ligands for the effective passivation of CdX.
Furthermore, the presence of interfacial ions not directly bound to the QD facet suggests the formation of a double layer. While the concept of double layer formation (electrostatic interaction) for small inorganic QD ligands has been proposed in the literature,12,15,25–28 no experimental evidence has been presented to date. Our findings provide the experimental evidence of double layer formation for surface–ligand interactions in SCN−-capped CdSe and CdS QDs.
Experimental
Chemicals
Cadmium oxide (CdO 99.5%), trioctylphosphine oxide (TOPO 99%), trioctylphosphine (TOP 90%), 1-octadecene (ODE 90%), oleic acid (OA 90%), selenium powder mesh (99.99%), octadecylamine (ODA >95%), toluene, hexane, methanol, acetone and chloro propanethiol (CPT) were used.SCN−-capped CdSe nanocrystal synthesis
At first, CdSe QDs were synthesized, which were further used to prepare SCN−-capped CdSe QDs via ligand exchange. For the synthesis of CdSe QDs, 1 mmol CdO and 4 mmol OA were added to 14 mL of ODE in a 50 mL four-necked round bottom flask. Initially, the reaction mixture was degassed at room temperature for 5 min and then the temperature was increased to 120 °C under vacuum and degassed for 30 min. After that, under an inert atmosphere the temperature was raised to 240 °C while maintaining constant stirring until a clear solution was obtained. The temperature of the solution was then brought to 90 °C, followed by the addition of ODA (1.5 g) and TOPO (1 g) to the solution and heated again to 280 °C with continuous stirring under an inert atmosphere. At this temperature the TOP-Se solution (0.4 M, 2.5 mL) was injected swiftly into the Cd-oleate solution The temperature fell down to 268 °C and the reaction was allowed to proceed at 270 °C until the desired size of the nanocrystals was achieved. The QDs were purified by phase separation with a 1![[thin space (1/6-em)]](https://www.rsc.org/images/entities/char_2009.gif) :1 mixture of hexane and methanol to remove unreacted precursors. The QDs were precipitated by adding acetone followed by centrifugation and finally redispersed in hexane.29–32
:1 mixture of hexane and methanol to remove unreacted precursors. The QDs were precipitated by adding acetone followed by centrifugation and finally redispersed in hexane.29–32
The ligand exchange procedure, following the method reported by Kagan et al.2 with some modifications, involved preparing a 1 mL solution of 130 mM NH4SCN in acetone. This solution was added dropwise to 0.5 mL of a dispersion of as-synthesized CdSe quantum dots in hexane (15–20 mg ml−1) until precipitation occurred. The resulting solution underwent centrifugation for 3 minutes at 4000 rpm. The supernatant was then discarded, and the resulting quantum dots were washed with acetone. Finally, the CdSe quantum dots were dried and dispersed in 0.5 mL of DMF with 0.5 μl of CPT. The SCN−-capped CdSe was utilized for spectroscopic studies.
Material characterization
Optical absorption measurements were conducted using a Shimadzu UV-vis-IR (UV-3600 Plus) spectrophotometer. High-resolution images of the quantum dots were obtained using a high-resolution transmission electron microscope (HRTEM, JEOL JEM 2200FES). Powder X-ray diffraction (PXRD) patterns were collected using a Bruker D8 Advance diffractometer in the Bragg–Brentano geometry and operated with Cu Kα radiation.Quantum calculations
To replicate the experimental conditions, plane-wave density functional theory (DFT) calculations were carried out using Quantum Espresso on the (111) facet of zinc blende-shaped CdSe QDs.33 For simplicity, a slab model was used to optimize the QD structure. The PBE exchange–correlation functional was employed, with ultrasoft pseudopotentials describing the electron–ion interactions.34,35 To calculate the CN stretching frequency, small fragments of the slab were analyzed at the B3LYP/lanl2dz level using the Gaussian 16 package.36
IR spectroscopy
IR absorption spectra were recorded at room temperature using a Bruker Vertex 70 FTIR spectrometer. Each sample involved loading approximately 90 μl of the sample solution into a demountable cell comprising two windows (CaF2, 3 mm thickness) separated by a mylar spacer of 100 μm thickness. The same sample cell was employed for 2D IR experiments.2D IR spectroscopy
The 2D IR spectra were acquired using a pulse shaper-based 2D IR spectrometer developed by PhaseTech Spectroscopy, Inc., USA. A detailed description of the setup employed in this study has been provided elsewhere.37 In brief, mid-IR pulses, centered at ∼2070 cm−1, were generated with an approximately ∼60 fs pulse width. A beam splitter was used to split the mid IR pulse into a strong pump (80%) beam and a weak probe (20%) beam. A germanium acoustic-optic modulator (AOM) based pulse shaper was used to generate two pump pulses with a delay interval of τ from a single strong pump pulse. The spatially and temporarily overlapped pump and probe pulses were directed toward the sample using parabolic mirrors. A motorized delay stage was used to set the pump and probe delay (Tw). Each 2D IR spectrum was acquired by scanning τ at a fixed Tw. The signal was collected using a monochromator (Princeton Instruments) and detected on a nitrogen-cooled 64-pixel HgCdTe (MCT) IR array (InfraRed Associates) detector. The final 2D IR spectra were constructed by Fourier-transforming the experimental data along the axis. Generally, a 2D IR spectrum is a plot of the initial frequencies versus the final frequencies. The 2D IR experiments were conducted using the same solutions used for FTIR in the same sample cell.The waiting time dependence of the 2D IR lineshapes was analyzed employing the center line slope (CLS) method, and the CLS decays were fitted to multi-exponential decay functions.38 While calculating the CLS from the central part of the peak is standard practice for single or non-overlapping spectral bands, spectral overlap can cause potential distortion in the spectrum, leading to significant errors in the calculated CLS timescales. For overlapping bands, it has been shown that CLS can still be accurately calculated separately from the individual peaks if the CLS is calculated to the blue of the peak center for the high-frequency spectral band and to the red of the peak center for the low-frequency spectral band.39 Through 2D IR spectral simulations, we identified the spectral regions for each of the overlapping peaks that provide the lowest error (<5%) in the calculated CLS.
Results and discussion
Fig. 1a illustrates the UV–vis spectra of oleate-passivated CdSe QDs dispersed in hexane (prior to ligand exchange) and SCN−-capped CdSe QDs in dimethylformamide (DMF) solution (following ligand exchange). Notably, the characteristic excitonic peaks of the CdSe QDs remained unchanged after ligand exchange. The X-ray diffraction (XRD) pattern of the SCN−-capped CdSe QDs closely resembled that of the oleate-capped ones (Fig. 1b), with prominent peaks at angles (2θ) 24.9°, 41.5°, and 49.2° corresponding to the (111), (220), and (311) planes of the zinc blende structure, consistent with prior literature findings.40,41 This analysis confirms the preservation of crystallinity and the predominance of (111) facets in the QDs before and after ligand exchange. The XRD pattern was slightly noisier after the exchange process because the recovered sample was smaller. Fig. 1c presents a high-resolution transmission electron microscopy (HRTEM) image of CdSe QDs before ligand exchange. The size distribution is shown in Fig. 1d. As the UV-vis spectrum barely changes before and after exchange, the particle size is expected to remain the same.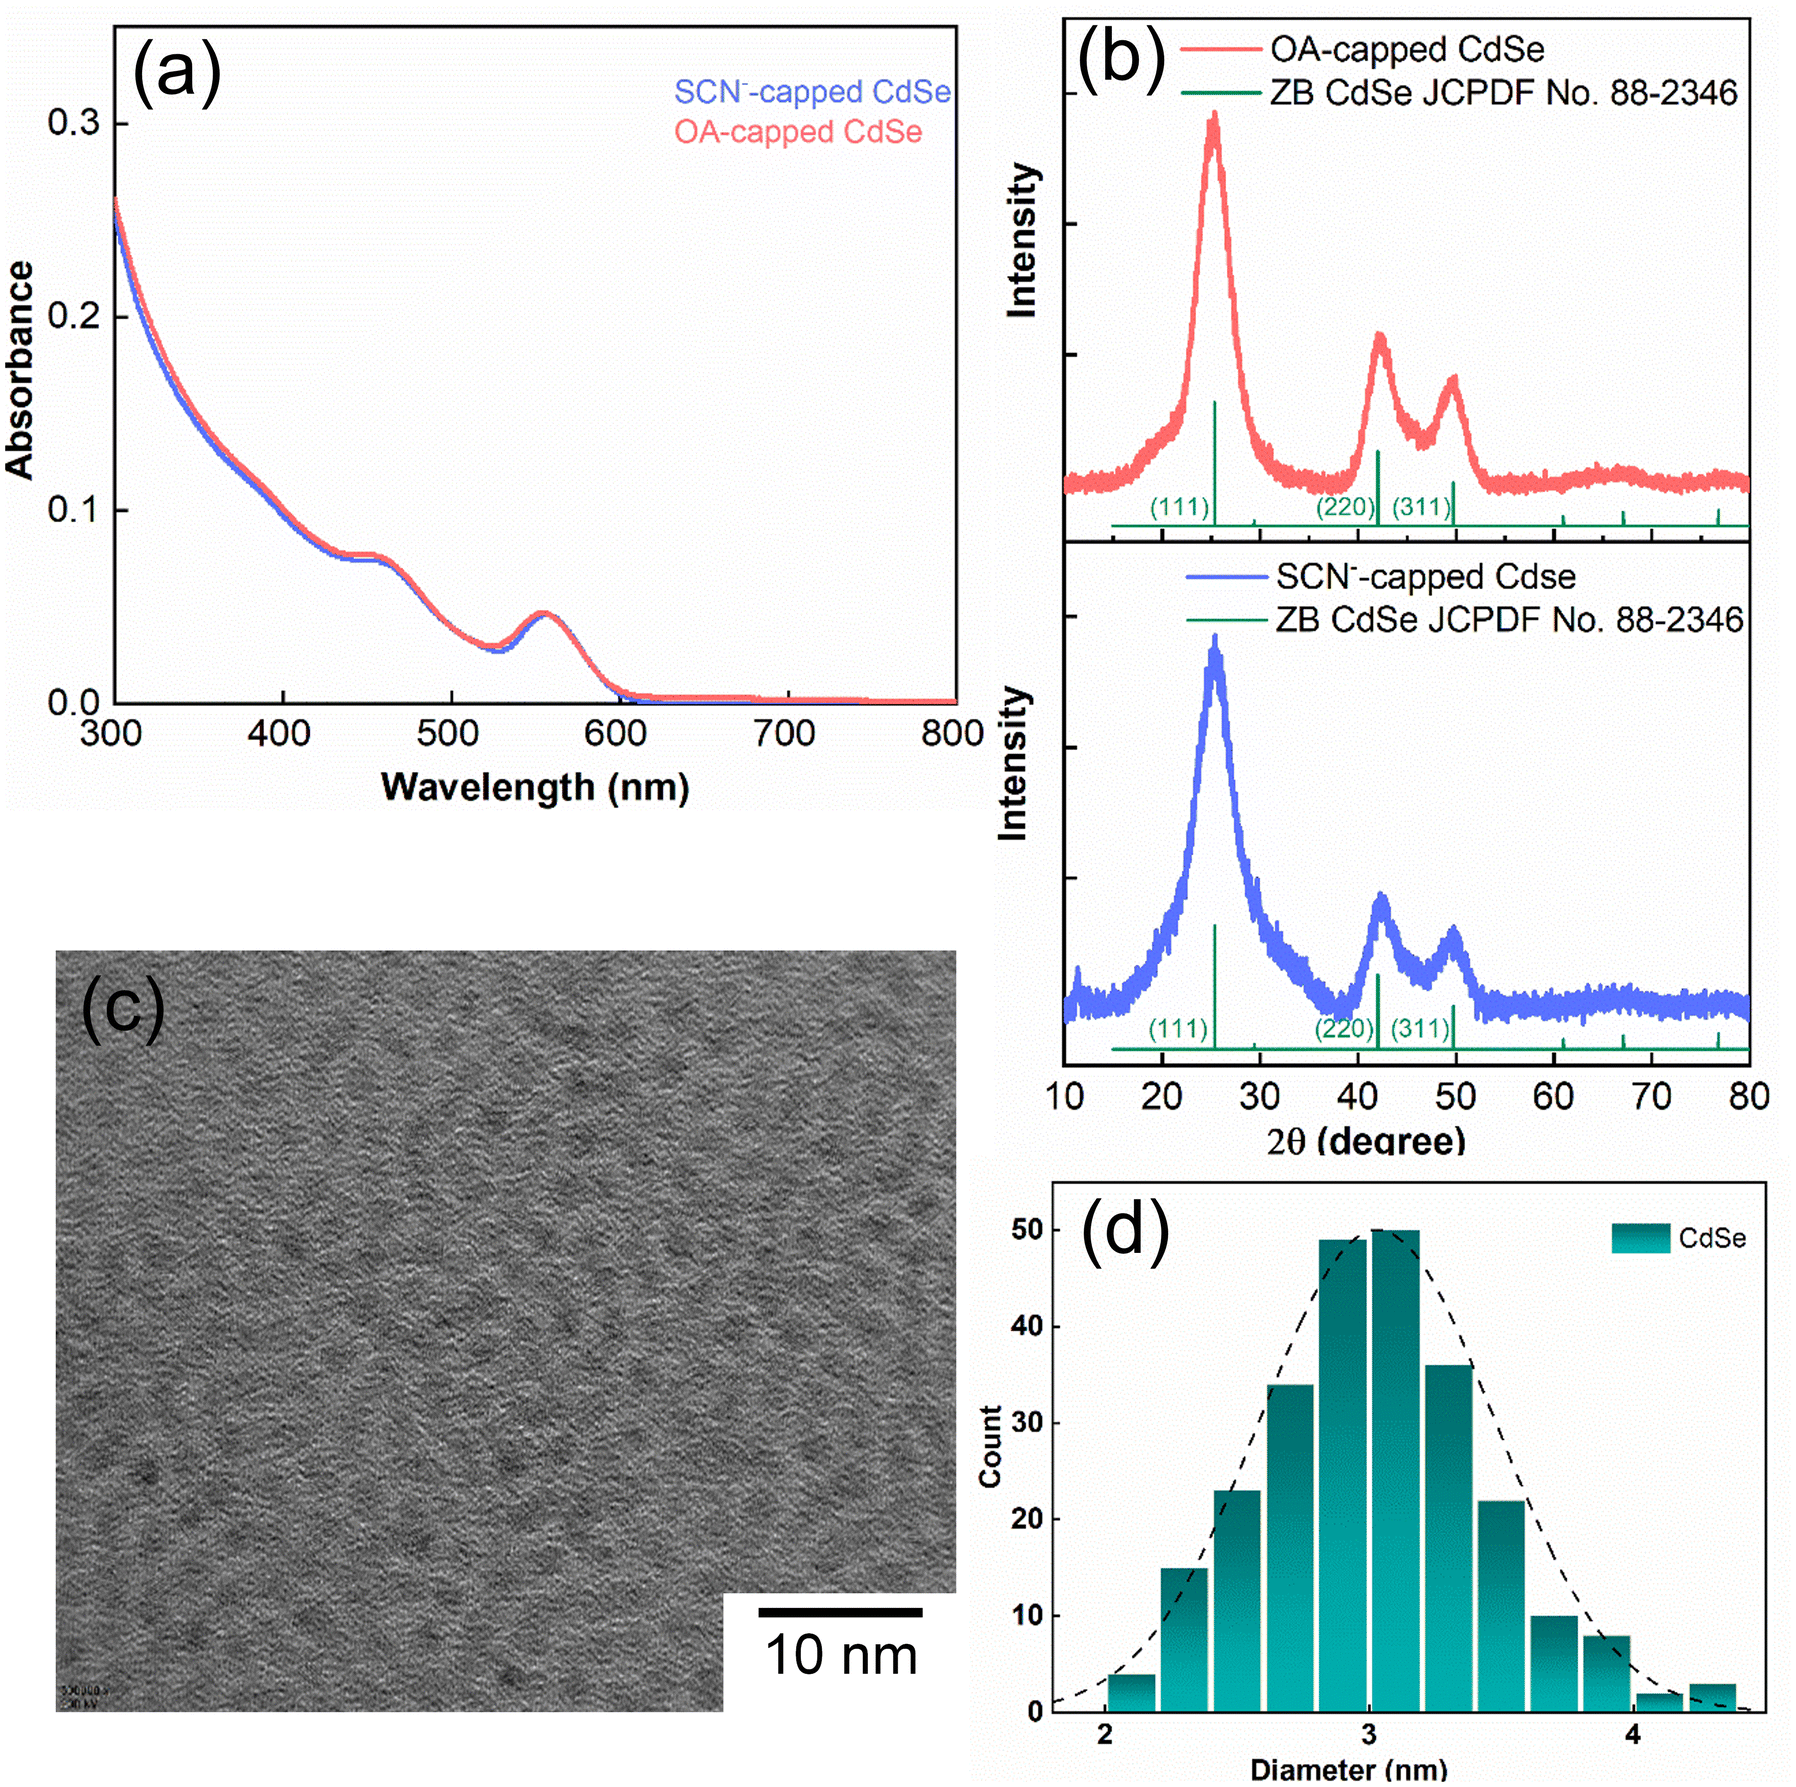 | ||
| Fig. 1 (a) UV–vis absorption spectra of oleate-capped CdSe QD colloidal solution in hexane and thiocyanate SCN−-capped CdSe QD colloidal solution in DMF. (b) Diffraction patterns of QDs before and after ligand exchange revealing identical crystallinity. (c) HRTEM image of CdSe QDs before ligand exchange. (d) Particle size distributions with peaks at around ∼3 nm are obtained from the HRTEM analysis of CdSe QDs. | ||
We obtained the FTIR spectrum of the CN stretching for the SCN−-capped CdSe QD colloidal solution in DMF (Fig. 2a). Notably, the CN stretching spectrum exhibits an asymmetric band, manifesting a shoulder on the high-frequency side, indicative of a blue shift. The spectrum was fitted to two Gaussians centered at 2056 cm−1 (peak A, FWHM = 15.5 cm−1) and 2072 cm−1 (peak B, FWHM = 11.4 cm−1). To ascertain the CN stretching peak of free SCN− in DMF in the absence of QDs, we recorded the FTIR spectrum of NH4SCN dissolved in DMF (Fig. 2b). This spectrum revealed a symmetric peak at 2056 cm−1 (peak A′, FWHM = 13 cm−1). Although a peak at 2056 cm−1 is observed in both the presence and absence of the QDs, the peak exhibits a larger FWHM in the presence of QDs. Our FTIR results in the presence of QDs align well with the previously reported CN stretching spectrum of SCN−-capped CdSe QDs in DMSO.2 While the solvent change from DMSO to DMF slightly affects the peak positions, the overall spectral shape with two overlapping peaks remains consistent. In the previous report, the high-frequency peak in DMSO was assigned to the ionically bound SCN− ions at the positively charged sites (111 facet) on the CdSe surface, while the low-frequency peak was assigned to the free SCN− ions.2 Interestingly, identical CN stretching peak positions were reported for a different SCN−-capped QD (CdS) colloidal solution in DMF.1
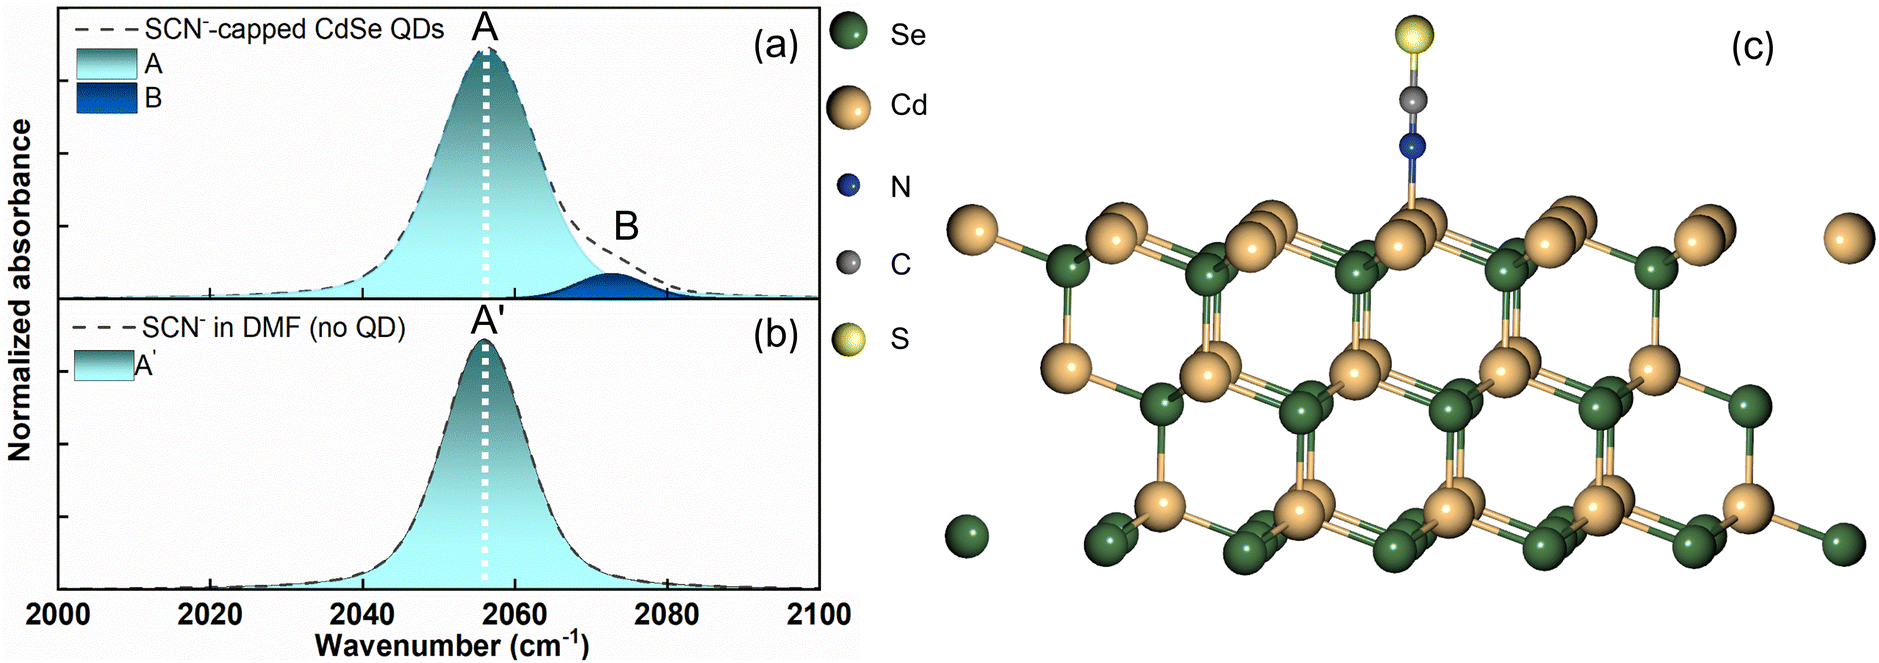 | ||
| Fig. 2 (a) The FTIR spectrum of the CN stretching for SCN−-capped CdSe QD colloidal solution in DMF shows two overlapping transitions (A and B). (b) The FTIR spectrum of the CN stretching for SCN− in the absence of QDs shows a single symmetric peak (A′). (c) The optimized slab structure of the nitrogen terminated SCN−-capped (111) facet of the CdSe crystal. | ||
An approximately 3 cm−1 increase in the FWHM of the peak at 2056 cm−1 was observed in the presence of QDs, compared to that observed in the absence of QDs, for both CdSe and CdS QDs. Plane-wave DFT calculations were performed to optimize the structure of the SCN−-bound CdSe crystal (Fig. 2c). Frequency calculations of CdSe QDs estimated the CN stretching frequency of the nitrogen-bound SCN− to the Cd2+ rich (111) facet of the quantum dot to be ∼2083 cm−1. This result is consistent with the plane-wave DFT calculations on CdS QDs, which show a frequency of 2079.3 cm−1.1 The close similarity of the estimated CN stretching frequencies and the comparable high-frequency peak positions between CdS and CdSe QDs indicate that the 2072 cm−1 peak in CdSe QDs arises from the SCN− bound to the (111) facet, directly through the nitrogen atom. Previous literature has also attributed the SCN− peak at ∼2072 cm−1 to N-bound coordination to Ag nanoparticles.42
The FTIR spectra of SCN−-capped CdSe QDs reveal the presence of two distinct SCN− populations, previously identified as bound and free ligands.2 However, despite exhibiting nearly identical lineshape and peak positions in the FTIR, recent time-resolved IR studies on SCN−-capped CdS QDs unveiled the necessity for three distinct SCN− populations (directly bound, weakly bound, and free anions) to effectively passivate the CdS QD surface.1 This observation prompted us to investigate whether the surface passivation mechanism observed in SCN−-capped CdSe QDs mirrors that of SCN−-capped CdS QDs. We conducted additional time-resolved IR studies to elucidate any similarities or differences in the surface passivation mechanisms between the two systems.
We used 2D IR spectroscopy to investigate the interaction between SCN− ligand CdSe QDs. 2D IR spectra were recorded for both free SCN− and SCN−-capped CdSe quantum dot colloidal solution in DMF at various time delays (Tw) (Fig. 3). A typical 2D IR spectrum, corresponding to a single peak in the FTIR spectrum, comprises a peak pair, originating from v = 0 to v = 1 (blue) and v = 1 to v = 2 (red) coherences. The difference in the peak positions along the detection frequency (x-axis) represents the anharmonicity of the vibrational mode. At early time delays, the peak pairs are elongated due to a strong correlation between excitation and detection frequencies. As Tw increases, the correlation weakens, and the peak shapes become broader until they are circular, indicating a complete loss of correlations.
 | ||
| Fig. 3 2D IR spectra of NH4SCN (left column) and CdSe-SCN (right column) in DMF at three different waiting times (Tw). Tw increases from the top to the bottom along each column. | ||
The FTIR spectrum (Fig. 2a) of the SCN−-capped CdSe QDs in DMF exhibits two peaks. Consequently, the corresponding 2D IR spectra consist of 2 peak pairs (marked as A and B). Peak pair A corresponds to the FTIR peak at 2056 cm−1 and peak pair B corresponds to the FTIR peak at 2072 cm−1. Established analysis methods, such as center line slope (CLS)38 or nodal line slope (NLS)43 analysis, provides Tw-dependent changes in peak shapes. Through 2D IR spectral simulations, we identified the spectral regions for each of the overlapping peaks such that the CLS values and their time dependence are devoid of any potential distortions that may arise from the overlap of the two spectral bands (Fig. S2 and S3†). This allows us to extract the underlying fluctuation timescales for each FTIR peak through frequency–frequency correlation functions (FFCF).
The analysis of peak pairs A and B is shown in Fig. 4. Both peaks exhibit a fast time constant of ∼ 1 ps. Additionally, peak A shows a bi-exponential decay with two time-constants of 4.9 ps and 60 ps, while peak B shows another timescale with a time constant of 120 ps (see the ESI†). In the absence of QDs (bulk DMF), the FFCF extracted from freely diffusing SCN− ions (peak A′) in bulk DMF also shows an ∼1 ps timescale dynamics and further decays rapidly at a timescale of ∼6.8 ps. This timescale reflects the solvent fluctuations around the free SCN− ion. Prior studies have proposed various timescales for DMF fluctuations (1–10 ps).1,44,45 This suggests that free SCN− ions in bulk DMF experience very rapid fluctuations in their vibrational frequencies.
 | ||
| Fig. 4 T w-dependent CLS of the 2072 cm−1 peak in SCN−-capped CdSe QDs corresponding to the bound ligands (green) shows the slowest decay and that of the 2056 cm−1 peak corresponding to the free ions (blue) in the absence of QDs shows the fastest decay. The CLS decay of the 2056 cm−1 peak in the presence of CdSe QDs shows a bi-exponential decay. | ||
When SCN− interacts with another species, its frequency fluctuations should slow down. The strength of the interaction determines the extent of the slowdown. Peak B, with the slowest timescale, corresponds to SCN− directly bound to the (111) facet of the CdSe QDs. This direct attachment likely creates the strongest interaction between the QDs and the SCN− ligands, resulting in the slowest fluctuation timescale. The observed timescale of ∼120 ps for bound SCN− ions on the CdSe (111) facet is slightly slower than that reported for SCN−-capped CdS QDs.1 This suggests a subtle difference in the surface–ligand interaction between CdSe and CdS QDs, despite both involving the Cd2+ rich (111) facet. Similar observations have been reported for the binding energies of oleic acid bound to the surface of these two QDs.46
The dynamics of small anionic ligands contribute negligibly to their own spectral diffusion.47 This raises the question: how are surface–SCN− interactions related to the slowing down of SCN− FFCF decay timescales? Solvent molecules in contact with or near the interface exhibit different dynamical properties. The structural dynamics of the solvent molecules become faster as they move away from the interface, causing the SCN− frequency fluctuation to become faster with increasing distance from the QD surface.48 Additionally, the proximity of bulky, slowly moving QDs compared to small solvent molecules further slows the fluctuation timescale near the QD surface.
Thus, the fluctuation timescales of the ligands serve as indicators of surface–ligand interactions. In simpler terms, stronger interactions lead to slower timescales. Interestingly, in addition to the fast timescale of ∼1 ps, peak A exhibits two distinct time constants. In general, a multiexponential decay of CLS is attributed to different types of motions in the surrounding environment happening at different timescales. However, one of these timescales matches with the time constant obtained for peak A′ in the absence of QDs. Since the peak position is the same for peak A and peak A′, an additional timescale likely indicates the presence of two different SCN− populations within peak A. One population exhibits the timescale of free SCN− ions in bulk DMF (∼4.9 ps). The other population shows a timescale of about ∼60 ps, which is in between that of free ligands and those directly bound to the QD surface. This intermediate timescale implies that these SCN− ions are neither in the bulk nor directly bound to the QD surface.
SCN− ions can interact with either NH4+ counter-cations or the QD surface in the colloidal solution. The possibility of NH4+ slowing down the fluctuation dynamics can be excluded because the cation was present even in the absence of QDs, where an ultrafast fluctuation timescale of 6.8 ps was observed. Therefore, the significant retardation (∼ten-fold) in fluctuation dynamics is attributed to the interactions between the ligands and the QD surface. The timescale of 60 ps suggests that these ions are not directly bound to the Cd2+ rich (111) facet. Since anions like SCN− typically exhibit X-type ligand behavior, they are unlikely to interact with the neutral facets of the QDs.49
The intermediate timescale of 60 ps may suggest a weaker interaction between the ligands and the Cd2+ rich (111) facet. In other words, the SCN− ions are not directly attached to the QD surface but reside in the nearby interfacial region. This weaker interaction is evident when compared to the timescales of the directly bound ligands. Interestingly, recent studies on thin films with cationic head groups found that negatively charged ligands, like SCN−, move much slower near the interface.50,51 The sluggishness extends to a typical correlation length of a few nanometers, where the fluctuation dynamics of SCN− is faster than that at the surface but slower than that in the bulk solution. This effect declines exponentially, and the SCN− ions behave similarly to those in the bulk solvent before the interfacial region.52 We hypothesize that a similar phenomenon occurs in the CdSe QDs. The intermediate timescale indicates weakly-bound SCN− close to the interface, which explains the considerable slowdown compared to bulk dynamics. This interface effect is well established for other charged surfaces, as oppositely charged ions near the charged metal surface tend to form double layers.2 The close correspondence between the FTIR peak positions and fluctuation timescales in CdS and CdSe QDs strongly suggests a similar surface passivation mechanism in both cases.
The observation of ∼1 ps timescale for all the populations can be attributed to their exposure to the solvent. For non-hydrogen bonded environments, the fast ∼1 ps decay has been previously ascribed to the fluctuations of the first solvation shell. Since each population has some degree of solvent exposure, they all exhibit dynamics on an ∼1 ps timescale. While FTIR identifies two populations, 2D IR spectroscopy unveils a more nuanced picture with three separate timescales, indicating three distinct populations. The peak at 2056 cm−1 (peak A) in the presence of QDs, although appearing as a single peak in the FTIR spectrum, has contributions from two distinct populations: weakly-bound interfacial ligands and freely diffusing ligands. This distinction becomes clear when examining the FFCF decays from 2D IR spectra. A closer look at peak A (compared to peak A′ without QDs) indicates that only the high-frequency side of the peak broadens when QDs are present (Fig. 5). The FTIR data tell us that any interaction of the SCN− ligands with the QD surface causes a blue shift in the CN stretching frequencies. The stronger the interaction, the larger the blue shift, with the strongly bound ligands showing the largest blue shift. Since only the high-frequency side of peak A broadens with QDs, this confirms that some SCN− ions are weakly interacting with the QD surface.
 | ||
| Fig. 5 The CN stretching peak of free SCN− in the absence of CdSe QDs (peak A′) has been overlaid with the Gaussian fit of the peak at 2056 cm−1 in the presence of QDs (peak A). The two spectra overlap well on the low-frequency side. In the presence of QDs, the Gaussian fit shows a broadening on the high-frequency side. | ||
Plane-wave DFT calculations for CdSe QDs indicate that SCN− adsorbs on the (111) surface in a perpendicular orientation, with the coordinating nitrogen atom of the bound ligand approximately ∼2.3 Å away from the QD surface. This finding is consistent with the previously reported results for CdS QDs.1 Additionally, this result aligns well with the existing reports on ligand bound CdSe QDs as the distance falls within the reported range (from 2.28 Å to 2.76 Å) for various ligands on the CdSe surface.53 The predicted interaction energy for the bound SCN− ligand is slightly smaller for CdSe QDs than that for CdS QDs, but lies within the reported range of adsorption energies for CdSe QDs.53 These similarities between CdS and CdSe further strengthen the notion of a similar surface passivation mechanism in these QDs, providing additional validation for our claims based on FTIR and time-resolved IR results.
Our study offers valuable insights into the surface chemistry of SCN−-capped QDs, enhancing our understanding of their behavior in colloidal solutions. These findings have significant implications for the design and optimization of QD-based materials. By elucidating the different surface–ligand interactions, our research can provide a fundamental basis for developing more efficient optoelectronic devices and advanced biomedical imaging technologies. The detailed characterization of SCN− ligand interactions with QD surfaces will help in tailoring surface modifications to improve the stability, performance, and functionality of QD materials in various applications.
Conclusion
In conclusion, our comprehensive analysis of the FTIR and 2D IR spectra of SCN−-capped CdSe QD colloidal solutions in DMF has provided valuable insights into the surface–ligand interactions and the dynamics of SCN− ions. The FTIR spectra revealed two distinct peaks (A and B) associated with CN stretching vibrations, with peak A showing a shoulder indicative of a blue shift. A comparison with the FTIR spectra of free SCN− in DMF highlighted differences in the peak width, suggesting an influence of QDs on ligand dynamics.
Further investigation using 2D IR spectroscopy elucidated the dynamics of SCN− ions over time delays (Tw), revealing intricate details about their interactions with the QD surface. The analysis revealed distinct populations of SCN− ions, with peak A exhibiting two time constants, suggesting the presence of weakly-bound and freely diffusing ligands in addition to directly bound ones.
Our findings suggest that the slowdown in fluctuation dynamics observed in the presence of QDs is primarily attributed to interactions between the ligands and the Cd2+ rich (111) facet of the QDs. The intermediate timescale of 60 ps indicates weaker interactions compared to directly bound ligands, possibly occurring in the interfacial region.
We have previously reported similar results for CdS QDs. The similarities between our observations of CdSe QDs and previous studies on CdS QDs support the existence of a common surface passivation mechanism across different types of QDs. This is further corroborated by plane-wave DFT calculations, which suggest similar ligand orientations for SCN− on both CdSe and CdS QDs. Although the trends in the results remain consistent for CdS and CdSe QDs, subtle differences are observed, particularly in the ligand dynamics timescales. Such subtle differences are not evident from the FTIR results.
These small differences in dynamics suggest subtle variations in the surface–ligand interactions when changing from S to Se. However, as the binding occurs on the Cd2+-rich (111) facet, the overall passivation mechanism remains similar, albeit with minor differences in the extent of interactions. Our combined results from CdS and CdSe QDs indicate that a double layer formation of ions is necessary to stabilize the Cd-based QDs.
In the future, it would be interesting to see what happens when the cation is changed from Cd2+ to any other cation. Moreover, understanding the relationship between the type of cation and the correlation length of the interfacial effect will provide deeper insights into the surface chemistry of QDs. Overall, our study provides valuable insights into the surface chemistry of SCN−-capped QDs and contributes to a better understanding of their behavior in colloidal solutions. These findings have implications for the design and optimization of QD-based materials for various applications, including optoelectronic devices and biomedical imaging.
Author contributions
Samadhan H Deshmukh: data curation, visualization, formal analysis, and writing – original draft. Sushma Yadav: QD synthesis, characterization, and experimental tests. Tubai Chowdhury: data curation, investigation, and formal analysis. Akhil Pathania: DFT calculations and investigations. Sameer Sapra: supervision, methodology, and funding acquisition. Sayan Bagchi: supervision, methodology, funding acquisition, and writing – review & editing.Data availability
Data are available on reasonable request.Conflicts of interest
The authors declare no competing financial interests.Acknowledgements
SB and TC acknowledge CSIR-NCL and SERB, India (EMR/2016/000576), for financial support. The authors acknowledge the computational facilities at CSIR-NCL. The authors also acknowledge the National Supercomputing Mission (NSM) for providing computing resources of ‘PARAM Brahma’ at IISER Pune, which is implemented by C-DAC and supported by the Ministry of Electronics and Information Technology (MeitY) and the Department of Science and Technology (DST), Government of India. SHD acknowledges CSIR for the research fellowship. AP acknowledges DST Inspire for the research fellowship. SS acknowledges CRF and DST-SATHI facilities at IIT Delhi for instrument usage.References
- S. H. Deshmukh, S. Chatterjee, D. Ghosh and S. Bagchi, Ligand Dynamics Time Scales Identify the Surface–Ligand Interactions in Thiocyanate-Capped Cadmium Sulfide Nanocrystals, J. Phys. Chem. Lett., 2022, 13, 3059–3065 CrossRef CAS PubMed.
- A. T. Fafarman, W.-k. Koh, B. T. Diroll, D. K. Kim, D.-K. Ko, S. J. Oh, X. Ye, V. Doan-Nguyen, M. R. Crump, D. C. Reifsnyder, C. B. Murray and C. R. Kagan, Thiocyanate-Capped Nanocrystal Colloids: Vibrational Reporter of Surface Chemistry and Solution-Based Route to Enhanced Coupling in Nanocrystal Solids, J. Am. Chem. Soc., 2011, 133, 15753–15761 CrossRef CAS PubMed.
- H. Hao, J. Ai, C. Shi, D. Zhou, L. Meng, H. Bian and Y. Fang, Structural Dynamics of Short Ligands on the Surface of ZnSe Semiconductor Nanocrystals, J. Phys. Chem. Lett., 2022, 13, 3158–3164 CrossRef CAS PubMed.
- G. Konstantatos, I. Howard, A. Fischer, S. Hoogland, J. Clifford, E. Klem, L. Levina and E. H. Sargent, Ultrasensitive solution-cast quantum dot photodetectors, Nature, 2006, 442, 180–183 CrossRef CAS PubMed.
- C. L. Hartley, M. L. Kessler and J. L. Dempsey, Molecular-Level Insight into Semiconductor Nanocrystal Surfaces, J. Am. Chem. Soc., 2021, 143, 1251–1266 CrossRef CAS PubMed.
- C. d. M. Donegá, Synthesis and properties of colloidal heteronanocrystals, Chem. Soc. Rev., 2011, 40, 1512–1546 RSC.
- Y. Yin and A. P. Alivisatos, Colloidal nanocrystal synthesis and the organic–inorganic interface, Nature, 2005, 437(7059), 664–670 CrossRef CAS PubMed.
- J. Jasieniak, M. Califano and S. E. Watkins, Size-Dependent Valence and Conduction Band-Edge Energies of Semiconductor Nanocrystals, ACS Nano, 2011, 5, 5888–5902 CrossRef CAS PubMed.
- B.-R. Hyun, Y.-W. Zhong, A. C. Bartnik, L. Sun, H. D. Abruña, F. W. Wise, J. D. Goodreau, J. R. Matthews, T. M. Leslie and N. F. Borrelli, Electron Injection from Colloidal PbS Quantum Dots into Titanium Dioxide Nanoparticles, ACS Nano, 2008, 2, 2206–2212 CrossRef CAS PubMed.
- P. R. Brown, D. Kim, R. R. Lunt, N. Zhao, M. G. Bawendi, J. C. Grossman and V. Bulović, Energy Level Modification in Lead Sulfide Quantum Dot Thin Films through Ligand Exchange, ACS Nano, 2014, 8, 5863–5872 CrossRef CAS PubMed.
- Y. Liu, M. Gibbs, J. Puthussery, S. Gaik, R. Ihly, H. W. Hillhouse and M. Law, Dependence of Carrier Mobility on Nanocrystal Size and Ligand Length in PbSe Nanocrystal Solids, Nano Lett., 2010, 10, 1960–1969 CrossRef CAS PubMed.
- V. Sayevich, N. Gaponik, M. Plötner, M. Kruszynska, T. Gemming, V. M. Dzhagan, S. Akhavan, D. R. T. Zahn, H. V. Demir and A. Eychmüller, Stable Dispersion of Iodide-Capped PbSe Quantum Dots for High-Performance Low-Temperature Processed Electronics and Optoelectronics, Chem. Mater., 2015, 27, 4328–4337 CrossRef CAS.
- H. Zhang, J. Jang, W. Liu and D. V. Talapin, Colloidal Nanocrystals with Inorganic Halide, Pseudohalide, and Halometallate Ligands, ACS Nano, 2014, 8, 7359–7369 CrossRef CAS PubMed.
- W.-k. Koh, S. R. Saudari, A. T. Fafarman, C. R. Kagan and C. B. Murray, Thiocyanate-Capped PbS Nanocubes: Ambipolar Transport Enables Quantum Dot Based Circuits on a Flexible Substrate, Nano Lett., 2011, 11, 4764–4767 CrossRef CAS PubMed.
- Q. Lin, H. J. Yun, W. Liu, H.-J. Song, N. S. Makarov, O. Isaienko, T. Nakotte, G. Chen, H. Luo, V. I. Klimov and J. M. Pietryga, Phase-Transfer Ligand Exchange of Lead Chalcogenide Quantum Dots for Direct Deposition of Thick, Highly Conductive Films, J. Am. Chem. Soc., 2017, 139, 6644–6653 CrossRef CAS PubMed.
- J. De Roo, N. Yazdani, E. Drijvers, A. Lauria, J. Maes, J. S. Owen, I. Van Driessche, M. Niederberger, V. Wood, J. C. Martins, I. Infante and Z. Hens, Probing Solvent–Ligand Interactions in Colloidal Nanocrystals by the NMR Line Broadening, Chem. Mater., 2018, 30, 5485–5492 CrossRef CAS.
- C. L. Hartley and J. L. Dempsey, Electron-Promoted X-Type Ligand Displacement at CdSe Quantum Dot Surfaces, Nano Lett., 2019, 19, 1151–1157 CrossRef CAS PubMed.
- J. Zhang, H. Zhang, W. Cao, Z. Pang, J. Li, Y. Shu, C. Zhu, X. Kong, L. Wang and X. Peng, Identification of Facet-Dependent Coordination Structures of Carboxylate Ligands on CdSe Nanocrystals, J. Am. Chem. Soc., 2019, 141, 15675–15683 CrossRef CAS PubMed.
- B. Fritzinger, R. K. Capek, K. Lambert, J. C. Martins and Z. Hens, Utilizing Self-Exchange To Address the Binding of Carboxylic Acid Ligands to CdSe Quantum Dots, J. Am. Chem. Soc., 2010, 132, 10195–10201 CrossRef CAS PubMed.
- S. S. Sakpal, S. H. Deshmukh, S. Chatterjee, D. Ghosh and S. Bagchi, Transition of a Deep Eutectic Solution to Aqueous Solution: A Dynamical Perspective of the Dissolved Solute, J. Phys. Chem. Lett., 2021, 12, 8784 CrossRef CAS PubMed.
- S. Kore, R. R. Sahoo, B. Santra, A. Sarkar, T. Chowdhury, S. H. Deshmukh, S. Hazarika, S. Chatterjee and S. Bagchi, Solvation structure and dynamics of a small ion in an organic electrolyte, J. Photochem. Photobiol., 2023, 440, 114666 CrossRef CAS.
- H. A. McMahon, K. N. Alfieri, K. A. A. Clark and C. H. Londergan, Cyanylated Cysteine: A Covalently Attached Vibrational Probe of Protein−Lipid Contacts, J. Phys. Chem. Lett., 2010, 1, 850–855 CrossRef CAS PubMed.
- J. Nishida, J. P. Breen, K. P. Lindquist, D. Umeyama, H. I. Karunadasa and M. D. Fayer, Dynamically Disordered Lattice in a Layered Pb-I-SCN Perovskite Thin Film Probed by Two-Dimensional Infrared Spectroscopy, J. Am. Chem. Soc., 2018, 140, 9882–9890 CrossRef CAS PubMed.
- A. J. Stafford, D. M. Walker and L. J. Webb, Electrostatic Effects of Mutations of Ras Glutamine 61 Measured Using Vibrational Spectroscopy of a Thiocyanate Probe, Biochemistry, 2012, 51, 2757–2767 CrossRef CAS PubMed.
- A. N. Mnoyan, A. G. Kirakosyan, H. Kim, H. S. Jang and D. Y. Jeon, Electrostatic Stabilized InP Colloidal Quantum Dots with High Photoluminescence Efficiency, Langmuir, 2015, 31(25), 7117–7121 CrossRef CAS PubMed.
- A. Nag, M. V. Kovalenko, J.-S. Lee, W. Liu, B. Spokoyny and D. V. Talapin, Metal-free Inorganic Ligands for Colloidal Nanocrystals: S2−, HS–, Se2−, HSe–, Te2−, HTe–, TeS32−, OH–, and NH2− as Surface Ligands, J. Am. Chem. Soc., 2011, 133, 10612–10620 CrossRef CAS PubMed.
- M. A. Boles, D. Ling, T. Hyeon and D. V. Talapin, The surface science of nanocrystals, Nat. Mater., 2016, 15, 141–153 CrossRef CAS PubMed.
- W. Wang, M. Zhang, Z. Pan, G. M. Biesold, S. Liang, H. Rao, Z. Lin and X. Zhong, Colloidal Inorganic Ligand-Capped Nanocrystals: Fundamentals, Status, and Insights into Advanced Functional Nanodevices, Chem. Rev., 2022, 122(3), 4091–4162 CrossRef CAS PubMed.
- U. Soni and S. Sapra, The Importance of Surface in Core−Shell Semiconductor Nanocrystals, J. Phys. Chem. C, 2010, 114(51), 22514–22518 CrossRef CAS.
- U. Soni, A. Pal, S. Singh, M. Mittal, S. Yadav, R. Elangovan and S. Sapra, Simultaneous Type-I/Type-II Emission from CdSe/CdS/ZnSe Nano-Heterostructures, ACS Nano, 2014, 8, 113–123 CrossRef CAS PubMed.
- A. Pal, S. Srivastava, R. Gupta and S. Sapra, Electron transfer from CdSe–ZnS core–shell quantum dots to cobalt(III) complexes, Phys. Chem. Chem. Phys., 2013, 15, 15888–15895 RSC.
- U. Soni, P. Tripathy and S. Sapra, Photocatalysis from Fluorescence-Quenched CdSe/Au Nanoheterostructures: A Size-Dependent Study, J. Phys. Chem. Lett., 2014, 5(11), 1909–1916 CrossRef CAS PubMed.
- P. Giannozzi, S. Baroni, N. Bonini, M. Calandra, R. Car, C. Cavazzoni, D. Ceresoli, G. L. Chiarotti, M. Cococcioni, I. Dabo, A. Dal Corso, S. de Gironcoli, S. Fabris, G. Fratesi, R. Gebauer, U. Gerstmann, C. Gougoussis, A. Kokalj, M. Lazzeri, L. Martin-Samos, N. Marzari, F. Mauri, R. Mazzarello, S. Paolini, A. Pasquarello, L. Paulatto, C. Sbraccia, S. Scandolo, G. Sclauzero, A. P. Seitsonen, A. Smogunov, P. Umari and R. M. Wentzcovitch, QUANTUM ESPRESSO: a modular and open-source software project for quantum simulations of materials, J. Phys.: Condens. Matter, 2009, 21, 395502 CrossRef PubMed.
- J. P. Perdew, K. Burke and M. Ernzerhof, Generalized Gradient Approximation Made Simple [Phys. Rev. Lett. 77, 3865 (1996)], Phys. Rev. Lett., 1997, 78, 1396–1396 CrossRef CAS.
- D. Vanderbilt, Soft self-consistent pseudopotentials in a generalized eigenvalue formalism, Phys. Rev. B: Condens. Matter Mater. Phys., 1990, 41, 7892–7895 CrossRef PubMed.
- M. J. Frisch, G. W. Trucks, H. B. Schlegel, G. E. Scuseria, M. A. Robb, J. R. Cheeseman, G. Scalmani, V. Barone, G. A. Petersson, H. Nakatsuji, X. Li, M. Caricato, A. V. Marenich, J. Bloino, B. G. Janesko, R. Gomperts, B. Mennucci, H. P. Hratchian, J. V. Ortiz, A. F. Izmaylov, J. L. Sonnenberg, D. Williams-Young, F. Ding, F. Lipparini, F. Egidi, J. Goings, B. Peng, A. Petrone, T. Henderson, D. Ranasinghe, V. G. Zakrzewski, J. Gao, N. Rega, G. Zheng, W. Liang, M. Hada, M. Ehara, K. Toyota, R. Fukuda, J. Hasegawa, M. Ishida, T. Nakajima, Y. Honda, O. Kitao, H. Nakai, T. Vreven, K. Throssell, J. A. Montgomery Jr., J. E. Peralta, F. Ogliaro, M. J. Bearpark, J. J. Heyd, E. N. Brothers, K. N. Kudin, V. N. Staroverov, T. A. Keith, R. Kobayashi, J. Normand, K. Raghavachari, A. P. Rendell, J. C. Burant, S. S. Iyengar, J. Tomasi, M. Cossi, J. M. Millam, M. Klene, C. Adamo, R. Cammi, J. W. Ochterski, R. L. Martin, K. Morokuma, O. Farkas, J. B. Foresman and D. J. Fox, Gaussian 16 Rev. C.01, Wallingford, CT, 2016 Search PubMed.
- S. Chatterjee, D. Ghosh, T. Haldar, P. Deb, S. S. Sakpal, S. H. Deshmukh, S. M. Kashid and S. Bagchi, Hydrocarbon Chain-Length Dependence of Solvation Dynamics in Alcohol-Based Deep Eutectic Solvents: A Two-Dimensional Infrared Spectroscopic Investigation, J. Phys. Chem. B, 2019, 123(44), 9355–9363 CrossRef CAS PubMed.
- K. Kwak, S. Park, I. J. Finkelstein and M. D. Fayer, Frequency-frequency correlation functions and apodization in two-dimensional infrared vibrational echo spectroscopy: A new approach, J. Chem. Phys., 2007, 127, 124503 CrossRef PubMed.
- E. E. Fenn and M. D. Fayer, Extracting 2D IR frequency-frequency correlation functions from two component systems, J. Chem. Phys., 2011, 135, 074502 CrossRef PubMed.
- L. Liu, Z. Zhuang, T. Xie, Y.-G. Wang, J. Li, Q. Peng and Y. Li, Shape Control of CdSe Nanocrystals with Zinc Blende Structure, J. Am. Chem. Soc., 2009, 131, 16423–16429 CrossRef CAS PubMed.
- U. Soni, V. Arora and S. Sapra, Wurtzite or zinc blende? Surface decides the crystal structure of nanocrystals, CrystEngComm, 2013, 15, 5458–5463 RSC.
- P. Wang, H. Li, C. Cui and J. Jiang, In situ surface-enhanced Raman spectroscopy study of thiocyanate ions adsorbed on silver nanoparticles under high pressure, Chem. Phys., 2019, 516, 1–5 CrossRef CAS.
- Z. A. Al-Mualem and C. R. Baiz, Generative Adversarial Neural Networks for Denoising Coherent Multidimensional Spectra, J. Phys. Chem. A, 2022, 126, 3816–3825 CrossRef CAS PubMed.
- J. A. Dunbar, E. J. Arthur, A. M. White and K. J. Kubarych, Ultrafast 2D-IR and Simulation Investigations of Preferential Solvation and Cosolvent Exchange Dynamics, J. Phys. Chem. B, 2015, 119, 6271 CrossRef CAS PubMed.
- D. E. Rosenfeld, J. Nishida, C. Yan, S. K. K. Kumar, A. Tamimi and M. D. Fayer, Structural Dynamics at Monolayer–Liquid Interfaces Probed by 2D IR Spectroscopy, J. Phys. Chem. C, 2013, 117(3), 1409–1420 CrossRef CAS.
- S. Singh, J. Leemans, F. Zaccaria, I. Infante and Z. Hens, Ligand Adsorption Energy and the Postpurification Surface Chemistry of Colloidal Metal Chalcogenide Nanocrystals, Chem. Mater., 2021, 33(8), 2796–2803 CrossRef CAS.
- S. A. Yamada, W. H. Thompson and M. D. Fayer, Water-anion hydrogen bonding dynamics: Ultrafast IR experiments and simulations, J. Chem. Phys., 2017, 146, 234501 CrossRef PubMed.
- J. Nishida, J. P. Breen, B. Wu and M. D. Fayer, Extraordinary Slowing of Structural Dynamics in Thin Films of a Room Temperature Ionic Liquid, ACS Cent. Sci., 2018, 4, 1065–1073 CrossRef CAS PubMed.
- S. J. Lim, L. Ma, A. Schleife and A. M. Smith, Quantum dot surface engineering: Toward inert fluorophores with compact size and bright, stable emission, Coord. Chem. Rev., 2016, 320–321, 216–237 CrossRef CAS PubMed.
- J. P. Breen, L. C. Leibfried, X. Xing and M. D. Fayer, Long-Range Interface Effects in Room Temperature Ionic Liquids: Vibrational Lifetime Studies of Thin Films, J. Phys. Chem. B, 2023, 127(27), 6217–6226 CrossRef CAS PubMed.
- J. Nishida, J. P. Breen, B. Wu and M. D. Fayer, Extraordinary Slowing of Structural Dynamics in Thin Films of a Room Temperature Ionic Liquid, ACS Cent. Sci., 2018, 4(8), 1065–1073 CrossRef CAS PubMed.
- B. Wu, J. P. Breen and M. D. Fayer, Structural Dynamics in Ionic Liquid Thin Films: The Effect of Cation Chain Length, J. Phys. Chem. C, 2020, 124(7), 4179–4189 CrossRef CAS.
- D. A. Fenoll, M. Sodupe and X. Solans-Monfort, Influence of Capping Ligands, Solvent, and Thermal Effects on CdSe Quantum Dot Optical Properties by DFT Calculations, ACS Omega, 2023, 8(12), 11467–11478 CrossRef CAS PubMed.
Footnote |
| † Electronic supplementary information (ESI) available. See DOI: https://doi.org/10.1039/d4nr01507j |
| This journal is © The Royal Society of Chemistry 2024 |