Photodissociation of deuterated pyrrole–ammonia clusters: H-atom transfer or electron coupled proton transfer?†
Stefan
Fuchs
and
Bernhard
Dick
 *
*
Institut für Physikalische und Theoretische Chemie, Universität Regensburg, Universitätsstraße 31, 93053 Regensburg, Germany. E-mail: bernhard.dick@ur.de
First published on 22nd March 2024
Abstract
Several years ago the discovery of a conical intersection offered an explanation for the ultafast photodissociation of pyrrole. Subsequently, the photodissociation of pyrrole ammonia complexes PyH*(NH3)n with n ≥ 3 was studied in the gas phase as a model for a hydrogen-bond forming solvent. Two alternative mechanisms, electron coupled proton transfer (ECPT) and hydrogen atom transfer (HAT, also called the impulsive model, IM), have been proposed. The parent 1![[thin space (1/6-em)]](https://www.rsc.org/images/entities/char_2009.gif) :
:![[thin space (1/6-em)]](https://www.rsc.org/images/entities/char_2009.gif) 1 complex was never studied, due to the short lifetime of the NH4 radical fragment. Here we report experiments on the deuterated species PyD*(ND3)n, including the 1
1 complex was never studied, due to the short lifetime of the NH4 radical fragment. Here we report experiments on the deuterated species PyD*(ND3)n, including the 1![[thin space (1/6-em)]](https://www.rsc.org/images/entities/char_2009.gif) :
:![[thin space (1/6-em)]](https://www.rsc.org/images/entities/char_2009.gif) 1 complex (n = 1). The velocity distribution of the ND4 radical is well approximated by a Maxwell–Boltzmann distribution of T ≈ 530 K, with a negative anisotropy parameter of β = −0.3. The impulsive model predicts a much narrower velocity distribution with larger negative anisotropy. The ECPT model predicts a long lived intermediate that should allow thermal equilibration of the vibrational energy but should also destroy the rotational memory of the initially excited state. The average kinetic energy agrees with the prediction of the impulsive model, whereas the wide range of kinetic energies is more in line with ECPT. Hence the mechanism seems to be more complex and requires further theoretical modelling.
1 complex (n = 1). The velocity distribution of the ND4 radical is well approximated by a Maxwell–Boltzmann distribution of T ≈ 530 K, with a negative anisotropy parameter of β = −0.3. The impulsive model predicts a much narrower velocity distribution with larger negative anisotropy. The ECPT model predicts a long lived intermediate that should allow thermal equilibration of the vibrational energy but should also destroy the rotational memory of the initially excited state. The average kinetic energy agrees with the prediction of the impulsive model, whereas the wide range of kinetic energies is more in line with ECPT. Hence the mechanism seems to be more complex and requires further theoretical modelling.
Introduction
The photochemical stability of the DNA bases requires an ultrafast internal conversion of the first electronically excited state to the ground state.1 The discovery of a conical intersection below the Franck–Condon (FC) point in pyrrole (PyH) along the N–H coordinate offered a mechanistical understanding:2 whereas the isolated molecule in the gas phase should dissociate within a few fs into the pyrrolyl radical (Py) and a H atom, the cage effect of a condensed phase environment should allow for fast recombination on the ground state potential energy surface. The ejection of H atoms was experimentally observed,3–6 and their velocity distribution shows a narrow peak with strong negative anisotropy (β = −0.9), showing that this process is ultrafast. Photodissociation reaction via a πσ* state has been studied in other small molecules as summarized, e.g., by Ashfold et al.7But what happens when the pyrrole molecule is surrounded by solvent molecules? Does the ejected H atom collide with a solvent molecule, is reflected back, and reforms the bond to the N atom? Or should a scattering event that is controlled only by weak (van der Waals) forces not deflect the H atom in almost any direction? Should we not expect a substantial quantum yield of decomposition? Is it possible that in condensed phase the deactivation does not follow the conical intersection route but proceeds instead along a different reaction path that involves chemical interactions between the excited pyrrole and a solvent molecule?
These questions have been addressed by several studies on small clusters of pyrrole with rare gas atoms (Xe,8,9 Ar10), and in (pyrrole)n clusters.10 The cage effect within these clusters strongly quenches the N–H bond dissociation, e.g. by shifting the dissociative πσ* transition to higher energies.11 Solvent molecules that can form a hydrogen bond with pyrrole are of particular interest. Whereas the dynamics of the pyrrole–water complex in the electronically excited state was apparently so far only studied theoretically,12–14 the photodynamics of pyrrole–ammonia clusters has been studied experimentally in supersonic beams.15–17 Fragment cations NH4(NH3)n with n ≥ 1 have been observed and have been assigned to transfer of a hydrogen atom from pyrrole to the ammonia cluster followed by decomposition of the excited state and subsequent ionization of the NH4(NH3)n radical by a probe laser. Such a hydrogen transfer has been detected before in phenol–ammonia clusters by Pino et al.18,19
If the solvent is a H-bond acceptor, the N–H bond will most likely be involved in a H-bridge N–H⋯X. After electronic excitation the N site might become less electronegative than X, resulting in a shift of the H bridge to N⋯H–X. Such a change in electronegativity can be the result of a preceding electron transfer from the excited pyrrole to the solvent. In this case the hydrogen transfer is better described as electron coupled proton transfer (ECPT).
This proposal was tested by David et al.15 for pyrrole clustered with ammonia molecules, PyH*(NH3)n (we will also use the abbreviation PyH*An). With ps pump–probe experiments they observed that the excited clusters decay much slower than the bare PyH, with lifetimes in the range 10–30 ps. The neutral product radicals NH4(NH3)n−1 with n = 2, 3, 4 appear on the same time scale. From broadening of the mass peaks of these fragments with increasing delay time between dissociation and ionization a monomodal velocity distribution was derived, with a total kinetic energy release (TKER) in the range 500–600 meV. It was concluded that electronic excitation of the complexes results in the formation of a long-lived charge transfer (CT) state which, after some vibrational redistribution, dissociates in the neutral radicals Py and HAn.
This assignment was questioned later by Rubio-Lago et al.16 and Rodriguez et al.17 They used velocity map imaging (VMI) to measure the velocity distribution of the HAn radicals. These were isotropic and well fitted by a Maxwell–Boltzmann distribution (MBD) peaking near 10 meV. The huge difference to the TKER reported by David caused the authors to dismiss the ECPT hypothesis. Instead, they introduce an impulsive mechanism (IM): the H atom is ejected as in bare PyH and carries the An cluster away by an inelastic collision. The dissociating ammonia cluster radical NH4(NH3)n carries the same momentum as the H atom in the photodissociation of bare pyrrole. This model predicts a kinetic energy of the HAn fragment in the range of 20–70 meV, in good agreement with the VMI data. No further studies were published on this system, and the question of the mechanism seemed to be settled. However, we think that still some questions are open:
(1) Although the average kinetic energy of the HAn radicals is in the range predicted by the IM, a large fraction (ca. 30–50%) of the fragments have kinetic energies above this threshold. The absolute value of this “over-energy” is in the range 20–70 meV. The authors in ref. 16 and 17 explain this with initial vibrational energies of the clusters.
(2) If the N–H bond is broken on a 10 fs time scale, as in bare PyH, the momenta of the Py and HAn radicals should be equal (apart from sign), and equal to the momentum of the Py and H radicals in the photodissociation of bare PyH. However, the velocity distribution of Py from bare PyH is sharp with large negative anisotropy, whereas the velocity distributions of the HAn fragments are isotropic and broad.
A broad velocity distribution is in line with equilibration of vibrational degrees of freedom prior to dissociation. The missing anisotropy points to a lifetime of the excited complex much larger than a rotational period. This contradicts the predictions of the IM but is in line with the ECPT proposal. In this case the agreement of the average kinetic energy with the prediction of the IM would be accidental.
All previous studies were limited to the observation of large clusters PyH*An with n ≥ 3. In particular, data on the 1![[thin space (1/6-em)]](https://www.rsc.org/images/entities/char_2009.gif) :
:![[thin space (1/6-em)]](https://www.rsc.org/images/entities/char_2009.gif) 1 complex are missing. The reason is that the NH4 radical decays by tunneling within 13 ps.20 The IP of 4.62 eV21 is too large for ionization with photons of 355 or 333 nm used in the previous work. The 4th harmonic of a Nd:YAG laser should be just above the threshold. The short lifetime of the NH4 radical is due to dissociation of a H atom by tunneling. Due to the larger mass, tunneling of a D atom is much slower, giving the ND4 radical a lifetime of 2.3 μs.22 The present study uses pyrrole-d1 (PyD) and ND3 with the aim of characterizing the photodissociation dynamics of the 1
1 complex are missing. The reason is that the NH4 radical decays by tunneling within 13 ps.20 The IP of 4.62 eV21 is too large for ionization with photons of 355 or 333 nm used in the previous work. The 4th harmonic of a Nd:YAG laser should be just above the threshold. The short lifetime of the NH4 radical is due to dissociation of a H atom by tunneling. Due to the larger mass, tunneling of a D atom is much slower, giving the ND4 radical a lifetime of 2.3 μs.22 The present study uses pyrrole-d1 (PyD) and ND3 with the aim of characterizing the photodissociation dynamics of the 1![[thin space (1/6-em)]](https://www.rsc.org/images/entities/char_2009.gif) :
:![[thin space (1/6-em)]](https://www.rsc.org/images/entities/char_2009.gif) 1 complex PyD*ND3. When this complex is photolyzed at 226 nm and the fragments ionized with 266 nm photons at 300 ns delay, a broad velocity distribution is found for the ND4 radical that is well fitted by a MBD of T ≈ 530 K. Interestingly, some negative anisotropy (β = −0.3) is found. When photodissociation and ionization are performed by the same laser at 226 nm, an additional velocity component is observed that shows no anisotropy and is fitted by a MBD distribution of T ≈ 200 K. We assign this to dissociation of the complex cation produced by 1 + 1 REMPI.
1 complex PyD*ND3. When this complex is photolyzed at 226 nm and the fragments ionized with 266 nm photons at 300 ns delay, a broad velocity distribution is found for the ND4 radical that is well fitted by a MBD of T ≈ 530 K. Interestingly, some negative anisotropy (β = −0.3) is found. When photodissociation and ionization are performed by the same laser at 226 nm, an additional velocity component is observed that shows no anisotropy and is fitted by a MBD distribution of T ≈ 200 K. We assign this to dissociation of the complex cation produced by 1 + 1 REMPI.
Experimental
Time of flight apparatus
The time of flight (TOF) mass spectrometer was built in the mechanical workshop of the chemistry department of the University of Regensburg. It consists of three vacuum chambers for generation of the supersonic molecular beam, the ionization and acceleration of the ions, and a linear flight tube with the ion detector (see scheme in Fig. S1, ESI†). The source chamber is pumped by an oil diffusion pump (DI 300, Leybold), prepumped by the combination of a rotary vane pump and blower roots pump (Edwards E2M40 and EH250). The carrier gas (He/Ne 30![[thin space (1/6-em)]](https://www.rsc.org/images/entities/char_2009.gif) :
:![[thin space (1/6-em)]](https://www.rsc.org/images/entities/char_2009.gif) 70) mixed with a few percent ammonia passes through a stainless steel cylinder containing pyrrole at a defined temperature maintained by a water cooled Peltier element. This gas mixture is expanded into the vacuum by an Even-Lavie valve23,24 (z-direction) and passes through a skimmer (beam dynamics, 1.5 mm) into the ionization chamber, pumped by a turbo molecular pump (Pfeiffer HiPace 300). In the center between the parabolic repeller electrode and the first electrode mesh the molecular beam is crossed by the ionization laser (y-direction), and the ions are accelerated along the TOF axis (x-direction). Acceleration occurs in three regions with homogeneous electric fields, separated by electrode meshes (70% transmission). The length and field strengths of the acceleration regions were optimized to correct the flight time for variations of the ionization position up the 3rd order, a design published some time ago.25,26 At the end of the field free flight tube (80 cm), pumped by another turbomolecular pump (Leybold Turbovac 50), the ions are detected by a secondary electron multiplier (MasCom MC 17A). Due to the velocity component of the molecular beam perpendicular to the TOF axis the ions move slightly away from this axis in the drift tube. This is compensated by an electrostatic lens. The electrical signal is recorded by a digital oscilloscope (Keysight MSOX3104T).
70) mixed with a few percent ammonia passes through a stainless steel cylinder containing pyrrole at a defined temperature maintained by a water cooled Peltier element. This gas mixture is expanded into the vacuum by an Even-Lavie valve23,24 (z-direction) and passes through a skimmer (beam dynamics, 1.5 mm) into the ionization chamber, pumped by a turbo molecular pump (Pfeiffer HiPace 300). In the center between the parabolic repeller electrode and the first electrode mesh the molecular beam is crossed by the ionization laser (y-direction), and the ions are accelerated along the TOF axis (x-direction). Acceleration occurs in three regions with homogeneous electric fields, separated by electrode meshes (70% transmission). The length and field strengths of the acceleration regions were optimized to correct the flight time for variations of the ionization position up the 3rd order, a design published some time ago.25,26 At the end of the field free flight tube (80 cm), pumped by another turbomolecular pump (Leybold Turbovac 50), the ions are detected by a secondary electron multiplier (MasCom MC 17A). Due to the velocity component of the molecular beam perpendicular to the TOF axis the ions move slightly away from this axis in the drift tube. This is compensated by an electrostatic lens. The electrical signal is recorded by a digital oscilloscope (Keysight MSOX3104T).
With bromobenzene as test compound we observed a mass resolution of this setup of 930 (see Fig. S2, ESI†). The peaks for the two isotopomer of bromine are 14 ns wide and separated by 176 ns. The widths of the peaks are limited by the rise time of the multiplier and the width of the ionization laser pulse (both ca. 10 ns). Hence considerably higher mass resolution should be possible with this apparatus when a ps laser and a faster detector are used.
VUV ionization source
We wished to characterize the cluster composition of the molecular beam by direct one-photon ionization into the continuum. For this purpose the light of the third harmonic of a Nd:Yag laser (355 nm) was frequency tripled in a cylindrical stainless steel tube (25 mm diameter, 150 mm length) filled with a mixture of Xe and Ar.27,28 The 355 nm beam was focused with a f = 200 mm quartz lens through a plane quartz window of this cell. The generated 118 nm light left the cell at the vacuum side through a MgF2 lens with a focal length of ca. 50 mm mounted as the rear window of the Xe cell. The gas cell was mounted into a flange attached to the ionization chamber along the laser beam axis (y). It was adjusted to bring the focus of the 118 nm light to the center of the ionization region. Optimum performance was found for a Xe gas pressure of ca. 20 mbar.Velocity map imaging (VMI)
The VMI apparatus has been described earlier,29,30 with some modifications and improvements. These involve mostly the pumping systems and the detection unit. The supersonic beam is formed in the source chamber pumped by an oil diffusion pump (DI 3000, Leybold) followed by a roots pump and a rotary pump (Ruvac RAU 251 and Trivac D658, both Leybold). The same gas mixtures as for the TOF experiments were used, but in the VMI apparatus mixing with the vapor of pyrrole occurs in a stainless steel container outside the vacuum apparatus. The supersonic beam is generated by a pulsed solenoid valve (General Valve No. 9, 0.5 mm orifice) that can be temperature controlled up to 100 °C. The beam passes through a skimmer (2 mm, beam dynamics) into the ionization and acceleration unit, pumped by a turbomolecular pump (TPH 240, Pfeiffer). Acceleration occurs along the same axis as the molecular beam. The drift tube (48 cm length) can be separated from the acceleration unit by a vent, allowing to protect the detector from air during maintenance.The ions are detected by a double MCP in Chevron geometry (OD4061Z-V, Proxitronic). The amplified electron signal hits a P43 phosphor (40 mm diameter), which is imaged to a CCD camera by a camera objective (Xenon 25 0.95, Schneider-Kreuznach). The CCD camera of the earlier setup was replaced by a Manta G-145 (Allied Vision) with 1388 × 1018 square pixels of 6.45 μm size, temperature controlled at 18 °C.
After adjusting the optical system for the sharpest image of single ion events, the ion optics was optimized for sharpest contrast of the rings produced by photolysis of NO2 and REMPI ionization of the NO fragments. Adjusting the ratio of the voltages of the repeller and the lens electrodes (optimum value UR/UL = 2.93) resulted in rings of 3 pixel diameter. The detector was calibrated with the velocities of the NO fragments of 15 REMPI resonances for the dissociation channels of NO2 leading to O(1D) and O(3P), spanning the range of v = 440 m s−1 up to v = 2250 m s−1. These velocities can be calculated from the laser wavelength, the internal energy of the NO fragment selected by the REMPI resonance, and the known dissociation energies for the O(1D) channel (41![[thin space (1/6-em)]](https://www.rsc.org/images/entities/char_2009.gif) 000.41 cm−1
000.41 cm−1![[thin space (1/6-em)]](https://www.rsc.org/images/entities/char_2009.gif) 31) and the O(3P) channel (25
31) and the O(3P) channel (25![[thin space (1/6-em)]](https://www.rsc.org/images/entities/char_2009.gif) 128.6 cm−1
128.6 cm−1![[thin space (1/6-em)]](https://www.rsc.org/images/entities/char_2009.gif) 32).
32).
Laser systems
Tunable laser light in the range 220–245 nm was generated by a frequency doubled (BBO-I) dye laser (Scanmate SC150, Lambda Physics) pumped by the third harmonic of a Nd:YAG laser (Q-smart 850, Quantel). About 10% of the pump light was split off for the generation of the 118 nm VUV light. In the TOF apparatus, the dye laser beam entered the ionization chamber through a Brewster window from the side opposite to the Xe cell for VUV generation and left the apparatus through this cell. For experiments with delayed ionization at 266 nm the forth harmonic of a small Nd:YAG laser (minilite 1, Continuum) was overlapped with the dye laser beam with the help of a dichroitic mirror.The same lasers were also used in the VMI apparatus, however the dye laser and the 266 nm beam were counterpropagating. Alternatively, a second dye laser (FL3002A, Lambda Physics) was used, pumped by a XeCl laser at 308 nm (PM 800, Light Machinery).
Results and analysis
TOF mass spectra with ionization by 118 nm photons
A single photon of 118 nm (10.5 eV) can ionize NH3 (IP = 10.17 eV),33 as well as pyrrole (IP = 8.207 eV).34–39 One-photon ionization can hence be used to determine the composition of the molecular beam with the aim of optimizing the yield of the 1![[thin space (1/6-em)]](https://www.rsc.org/images/entities/char_2009.gif) :
:![[thin space (1/6-em)]](https://www.rsc.org/images/entities/char_2009.gif) 1 cluster PyH*NH3.
1 cluster PyH*NH3.
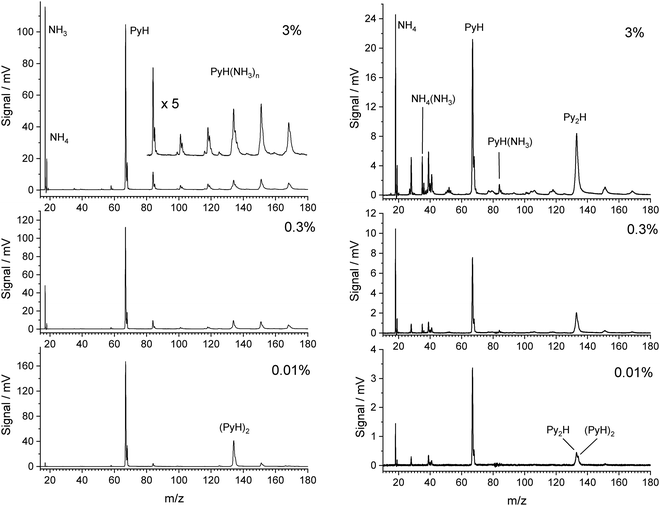
Fig. 1 shows TOF mass spectra for increasing fractions of NH3 in the carrier gas up to 3%. The pyrrole concentration was fixed by the temperature in the container before the nozzle. In the limit of very low ammonia concentration (0.01%) the main signals are those of pyrrole (m/z = 67) and its dimer (m/z = 134), accompanied by their 13C satellites. With increasing amount of ammonia in the beam the dimer peak quickly decreases, and signals for the complexes PyH*(NH3)n at m/z = 67 + n × 17 rise. The signal for n = 4 overlaps with that of the pyrrole dimer and is of similar intensity with the signals at m/z = 152 (n = 5) and m/z = 169 (n = 6) at 3% ammonia in the beam. We conclude that pyrrole interacts stronger with ammonia than with a second pyrrole, and that the pyrrole dimers have almost vanished at ammonia concentrations above 0.1%. The pyrrole signal also drops by about 40% in the presence of 3% ammonia in the carrier gas, indicating that about half of the pyrrole is involved in complexes with ammonia. We conclude that concentrations of ammonia in the range 1–3% should give good contrast between the 1![[thin space (1/6-em)]](https://www.rsc.org/images/entities/char_2009.gif) :
:![[thin space (1/6-em)]](https://www.rsc.org/images/entities/char_2009.gif) 1 complex and higher complexes.
1 complex and higher complexes.
We note that ammonia is also ionized, yielding a signal at m/z = 17. Interestingly, a further signal at m/z = 18 is also generated and increases with the concentration of ammonia. It is assigned to the NH4 cation. The amplitudes of these two signals remain when the concentration of pyrrole is lowered by cooling of the reservoir. In this case we observed also weak signals of larger ammonia clusters with m/z = n × 17 and m/z = n × 17 + 1. Whereas the former are very weak (about 1% of the NH3 signal), the latter are about 10 times more intense than their n × 17 counterparts. This phenomenon has been described before,40,41 and the n × 17 + 1 signals have been assigned to NH4(NH3)n−1+ cluster ions. Apparently, the ionized ammonia clusters spontaneously dissociate with high efficiency according to
 | (1) |
TOF mass spectra with ionization by 226 nm photons
Having characterized the composition of the molecular beam before photolysis we studied the species created by excitation with photons of 226 nm (5.49 eV). Although two photons of this energy could ionize ammonia, we do not observe any signal when the molecular beam does not contain pyrrole. Hence all signals in the TOF mass spectra with 226 nm excitation involve at least two photons of this energy and stem from clusters containing at least one pyrrole molecule. The right side of Fig. 1 shows the mass spectra observed with 226 nm excitation. Although the expansion conditions of the molecular beam were identical to those of the 118 nm one-photon ionization (left side of Fig. 1), the mass spectra differ substantially.In contrast to the observation for ionization with 118 nm photons the mass peak for the dimer seems to increase relative to that of the monomer with increasing concentration of ammonia. Closer inspection of the data reveals, however, that the main peak is at mass 133, not 134. We assign this to the species Py2H, with the probable structure Py–H–Py. After excitation to S1 by absorption of the first photon, Py–H will dissociate into a Py radical and a hydrogen atom on a 120 fs time scale.42,43 Since no signal at mass 66 is observed, the Py radical is apparently not ionized by the 226 nm laser, in agreement with the ionization potential of 8.2 eV that we obtain from CASSCF calculations. On the other hand, we calculate an ionization potential of 4.6 eV for the Py–H–Py radical, i.e., this species can be ionized by 226 nm photons. The signal of PyH cations at mass 67 must originate from the dissociation of cluster cations. As we will show in the discussion, the cluster cations PyH(NH3)n+ with n ≥ 1 will preferentially dissociate into Py radicals and H(NH3)n+ cations. A very weak signal at m/z = 84 could be a small fraction of PyH(NH3)+ which did not dissociate. Therefore, we expect a decreasing signal of PyH cations with increasing concentration of ammonia in the beam.
To our great surprise the largest signal is that of the ammonium cation NH4 at m/z = 18. We checked that it is not NH3. The difference in flight times between this peak and that of PyH is 8.638 μs, for the corresponding peaks with 118 nm ionization it is 8.644 μs, whereas the NH3 peak occurs 0.264 μs earlier. Additional signals at m/z = 35 and 52 may be assigned to the cations NH4(NH3)k with k = 1, 2. These cations could arise from a photodissociation of the complexes PyH*(NH3)k+1, followed by ionization by a second photon of 226 nm. Although this is energetically possible, the lifetime of the NH4 radical of ca. 13 ps20 is much too short to account for the large NH4 signal. On the other hand, it must originate from a complex with pyrrole, since all these signals disappear when no pyrrole is in the beam. A possible explanation is resonant two-photon ionization of PyH*NH3 followed by dissociation of the PyH*NH3+ cation into a Py radical and NH4+. This requires a sufficiently long lifetime of the excited state of PyH*NH3.
Several small signals can be assigned to fragments of pyrrole, e.g. CNH (m/z = 27), CHNH (28), C3 (36), C3H3 (39), C2HNH (40), C3H5 or C2H2NH (41), C3N (50), C3NH (51), C3H2NH (53), and C3H3NH (54). These do not depend on the ammonia concentration and arise most likely from multiphoton excitation of pyrrole. So far we have no explanation for the signal at m/z = 19. We tested the hypothesis that it is H3O+ as the result of ionization and fragmentation of PyH*H2O clusters that might be formed by residual water in the apparatus. However, when we intentionally added water vapor to the carrier gas at low ammonia concentrations, we did see a signal at m/z = 85 for PyH*H2O that was larger than the signal at m/z = 84 for PyH*NH3, but the signal at m/z = 19 disappeared. Hu et al.44 have observed a similar signal in their study of multiphoton fragmentation and ionization of pyrrole ammonia clusters, and speculate about a hypervalent NH5 cation.
TOF mass spectra of deuterated pyrrole and ammonia
When ammonia in the carrier gas is replaced by deuterated ammonia, the pyrrole in the sample container is slowly deuterated in situ, leading also to isotopically substituted ammonia. A mass spectrum with one-photon ionization by 118 nm photons taken during this process is shown in Fig. 2. The signal of PyD at m/z = 68 is twice as high as that of PyH, indicating that already ca. 65% of the pyrrole is deuterated. The ammonia signals in the range m/z = 17–20 can be assigned to the ammonia isotopomers NHn−3Dn for n = 0–3, probably overlapping with the cations of NH4, NH3D, and NH2D2. However, the signals at m/z = 21 for NHD3 and m/z = 22 for ND4 are very weak.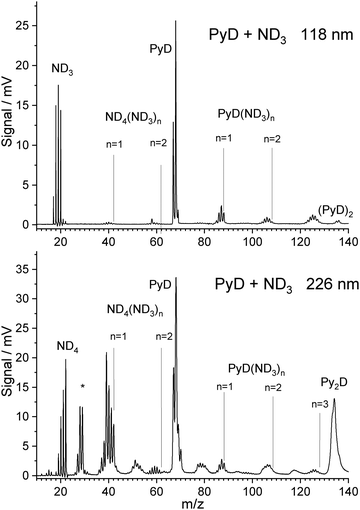 | ||
| Fig. 2 TOF spectra of PyH with 3% ND3 in the carrier gas, measured after partial H/D exchange. Ionization was performed with 118 nm photon (top) and 226 nm photons (bottom). | ||
Hence it seems that the efficiency of the spontaneous dissociation of ionized ammonia dimers drops significantly with increasing degree of deuteration. As in the case of 118 nm ionization with undeuterated ammonia, signals corresponding to the cluster composition PyD(ND3)n were observed for n = 1–3. Due to the H/D exchange of ND3 with pyrrole these signals show peaks for all possible isotopic substitutions of the ammonia molecules and the N–H group of pyrrole. During experiments, while ND3 was flown over the pyrrole sample for several days, the degree of deuteration increased. However, we did not observe exchange at the C–H bonds of pyrrole.
With ND3 in the carrier gas, excitation with 226 nm photons yields a TOF mass spectrum that is similar to the case of NH3 but convoluted with the isotopomer distribution caused by H/D exchange of ND3 with pyrrole (Fig. 2 lower part). We observe signals in the range m/z = 18–22, corresponding to the ammonium cations NHnD4−n with n = 0–4. No signal at m/z = 23 or 24 is observed that would correspond to deuterated forms of the hypervalent NH5 cation proposed by Hu.44 Hence we think that his explanation for the m/z = 19 signal in the NH3 experiment is unlikely.
The ratio of the PyD-signal to the sum of the various deuterated ammonium ions is similar to the ratio of PyH to NH4 in the undeuterated beam. We will show that this requires the proposal of two different mechanism for the production of these ions. Fig. 3 shows the result of the crucial experiment.
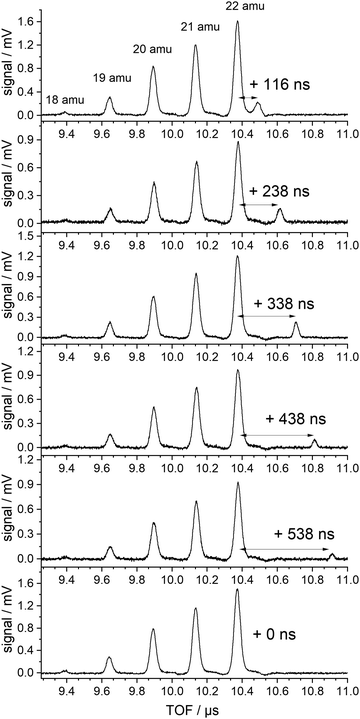 | ||
| Fig. 3 TOF spectra in the region of the NH4−nDn cations produced with 226 nm excitation (lowest trace) and additional 266 nm excitation delayed by the indicated delay time. | ||
Several TOF traces are displayed in the range of the ammonium cations, produced by 226 nm excitation and, in addition, a delayed laser pulse of 266 nm photons. The 266 nm photons cannot excite any of the ground state species in the beam. But the energy is slightly above the threshold for the ionization of the ammonium radical. We observe an additional signal that is displaced from that of the fully deuterated “instantaneous” ammonium ion by the delay time of the second laser. The intensities of the instantaneous signals are quadratic in the intensity of the 226 nm laser, those of the delayed signals are linear in both laser intensities (226 and 266 nm).
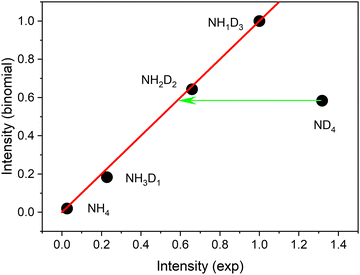
No delayed signals are observed for the partly deuterated species. Obviously, only the fully deuterated radical lives long enough so that it can be ionized by the 266 nm photon. The corresponding experiment performed on the undeuterated beam did not show any delayed signal. We conclude that the instantaneous signals of undeuterated or partially deuterated NH4 are not due to ionization of the corresponding ammonium radicals but are created via a different path. If the same mechanism is operative for these signals, the relative intensities should be given by a binomial distribution. Indeed, all signals except that of the fully deuterated species are well fitted by a binomial distribution for a deuteration probability p(D) = 0.7, as shown in Fig. 4.
This distribution predicts similar intensities for NH2D2 and ND4. We conclude that ca. 56% of the ND4 signal results from a different mechanism not available to the partially deuterated species. We assign this excess signal to ionization of neutral ND4 radicals by 226 nm photons.
We conclude that the only ions that unequivocally result from neutral ammonium radicals are those of the delayed signal. Hence the study of the velocity distribution focuses on these ions.
Velocity map imaging
The D atoms from PyD
Our analysis of ion images is based on the popular model for the 3D-velocity distribution | (2) |
 | (3) |
 | (4) |
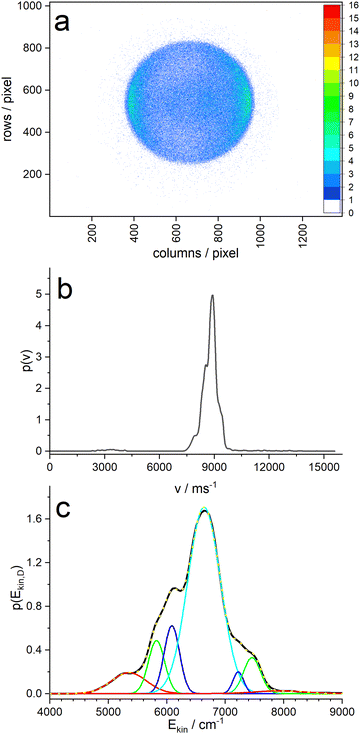
We begin by showing the ion image and the resulting velocity distribution for the D atoms produced by dissociating PyD with 243 nm photons. These photons also ionize the D atoms by 2 + 1 REMPI via the 1s–2s resonance. Since the Doppler width of the D atoms is larger than the laser linewidth, the laser was scanned continuously over the range of the Doppler width.
Analysis of the ion image (Fig. 5a) shows a narrow velocity distribution with large negative anisotropy (β = −0.9), indicating that the transition dipole of the resonant transition of pyrrole is perpendicular to the N–D bond – as expected for a πσ* excitation. The velocity distribution extracted with the MELEXIR program is shown in panel (b) of Fig. 5. It should be noted that a contribution of slow D atoms with low anisotropy, as observed for the corresponding image of H atoms from PyH,3–6,47 is missing in the D atom distribution.5 This supports the hypothesis that these slow H atoms stem from dissociation of C–H bonds of pyrrole.
Panel (c) of Fig. 5 shows the velocity distribution transformed into a kinetic energy distribution. This distribution shows structure that is likely due to different vibrational states of the pyrrolyl counter fragment. The main peak has three shoulders on each side, and a fit with 7 Gaussians yields an almost perfect fit. The resulting peak positions and areas are summarized in Table 1. When we assign the highest energy peak to the vibrationless ground state of the pyrrolyl radical, we obtain the wavenumber shifts in column 4 of Table 1. These should correspond to vibrational states of the Py radical. Cronin et al.6 found vibrational satellites in the total kinetic energy release (TKER) spectrum of undeuterated pyrrole with the Rydberg tagging technique at shifts of 1035, 1325, 1711, 2141, and 2549 cm−1, albeit at larger photolysis wavelengths λ > 236 nm. At lower wavelengths the large fraction of slow hydrogen atoms obscures these features. The two largest shifts agree reasonably well with our data.
| E(peak) | FWHM | Area/% | ΔE1 | ΔE2 |
|---|---|---|---|---|
| 5353 | 602 | 7.6 | 2574 | 1285 |
| 5823 | 276 | 8.8 | 2104 | 815 |
| 6086 | 262 | 10.7 | 1841 | 552 |
| 6638 | 559 | 62.7 | 1289 | 0 |
| 7222 | 183 | 2.4 | 705 | −584 |
| 7458 | 293 | 6.4 | 469 | −820 |
| 7927 | 850 | 1.4 | 0 | −1289 |
On the other hand, we made a surprising observation when we take the position of the main peak as reference: apparently, the positions of the sidebands are symmetrical around the center peak, resembling a Raman pattern. In fact, the intensities at the low-energy side (i.e. Stokes) are all higher than those of the high-energy side (anti-Stokes). In addition, the widths vary in a range from 180 to 850 cm−1, but each “Stokes”-band has a similar width as the corresponding “anti-Stokes” band. This suggest an unorthodox explanation: the molecule is excited into a vibronic state of Py–D that has some excess energy above the vibrational ground state of the 1A2 state. Perhaps the initial wavepacket at this energy couples to three vibrations, either in-phase or out-of-phase, so that the leaving D-atom either gains or loses one quantum of the corresponding vibration. The widths of the bands might then be related to the vibrational dephasing times of the corresponding vibration.
A B3LYP calculation of the vibrational frequencies of the pyrrolyl radical suggests as candidates two out-of plane modes a2 (828 cm−1) and b2 (542 cm−1) as well as one in-plane mode b1 (1299 cm−1) (Table 2).
| A1 | A2 | B1 | B2 |
|---|---|---|---|
| 882 | 495 | 662 | 542 |
| 1044 | 828 | 937 | 712 |
| 1091 | 920 | 1078 | 844 |
| 1203 | 1299 | ||
| 1432 | 1361 | ||
| 1560 | 3193 | ||
| 3198 | 3225 | ||
| 3245 |
Velocity distribution of NH4
As is obvious from the mass spectra, the ions that contain the information of cluster dissociation form only a very tiny fraction of the total number of ions produced by 226 nm excitation. For the VMI experiments we use the identical gas mixture and total pressure, but the nozzle is different, which can influence the cluster distribution. By using a gated MCP as the detector in the ion imaging experiment, we can isolate the ion package of interest from all others. We observe that the signals originating from PyH*(NH3)n clusters (or the corresponding deuterated species) sharply decline in intensity with increasing n. Therefore, we believe that the cluster distributions in both expansions are similar.The total number of these selected ions generated for every laser pulse is very small, and long accumulation times were needed to collect images with ion counts in the range 50![[thin space (1/6-em)]](https://www.rsc.org/images/entities/char_2009.gif) 000–150
000–150![[thin space (1/6-em)]](https://www.rsc.org/images/entities/char_2009.gif) 000. This number of ions is sufficient for the MEVELER45 and MELEXIR46 algorithms to extract the underlying velocity distribution with acceptable signal to noise ratio. Since the original data (ion images) look rather similar, we do not show them here but focus on the extracted velocity distributions. The ion images used for Fig. 6 are shown as Fig. S4 in the ESI.†
000. This number of ions is sufficient for the MEVELER45 and MELEXIR46 algorithms to extract the underlying velocity distribution with acceptable signal to noise ratio. Since the original data (ion images) look rather similar, we do not show them here but focus on the extracted velocity distributions. The ion images used for Fig. 6 are shown as Fig. S4 in the ESI.†
For ND4 we found – with photolysis wavelengths in the range 220–245 nm, always a broad velocity distribution with a single maximum. The anisotropy parameter averaged over this broad distribution was in the range −0.2 < β < −0.35 for the delayed signal, and β = −0.1 for the instantaneous signal. The larger anisotropy of the delayed signal indicates that these ions result from a fast dissociation process, whereas the “instantaneous” ions stem probably from a longer lived intermediate. Note that the D atoms from the ultrafast photodissociation of bare pyrrole show an anisotropy parameter of β = −0.9.
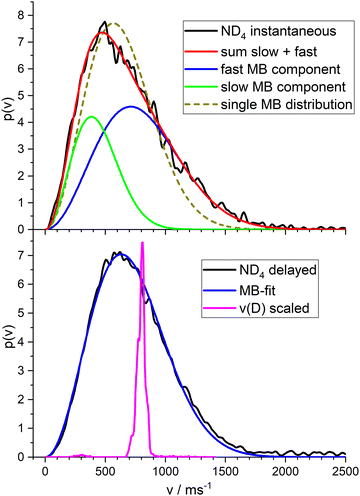
Fig. 6 shows the total velocity distributions obtained for photolysis with 226 nm photons, in the upper panel for the instantaneous ions, in the lower panel for the ions created by a photon of 266 nm at a delay time of 300 ns. The latter is very well fitted by a single MBD with mean velocity of 715 m s−1 corresponding to a temperature of T = 532 K. A single MBD does not give a good fit to the instantaneous signal, but a superposition of two MBD does. This indicates two different contributions to this signal. We assign the first to dissociation of the ionized complex, the second to ionization of the ammonium radical. We obtained a branching ratio for these two channels of ca. 1![[thin space (1/6-em)]](https://www.rsc.org/images/entities/char_2009.gif) :
:![[thin space (1/6-em)]](https://www.rsc.org/images/entities/char_2009.gif) 1 from the isotope pattern of the NH4−nDn signal of the TOF experiment (see Fig. 4). Fitting the velocity distribution of the instantaneous signal by two independent MBDs, we obtain mean velocities of 434 m s−1 (T = 196 K) for the slow component (33%) and 800 m s−1 (T = 671 K) for the fast component (67%). These are shown as the green and blue curves in the upper panel of Fig. 6, respectively. If we fix an equal ratio of the two channels, the temperatures are 259 K and 838 K, respectively.
1 from the isotope pattern of the NH4−nDn signal of the TOF experiment (see Fig. 4). Fitting the velocity distribution of the instantaneous signal by two independent MBDs, we obtain mean velocities of 434 m s−1 (T = 196 K) for the slow component (33%) and 800 m s−1 (T = 671 K) for the fast component (67%). These are shown as the green and blue curves in the upper panel of Fig. 6, respectively. If we fix an equal ratio of the two channels, the temperatures are 259 K and 838 K, respectively.
The magenta curve in the lower panel is the velocity distribution of the deuterium atoms from the dissociation of PyD at 243 nm, with the velocity scaled by the mass ratio m(D)/m(ND4). Hence this curve corresponds to the initial momentum transferred by the dissociating D atom to the ND3 fragment. I.e., this is the velocity distribution expected for the ND4 fragment in the limit of the impulsive model (see Discussion).
In the mass spectra with delayed 266 nm excitation we see delayed satellites for all isotopically substituted species of NH4(NH3) (see Fig. S3, ESI†). This suggests that these clusters are stable against loss of hydrogen atoms via tunneling, at least on the timescale of several hundred ns. However, the signal was too small to obtain an ion image.
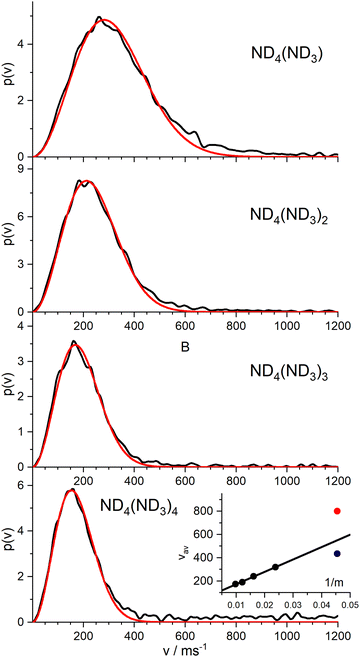
Nevertheless, we measured the ion images of the instantaneous fully deuterated ions ND4(ND3)n with n = 1–4. The resulting velocity distributions (Fig. 7) are well fitted by a single MBD, with average velocities of 319 m s−1 (n = 1), 240 m s−1 (n = 2), 190 m s−1 (n = 3), and 173 m s−1 (n = 4). As shown in the inset of Fig. 7, these mean velocities are proportional to the inverse of the mass, i.e. they all have the same mean momentum. The slow component of the instantaneous signal for n = 0 (blue dot) fits well into this model. The fast component (red dot) results from a different reaction channel.
This suggests the conclusion that all “instantaneously” generated protonated ammonia cluster ions correlate with the mechanism that produces the “slow” component in the velocity distribution of the instantaneous ND4 signal. Apparently, this slow component does not originate from the ionization of the neutral ND4 radical, which has a much faster average velocity of 715 m s−1.
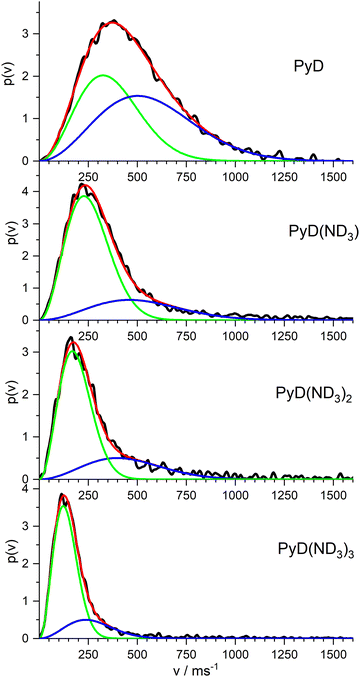
In order to complete our picture we also studied the ion images of the PyD(ND3)n cations for n = 0–3. The resulting velocity distributions are shown in Fig. 8. All distributions show a single broad band with the peak velocity decreasing monotonously from ca. 400 m s−1 for n = 0 to ca. 120 m s−1 for n = 3. Obviously, all these ions originate from dissociation processes. A fit of a single MBD to these velocity distributions did not well account for the long tail at higher velocities, but two MBD always yield an almost perfect fit.
Quantum chemical calculations
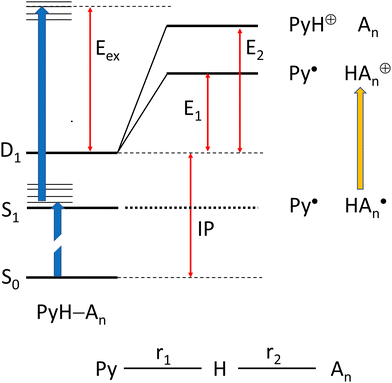
We have chosen the cc-pVTZ atomic orbital basis for all our calculations. In order to account for possible contributions of Rydberg states,48,49 this basis was augmented by two diffuse sets of s and p-orbitals on the N atoms (see ESI†), except for systems with a positive charge. In order to include correlation energy we initially performed all geometry optimizations on the MP2 level of theory, with a RHF reference for closed shell systems, and an UHF reference for radicals. However, we observed that these calculations cannot be combined to obtain energies for reactions that involve both closed shell and radical species. Hence, we turned to CASSCF calculations for geometry optimizations, adding dynamic correlation with NEVPT2 perturbation theory50 as implemented in ORCA.51,52We considered two scenarios: (I) dissociation of the complex after two-photon ionization, and (II) dissociation of the complex on the PES of an electronically excited state after one-photon excitation (see Scheme 1):
We begin with scenario I, which involves only calculations on electronic ground states. We may characterize each optimized geometry by the length r1 of the Py–H distance, and the distance r2 of this H atom to the nearest ammonia N atom. For brevity, we will refer to structures with short Py–H distance (r1 ≈ 1.0 Å) as solvated pyrrole (SP), and those with a short distance r2 as hydrated ammonia (HA).
Optimization of the cation ground state finds minima both for the SP and the HA form for n = 1–3, whereas the SP minimum for n = 4 disappears and only the HA form remains. The SP form is the global minimum for n = 1,48 whereas it is the HA form for all larger clusters. Ionization potentials for all clusters were obtained as the difference of the energies of the global minima of the neutral and the cation. For bare pyrrole we find IP = 8.24 eV, in excellent agreement with the experimental value of 8.207 eV. Energies for the two dissociation channels were obtained by geometry optimization with either r1 or r2 constrained to 20 Å. In order to suppress relative rotation of the two fragments, in some cases an additional angle or dihedral was also constraint. The results are summarized in Table 3.
| n | IP | E 1 | E 2 | E ex |
|---|---|---|---|---|
| 0 | 8.24 | 9.94 | — | 2.73 |
| 1 | 7.74 | 1.59 | 0.96 | 3.23 |
| 2 | 7.44 | 1.04 | 1.45 | 3.53 |
| 3 | 6.89 | 0.84 | 1.98 | 4.08 |
| 4 | 6.56 | 0.69 | 2.52 | 4.41 |
The barrier for dissociation of a neutral ammonia cluster increases monotonously with increasing cluster size, whereas the barrier for dissociation of a protonated ammonia cluster decreases. The calculated excess energy, i.e. the energy of two 226 nm photons minus the ionization potential, is sufficiently high so that both dissociation paths appear possible for all complexes studied. If we assume that the channel with the lower barrier has the larger yield, we should see an increasing yield of solvated ammonium ions HAn+ with increasing n. Since the hydrogen forms the bridge between the dissociating fragments, each HAn+ fragment should originate from the corresponding PyHAn complex. On the other hand, dissociation channel Ib might not necessarily result in the loss of all ammonia as a whole cluster, dissociation of only part of the cluster should also be possible. Hence a particular fragment PyHAk+ could have several precursors.
Scenario II of Scheme 1 involves the electronically excited states, hence the basis set was extended with diffuse functions on the nitrogen atoms to account for the possibility of Rydberg states. Fig. 9 shows potential energy curves calculated with CASSCF(8|7)-XMCQDPT/cc-pVTZ(+) for the S0(A′) and S1(A′′) states obtained by linear interpolation between several stationary points assigned to the path variable at x = −1, 0, and +1. These calculations were done with the Firefly QC package53 which is partially based on the GAMESS (US)54 source code. This code makes optimum use of point group symmetry and offers the second order perturbative treatment of CASSCF wavefunctions with the Extended Multi-Configuration Quasi-Degenerate Perturbation Theory (XMCQDPT).55
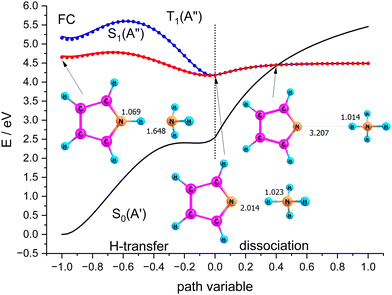 | ||
| Fig. 9 Scans of the lowest excited singlet states S0(A′) and S1(A′′) obtained by interpolation between the Franck–Condon point, the local and global minimum of S1, and the dissociated state. | ||
The blue curves in Fig. 9 show S1(A′′) (full line) and T1(A′′) (dots) between the FC-point (x = −1) and the global minimum of the S1(A′′) state with Py–NH4 structure (x = 0). For comparison, the path for these two states between the local minimum of S1(A′′) with PyH–NH3 structure (also assigned to x = −1) and the global minimum of S1(A′′) are shown as red lines and dots, respectively. The corresponding S0 state is shown as the black line. These two coordinates correspond to hydrogen transfer, albeit from a different starting point. As an approximation to the dissociation coordinate for the formation of the radical pair we interpolate between the global minimum of S1 and the optimized structure for the separated radicals with a fixed distance of 20 Å. The value of the path coordinate x = 1 corresponds to a distance of 6.5 Å.
The local and global minima on the S1 surface are separated by a shallow barrier that is below the FC point, i.e., vertical excitation provides sufficient energy for dissociation. The linear interpolation between the FC point and the local minimum on S1 shows a somewhat larger barrier, but since we did not find a barrier between the FC point and the local minimum, only the smaller barrier should be relevant. We note that along both paths as well as the dissociation path the lowest excited singlet is essentially degenerate with the lowest triplet state. Hence even small spin orbit coupling could move the system to the triplet state and thus inhibit recombination of the radical pair. The conical intersection between S0 and S1 occurs at larger distances where dissociation is essentially complete. The optimized structure of the minimum energy crossing point is also displayed in Fig. 9.
Although dissociation is energetically possible, the system must switch between two coordinates and follow a bending in the potential energy surface. This should result in coupling to vibrations and might delay the dissociation by the time the system needs to find the “exit” channel. Computational verification of this hypothesis, however, involves extensive multidimensional wavepacket simulations which are far outside the scope of this primarily experimental study.
Discussion
Mechanistic alternatives
In the previous work on the photodissociation of pyrrole ammonia clusters the question of the mechanism was answered controversially. David et al.15 argue in favor of an electron coupled proton transfer ECPT, whereas Rubio-Lago et al.16,17 favor an explanation in terms of an excited state hydrogen transfer ESHT, also described as the impulsive model (IM).The IM proposes that the excited pyrrole dissociates like in the uncomplexed case by breaking of the N–H bond. The fast H-atom impinges on the ammonia cluster (An) and carries it away. Assuming that the ammonia cluster is initially at rest in the center of mass system, the momentum of the pyrrolyl radical Py is the same both for uncomplexed and complexed pyrrole, and of opposite sign to the momentum of the other fragment:
 | (5) |
 | (6) |
If the ECPT mechanism applies, the kinetic energy can be much larger. It is only limited by the excess energy and the conservation of momentum
 | (7) |
Indeed, as obvious from Table 4, the average kinetic energy of the fragments ND4(ND3)n are in fair agreement with the prediction of the impulsive model. This is also in good agreement with the kinetic energies measured by Rubio-Lago et al.16 and Rodriguez et al.17 for n ≥ 2, although in these studies the fragments were observed after delayed ionization (40 ns) with 333.5 nm photons.
| n | 〈Ekin〉 meV | Fraction of Ekin (D)/% | Prediction IM/% |
|---|---|---|---|
| 0 (delayed) | 68 | 8.5 | 9.1 |
| 0 (slow) | 33 | 4.0 | 9.1 |
| 1 | 26 | 3.2 | 4.8 |
| 2 | 22 | 2.7 | 3.2 |
| 3 | 18 | 2.2 | 2.4 |
| 4 | 11 | 1.4 | 2.0 |
On first glance this supports the hypothesis of the impulsive model. However, two observations are at variance with this conclusion. First, the velocity distribution is far too broad. Whereas the expected distribution calculated from the velocities of the D-fragment of Py–D by scaling with the mass ratio, shown as the magenta curve in Fig. 6, shows a width of ca. 100 m s−1, the actual distribution (black curve) has a width of ca. 800 m s−1. The very good fit of a MBD suggests that the system can be characterized by a temperature, expected for a sample after equilibration. This in turn suggests that the dissociating species has a lifetime of at least a few vibrational periods, i.e. much longer than the dissociation time of the bare pyrrole. The observation of a substantially reduced value for the anisotropy parameter (β = −0.3 instead of −0.9) also points in this direction.
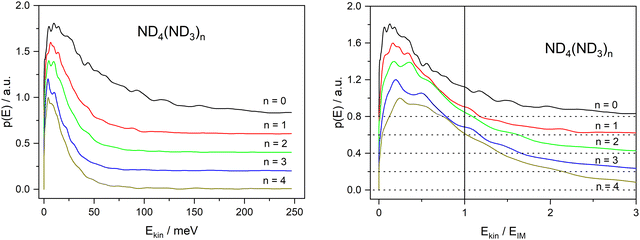
The second observation that is at variance with the impulsive model is the fact that the kinetic energy distribution extends far beyond the available kinetic energy according to the IM, see Fig. 10. The corresponding kinetic energy distributions for the undeuterated fragments with n ≥ 2 have been reported by Rubio Lago et al.16 and are very similar to ours. The fact that a large fraction of these distributions extends beyond the limit predicted by the IM has also been noticed by these authors. They propose that the excess energy is provided by population of vibrational excited states due to insufficient cooling in the molecular beam.
If we wish to interpret this observation in terms of the ECPT model we need the dissociation energy of the complex. With CASSCF(8|7)/cc-pVTZ(+) we calculate an adiabatic dissociation energy De = 33![[thin space (1/6-em)]](https://www.rsc.org/images/entities/char_2009.gif) 656 cm−1 for PyH, and De = 30
656 cm−1 for PyH, and De = 30![[thin space (1/6-em)]](https://www.rsc.org/images/entities/char_2009.gif) 436 cm−1 for the 1
436 cm−1 for the 1![[thin space (1/6-em)]](https://www.rsc.org/images/entities/char_2009.gif) :
:![[thin space (1/6-em)]](https://www.rsc.org/images/entities/char_2009.gif) 1 complex. Cronin et al. have reported D0(N–H) = 32
1 complex. Cronin et al. have reported D0(N–H) = 32![[thin space (1/6-em)]](https://www.rsc.org/images/entities/char_2009.gif) 850 ± 40 cm−1 for pyrrole-h5,6 and D0(N–D) = 33
850 ± 40 cm−1 for pyrrole-h5,6 and D0(N–D) = 33![[thin space (1/6-em)]](https://www.rsc.org/images/entities/char_2009.gif) 590 ± 50 cm−1 for fully deuterated pyrrole.56 The latter value (3.77 eV) is in very good agreement with the quantum chemical calculation, hence we will use the calculated value also for the 1
590 ± 50 cm−1 for fully deuterated pyrrole.56 The latter value (3.77 eV) is in very good agreement with the quantum chemical calculation, hence we will use the calculated value also for the 1![[thin space (1/6-em)]](https://www.rsc.org/images/entities/char_2009.gif) :
:![[thin space (1/6-em)]](https://www.rsc.org/images/entities/char_2009.gif) 1 complex. Excitation with a photon at 226 nm (5.49 eV) provides an excess energy of 1.72 eV. If this energy is converted into kinetic energy of the fragments Py and ND4, the latter will receive 1.29 eV through conservation of momentum. This is far outside the range considered in Fig. 10. The 68 meV measured for the delayed ND4 fragments corresponds to 5.3% of this energy, meaning that 94.7% of the excess energy is converted to vibrational excitation of the fragments. Apparently, we need to assume a rather small value for α in eqn (7) if we adopt the ECPT model.
1 complex. Excitation with a photon at 226 nm (5.49 eV) provides an excess energy of 1.72 eV. If this energy is converted into kinetic energy of the fragments Py and ND4, the latter will receive 1.29 eV through conservation of momentum. This is far outside the range considered in Fig. 10. The 68 meV measured for the delayed ND4 fragments corresponds to 5.3% of this energy, meaning that 94.7% of the excess energy is converted to vibrational excitation of the fragments. Apparently, we need to assume a rather small value for α in eqn (7) if we adopt the ECPT model.
We now face the dilemma that not only several experimental results of David and Rubio-Lago contradict each other, but also some of ours are at variance with some of the previous work. Whereas we find that all species of the composition PyD(ND3)n produced with 226 nm excitation are fragments with a finite velocity distribution, Rodriguez et al.17 find them as mother ions. Whereas we could not lower the intensity of the 226 nm photolysis laser so that it did not produce ions in delayed ionization experiments, Rodriguez et al.17 managed to do so (albeit using a different ionization wavelength of 333 nm instead of 266).
On the other side, our velocity distributions for the “instantaneous” fragments ND4(ND3)n (n = 1–4) agree perfectly with those observed in ref. 16 and 17 for the “delayed” fragments NH4(NH3)n. If David15 is right that fragmentation of the clusters PyH(NH3)n with n > 2 occurs within 10–30 ps, our “instantaneous” fragments might well be formed by absorption of a 226 nm photon, followed by dissociation, and subsequent ionization by a second 226 nm photon from the same laser pulse. They would then correspond to the “delayed” fragments observed by Rubio Lago16 and Rodriguez.17 This is plausible if ionization of the excited complex is slower than dissociation. Perhaps we do not see these ions in the delayed ionization if the ionization cross section at 266 nm is much smaller than at 226 and 333 nm. However, we do see ions of ND4 both as instantaneous and delayed signals, but with different velocity distributions.
Since all velocity distributions observed for ND4(ND3)n=0–4 are broad and are well fit by Maxwell–Boltzmann distributions the possibility of a long-lived intermediate should be reconsidered. Such a mechanism has, e.g., been observed for excited HBr clusters.57 Within the harmonic approximation the vibrational energy of a molecule at a temperature T can be calculated as
 | (8) |
![[thin space (1/6-em)]](https://www.rsc.org/images/entities/char_2009.gif) :
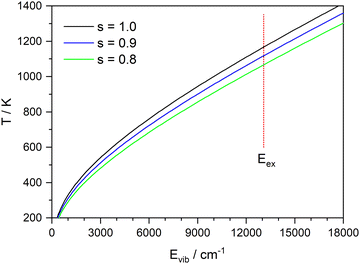
:![[thin space (1/6-em)]](https://www.rsc.org/images/entities/char_2009.gif) 1 complex as a model (corresponding to x = 0 in Fig. 9), the vibrational frequencies were calculated on the CASSCF(8|7)/cc-pVTZ(+) level. Fig. 11 shows the inverted function T(E) for these frequencies, and with all frequencies scaled by a factor of 0.9 and 0.8. A value of 0.9 is frequently used for vibrational frequencies calculated with CASSCF. The value of 0.8 is just a guess that might account for the increasing effect of the anharmonicity at higher temperatures. From the calculated dissociation energy (30
1 complex as a model (corresponding to x = 0 in Fig. 9), the vibrational frequencies were calculated on the CASSCF(8|7)/cc-pVTZ(+) level. Fig. 11 shows the inverted function T(E) for these frequencies, and with all frequencies scaled by a factor of 0.9 and 0.8. A value of 0.9 is frequently used for vibrational frequencies calculated with CASSCF. The value of 0.8 is just a guess that might account for the increasing effect of the anharmonicity at higher temperatures. From the calculated dissociation energy (30![[thin space (1/6-em)]](https://www.rsc.org/images/entities/char_2009.gif) 436 cm−1), the measured kinetic energy of both fragments (730 cm−1) and the photon energy (44
436 cm−1), the measured kinetic energy of both fragments (730 cm−1) and the photon energy (44![[thin space (1/6-em)]](https://www.rsc.org/images/entities/char_2009.gif) 250 cm−1) we estimate a maximum vibrational energy in the hot complex of 13
250 cm−1) we estimate a maximum vibrational energy in the hot complex of 13![[thin space (1/6-em)]](https://www.rsc.org/images/entities/char_2009.gif) 080 cm−1. This would lead to a temperature of 1090 K (see dotted line in Fig. 11). Although these estimates are rather crude, it seems possible that thermal equilibration in the electronically excited complex could account for the observed MBDs, in particular, if not all vibrational modes participate in IVR on this time scale. It has been observed before for Py–H that increasing excess energy does not lead to increased kinetic energy of the dissociation,6 indicating that the excess energy remains mainly in the Py fragment. Also, vibrational excitation of the N–H bond of Py–H remains in this vibration for more than 100 ps without IVR to other modes.58
080 cm−1. This would lead to a temperature of 1090 K (see dotted line in Fig. 11). Although these estimates are rather crude, it seems possible that thermal equilibration in the electronically excited complex could account for the observed MBDs, in particular, if not all vibrational modes participate in IVR on this time scale. It has been observed before for Py–H that increasing excess energy does not lead to increased kinetic energy of the dissociation,6 indicating that the excess energy remains mainly in the Py fragment. Also, vibrational excitation of the N–H bond of Py–H remains in this vibration for more than 100 ps without IVR to other modes.58
This interpretation requires a long lifetime of the excited complex, of the order of many vibrational periods. We should, however, remember that at the global minimum of the S1 state the corresponding T1 state is, according to the CASSCF(8|7)/cc-pVTZ(+) calculation, only 8 cm−1 lower in energy. Hence ISC from S1 to T1 should be possible, which can prevent back-transfer of the H atom. This does still not explain why the system needs so long to leave the shallow minimum on the S1 PES.
The 1![[thin space (1/6-em)]](https://www.rsc.org/images/entities/h3_char_2009.gif) :
:![[thin space (1/6-em)]](https://www.rsc.org/images/entities/h3_char_2009.gif) 1 complex
1 complex
ND4 is the only isotopomer of NH4 that shows a signal in the delayed ionization experiment. All other isotopomers dissociate a H atom by tunneling. It is hence reasonable to assign the excess “instantaneous” as well as the delayed signal of ND4 to a process that is hindered by tunneling in the other isotopomers. This process obviously is ionization of the neutral ammonium radical ND4.
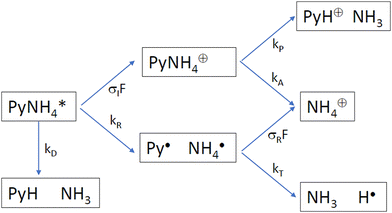
Which process is responsible for the “instantaneous” signals of the partially deuterated species produced with 226 nm excitation? We consider the following kinetic scheme (Scheme 2):
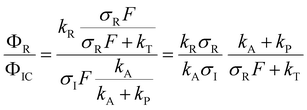
After excitation to the S1 state, the excited complex can either dissociate into the radicals Py and NH4 with rate constant kR, or absorb a further photon with rate constant σIF, where σI is the ionization cross section and F the photon flux. The NH4 radical can either dissociate by tunneling with rate kT, or be ionized with rate constant σRF. In the alternative route, the ionized complex can dissociate leaving the positive charge either on the pyrrole unit (rate constant kP) or on the ammonia unit (rate constant kA). The ratio of the radical route (R) and ionized complex (IC) route to the yield of ammonium cations in this model is:
The quantum chemical calculations strongly favor the positive charge on the pyrrole in the dissociation of the ionized complex, i.e. kA ≪ kP. Apparently, then, kR cannot be much larger than σIF. This would indicate a rather slow (kR < 109 s−1) rate of dissociation of the excited complex into radicals.
In other words, if the excited complex would dissociate into the radicals Py and NH4 within a few ps, we should not be able to see the instantaneous signal of NH4: the excited complex dissociates too quickly to be ionized, and the NH4 radicals cannot be detected since they decay faster by tunneling than they can be ionized. We must then conclude that the dissociation of the excited 1![[thin space (1/6-em)]](https://www.rsc.org/images/entities/char_2009.gif) :
:![[thin space (1/6-em)]](https://www.rsc.org/images/entities/char_2009.gif) 1 complex of pyrrole and ammonia occurs on a time scale that allows for thermalization of the excess energy prior to dissociation.
1 complex of pyrrole and ammonia occurs on a time scale that allows for thermalization of the excess energy prior to dissociation.
Conclusions
We have revisited the photodissociation of the pyrrole–ammonia complexes PyH*(NH3)n with n up to 5, for the first time including also the 1![[thin space (1/6-em)]](https://www.rsc.org/images/entities/char_2009.gif) :
:![[thin space (1/6-em)]](https://www.rsc.org/images/entities/char_2009.gif) 1 complex. The dissociation into a neutral pyrrolyl radical and a neutral ammonium radical was observed. This was made possible by using full deuteration of all hydrogen–nitrogen bonds, thus enlarging the lifetime of the NH4 radical from ca. 13 ps to several μs in the ND4 radical.
1 complex. The dissociation into a neutral pyrrolyl radical and a neutral ammonium radical was observed. This was made possible by using full deuteration of all hydrogen–nitrogen bonds, thus enlarging the lifetime of the NH4 radical from ca. 13 ps to several μs in the ND4 radical.
The composition of the seeded molecular beam was characterized by one-photon ionization with 118 nm photons in a linear time-of-flight apparatus. The ammonia concentration was adjusted in order to maximize the yield of the 1![[thin space (1/6-em)]](https://www.rsc.org/images/entities/char_2009.gif) :
:![[thin space (1/6-em)]](https://www.rsc.org/images/entities/char_2009.gif) 1 complex between pyrrole and ammonia.
1 complex between pyrrole and ammonia.
The velocity distribution of the ND4 radical is well described by a Maxwell–Boltzmann distribution with a mean velocity of 715 m s−1, corresponding to a temperature of 532 K and an average kinetic energy of 68 meV. Whereas the energy is in very good agreement with the value expected from the impulsive model (ca. 73 meV), the perfect agreement with the Maxwell–Boltzmann distribution requires thermal equilibration. We conclude that dissociation of the excited 1![[thin space (1/6-em)]](https://www.rsc.org/images/entities/char_2009.gif) :
:![[thin space (1/6-em)]](https://www.rsc.org/images/entities/char_2009.gif) 1 complex occurs on a time scale much slower than vibrational redistribution. This is confirmed by the observation of partially deuterated ammonium ions following two-photon excitation of the 1
1 complex occurs on a time scale much slower than vibrational redistribution. This is confirmed by the observation of partially deuterated ammonium ions following two-photon excitation of the 1![[thin space (1/6-em)]](https://www.rsc.org/images/entities/char_2009.gif) :
:![[thin space (1/6-em)]](https://www.rsc.org/images/entities/char_2009.gif) 1 complex: these can not originate from neutral radicals, otherwise the signal of the deuterated ammonium ion should be larger than that of the partially deuterated ones by the ratio of the laser pulse width to the tunneling lifetime, i.e. by a factor of ca. 300. Therefore, the partially deuterated ammonium ions must originate from dissociation of the ionized 1
1 complex: these can not originate from neutral radicals, otherwise the signal of the deuterated ammonium ion should be larger than that of the partially deuterated ones by the ratio of the laser pulse width to the tunneling lifetime, i.e. by a factor of ca. 300. Therefore, the partially deuterated ammonium ions must originate from dissociation of the ionized 1![[thin space (1/6-em)]](https://www.rsc.org/images/entities/char_2009.gif) :
:![[thin space (1/6-em)]](https://www.rsc.org/images/entities/char_2009.gif) 1 complex. This in turn requires a long lifetime of the excited complex, possibly of more than 100 ps.
1 complex. This in turn requires a long lifetime of the excited complex, possibly of more than 100 ps.
Quantum chemical calculations show that the lowest triplet state of the 1![[thin space (1/6-em)]](https://www.rsc.org/images/entities/char_2009.gif) :
:![[thin space (1/6-em)]](https://www.rsc.org/images/entities/char_2009.gif) 1 complex is almost degenerate with the lowest excited singlet state along the hydrogen transfer coordinate as well as the dissociation coordinate. Hence very small spin–orbit coupling could bring the system into this triplet state, perhaps explaining the long lifetime.
1 complex is almost degenerate with the lowest excited singlet state along the hydrogen transfer coordinate as well as the dissociation coordinate. Hence very small spin–orbit coupling could bring the system into this triplet state, perhaps explaining the long lifetime.
The quantum chemical calculations indicate that the excited state has substantial charge transfer character: the dipole moment of 4.25 D at the optimized S0 ground state increases to 7.45 D upon vertical excitation. It increases further to 9.91 D when the system moves to the local minimum on the S1 surface. This corresponds to substantial shortening of the N–N distance. After the hydrogen atom has moved to the ammonia–nitrogen, the dipole moment decreases somewhat to 7.14 D at the global minimum of the S1 state. Finally, after dissociation of the ammonium radical is complete, the dipole moment is 2.81 D, corresponding to that of the pyrrolyl radical.
It remains to find an explanation for the good agreement of the average kinetic energy of the ammonium fragment with the value predicted from the impulsive model. Is it possible that the momentum transfer of the dissociating hydrogen atom to the ammonium unit is somehow conserved during vibrational redistribution? Perhaps quantum dynamical calculations can give an answer.
Conflicts of interest
There are no conflicts of interest to declare.Acknowledgements
We dedicate this article to the memory of Dr. Uwe Kensy. He designed and built most of the TOF and VMI machines in our lab. He passed away much too young on May 16, 2019.References
- S. Matsika and P. Krause, Annu. Rev. Phys. Chem., 2011, 62, 621–643 CrossRef CAS PubMed
.
- A. L. Sobolewski, W. Domcke, C. Dedonder-Lardeux and C. Jouvet, Phys. Chem. Chem. Phys., 2002, 4, 1093–1100 RSC
.
- D. A. Blank, S. W. North and Y. T. Lee, Chem. Phys., 1994, 187, 35–47 CrossRef CAS
.
- J. Wei, A. Kuczmann, J. Riedel, F. Renth and F. Temps, Phys. Chem. Chem. Phys., 2003, 5, 315–320 RSC
.
- J. Wei, J. Riedel, A. Kuczmann, F. Renth and F. Temps, Faraday Discuss., 2004, 127, 267–282 RSC
.
- B. Cronin, M. G. D. Nix, R. H. Qadiri and M. N. R. Ashfold, Phys. Chem. Chem. Phys., 2004, 6, 5031 RSC
.
- M. N. R. Ashfold, G. A. King, D. Murdock, M. G. D. Nix, T. A. A. Oliver and A. G. Sage, Phys. Chem. Chem. Phys., 2010, 12, 1218–1238 RSC
.
- L. Rubio-Lago, D. Zaouris, Y. Sakellariou, D. Sofikitis, T. N. Kitsopoulos, F. Wang, X. Yang, B. Cronin, A. L. Devine, G. A. King, M. G. D. Nix, M. N. R. Ashfold and S. S. Xantheas, J. Chem. Phys., 2007, 127, 064306 CrossRef CAS PubMed
.
- M. L. Lipciuc, F. Wang, X. Yang, T. N. Kitsopoulos, G. S. Fanourgakis and S. S. Xantheas, ChemPhysChem, 2008, 9, 1838–1841 CrossRef CAS PubMed
.
- V. Poterya, V. Profant, M. Fárník, P. Slavícek and U. Buck, J. Chem. Phys., 2007, 127, 064307 CrossRef PubMed
.
- P. Slavíček and M. Fárník, Phys. Chem. Chem. Phys., 2011, 13, 12123–12137 RSC
.
- A. Kumar, M. Kołaski and K. S. Kim, J. Chem. Phys., 2008, 128, 034304 CrossRef PubMed
.
- I. Frank and K. Damianos, Chem. Phys., 2008, 343, 347–352 CrossRef CAS
.
- J. R. Reimers and Z. L. Cai, Phys. Chem. Chem. Phys., 2012, 14, 8791–8802 RSC
.
- O. David, C. Dedonder-Lardeux, C. Jouvet, H. Kang, S. Martrenchard, T. Ebata and A. L. Sobolewski, J. Chem. Phys., 2004, 120, 10101–10110 CrossRef CAS PubMed
.
- L. Rubio-Lago, G. A. Amaral, A. N. Oldani, J. D. Rodríguez, M. G. González, G. A. Pino and L. Bañares, Phys. Chem. Chem. Phys., 2011, 13, 1082–1091 RSC
.
- J. D. Rodríguez, M. G. González, L. Rubio-Lago and L. Bañares, J. Chem. Phys., 2012, 137, 094305 CrossRef PubMed
.
- G. A. Pino, C. Dedonder-Lardeux, G. Grégoire, C. Jouvet, S. Martrenchard and D. Solgadi, J. Chem. Phys., 1999, 111, 10747–10749 CrossRef CAS
.
- G. Pino, G. Gregoire, C. Dedonder-Lardeux, C. Jouvet, S. Martrenchard and D. Solgadi, Phys. Chem. Chem. Phys., 2000, 2, 893–900 RSC
.
- K. Fuke and R. Takasu, Bull. Chem. Soc. Jpn., 1995, 68, 3309–3318 CrossRef CAS
.
- K. Fuke, R. Takasu and F. Misaizu, Chem. Phys. Lett., 1994, 229, 597–603 CrossRef CAS
.
- G. I. Gellene and R. F. Porter, J. Phys. Chem., 1984, 88, 6680–6684 CrossRef CAS
.
- U. Even, EPJ Techniques Instrumentation, 2015, 2, 1–22 CrossRef PubMed
.
- U. Even, J. Jortner, D. Noy, N. Lavie and C. Cossart-Magos, J. Chem. Phys., 2000, 112, 8068–8071 CrossRef CAS
.
- U. Even and B. Dick, Rev. Sci. Instrum., 2000, 71, 4421 CrossRef CAS
.
- U. Even and B. Dick, Rev. Sci. Instrum., 2000, 71, 4415–4420 CrossRef CAS
.
- A. H. Kung, J. F. Young and S. E. Harris, Appl. Phys. Lett., 1973, 22, 301–302 CrossRef CAS
.
- R. Mahon, T. McIlrath, V. Myerscough and D. Koopman, IEEE J. Quantum Electron., 1979, 15, 444–451 CrossRef
.
- A. M. Wenge, U. Kensy and B. Dick, Phys. Chem. Chem. Phys., 2010, 12, 4644–4655 RSC
.
- A. M. Wenge, A. Schmaunz, U. Kensy and B. Dick, Phys. Chem. Chem. Phys., 2012, 14, 7076–7089 RSC
.
- I. Wilkinson, M. P. D. Miranda and B. J. Whitaker, J. Chem. Phys., 2009, 131, 054308 CrossRef PubMed
.
- R. Jost, J. Nygård, A. Pasinski and A. Delon, J. Chem. Phys., 1996, 105, 1287–1290 CrossRef CAS
.
- Ammonia, https://webbook.nist.gov/cgi/cbook.cgi?ID=C7664417&Mask=20#Ion-Energetics, (accessed 09.12.2021).
- A. J. van den Brom, M. Kapelios, T. N. Kitsopoulos, N. H. Nahler, B. Cronin and M. N. R. Ashfold, Phys. Chem. Chem. Phys., 2005, 7, 892–899 RSC
.
- P. J. Derrick, L. Åsbrink, O. Edqvist, B.-Ö. Jonsson and E. Lindholm, Int. J. Mass Spectrometry Ion Phys., 1971, 6, 161–175 CrossRef CAS
.
- J. S. Dewar, A. J. Harget, N. Trinajstić and S. D. Worley, Tetrahedron, 1970, 26, 4505–4516 CrossRef
.
- A. D. Baker, D. Betteridge, N. R. Kemp and R. E. Kirby, Anal. Chem., 1970, 42, 1064–1073 CrossRef CAS PubMed
.
- G. D. Willett and T. Baer, J. Am. Chem. Soc., 1980, 102, 6774–6779 CrossRef CAS
.
- L. Klasinc, A. Sabljić, G. Kluge, J. Rieger and M. Scholz, J. Chem. Soc., Perkin Trans. 2, 1982, 539–543, 10.1039/p29820000539
.
- H. Shinohara, N. Nishi and N. Washida, Chem. Phys. Lett., 1984, 106, 302–306 CrossRef CAS
.
- F. Dong, S. Heinbuch, J. J. Rocca and E. R. Bernstein, J. Chem. Phys., 2006, 124, 224319 CrossRef CAS PubMed
.
- H. Lippert, H.-H. Ritze, I. V. Hertela and W. Radloff, ChemPhysChem, 2004, 5, 1423–1427 CrossRef CAS PubMed
.
- G. M. Roberts, C. A. Williams, H. Yu, A. S. Chatterley, J. D. Young, S. Ullrich and V. G. Stavros, Faraday Discussions, 2013, 163, 95–116 RSC
; discussion 117-138.
- Y. Hu, R. Lu, Y. Cai and X. Wang, J. Mass Spectrom., 2001, 36, 329–335 CrossRef CAS
.
- B. Dick, Phys. Chem. Chem. Phys., 2014, 16, 570–580 RSC
.
- B. Dick, Phys. Chem. Chem. Phys., 2019, 21, 19499–19512 RSC
.
- A. Iqbal, M. S. Y. Cheung, M. G. D. Nix and V. G. Stavros, J. Phys. Chem. A, 2009, 113, 8157–8163 CrossRef CAS PubMed
.
- S. Zilberg, A. Kahan and Y. Haas, Phys. Chem. Chem. Phys., 2012, 14, 8836–8841 RSC
.
- S. Zilberg and Y. Haas, J. Phys. Chem. A, 2012, 116, 11111–11117 CrossRef CAS PubMed
.
- C. Angeli, R. Cimiraglia, S. Evangelisti, T. Leininger and J. P. Malrieu, J. Chem. Phys., 2001, 114, 10252–10264 CrossRef CAS
.
- F. Neese, F. Wennmohs, U. Becker and C. Riplinger, J. Chem. Phys., 2020, 152, 224108 CrossRef CAS PubMed
.
- F. Neese, Wiley Interdiscip. Rev.: Comput. Mol. Sci., 2022, 12, e1606 Search PubMed
.
- A. A. Granovsky, Firefly version 8, www (https://classic.chem.msu.su/gran/firefly/index.html).
- M. W. Schmidt, K. K. Baldridge, J. A. Boatz, S. T. Elbert, M. S. Gordon, J. H. Jensen, S. Koseki, N. Matsunaga, K. A. Nguyen, S. Su, T. L. Windus, M. Dupuis and J. A. Montgomery, J. Comput. Chem., 1993, 14, 1347–1363 CrossRef CAS
.
- A. A. Granovsky, J. Chem. Phys., 2011, 134, 214113 CrossRef PubMed
.
- B. Cronin, A. L. Devine, M. G. D. Nix and M. N. R. Ashfold, Phys. Chem. Chem. Phys., 2006, 8, 3440–3445 RSC
.
- K. Grygoryeva, J. Rakovský, O. Votava and M. Fárník, J. Chem. Phys., 2018, 149, 094303 CrossRef CAS PubMed
.
- K. Grygoryeva, J. Rakovský, I. S. Vinklárek, O. Votava, M. Fárník and V. Poterya, AIP Adv., 2019, 9, 035151 CrossRef
.
Footnote |
| † Electronic supplementary information (ESI) available. See DOI: https://doi.org/10.1039/d4cp00566j |
| This journal is © the Owner Societies 2024 |

