Functional group polarity-modulated formation of liquid crystals of amphiphilic cyclodextrins†
Austin
Che
a,
Carson O.
Zellman
b,
Diganta
Sarkar
 c,
Simon
Trudel-Lachance
a,
Jayar
Espejo
a,
Vladimir K.
Michaelis
*c,
Vance E.
Williams
*b and
Chang-Chun
Ling
 *a
*a
aDepartment of Chemistry, University of Calgary, Calgary, Alberta T2N 1N4, Canada. E-mail: ccling@ucalgary.ca; Fax: +1(403)-289-9488; Tel: +1(403)-220-2768
bDepartment of Chemistry, Simon Fraser University, Burnaby, BC V5A 1S6, Canada. E-mail: vancew@sfu.ca; Fax: +1(778)-782-3765; Tel: +1(778)-782-8059
cDepartment of Chemistry, University of Alberta, Edmonton, Alberta T6G 2G2, Canada. E-mail: vmichael@ualberta.ca; Fax: +1(780)-492-8231; Tel: +1(780)-248-5893
First published on 6th March 2023
Abstract
Cyclodextrins (CDs) constitute a unique class of D-glucose-based macrocycles that possess a truncated cone-shaped central cavity. They are non-toxic and biodegradable. The presence of pseudo face-to-face symmetry in the native CDs represents a distinctive advantage to design amphiphilic materials capable of self-assembly into liquid crystals. In this work, a new family of amphiphilic β-CD derivatives possessing 14 stearoyl chains (non-polar) and 7 functionalized tetraethylene glycols were synthesized using an improved design and more efficient chemistry, and the synthetic targets showed excellent ability to form stable hexagonal columnar mesophases over wide temperature ranges. We demonstrated that the polarity and sizes of introduced functional groups can further affect the temperature ranges of formed LC phases. Moreover, variable temperature solid-state nuclear magnetic resonance spectroscopy studies of a lithium composite with compound 2 revealed fast local Li-ion exchange processes with very low activation energies, suggesting the benefit of using these materials as potential electrolytes for high ionic conductions. The results from this work can provide guidance for the design of future generations of CD-based LC materials for ion conduction.
Introduction
Liquid crystals (LCs) are characterized by the presence of ordered molecules in liquid states. These materials have revolutionized the worldwide information and display1 industries during the last several decades and they have also found many applications in other fields such as biosensors,2,3 proton and ion conductions4–12 and pharmaceutical industries.13,14Cyclodextrins (CDs) constitute a class of unique macrocycles formed by 6–8 D-glucose units in the α-pyranose form.15 They are readily available at industrial scales and are biodegradable because of their α-(1,4)-glycosidic linkages. The CD macrocycles adopt a unique frustum shape of different diameters, with a hydrophobic cavity located at the centre. β-CD is the most common member of the family that consists of 7 units of D-glucose. In native CDs, all primary hydroxyl groups (attached to C-6 positions of D-glucoses) are found at the narrower face of the macrocycle – commonly known as the primary face, and all secondary hydroxyl groups (attached to C-2 and C-3 positions of D-glucoses) are located at the wider face – commonly known as the secondary face. The presence of polar functionalities at the different faces of CDs confers to all native CDs a special type of symmetry – face to face pseudo symmetry. The segregation of primary and secondary hydroxyl groups at different faces of the macrocycles provides a distinctive advantage compared to other types of supramolecular scaffolds, as regioselective chemical modifications can be achieved by taking advantage of the large difference in chemical reactivity between the primary and secondary hydroxyl groups; thus sequential introduction of chemical functionalities of different properties to the two faces of CDs can be achieved to afford novel materials capable of self-assembly. Examples of such materials are amphiphilic CDs which have already found widespread applications in drug formulations,16 gene delivery17 and others;18 they are also found to form LCs.19 CD-based LCs were reported in 1993 by a simple per-functionalization of the primary face of β-CD with alkylthio groups of different lengths to form amphiphilic materials.20 However, CD-based LC materials have only started to draw interest from the research community during the past decade.21–27 Amphiphilic CD materials formed via the modification of primary face with long aliphatic chains were observed to form a smectic LC mesophase, as the presence of numerous well-organized hydroxyl groups at the secondary face drives the molecule to self-assemble via a complex network of very strong hydrogen-bonding between two opposing amphiphilic CDs; these materials commonly displayed high clearing temperatures.20,26 Chen et al.24 introduced the well-known 4-methoxybiphenyl mesogenic group to the end of each aliphatic chain at the primary face of β-CD to form another group of amphiphilic molecules that self-assemble via not only the above mentioned hydrogen-bonding network but also the π–π stacking of the 4-methoxybiphenyl groups. Interestingly, these amphiphilic CDs initially form smectic mesophase but transitioned slowly into nematic mesophase before completely melting to an isotropic liquid.
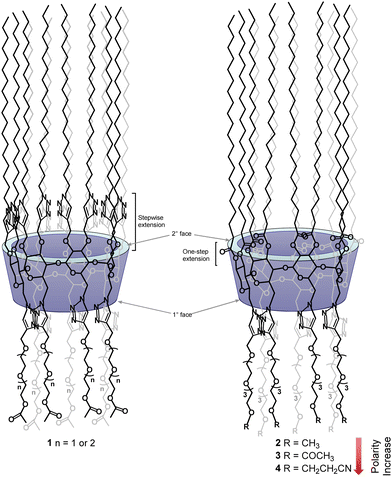
To eliminate the involvement of hydrogen-bonding networks and to take advantage of dipole–dipole intermolecular forces, our lab has reported another group of amphiphilic CDs by introducing O-acetyl-functionalized oligoethylene glycol (OEG) groups of different lengths to the secondary face of per-6-alkylthio-2,3-O-propargyl-functionalized β-CDs, via copper(I)-catalyzed azide–alkyne [3+2]-cycloaddition, and we observed that these derivatives possess excellent LC properties to also form smectic mesophases, but with lower clearing temperatures.27 By exploiting the presence of intrinsic long-range orders in smectic mesophases, we have reported other functionalized CD derivatives that showed potential to be used as electrolytes for proton and lithium conduction.21,22 Interestingly, when the substitution patterns of above OEG-functionalized amphiphilic CDs were inverted between the primary and secondary face, we obtained another series of amphiphilic CDs (1, Fig. 1) which surprisingly formed hexagonal columnar mesophases.28
One major challenge encountered in our previous synthesis is to introduce 14 long aliphatic alkyl groups (>12 carbons) to the secondary face via ether linkages; unfortunately, due to the low reactivity of these n-alkyl halides and a significantly increased steric crowdedness present at the secondary face of β-CD, the direct per-2,3-O-alkylation is extremely challenging for introducing long alkyl groups. In fact, this reaction can only afford the corresponding per-2,3-O-alkylated β-CD derivatives with shorter alkyl chain lengths (<C12) in useful yield.29–31 We overcame this issue by first introducing fourteen propargyl groups to all the O2 and O3 positions as above, and subsequently extended chain lengths using copper(I)-mediated azide–alkyne cycloaddition by the reaction with an n-alkyl azide.28,32 Although this indirect approach successfully allowed us to prepare the desired targets (1), the syntheses were laborious, thus it was difficult to obtain the desired targets in large amounts. In this work we report the efficient synthesis of a novel class of per-2,3-O-esterified β-CD derivatives bearing fourteen long stearoyl chains (C18, apolar) at the secondary face and seven functionalized tetraethylene glycol chains (polar) at the primary face. These easily obtained derivatives have shown great capability to form stable hexagonal columnar mesophases. The per-2,3-O-esterified β-CD derivatives have not been reported to form LCs yet in the literature unless a traditional mesogenic group is attached.25 Furthermore, we demonstrate that the stability of formed LC mesophases can be effectively modulated by the nature of functional groups introduced at the end of tetraethylene glycol chains (2–4, Fig. 1). Thus, this work illustrates an efficient strategy to fine-tune the LC properties of CD-based materials. Moreover, solid-state nuclear magnetic resonance (NMR) spectroscopy studies on the lithium composite with compound 2 revealed a fast local Li-ion exchange processes and very low activation energies, suggesting the great potential of using these materials as electrolytes for high ionic conductions.
Results and discussion
Synthesis and characterization
The desired targets 2–4 were synthesized according to Scheme 1. The per-6-azido-6-deoxy-β-CD (6)29 starting material was synthesized by a direct substitution with sodium azide from the corresponding per-6-bromide (5) in N,N-dimethylformamide (DMF) at 70 °C for 24 hours. To carry out the per-2,3-O-esterification of β-CD derivatives (9),33,34 we first converted stearic acid (7) to the corresponding stearic anhydride (8) by a treatment of stearic acid with N,N′-dicyclohexylcarbodiimide (DCC, 0.5 equiv.) in anhydrous toluene at 70 °C; the obtained crude anhydride was then subjected to a reaction with per-6-azide (6) (1.5 equiv. anhydride per OH) in the same solvent at 70 °C using 4-N,N-dimethylpyridine as a base;35,36 after 22 hours, the desired compound (9) was isolated in almost quantitative yield and in gram quantities. The per-2,3-O-substitution was confirmed by the 1H NMR spectrum of the isolated compound (9) that showed a doublet at 5.08 ppm (J = 3.8 Hz) and two sets of doublet of doublets at 5.32 ppm (J = 9.4, 9.4 Hz) and 4.81 ppm (J = 3.8, 10.1 Hz), which are respectively assigned to be the anomeric H-1, H-3 and H-2 protons of all α-glucopyranosyl units.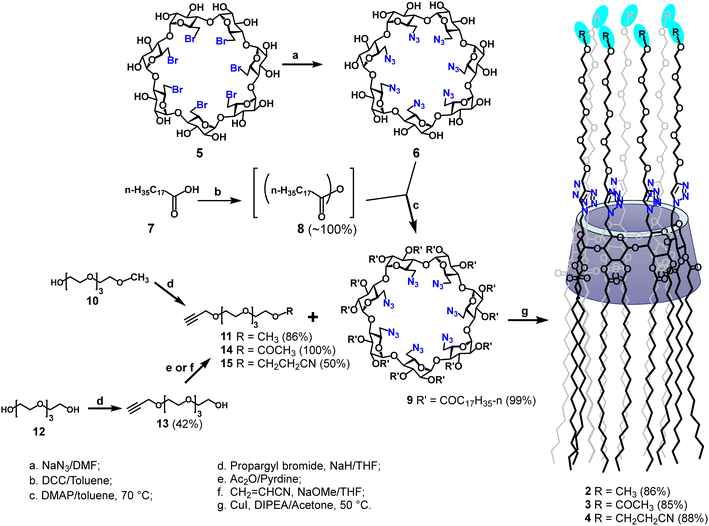 | ||
| Scheme 1 Synthetic route to amphiphilic β-CD targets 2–4 bearing 14 O-octadecanoyl groups at the secondary face and 7 terminally functionalized tetraethylene glycol groups at the primary face. | ||
To obtain O-monopropargylated tetraethylene glycol derivatives 11, 14 and 15, the commercial O-monomethyl tetraethylene glycol (10) was subjected to an O-alkylation with propargyl bromide in anhydrous tetrahydrofuran using sodium hydride as a base to afford the corresponding O-propargyl ether (11) in 86% yield. On the other hand, the O-monopropargyl-tetraethylene glycol (13), prepared by a regioselective O-monopropargylation of tetraethylene glycol (12),37 was either directly O-acetylated using acetic anhydride–pyridine, or subjected to a Michael addition with neat acrylonitrile using a catalytic amount of sodium methoxide to form respectively the desired key tetraethylene glycol intermediates 14 (∼100% yield) or 15 (50% yield). For the O-cyanoethylation of compound 13, it was found that the desired product 15 was formed cleaner using 0.9 equivalents of acrylonitrile per alcohol. Finally, to obtain the desired targets, the key β-CD per-6-azide 9 was first conjugated to the O-monomethyl tetraethylene glycol alkyne 11, under copper(I)-catalysed Huisgen [2+3] dipolar cycloaddition in the presence of N,N-diisopropylethylamine (DIPEA) in acetone; after heating at 55 °C for 72 h, the desired β-CD derivative 2 was isolated in 85% yield.
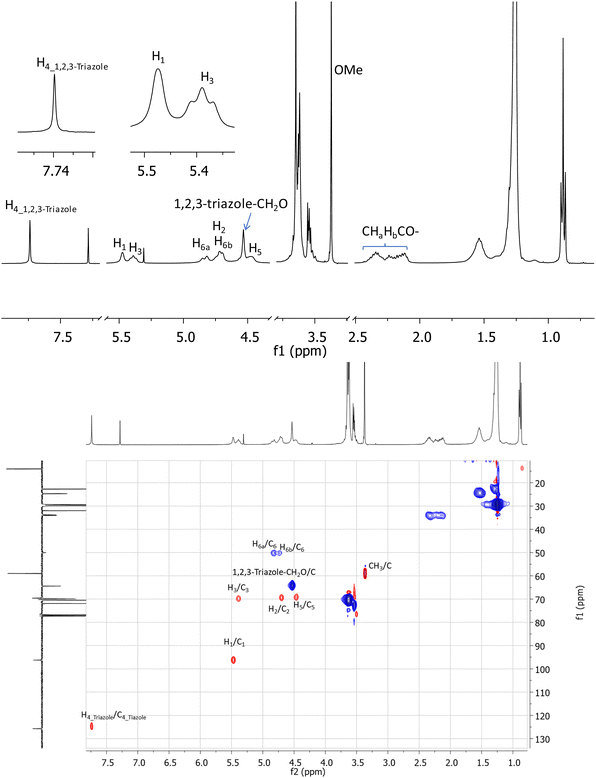
A key indication of successful coupling between the per-6-azide 9 and alkyne (11) is a singlet that is observed at 7.74 ppm in the 1H NMR spectrum of isolated compound 2 (Fig. 2, top), which corresponds to the newly formed 1,2,3-triazole functionalities. It is also confirmed (from 2D 1H–1H GCOSY) by the observation that all H-6a's and H-6b's of all D-glucopyranosyl units appear at a more deshielded region at 4.82 ppm and 4.73 ppm, due to the direct attachment of C-6 to a strongly deshielding aromatic 1,2,3-triazole ring. Additionally, all H-5 protons are observed at a more deshielded region (4.46 ppm), due to its proximity to the deshielding 1,2,3-triazole ring. Most proton signals appear to be broad, but the completeness in substitution was clearly confirmed by the observation of only one set of signals for each type of protons and by the symmetrical appearance of each set of signals. Additionally, in the acquired 1D 13C and 2D 1H–13C gHSQC spectra (Fig. 2, bottom), each type of carbons in the molecule appears only as a singlet. For example, the seven anomeric carbons of glucopyranosyl units were observed at 96.3 ppm as a single peak while all seven C-6's, methoxy groups, 1,2,3-triazoles C-4's were respectively observed in a similar manner at 50.1 ppm, 59.0 ppm and 125.7 ppm. Unfortunately, attempts to characterize the structure of compound 2 by high resolution mass spectrometry (HRMS) using electrospray ionization (positive) were unsuccessful, due to its large molecular weight and extremely hydrophobic nature. However, a MALDI-TOF mass spectrum (positive, low resolution) was obtained which confirmed a peak at m/z 6786.4 (100%) which correlates well to expected sodium adduct (C378H693N21O77Na, M + Na+) which has a calculated m/z at 6783.1 (6.6%) and 6787.1 (100%) based on its simulated isotope distributions.
In an analogous manner, the O-monoacetylated tetraethylene glycol alkyne 14 and O-monocyanoethyl-functionalized tetraethylene glycol alkyne 15 were respectively subjected to a coupling with compound 9 under the copper(I)-catalysed Huisgen [2+3] dipolar cycloaddition condition as above, to afford the desired target 3 and 4 in excellent yields (86% for 3 and 88% for 4). The two targets 3 and 4 were similarly characterized by 1D and 2D NMR experiments as above, and each product was additionally confirmed by MALDI-TOF mass spectrometry (see Experimental section).
Mesomorphic properties
The phase behaviour of the final amphiphilic CD derivatives 2–4 were examined by differential scanning calorimetry (DSC), polarized optical microscopy (POM), and X-ray diffraction (XRD). The details of these experiments are listed in the Methods section. All three amphiphilic compounds 2–4 possess two reversible transitions by DSC (see the ESI†). In all three cases, compounds exhibit a large enthalpy peak at low temperatures and a small enthalpy peak at higher temperatures. POM experiments indicate that these peaks correspond to the crystalline (Cr)-to-LC and a LC-to-isotropic liquid (Iso) transitions, respectively. Slow cooling the samples from the isotropic phase show the formation of fan-shaped (compound 2, Fig. 3(a)) or bâtonnet textures (compounds 3 and 4, Fig. 3(c and e)) with non-uniform birefringence. These features have been observed in other CD derivatives, including compounds 1,28 and are indicative of a columnar hexagonal (Colh) LC phase. The samples shear under mechanical stress but show minimal fluidity, consistent with the more viscous columnar phases. Compound 3 exhibits a small, irreversible transition shortly after the Cr-to-LC transition; due to its narrow range, we could not identify this phase by POM or XRD experiments, and thus assigned it as an unknown columnar phase (Colx).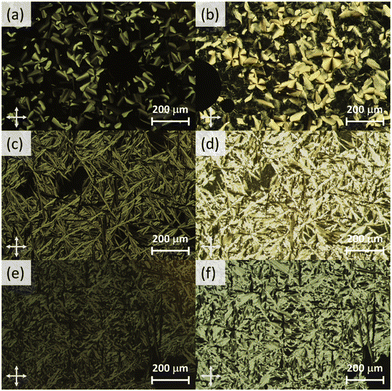 | ||
| Fig. 3 Cross-polarized optical micrographs of 2 at (a) 99 °C (Colh) and (b) 39 °C (Colh*), 3 at (c) 121 °C (Colh) and (d) 38 °C (Colh*), and 4 at (e) 158 °C (Colh) and (f) 41 °C (Colh*). | ||
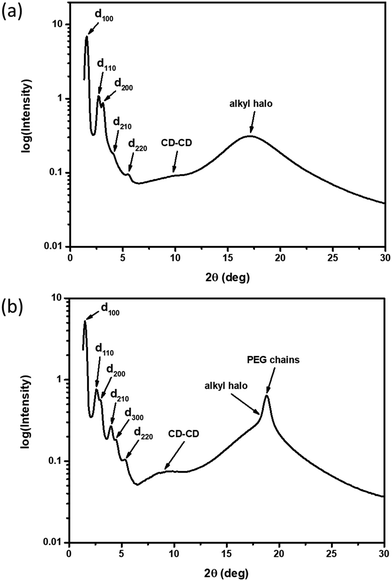
XRD samples below the isotropic phase for compounds 2–4 are consistent with Colh phases. As an example, Fig. 4(a) shows the X-ray diffractogram of compound 2 at 95 °C. One intense peak, indexed to the d100 plane, was observed along with four peaks of smaller intensity indexed to the d110, d200, d210, d220 planes of the hexagonal lattice. Two broad peaks are observed at higher angles, which are ascribed to the packing of the CD cores (9.0 Å) along the column and those of the molten alkyl chains (5.2 Å). As samples are cooled to room temperature on the microscope slide, domains become increasingly more birefringent (Fig. 3(b, d and f)) and nonfluid. The XRD of the room temperature phases (Fig. 4(b)) show retention of Colh ordering, but with additional diffraction peaks of the hexagonal lattice. In addition, a sharp peak appears at 4.7 Å, which likely corresponds to the ordering of the PEG chains. These additional features suggest the formation of a much more ordered Colh phase at low temperatures, which is supported by the large transition enthalpy observed by DSC. Compounds 3 and 4 showed very similar X-ray diffractograms (see ESI†). We thus conclude that compounds 2–4 form Colh LC phases at high temperatures, which then transition to a more ordered Colh plastic or soft crystalline phase (Colh*) below 60 °C.
The phase behaviour of all compounds is summarized in Table 1. As discussed previously, the only differences between compounds 2–4 are the terminal groups attached to the hydrophilic tetraethylene glycol chains: R = CH3 (2, methyl), R = COCH3 (3, acetyl), or R = CH2CH2CN (4, cyanoethyl). All three compounds melt from their plastic or semicrystalline phases into liquid crystal phases at 56 °C, indicating that the melting temperatures (Tm) are insensitive to the nature of the terminal groups. In contrast, the incorporated terminal groups clearly have a pronounced effect on the stability of the liquid crystalline phases, as the clearing temperatures range from 108–167 °C.
| Compound | Phasea | T/°C (ΔH/kJ mol−1)b | Phasea | T/°C (ΔH/kJ mol−1)b | Phasea | T/°C (ΔH/kJ mol−1)b | Phasea |
|---|---|---|---|---|---|---|---|
| a Phases identified by POM and vt-XRD experiments: Cr = crystalline, Colh = columnar hexagonal, Iso = isotropic, X = unknown, partially crystalline phase. b Transition temperatures and enthalpies were determined by DSC (scan rate = 10 °C min−1) on the first heating/cooling cycle. | |||||||
| 1 (n = 1) | Cr |

|
Colh |

|
Iso | ||
| 1 (n = 2) | Cr |

|
Colh |

|
Iso | ||
| 2 | Colh* |

|
Colh |

|
Iso | ||
| 3 | Colh* |

|
Colh |

|
Iso | ||
| 4 | Colh* |

|
Colh |

|
Iso | ||
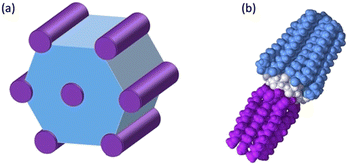
These results can be understood by considering the supramolecular organization of the Colh phases, which we anticipate will be similar to the previously reported compounds 1. Amphiphilic molecules typically self-assemble into nanostructured mesophases consisting of segregated hydrophilic and hydrophobic domains, with morphologies that are governed by the volume fractions (f) of the hydrophilic and hydrophobic components. In the case of Colhex ordering, the minor volume component forms cylindrical aggregates within a continuum of the major component (Fig. 5a);38–42 in compounds 2–4, the hydrophilic PEG chains are estimated to occupy approximately 25% (f = 0.25) of the total molecular volume (Fig. 5b), which would place them at the interior of the columns. The number of molecules per unit cell (Z) can be calculated from the relation  , where a and c are the unit cell parameters, M is molecular weight, NA is Avogadro's number and ρ is the density. Assuming the value of c is equal to the CD–CD peak observed between 9.0–9.3 Å and estimating the density at 1.0 g mol−1 affords a Z of approximately 3 molecules per unit cell for compounds 2–4.
In the above model, the terminal groups are confined in the centre of the column hydrophilic domains, where their size and dipoles are expected to strongly impact the packing and phase stability. Indeed, CD 2, which has both the shortest and least polar head group, has the lowest Tc, while 4, with the longest and most polar terminal group, has the highest Tc.
To quantify these effects, density functional theory (DFT)43 calculations were carried out on truncated model compounds CH3CH2-X, where X is the terminal group (–OCH3, –OCOCH3, and –OCH2CH2CN). The calculations were performed on ORCA (version 5.0.3)44 using the Grimme r2SCAN-3c functional with the mTZVPP basis set.45 These calculations indicate that Tc increases linearly with the dipole moment of the terminal group (Fig. 6(a)). The clearing temperature also increases with the length of the terminal group (Fig. 6(b)), albeit with a slightly poorer linear fit. We also note that the column–column distances (a) of the Colh phase increase from 65.7 Å (2), to 67.0 Å (3), to 67.9 Å (4), as the length of the terminal group increases from 4.4 Å to 5.7 Å to 7.1 Å, respectively.
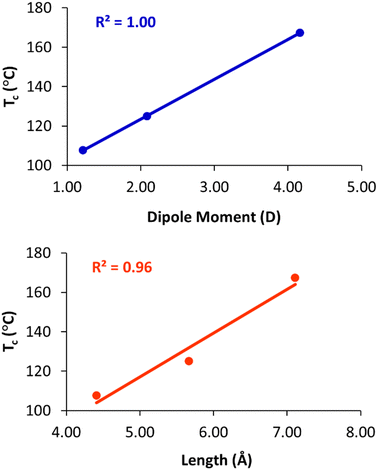 | ||
| Fig. 6 Plots of clearing temperature (Tc) versus dipole moment (top) and length of the terminal group (bottom). | ||
The nearly perfect correlation between clearing temperatures and dipole moment suggests that dipolar interactions between the terminal groups at the centre of the column are primarily responsible for the observed trends. The increase in Tc with the terminal group size may be coincidental, as group length and dipole moment are strongly correlated in the present series. However, we cannot rule out that increasing the length of the terminal group also contributes to stabilization of the phase, and, indeed, we have previously noted that clearing temperatures of closely related compounds 1 increase from 127 °C to 143 °C when the O-acetylated diethylene glycol chains are replaced with O-acetylated triethylene glycols.28
Solid-state NMR studies of compound 2 and its lithium composite
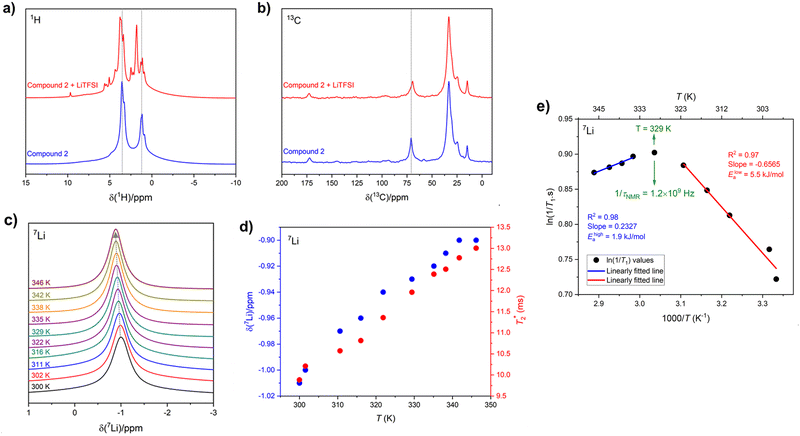
Solid-state 1H and 13C magic-angle spinning (MAS) NMR spectroscopy were performed on compound 2 using a composite of compound 2 + lithium bis(trifluoromethanesulfonyl)imide (LiTFSI) to assess structural changes in the hydrogen and carbon chemical environments upon the incorporation of Li. The 1H MAS NMR spectrum of compound 2 + LiTFSI reveals improved 1H resolution with sharper resonances appearing between 0 and 10 ppm after the Li addition, which were hidden in compound 2 due to the strong 1H–1H dipolar coupling. The sharper and more resolved resonances are suggestive of an increase in dynamics which assist in attenuating the strong 1H homonuclear dipolar coupling (Fig. 7a). The 13C{1H} cross polarization (CP) MAS NMR spectra of parent compound 2 and Li incorporated compound 2 + LiTFSI show nearly identical signals in the aliphatic region (0 and 90 ppm), except for the 13C peak at 70.9 ppm (compound 2) which showed a lower frequency shift to 69.5 ppm with decreased intensity and slight broadening caused by the addition of Li (Fig. 7b), supporting that the overall backbone structure does not change upon Li incorporation.The variable-temperature (VT, 300 to 346 K) 7Li MAS NMR was performed on compound 2 + LiTFSI, and a single sharp 7Li NMR resonance was observed throughout the temperature range examined (Fig. 7c). Closer examination shows a small isotropic chemical shift towards higher frequency (from −1.0 to −0.9 ppm) as the temperature increased (Fig. 7d). Furthermore, the 7Li NMR linewidth narrows (from 100 to 80 Hz) with the increase in temperature, which supports an increase in local Li-ion motion, reducing the residual dipolar coupling of neighbouring 1H and 7Li nuclear spins leading to an increase in the spin–spin lattice relaxation  (Fig. 7d).
To gain further insight into this Li-ion dynamics, variable temperature 7Li spin–lattice (T1) relaxometry was performed to assess the thermally activated regions. The spin–lattice relaxation (SLR) rates (1/T1) were plotted using an Arrhenius representation, i.e., loge(1/T1) is plotted against 1000/T, where T is the temperature in K (Fig. 7e). The SLR rates were recorded at a Larmor frequency of ω0/2π(7Li) = 194.42 MHz, and a characteristic diffusion-induced rate peak was observed with its maximum at T ≈ 329 K, where the mean jump rate (1/τNMR) of Li-ions is typically on the order of the angular Larmor frequency ω0 following the condition, ω0·τNMR ≈ 1.46 The calculated 1/τNMR (7Li) = 1.2 × 10⁹ Hz falls in the GHz regime, and such fast Li-ion exchange processes suggest high ionic conductivity or fast local Li-ion hopping. The low-temperature flank (ω0·τNMR ≫ 1) of the diffusion-induced rate peak is sensitive towards the local Li-ion hopping processes, and an activation energy (Elowa) of 5.5 kJ mol−1 was obtained from the slope of this regime, which is typically influenced by the correlation effects, such as structural disorder or Coulomb interactions.46 However, the high-tempertaure flank (ω0·τNMR ≪ 1) of the diffusion-induced rate peak gives rise to an activation energy (Ehigha) of 1.9 kJ mol−1 hinting to favourable long-range Li-ion conduction as the high-temperature side is influenced by the dimensionality of the ion diffusion process.46 Previously, we examined the activation energies from NMR on SmA and CrX phases, which were found to be higher than those reported here for the hexagonal columnar mesophases. The lower energy barrier for local lithium hopping in the hexagonal mesophase may prove to be beneficial for bulk conduction warranting further exploration.
Conclusion
In the present work, we reported a novel class of amphiphilic CD derivatives that can be effectively accessed with a much improved, scalable and expediated synthetic route by a polyesterification of all secondary hydroxyl groups of CD scaffolds. All synthesized compounds 2–4 form Colh phases with a wide temperature range; this illustrates the advantage and versatility of CD scaffolds to be used in the design of LC materials. We further demonstrated for the first time that the stability of the formed LC mesophases by amphiphilic CDs can be rationally tuned with the addition of terminal functional groups of different polarity and sizes to the hydrophilic region. The dipole moment of the introduced functionality has the most important and direct impact on the stability of the LC mesophase formed. These should contribute to a better understanding and guidance to the future design of CD-based LC materials. Solid-state NMR studies further revealed the potential utility of this class of materials as electrolytes for lithium-ion transport, evidenced by the observation of generally very low activation energies which could be correlated to the ability of conducting Li-ion over a long range in the LC mesophases.Experimental section
Methods
Solid-state NMR spectroscopy
The lithium composite of compound 2 was prepared by mixing compound 2 with LiTFSI in molar ratio of 1![[thin space (1/6-em)]](https://www.rsc.org/images/entities/char_2009.gif) :
:![[thin space (1/6-em)]](https://www.rsc.org/images/entities/char_2009.gif) 5 [LiTFSI
5 [LiTFSI![[thin space (1/6-em)]](https://www.rsc.org/images/entities/char_2009.gif) :
:![[thin space (1/6-em)]](https://www.rsc.org/images/entities/char_2009.gif) EO] in tetrahydrofuran. The solvent was then evaporated under reduced pressure and further dried under high vacuum to afford the sample for NMR studies.
EO] in tetrahydrofuran. The solvent was then evaporated under reduced pressure and further dried under high vacuum to afford the sample for NMR studies.
Solid-state 1H, 13C, and 7Li NMR measurements were performed at B0 = 11.75 T on a Bruker AVANCE NEO 500 NMR spectrometer equipped with a 4 mm double-resonance (H/X) Bruker magic-angle spinning (MAS) probe using an MAS frequency of 10 kHz. The samples were packed into 4 mm (outer diameter) zirconia rotors using Kel-F and Vespel caps for room temperature and variable-temperature (VT) measurements, respectively. All NMR spectra were processed using the Topspin 4.1.1 Bruker software and plotted using the Origin 2021 software.
Heptakis[6-azido-6-deoxy-2,3-di-O-octadecanoyl]cyclomaltoheptaose (9)
Stearic acid (7, 9.97 g, 35.04 mmol) was dissolved in anhydrous toluene (120 mL). DCC (3.61 g, 17.52 mmol) was added to the reaction flask and the reaction was stirred for 4 h under argon atmosphere at 70 °C. The solid precipitate was filtered off and the filtrate (containing 8) was reheated to 60 °C. Per-6-azido-β-CD (6, 1.0 g, 0.83 mmol) was added to the warm solution and the reaction was stirred for 22 h. The reaction flask was evaporated and redissolved in DCM (25 mL) before the addition of methanol (180 mL). The precipitate was centrifuged, and the liquid decanted. Precipitation and centrifugation were repeated twice to afford compound 9 as a light brown solid (3.8 g, 99%). Rf = 0.46 (EtOAc: Hexanes, 10![[thin space (1/6-em)]](https://www.rsc.org/images/entities/char_2009.gif) :
:![[thin space (1/6-em)]](https://www.rsc.org/images/entities/char_2009.gif) 90). [α]D25 + 45.2 (c 0.27, CHCl3). 1H NMR (CDCl3, 400 MHz): δ 5.32 (dd, J = 9.8, 9.8 Hz, 7H, 7 × H-3), 5.08 (d, J = 3.8 Hz, 7H, 7 × H-1), 4.81 (dd, J = 3.8, 10.1 Hz, 7H, 7 × H-2), 4.02 (m, 7H, 7 × H-5), 3.75–3.69 (m, 14H, 7 × H-4, 7 × H-6a), 3.64 (dd, J = 4.5, 13.8 Hz, 7H, 7 × H-6b), 2.45–2.12 (m, 28H, 14 × CH2COO), 1.76–1.48 (m, 28H, 14 × CH2CH2COO), 1.41–1.20 (m, 392H, 196 × CH2), 0.90 (t, J = 6.7 Hz, 42H, 14 × CH3). 13C NMR (101 MHz, CDCl3) δ 173.3, 171.8, 96.4, 70.8, 70.2, 70.1, 58.5, 53.4, 51.6, 34.1, 33.9, 32.0, 29.91, 29.89, 29.86, 29.82, 29.8, 29.7, 29.6, 29.5, 29.4, 29.3, 24.8, 24.76, 22.7, 14.1. LRMS (MALDI-TOF, positive) m/z calcd for C294H539N21O42Na (M + Na+): 5060.1 (15.6%) and 5063.1 (100%); found 5058.7 (100%).
90). [α]D25 + 45.2 (c 0.27, CHCl3). 1H NMR (CDCl3, 400 MHz): δ 5.32 (dd, J = 9.8, 9.8 Hz, 7H, 7 × H-3), 5.08 (d, J = 3.8 Hz, 7H, 7 × H-1), 4.81 (dd, J = 3.8, 10.1 Hz, 7H, 7 × H-2), 4.02 (m, 7H, 7 × H-5), 3.75–3.69 (m, 14H, 7 × H-4, 7 × H-6a), 3.64 (dd, J = 4.5, 13.8 Hz, 7H, 7 × H-6b), 2.45–2.12 (m, 28H, 14 × CH2COO), 1.76–1.48 (m, 28H, 14 × CH2CH2COO), 1.41–1.20 (m, 392H, 196 × CH2), 0.90 (t, J = 6.7 Hz, 42H, 14 × CH3). 13C NMR (101 MHz, CDCl3) δ 173.3, 171.8, 96.4, 70.8, 70.2, 70.1, 58.5, 53.4, 51.6, 34.1, 33.9, 32.0, 29.91, 29.89, 29.86, 29.82, 29.8, 29.7, 29.6, 29.5, 29.4, 29.3, 24.8, 24.76, 22.7, 14.1. LRMS (MALDI-TOF, positive) m/z calcd for C294H539N21O42Na (M + Na+): 5060.1 (15.6%) and 5063.1 (100%); found 5058.7 (100%).
2,5,8,11,14-Pentaoxaheptadec-16-yne (11)
Sodium hydride (60% in mineral oil, 0.38 g, 9.60 mmol) was added to a stirring solution of tetraethylene glycol monomethyl ether (10, 1.00 g, 4.80 mmol) in anhydrous THF (5.0 mL). Propargyl bromide (80 wt% in toluene, 2.14 mL, 19.21 mmol) was added after 20 minutes and the solution was stirred for 22 h. The solution was evaporated and purified by column chromatography on silica gel using a gradient of ethyl acetate – hexanes (10 → 60%) as the eluent to obtain 11 as a clear oil (1.02 g, 86%). Rf = 0.50 (EtOAc). 1H NMR (400 MHz, CDCl3) δ 4.21 (d, J = 2.4 Hz, 2H, OCH2C![[triple bond, length as m-dash]](https://www.rsc.org/images/entities/char_e002.gif) CH), 3.74–3.63 (m, 14H, 7 × OCH2), 3.58–3.54 (m, 2H, OCH2), 3.39 (s, 3H, H3CO), 2.44 (t, J = 2.4 Hz, 1H, HC
CH), 3.74–3.63 (m, 14H, 7 × OCH2), 3.58–3.54 (m, 2H, OCH2), 3.39 (s, 3H, H3CO), 2.44 (t, J = 2.4 Hz, 1H, HC![[triple bond, length as m-dash]](https://www.rsc.org/images/entities/char_e002.gif) C). 13C NMR (101 MHz, CDCl3) δ 79.7, 74.5, 72.0, 70.62, 70.59, 70.52, 70.4, 69.1, 59.0, 58.4. HRMS (ESI-QTOF, positive) m/z calcd for C12H22O5 (M + Na+): 269.1359; found 269.1371.
C). 13C NMR (101 MHz, CDCl3) δ 79.7, 74.5, 72.0, 70.62, 70.59, 70.52, 70.4, 69.1, 59.0, 58.4. HRMS (ESI-QTOF, positive) m/z calcd for C12H22O5 (M + Na+): 269.1359; found 269.1371.
3,6,9,12-Tetraoxapentadec-14-yn-1-ol (13)37
Sodium hydride (60% in mineral oil, 18.07 g, 0.45 mol) was added to a stirring solution of tetraethylene glycol (12, 73.14 g, 0.38 mol) in anhydrous THF (500 mL). Propargyl bromide (80 wt% in toluene, 63.9 mL, 0.56 mol) was added after 25 minutes and the solution was stirred overnight. The solution was evaporated and purified by column chromatography on silica gel using a gradient of ethyl acetate–hexanes (40 → 60%) to obtain compound 13 as a light-yellow oil (40.71 g, 47%). Rf = 0.27 (EtOAC). 1H NMR (CDCl3, 400 MHz): δ 4.22 (d, J = 2.5 Hz, 2H, OCH2C![[triple bond, length as m-dash]](https://www.rsc.org/images/entities/char_e002.gif) CH), 3.77–3.65 (m, 14H, 7 × OCH2), 3.65–3.60 (m, 2H, OCH2), 2.68 (br, 1H, OH), 2.45 (t, J = 2.6 Hz, 1H, HC
CH), 3.77–3.65 (m, 14H, 7 × OCH2), 3.65–3.60 (m, 2H, OCH2), 2.68 (br, 1H, OH), 2.45 (t, J = 2.6 Hz, 1H, HC![[triple bond, length as m-dash]](https://www.rsc.org/images/entities/char_e002.gif) C). 13C NMR (101 MHz, CDCl3) δ 79.6, 74.5, 72.6, 70.64, 70.59, 70.55, 70.41, 70.4, 69.1, 61.8, 58.4.
C). 13C NMR (101 MHz, CDCl3) δ 79.6, 74.5, 72.6, 70.64, 70.59, 70.55, 70.41, 70.4, 69.1, 61.8, 58.4.
3,6,9,12-Tetraoxapentadec-14-yn-1-yl acetate (14)
Compound 13 (3.0 g, 1.29 mmol) was stirred with acetic anhydride (0.24 mL, 2.58 mmol) and pyridine (0.20 mL, 2.58 mmol) for 24 h. The mixture was concentrated in vacuo then purified by column chromatography on silica gel using a mixture of ethyl acetate – hexanes (20%) to afford compound 14 as a light-yellow oil (3.54 g, ∼100%). Rf = 0.81 (EtOAc). 1H NMR (400 MHz, CDCl3) δ 4.15–411 (m, 4H, OCH2COO, OCH2C![[triple bond, length as m-dash]](https://www.rsc.org/images/entities/char_e002.gif) CH), 3.65–3.55 (m, 14H, 7 × OCH2), 2.40 (t, J = 2.4 Hz, 1H, HC
CH), 3.65–3.55 (m, 14H, 7 × OCH2), 2.40 (t, J = 2.4 Hz, 1H, HC![[triple bond, length as m-dash]](https://www.rsc.org/images/entities/char_e002.gif) C), 2.00 (s, 3H, CH3COO). 13C NMR (101 MHz, CDCl3) δ 170.9, 79.6, 74.6, 70.5, 70.48, 70.45, 70.3, 69.0, 68.99, 63.5, 58.3, 20.9. HRMS (ESI-QTOF, positive) m/z calcd for C13H22O6 (M + NH4+): 292.1755; found 292.1762.
C), 2.00 (s, 3H, CH3COO). 13C NMR (101 MHz, CDCl3) δ 170.9, 79.6, 74.6, 70.5, 70.48, 70.45, 70.3, 69.0, 68.99, 63.5, 58.3, 20.9. HRMS (ESI-QTOF, positive) m/z calcd for C13H22O6 (M + NH4+): 292.1755; found 292.1762.
4,7,10,13,16-Pentaoxanonadec-18-ynenitrile (15)
Compound 13 (1.0 g, 4.31 mmol) was stirred with acrylonitrile (0.27 mL, 3.9 mmol) for 5 minutes. A catalytic amount of sodium methoxide (23.5 mg, 0.43 mmol) was added, and the mixture was stirred for 24 h. The mixture was diluted with ethyl acetate (150 mL) and washed with brine (2 × 150 mL) to remove the unreacted starting material 13. The organic phase was dried using anhydrous sodium sulfate, filtered, and concentrated under vacuum to obtain compound 15 as a light-yellow oil (0.62 g, 50%). Rf = 0.49 (EtOAc). 1H NMR (400 MHz, CDCl3) δ 4.22 (d, J = 1.2 Hz, 2H, OCH2C![[triple bond, length as m-dash]](https://www.rsc.org/images/entities/char_e002.gif) CH), 3.77–3.66 (m, 18H, 8 × OCH2 + OCH2CH2CN), 2.64 (dd, J = 6.4, 6.4 Hz, 2H, OCH2), 2.45 (t, J = 2.4 Hz, 1H, HC
CH), 3.77–3.66 (m, 18H, 8 × OCH2 + OCH2CH2CN), 2.64 (dd, J = 6.4, 6.4 Hz, 2H, OCH2), 2.45 (t, J = 2.4 Hz, 1H, HC![[triple bond, length as m-dash]](https://www.rsc.org/images/entities/char_e002.gif) C). 13C NMR (101 MHz, CDCl3) δ 118.00, 79.6, 74.7, 72.5, 70.60, 70.59, 70.56, 70.50, 70.47, 70.45, 70.4, 70.34, 70.30, 70.2, 70.1, 69.0, 65.9, 58.3, 18.8. HRMS (ESI-QTOF, positive) m/z calcd for C14H23NO5 (M + Na+): 308.1468; found 308.1483.
C). 13C NMR (101 MHz, CDCl3) δ 118.00, 79.6, 74.7, 72.5, 70.60, 70.59, 70.56, 70.50, 70.47, 70.45, 70.4, 70.34, 70.30, 70.2, 70.1, 69.0, 65.9, 58.3, 18.8. HRMS (ESI-QTOF, positive) m/z calcd for C14H23NO5 (M + Na+): 308.1468; found 308.1483.
Heptakis{6-deoxy-6-[(4-(2,5,8,11,14-pentaoxapentadecyl)-1H-1,2,3-triazol-1-yl]-2,3-di-O-octadecanoyl}cyclomaltoheptaose (2)
Compound 9 (0.24 g, 0.98 mmol), DIPEA (8.6 μL, 49.4 μmol), and Cu(I)I (9.40 mg, 49.4 μmol) was added to a solution of compound 11 (355.4 mg, 70.6 μmol) dissolved in acetone (7.0 mL). The reaction was heated to 55 °C and stirred for 72 h. The solution was concentrated then diluted with ethyl acetate (200 mL) and washed with 5% N,N,N′,N′-ethylenediaminetetraacetic acid in water (2 × 200 mL). The organic phase was evaporated then redissolved in DCM (10 mL) before the addition methanol (20 mL) to form a precipitate which was centrifuged and decanted. Precipitation and centrifugation were repeated twice to obtain the target compound 2 as a light brown solid (0.41 g, 86%). Rf = 0.50 (CH3OH![[thin space (1/6-em)]](https://www.rsc.org/images/entities/char_2009.gif) :
:![[thin space (1/6-em)]](https://www.rsc.org/images/entities/char_2009.gif) CH2Cl2, 10
CH2Cl2, 10![[thin space (1/6-em)]](https://www.rsc.org/images/entities/char_2009.gif) :
:![[thin space (1/6-em)]](https://www.rsc.org/images/entities/char_2009.gif) 90). [α]D25 + 21.7 (c 5.9, CHCl3). 1H NMR (400 MHz, CDCl3) δ 7.74 (s, 7H, 7 × 1,2,3-triazole), 5.47 (br s, 7H, 7 × H-1), 5.39 (br dd, 7H, 7 × H-3), 4.90–4.65 (m, 21H, 7 × H-2, 7 × H-6a, 7 × H-6b), 4.62–4.40 (m, 21H, 7 × H-5, 7 × OCH2-1,2,3-triazole), 3.71–3.57 (m, 98H, 49 × OCH2), 3.58–3.50 (m, 21H, 7 × H-4, 7 × OCH2), 3.37 (s, 21H, 7 × OCH3), 2.46–2.06 (m, 28H, 14 × CH2COO), 1.66–1.45 (m, 28H, 14 × CH2CH2COO), 1.43–1.25 (m, 392H, 196 × CH2), 0.88 (t, 42H, J = 6.8 Hz, 7 × CH3). 13C NMR (100 MHz, CDCl3) δ 173.1, 171.7, 144.7, 125.7, 96.3, 77.4, 76.7, 71.9, 70.6, 70.52, 70.48, 70.41, 70.0, 64.4, 58.99, 50.1, 34.0, 33.8, 32.0, 29.94, 29.92, 29.89, 29.86, 29.82, 29.80, 29.76, 29.73, 29.7, 29.5, 29.4, 29.3, 24.8, 24.7, 22.7, 14.1. LRMS (MALDI-TOF, positive) m/z calcd for C378H693N21O77Na (M + Na+): 6783.1 (6.6%) and 6787.1 (100%); found 6786.4 (100%).
90). [α]D25 + 21.7 (c 5.9, CHCl3). 1H NMR (400 MHz, CDCl3) δ 7.74 (s, 7H, 7 × 1,2,3-triazole), 5.47 (br s, 7H, 7 × H-1), 5.39 (br dd, 7H, 7 × H-3), 4.90–4.65 (m, 21H, 7 × H-2, 7 × H-6a, 7 × H-6b), 4.62–4.40 (m, 21H, 7 × H-5, 7 × OCH2-1,2,3-triazole), 3.71–3.57 (m, 98H, 49 × OCH2), 3.58–3.50 (m, 21H, 7 × H-4, 7 × OCH2), 3.37 (s, 21H, 7 × OCH3), 2.46–2.06 (m, 28H, 14 × CH2COO), 1.66–1.45 (m, 28H, 14 × CH2CH2COO), 1.43–1.25 (m, 392H, 196 × CH2), 0.88 (t, 42H, J = 6.8 Hz, 7 × CH3). 13C NMR (100 MHz, CDCl3) δ 173.1, 171.7, 144.7, 125.7, 96.3, 77.4, 76.7, 71.9, 70.6, 70.52, 70.48, 70.41, 70.0, 64.4, 58.99, 50.1, 34.0, 33.8, 32.0, 29.94, 29.92, 29.89, 29.86, 29.82, 29.80, 29.76, 29.73, 29.7, 29.5, 29.4, 29.3, 24.8, 24.7, 22.7, 14.1. LRMS (MALDI-TOF, positive) m/z calcd for C378H693N21O77Na (M + Na+): 6783.1 (6.6%) and 6787.1 (100%); found 6786.4 (100%).
Heptakis{6-deoxy-6-[(4-(15-oxo-2,5,8,11,14-pentaoxahexadecyl)-1H-1,2,3-triazol-1-yl]-2,3-di-O-octadecanoyl}cyclomaltoheptaose (3)
Compound 14 (76.3 mg, 0.28 mmol), DIPEA (2.4 μL, 13.9 μmol), and Cu(I)I (2.64 mg, 13.9 μmol) was added to a solution of compound 9 (100 mg, 19.9 μmol) dissolved in acetone (4.0 mL). The reaction was heated to 50 °C and stirred for 4 days. The solution was diluted with ethyl acetate (100 mL) and washed with 5% N,N,N′,N′-ethylenediaminetetraacetic acid in water (3 × 100 mL). The organic phase was evaporated then redissolved in DCM (2 mL) before the addition methanol (8 mL) to form a precipitate which was centrifuged and decanted. Precipitation and centrifugation were repeated twice to obtain the target compound 3 as a light brown solid (76.2 mg, 55%). Rf = 0.50 (CH3OH![[thin space (1/6-em)]](https://www.rsc.org/images/entities/char_2009.gif) :
:![[thin space (1/6-em)]](https://www.rsc.org/images/entities/char_2009.gif) CH2Cl2, 10
CH2Cl2, 10![[thin space (1/6-em)]](https://www.rsc.org/images/entities/char_2009.gif) :
:![[thin space (1/6-em)]](https://www.rsc.org/images/entities/char_2009.gif) 90). [α]D25 + 15.6 (c 0.45, CHCl3). 1H NMR (400 MHz, CDCl3) δ 7.76 (s, 7H, 7 × 1,2,3-triazole), 5.55–5.33 (m, 14H, 7 × H-1, 7 × H-3), 4.93 – 4.37 (m, 42H, 7 × H-2, 7 × H-5, 7 × H-6a, 7 × H-6b, 7 × OCH2-1,2,3-triazole), 4.26–4.18 (m, 14H, 7 × OCH2), 3.76–3.49 (m, 105H, 7 × H-4, 49 × OCH2), 2.43–2.03 (m, 49H, 7 × CH3COO, 14 × CH2COO), 1.65–1.45 (m, 28H, 14 × CH2CH2COO), 1.38–1.16 (m, 392H, 196 × CH2), 0.88 (t, J = 6.7 Hz, 42H, 7 × CH3). 13C NMR (101 MHz, CDCl3) δ 173.1, 171.8, 171.1, 144.7, 125.8, 96.3, 70.53, 70.51, 70.4, 69.9, 69.7, 69.1, 64.4, 63.6, 50.8, 50.0, 34.0, 33.8, 32.0, 30.0, 29.93, 29.90, 29.87, 29.84, 29.81, 29.8, 29.74, 29.71, 29.5, 29.4, 29.3, 24.8, 24.7, 22.7, 21.0, 14.1. LRMS (MALDI-TOF, positive) m/z calcd for C385H694N21O84 (M + H+): 6957.1 (6.1%) and 6961.1 (100%); found 6959.4 (100%).
90). [α]D25 + 15.6 (c 0.45, CHCl3). 1H NMR (400 MHz, CDCl3) δ 7.76 (s, 7H, 7 × 1,2,3-triazole), 5.55–5.33 (m, 14H, 7 × H-1, 7 × H-3), 4.93 – 4.37 (m, 42H, 7 × H-2, 7 × H-5, 7 × H-6a, 7 × H-6b, 7 × OCH2-1,2,3-triazole), 4.26–4.18 (m, 14H, 7 × OCH2), 3.76–3.49 (m, 105H, 7 × H-4, 49 × OCH2), 2.43–2.03 (m, 49H, 7 × CH3COO, 14 × CH2COO), 1.65–1.45 (m, 28H, 14 × CH2CH2COO), 1.38–1.16 (m, 392H, 196 × CH2), 0.88 (t, J = 6.7 Hz, 42H, 7 × CH3). 13C NMR (101 MHz, CDCl3) δ 173.1, 171.8, 171.1, 144.7, 125.8, 96.3, 70.53, 70.51, 70.4, 69.9, 69.7, 69.1, 64.4, 63.6, 50.8, 50.0, 34.0, 33.8, 32.0, 30.0, 29.93, 29.90, 29.87, 29.84, 29.81, 29.8, 29.74, 29.71, 29.5, 29.4, 29.3, 24.8, 24.7, 22.7, 21.0, 14.1. LRMS (MALDI-TOF, positive) m/z calcd for C385H694N21O84 (M + H+): 6957.1 (6.1%) and 6961.1 (100%); found 6959.4 (100%).
Heptakis{6-deoxy-6-[(4-(16-cyano-2,5,8,11,14-pentaoxahexadecyl)-1H-1,2,3-triazol-1-yl]-2,3-di-O-octadecanoyl}cyclomaltoheptaose (4)
15 (79.3 mg, 0.28 mmol), DIPEA (2.4 μL, 13.9 μmol), and Cu(I)I 2.6 mg, 13.9 μmol) was added to a solution of 9 (100 mg, 19.9 μmol) dissolved in acetone (4.0 mL). The reaction was heated to 50 °C and stirred for 4 days. The solution was concentrated and then diluted with ethyl acetate (100 mL) and washed with 5% N,N,N′,N′-ethylenediaminetetraacetic acid in water (3 × 100 mL). The organic phase was evaporated then redissolved in DCM (1 mL) before the addition methanol (9 mL) to form a precipitate which was centrifuged and decanted. Precipitation and centrifugation were repeated twice to obtain the target compound 4 as a light brown solid (79.3 mg, 57%). Rf = 0.47 (CH3OH![[thin space (1/6-em)]](https://www.rsc.org/images/entities/char_2009.gif) :
:![[thin space (1/6-em)]](https://www.rsc.org/images/entities/char_2009.gif) CH2Cl2, 10
CH2Cl2, 10![[thin space (1/6-em)]](https://www.rsc.org/images/entities/char_2009.gif) :
:![[thin space (1/6-em)]](https://www.rsc.org/images/entities/char_2009.gif) 90). [α]D25 + 19.5 (c 0.43, CHCl3). 1H NMR (400 MHz, CDCl3) δ 7.77 (s, 7H, 7 × 1,2,3-triazole), 5.57–5.34 (m, 14H, 7 × H-1, 7 × H-3), 4.96–4.25 (m, 42H, 7 × H-2, 7 × H-5, 7 × H-6a, 7 × H-6b, OCH2-1,2,3-triazole), 3.80–3.47 (m, 133H, 7 × H-4, 63 × OCH2), 2.64 (t, J = 6.4 Hz, 14H, 7 × CH2CN), 2.46–1.99 (m, 28H, 14 × CH2COO), 1.67–1.44 (m, 28H, 14 × CH2CH2COO), 1.41–1.14 (m, 392H, 196 × CH2), 0.89 (t, 42H, J = 6.7 Hz, 14 × CH3). 13C NMR (101 MHz, CDCl3) δ 173.1, 171.7, 125.8, 96.3, 77.3, 70.7, 70.6, 70.5, 70.4, 69.9, 69.7, 65.9, 64.4, 34.0, 33.8, 32.0, 29.94, 29.91, 29.88, 29.85, 29.82, 29.79, 29.75, 29.71, 29.5, 29.4, 29.3, 24.8, 24.7, 22.7, 18.9, 14.1. LRMS (MALDI-TOF, positive) m/z calcd for C392H700N28O77Na (M + Na+): 7056.2 (5.6%) and 7060.2 (100%); found 7059.6 (100%).
90). [α]D25 + 19.5 (c 0.43, CHCl3). 1H NMR (400 MHz, CDCl3) δ 7.77 (s, 7H, 7 × 1,2,3-triazole), 5.57–5.34 (m, 14H, 7 × H-1, 7 × H-3), 4.96–4.25 (m, 42H, 7 × H-2, 7 × H-5, 7 × H-6a, 7 × H-6b, OCH2-1,2,3-triazole), 3.80–3.47 (m, 133H, 7 × H-4, 63 × OCH2), 2.64 (t, J = 6.4 Hz, 14H, 7 × CH2CN), 2.46–1.99 (m, 28H, 14 × CH2COO), 1.67–1.44 (m, 28H, 14 × CH2CH2COO), 1.41–1.14 (m, 392H, 196 × CH2), 0.89 (t, 42H, J = 6.7 Hz, 14 × CH3). 13C NMR (101 MHz, CDCl3) δ 173.1, 171.7, 125.8, 96.3, 77.3, 70.7, 70.6, 70.5, 70.4, 69.9, 69.7, 65.9, 64.4, 34.0, 33.8, 32.0, 29.94, 29.91, 29.88, 29.85, 29.82, 29.79, 29.75, 29.71, 29.5, 29.4, 29.3, 24.8, 24.7, 22.7, 18.9, 14.1. LRMS (MALDI-TOF, positive) m/z calcd for C392H700N28O77Na (M + Na+): 7056.2 (5.6%) and 7060.2 (100%); found 7059.6 (100%).
Conflicts of interest
The authors declare no competing interests.Acknowledgements
The financial support from Alberta Innovates – Technology Futures, the Natural Sciences and Engineering Research Council of Canada, and the University of Calgary is greatly acknowledged. We are grateful to Dr Ping Zhang of the Department of Chemistry, University of Calgary for recording all the ESI HRMS spectra.Notes and references
- Y. C. Hsiao, E. R. Yeh and W. Lee, Mol. Cryst. Liq. Cryst., 2017, 644, 12–18 CrossRef CAS.
- C. Luan, H. Luan and D. Luo, Micromachines, 2020, 11, 1–19 CrossRef PubMed.
- Z. Wang, T. Xu, A. Noel, Y. C. Chen and T. Liu, Soft Matter, 2021, 17, 4675–4702 RSC.
- T. Liang, H. P. C. van Kuringen, D. J. Mulder, S. Tan, Y. Wu, Z. Borneman, K. Nijmeijer and A. P. H. J. Schenning, ACS Appl. Mater. Interfaces, 2017, 9, 35218–35225 CrossRef CAS PubMed.
- S. Tan, B. Wei, T. Liang, X. Yang and Y. Wu, RSC Adv., 2016, 6, 34038–34042 RSC.
- A. Yamashita, M. Yoshio, B. Soberats, H. Ohno and T. Kato, J. Mater. Chem. A, 2015, 3, 22656–22662 RSC.
- T. H. Do, H.-J. Kim, M. L. Nguyen and B.-K. Cho, Crystals, 2020, 10, 193 CrossRef CAS.
- S. K. Park, K. S. Han, J. H. Lee, V. Murugesan, S. H. Lee, C. M. Koo, J. S. Lee and K. T. Mueller, J. Phys. Chem. C, 2019, 123, 20547–20557 CrossRef CAS.
- Z. Wang, C. Wang, Y. Sun, K. Wang, J. W. Strzalka, S. N. Patel, P. F. Nealey, C. K. Ober and F. A. Escobedo, ACS Nano, 2022, 16, 20714–20729 CrossRef CAS PubMed.
- H. Shimura, M. Yoshio, K. Hoshino, T. Mukai, H. Ohno and T. Kato, J. Am. Chem. Soc., 2008, 130, 1759–1765 CrossRef CAS PubMed.
- Z. Liu, B. X. Dong, M. Misra, Y. Sun, J. Strzalka, S. N. Patel, F. A. Escobedo, P. F. Nealey and C. K. Ober, Adv. Funct. Mater., 2019, 29, 1805220 CrossRef.
- A. Eisele, K. Kyriakos, R. Bhandary, M. Schönhoff, C. M. Papadakis and B. Rieger, J. Mater. Chem. A, 2015, 3, 2942–2953 RSC.
- P. Rajak, L. K. Nath and B. Bhuyan, Indian J. Pharm. Sci., 2019, 81, 11–23 CAS.
- T. Waghule, S. Patil, V. K. Rapalli, V. Girdhar, S. Gorantla, S. Kumar Dubey, R. N. Saha and G. Singhvi, Liq. Cryst., 2021, 48, 991–1009 CrossRef CAS.
- G. Crini, Chem. Rev., 2014, 114, 10940–10975 CrossRef CAS PubMed.
- E. Bilensoy and A. A. Hincal, EXPERT Opin. DRUG Deliv., 2009, 6, 1161–1173 CrossRef CAS PubMed.
- C. Bienvenu, A. Martinez, J. L. Jimenez Blanco, C. Di Giorgio, P. Vierling, C. Ortiz Mellet, J. Defaye and J. M. Garcia Fernandez, Org. Biomol. Chem., 2012, 10, 5570–5581 RSC.
- G. Varan, C. Varan, N. Erdogar, A. A. Hincal and E. Bilensoy, Int. J. Pharm., 2017, 531, 457–469 CrossRef CAS PubMed.
- M. Votava and B. J. Ravoo, Chem. Soc. Rev., 2021, 50, 10009–10024 RSC.
- C. C. Ling, R. Darcy and W. Risse, J. Chem. Soc., Chem. Commun., 1993, 438–440 RSC.
- P. L. Champagne, D. Ester, D. Polan, V. E. Williams, V. Thangadurai and C. C. Ling, J. Am. Chem. Soc., 2019, 141, 9217–9224 CrossRef CAS PubMed.
- P. L. Champagne, D. Ester, A. Bhattacharya, K. Hofstetter, C. Zellman, S. Bag, H. Yu, S. Trudel, V. K. Michaelis, V. E. Williams, V. Thangadurai and C. C. Ling, J. Mater. Chem. A, 2019, 7, 12201–12213 RSC.
- P. L. Champagne, D. Ester, M. Zeeman, C. Zellman, V. E. Williams and C. C. Ling, J. Mater. Chem. C, 2017, 5, 9247–9254 RSC.
- L. Chen, T.-H. Hu, H.-L. Xie and H.-L. Zhang, J. Polym. Sci., Part A: Polym. Chem., 2010, 48, 2838–2845 CrossRef CAS.
- F. Yang, Y. Zhang and H. Guo, New J. Chem., 2013, 37, 2275–2279 RSC.
- S. Ward, O. Calderon, P. Zhang, M. Sobchuk, S. N. Keller, V. E. Williams and C.-C. Ling, J. Mater. Chem. C, 2014, 2, 4928–4936 RSC.
- P. L. Champagne, D. Ester, S. Ward, V. E. Williams and C. C. Ling, ChemPlusChem, 2017, 82, 423–432 CrossRef CAS PubMed.
- P.-L. Champagne, D. Ester, M. Zeeman, C. Zellman, V. E. Williams and C.-C. Ling, J. Mater. Chem. C, 2017, 5, 9247–9254 RSC.
- H. Parrot-Lopez, C. C. Ling, P. Zhang, A. Baszkin, G. Albrecht, C. De Rango and A. W. Coleman, J. Am. Chem. Soc., 1992, 114, 5479–5480 CrossRef CAS.
- M. Wazynska, A. Temeriusz, K. Chmurski, R. Bilewicz and J. Jurczak, Tetrahedron Lett., 2000, 41, 9119–9123 CrossRef CAS.
- N. Badi, N. Jarroux and P. Guégan, Tetrahedron Lett., 2006, 47, 8925–8927 CrossRef CAS.
- S. Ward and C.-C. Ling, Eur. J. Org. Chem., 2011, 4853–4861 CAS.
- P. Zhang, L. Chang-Chun, A. W. Coleman, H. Parrot-Lopez and H. Galons, Tetrahedron Lett., 1991, 32, 2769–2770 CrossRef CAS.
- F. Sallas, K. Niikura and S.-I. Nishimura, Chem. Commun., 2004, 596–597 RSC.
- A. Salameh, A. N. Lazar, A. W. Coleman and H. Parrot-Lopez, Tetrahedron, 2005, 61, 8740–8745 CrossRef CAS.
- A. Díaz-Moscoso, N. Guilloteau, C. Bienvenu, A. Méndez-Ardoy, J. L. Jiménez Blanco, J. M. Benito, L. Le Gourriérec, C. Di Giorgio, P. Vierling, J. Defaye, C. Ortiz Mellet and J. M. García Fernández, Biomaterials, 2011, 32, 7263–7273 CrossRef PubMed.
- P. Zhang, E. Paszkiewicz, Q. Wang, J. M. Sadowska, P. I. Kitov, D. R. Bundle and C.-C. Ling, Chem. Commun., 2017, 53, 10528–10531 RSC.
- T. Kato and N. Mizoshita, Curr. Opin. Solid State Mater. Sci., 2002, 6, 579–587 CrossRef CAS.
- T. Kato, Science, 2002, 295, 2414–2418 CrossRef CAS PubMed.
- C. Tschierske, J. Mater. Chem., 1998, 8, 1485–1508 RSC.
- N. Kapernaum, A. Lange, M. Ebert, M. A. Grunwald, C. Haege, S. Marino, A. Zens, A. Taubert, F. Giesselmann and S. Laschat, ChemPlusChem, 2022, 87, e202100397 CrossRef CAS PubMed.
- P. Fuchs, C. Tschierske, K. Raith, K. Das and S. Diele, Angew. Chem., Int. Ed., 2002, 41, 628–631 CrossRef CAS.
- R. G. Parr and Y. Weitao, Density-Functional Theory of Atoms and Molecules, Oxford University Press, 1989 Search PubMed.
- F. Neese, WIREs Comput. Mol. Sci., 2022, 12, e1606 Search PubMed.
- S. Grimme, A. Hansen, S. Ehlert and J.-M. Mewes, J. Chem. Phys., 2021, 154, 064103 CrossRef CAS PubMed.
- M. Wilkening and P. Heitjans, Chem. Phys. Chem., 2012, 13, 53–65 CrossRef CAS PubMed.
- F. Bloch, Phys. Rev., 1946, 70, 460 CrossRef CAS.
- A. Pines, M. G. Gibby and J. S. Waugh, J. Chem. Phys., 2003, 56, 1776 CrossRef.
- S. R. Hartmann and E. L. Hahn, Phys. Rev., 1962, 128, 2042 CrossRef CAS.
- G. M. Bernard, A. Goyal, M. Miskolzie, R. McKay, Q. Wu, R. E. Wasylishen and V. K. Michaelis, J. Magn. Reson., 2017, 283, 14–21 CrossRef CAS PubMed.
Footnote |
| † Electronic supplementary information (ESI) available. See DOI: https://doi.org/10.1039/d2tc05024b |
| This journal is © The Royal Society of Chemistry 2023 |

