Quantum dynamics of the Br2 (B-excited state) photodissociation in superfluid helium nanodroplets: importance of the recombination process†
Arnau
Vilà
 and
Miguel
González
 *
*
Departament de Ciència dels Materials i Química Física and IQTC, Universitat de Barcelona, Martí i Franquès, 1-11, 08028 Barcelona, Spain. E-mail: miguel.gonzalez@ub.edu; Fax: +34 93 4021231
First published on 7th September 2022
Abstract
We have studied the Br2 photodissociation dynamics (B ← X electronic transition) of Br2(v = 0, X)@(4He)N doped nanodroplets (T = 0.37 K) at zero angular momentum, with N in the 100–1000 interval. To do this, we have used a quantum mechanical hybrid strategy proposed by us and, as far as we know, this is the second quantum dynamics study available on the photodissociation of molecules in superfluid helium nanodroplets. While the results obtained for some properties are qualitatively similar to those reported previously by us for the Cl2(B ← X) related case (in particular, the oscillating Br final velocity distribution which also arises from quantum interferences), large differences are evident in three key properties: the photodissociation mechanism and probability and the time scale of the process. This can be interpreted on the basis of the significantly lower excitation energy achieved by the Br2(B ← X) transition and the higher reduced mass of Br–Br in comparison to the chlorine case. The Br2(B) photodissociation dynamics is significantly more complex than that of Cl2(B) and leads to the fragmentation of the initial wave packet. Thus, the probability of non-dissociation is equal to 17, 18, 51, 85 and 100% for N = 100, 200, 300, 500 and 1000, respectively, while for chlorine this probability is equal to zero. In spite of the very large experimental difficulties that exist for obtaining nanodroplets with a well defined size, we hope that these results will encourage experimentalists to investigate these interesting systems.
1. Introduction
Superfluid helium nanodroplets, (4He)N or HeNDs, are of great interest not only because they allow finite-size superfluidity to be explored but also due to their properties as a solvent.1–4 Their superfluidity, chemically inert character, capability of being doped with almost any atomic or molecular species, very low temperature (T = 0.37 K) and large heat capacity make HeNDs an optimal nanoreactor to study a wide diversity of chemical processes.3–5 Another key feature of these nanodroplets is their ability to stabilize chemical species such as ions, molecules, nanoclusters6,7 and nanowires.8,9 This is an important issue from a practical chemical perspective and also in order to understand the impurity (chemical species) relaxation mechanism.The first experiments on this subject focused on the cage effect in the fragmentation of photoionized molecules10–13 and rare-gas clusters14–17 embedded in HeNDs. The energy relaxation by these nanodroplets has also been studied experimentally in neutral species (photoinduced isomerization of linear and bent isomers of HCN-HF18 and photodissociation of alkyl iodides; R–I + hν → R + I).19–21 Most of the experiments pointed out that the cooling by helium is not a thermal evaporative process, i.e., the mean energy per evaporated 4He atom is greater than the binding energy per 4He atom in liquid helium (≈7 K). Furthermore, the cooling efficiency was found to depend on the nanodroplet size. Furthermore, there are also experiments on femtosecond photoexcitation dynamics inside HeNDs.22–24
Here, we report a theoretical investigation of a prototypic reaction that corresponds to the adiabatic photodissociation of a bromine molecule embedded in a HeND: Br2(ground state)@(4He)N + hν → Br2(excited state)@(4He)N → Br + Br* + (4He)N′ + (N–N′) 4He. The excited state arises from the B ← X electronic transition, (N–N′) 4He refers to the total number of evaporated 4He atoms and the nanodroplet sizes examined are in the range of N = 100–1000. The larger sizes studied here, N = 500 and 1000, are within the range of the smaller ones considered in the experiments. This study is related to a previous investigation carried out by us on the related Cl2 system.25,26 As it will be seen, the bromine photodissociation dynamics presents important differences with respect to the chlorine one. Besides, the present study corresponds to the second theoretical investigation carried out on the photodissociation of molecules embedded in HeNDs.
This work has been carried out employing a quantum hybrid method proposed25 and previously applied by us (with some modifications when needed) to investigate the dynamics of several physicochemical problems involving (4He)N and atoms or diatomic molecules (photodissociation,25–27 atom capture,28,29 van der Waals reaction,30,31 vibrational relaxation,32,33 rotational relaxation34 and helium nanodroplet relaxation35). Therefore, time dependent density functional theory (TDDFT) and standard quantum mechanics have been used to describe helium and the Br2 molecule, respectively, analogously as in the case of the Cl2(B) photodissociation. This approach can also be applied to investigate non-adiabatic reactions, e.g., electron transfer reactions,36–39 if the electronic states and couplings are known. Furthermore, it is worth mentioning that static methods, considering helium described at the DFT level, have also been used to account for molecular reactivity in HeNDs.40,41
This article is organized in the following way: the theoretical approach employed is succinctly explained in Section 2, the most important results obtained are reported and discussed in Section 3 and, finally, the summary and conclusions are presented in Section 4.
2. Theoretical method
A hybrid quantum method has been used to study the photodissociation dynamics of a Br2 molecule, placed inside a superfluid helium nanodroplet, after the B ← X electronic excitation. In this method, which has been previously proposed by us and applied to the related Cl2 case,25,26 the helium atoms are described by means of the mean field TDDFT method and the molecule is described using a time dependent quantum wave packet (WP). Besides, the common so-called Orsay–Trento (OT) phenomenological density functional (T = 0 K)42, including some reasonable and commonly used approximations (the backflow term and the non-local contribution to the helium correlation energy have not been considered),25–27,29–35,43–45 has been used to account for the helium.Here, we will only review the key aspects of the TDDFT/WP quantum approach and refer the reader to ref. 25 and 26 for additional information. We have focused our attention on the effect of the nanodroplet size on the photodissociation dynamics examining (4He)N in the interval N = 100–1000, in a similar way to that for Cl2. The initial Br2 ground electronic (X) and vibrational (ν = 0) state wave function, after a sudden B ← X electronic transition, starts to evolve on the potential energy curve of the B excited state, according to the Franck–Condon principle (vertical transition), and evolves adiabatically on this electronic state (Fig. 1).
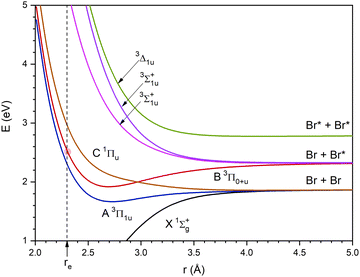 | ||
| Fig. 1 Ground and six lowest excited potential energy curves of Br2 from the spin–orbit configuration interaction ab initio calculations of ref. 46. The dashed vertical line corresponds to the r interatomic distance value equal to the equilibrium value in the ground state (the crossing of this line with the B excited state curve is highlighted by a red circle). Besides, Br and Br* correspond to the 2P3/2 ground state and 2P1/2 excited state atoms, respectively. | ||
We have not considered the rotational degrees of freedom because the rotational motion of the Br2 free molecule is very slow in comparison to the time scale of the photodissociation. Thus, the rotational period of the j = 1 excited rotational state is around 202 and 278 ps for the X and B electronic states, respectively (τrot ≈ h/(2Be), where Be is the equilibrium rotational constant).
The B state is the lowest excited state of the halogen molecules that has a minimum in the potential energy curve and does not dissociate into the ground state atoms. Besides, this state can be reached using relatively low excitation frequencies. Because of this, it has been considered in many gas phase photodissociation studies. For the Br2 molecule, the vertical excitation energy from the X state to the B state is 2.537 eV (cf.Fig. 1) and taking into account the vibrational zero point energy of the ground state it is equal to 2.517 eV (λexc = 498 nm). On the other hand, an increase of the energy of the exciting photon would lead to an increase of the energy of the dissociating atoms47 and this would lead to an increase of the photodissociation probability.
As it will be shown at the beginning of Section 3, the energy of the B state of Br2 after a sudden vertical excitation from the ground state (t = 0), with respect to the corresponding atomic dissociation (Br + Br*), is substantially lower than that of the Cl2 molecule. It should be noted that in Section 3 the energies are expressed in K as this is the common way to proceed in the helium nanodroplets context.
The evolution of the nanodroplet is, of course, coupled with that of the molecule and, on the basis of the symmetry of the problem and assuming zero angular momentum,25 we only need to consider the Br–Br relative coordinate (r) in the wave packet. The photodissociation takes place along the molecular axis (z-axis) and the origin of coordinates is placed in the centre of the doped nanodroplet.
After a suitable minimization of the resulting energy functional, E[ΨHe, φBr2], where E is the total energy, with respect to the helium, ΨHe, and molecule, φBr2, wave functions, two coupled time-dependent Schrödinger-like non-linear equations are obtained. The time evolution of the N-particle helium effective complex wave function,  where RHe is the associated three-dimensional space coordinate, which satisfies the normalization condition
  , and the relative coordinate molecular wave packet, φBr2(r,t), are determined from the following equations:25
 | (1a) |
 | (1b) |
 . The helium nanodroplet–molecule interaction potential energy has been estimated as usual, i.e., following a pairwise approach, and in this case we have employed the He–Br2(X) and He–Br2(B) potential energy expressions from ref. 48 and 49, respectively.
The He–Br2(X) potential energy was obtained48 from ab initio calculations using a significant number of geometrical arrangements, so as to describe its dependence on the commonly employed (R, r, and θ) Jacobi coordinates. Moreover, a well known method was applied to fit the ab initio data to a suitable analytical expression. The He–Br2(B) potential energy was constructed49 following an empirical approach in which the optimal parameters of the resulting analytical expression were found from some spectroscopic and dynamics calculations, taking also into consideration the dependence on the Jacobi coordinates.
The temporal propagation of the wave functions has been determined by solving eqn (1a) and (1b) numerically, using discretization techniques and applying standard procedures. Moreover, negative imaginary potentials (NIPs) have been added in the Br2 and helium grids in order to avoid non-physical reflections of the wave functions at their limits. These potentials, that act from a distance close to the limit of the grids (d > dNIP) to the limit itself, have the following expression:50
 | (2) |
They include three parameters: the absorption strength (A), the length (L) and the location (dNIP). The numerical values of the parameters defining the HeND and Br2 grids, as a function of the nanodroplet size, are given in the ESI† document (Tables S1 and S2, respectively), where the NIPs and the integration time step are also given. Moreover, a schematic representation of the Br2(X)@(4He)N doped helium nanodroplet is presented in Fig. S1, ESI.†
Furthermore and as it will be shown in Section 3, a substantial difference appears in the case of the Br2(B) molecule in comparison to the Cl2(B) one, since in the former case there is a significant probability of no dissociation, which even reaches a value of 100% for the largest nanodroplet examined (N = 1000). This makes it necessary to proceed here in a way different from that employed for the Cl2(B) molecule (probability of no dissociation equal to zero), in order to determine the final velocity distribution of the Br atoms, which is a very important property. The procedure we have followed for Br2(B) is described in the Appendix.
3. Results and discussion
Here, we present the photodissociation dynamics of a Br2 molecule, placed inside a helium nanodroplet, via the B ← X electronic transition. For the halogen molecules the main difference that is found is the excess of energy with respect to the corresponding atomic dissociation obtained from the transition from the X ground state to the B excited state (assuming the Franck–Condon principle), which shows a clear monotonic tendency: the higher the atomic number the lower the excess of energy.The aim of this work is to obtain a deep insight into the influence of the HeND size on the photodissociation dynamics of Br2(B) in helium nanodroplets. To perform this, nanodroplets of quite different sizes (N = 100, 200, 300, 500 and 1000 4He atoms) have been selected in order to cover a wide enough size interval. Besides, in order to have a reference system, we have also taken into account the gas phase photodissociation of Br2(B) within the same approximations (electronic adiabatic dynamics and rotational degrees of freedom neglected).
Before discussing the results obtained in the dynamics study, it is convenient to consider the magnitude of the various energies (mean values) involved and to compare them with those for Cl2(B). Table S3 (ESI† document) shows the values we have obtained after the sudden vertical excitation from the ground state to the B state of the Br2 molecule (zero time of the simulation), which are of particular interest here. The kinetic energy of the Br–Br relative motion is equal to 116.4 K while the Br–Br potential energy is equal to 2016.8 K (zero of energy in the Br* + Br dissociated atoms). These values are substantially smaller than those of Cl2(B), which are equal to 199.3 and 11094.1 K, respectively.26
Regarding other energies, the values corresponding to helium (kinetic energy, potential energy and correlation energy, as described by the Orsay–Trento density functional) are very similar for both molecules. Appreciable differences only occur in the potential energy of interaction between the molecule and helium. Thus, e.g., for the nanodroplets with 100 and 500 He atoms, this potential energy is equal to −499.1 and −519.1 K, respectively, for Br2(B); while −388.7 and −421.5 K are, respectively, the values for Cl2(B). These results are consistent with the fact that the Br2(B)–He triatomic interaction49 is somewhat more attractive than the Cl2(B)–He one.51
3.1. Photodissociation probability
The values of the photodissociation probabilities obtained are collected in Table 1, where it should be noted that the expected value of the escape velocity of the bromine atoms is not obtained from the whole molecular wave packet, but only from the fraction of it leaving the nanodroplet (cf. the Appendix). The results shown for N = 300, 500 and 1000, where the photodissociation is not the main process, suggest that for the heavier halogen molecules the B ← X electronic transition is no longer expected to lead to the breaking of the chemical bond. Instead of this, the recombination process should be clearly the main result and this will be the case even for nanodroplets of a relatively small size.| Case | Photodissociation probability | 〈νescape〉 (m s−1) |
|---|---|---|
| Br2 gas phase | 0.88 | 380 |
| Br2@4He100 | 0.83 | 197 |
| Br2@4He200 | 0.82 | 152 |
| Br2@4He300 | 0.49 | 125 |
| Br2@4He500 | 0.15 | 59 |
| Br2@4He1000 | 0.00 | — |
Although many of the observed features found here are analogous to those observed in the case of the photodissociation of Cl2(B) in helium nanodroplets, which has been studied previously by us employing the same theoretical approach, the importance of the recombination process leads to strong differences, as it will also be evident in the next subsections.
3.2. Photodissociation mechanism
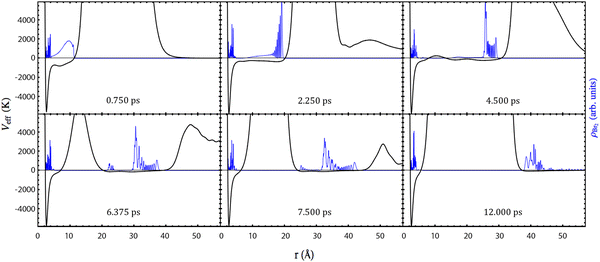
In this subsection, it will be shown that the photodissociation mechanism of Br2(B) is much richer from the point of view of the dynamics than the mechanism of Cl2(B). This arises from the more attractive (bonding) character of the B-state potential energy curve of Br2 compared to that of Cl2. Moreover, the dissociation is rather slower in the case of Br2(B) due to what has just been indicated and also due to the greater reduced mass (somewhat larger than 2) of Br–Br compared to that of Cl–Cl.The time evolution of the photodissociation process has been investigated by inspecting Movies S1–S5 for the HeND sizes of N = 100, 200, 300, 500 and 1000, respectively (ESI† document). At the left side of the movies, the time evolutions corresponding to the molecule are collected: squared modulus of the wave packet in both the position |φBr2(r)|2 (relative coordinate; top panel) and conjugate momentum |φBr2(pr)|2 (bottom panel) representations. The images shown at the right side of the movies correspond to the helium density in the xz-plane in a 2D representation with a colour scale (top) and in a 3D plot (bottom). In addition, the snapshots given in Fig. 2 and 3 showing the time evolution of |φBr2(r)|2 and the helium density (N = 300) in the xz-plane (3D plot) at representative times are also useful.
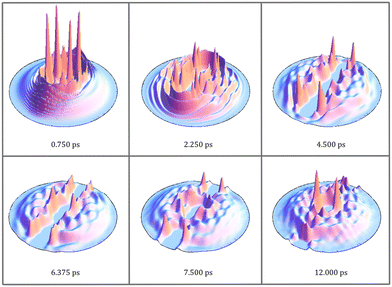 | ||
| Fig. 3 Snapshots of the helium density in the xz-plane, at the same selected representative times as shown in Fig. 2, for the HeND with 300 atoms. | ||
The effective potential, which governs the dynamics of the relative coordinate degree of freedom, is also shown in Fig. 2. It is equal to the sum of all potential energy terms affecting the molecule, i.e., it is equal to the sum of the molecular potential energy and the molecule–helium potential energy (which depends on time due to the evolution of the helium density).
Focusing on the wave packet probability density in the position representation, for the initial times all the cases follow essentially the same tendency for the temporal evolution. So that we will begin commenting the general trends and afterwards we will point out the singularities of each case.
At the initial times, the wave packet essentially evolves through a potential energy that is very close to the excited electronic (B state) potential energy curve, as the interaction with helium is negligible, which causes a highly oscillatory pattern in its tail. This behaviour is also observed for the gas phase case and is directly related to the bound fraction of the wave packet. This fact can be rationalized considering an ensemble of classical particles with a position distribution given by the squared modulus of the wave packet. Thus, the fraction of the distribution whose potential energy takes negative values is in a bound state and no dissociation occurs for it.
The remaining part of the wave packet, |φBr2(r)|2, evolves maintaining the initial Gaussian shape until the Br atoms reach the walls of the helium cavity. Then, this shape is no longer maintained and oscillations appear in the front of the wave packet. This behaviour is close to the one observed in the case of the chlorine molecule, which has been described previously.
At time equal to zero the helium cavity corresponds to a rather large volume defined inside the nanodroplet and centered in the Br2 molecule where no helium atoms are found (cf. Fig. S1, ESI†). After excitation of the molecule to the B-state its shape is progressively being modified as the Br atoms separate from each other (cf. Movies S1–S5, ESI†).
After this initial period of time, the evolution of the Br2(B) wave packet results from the superposition of two dynamics: the bound (vibrational relaxation) and the quasi-bound dynamics. At a time of around 4 ps, the wave packet is fragmented into two parts. This is mediated by liquid helium which tries to close the big hole generated in the nanodroplet by the separation of the two photodissociating Br atoms. This cannot be seen in the movies in terms of the helium density, but it is clearly evident from the top left part of the movies taking into consideration the effective potential acting on the molecule. When the effective potential takes positive values the wave packet is clearly divided into two fragments. This fact, of course, does not happen in the gas phase.
Then, these two parts of the wave packet, |φBr2(r)|2, become compacted in a more narrow shape. At this time (around 8 ps), the fragment of the wave packet that will not dissociate is fully surrounded by helium, i.e., it is re-solvated and the other fragment leaves the nanodroplet. Afterwards, the vibrational relaxation of the remaining part of the wave packet will take place, but we stopped the calculation before, as it takes a lot of time to vibrationally relax the wave packet (see, e.g., ref. 32 and 33) and its study is out of the scope of the present work.
Although all the cases examined follow similar general trends at short and intermediate times, each nanodroplet size leads to some specific behaviours, being particularly interesting the case of the HeNDs with N = 500 and N = 1000, as in these cases the recombination phenomenon takes place [Movies S4 and S5, respectively (ESI† document)]; see below. For the smallest droplets (N = 100 and 200), the broad character of the Br2(B) wave packet combined with their small sizes induce the formation of a hole crossing the whole droplet. Besides, for the N = 100 case the hole is never closed while for N = 200 a dynamical opening–closing pattern is found [Movies S1 and S2, respectively (ESI† document)]. The HeND with N = 300 represents an intermediate situation between the two behaviours commented before [Movie S3 (ESI† document)] with a photodissociation probability of 0.49 (cf.Table 1).
For the nanodroplet with N = 500 an interesting phenomenon is observed. The leaving part of the bromine wave function reaches the nanodroplet surface at a very low mean velocity. Then, a small part of this wave packet leaves the surface and dissociates, carrying the corresponding kinetic energy. The other fraction, that will not dissociate, remains placed at the surface for a rather long time and then it comes back to the nanodroplet centre, finally leading to recombination. Indeed, this corresponds to a “frontier case” for the recombination process. For the largest HeND considered (N = 1000) a full recombination process takes place, showing a similar behaviour to the N = 500 nanodroplet but without dissociation.
To conclude this key part, which mainly addresses the way photodissociation occurs and how it depends on the nanodroplet size, it is important to consider also one of the main properties obtained from these calculations, i.e., the time scale of the photodissociation process. Since the phenomenology is very rich the time scale depends in a significant way on the situation considered. Nevertheless, for the case of the smaller nanodroplets, where recombination is not present, we can assign photodissociation times of 6.00, 8.55 and 10.88 ps for N = 100, 200 and 300, respectively. These times are substantially larger than those for the Cl2(B) photodissociation (1.14, 1.63 and 2.01 ps, respectively). The lower excess of energy of the bromine molecule after the B ← X excitation and its larger reduced mass when compared with the chlorine system help to understand these results.
3.3. Final velocity distribution and time evolution of other properties
Several relevant properties of the system have been examined here paying attention to the influence of the nanodroplet size on them. The time evolution of the expected value of the relative coordinate, i.e. 〈r〉, is given in Fig. 4 for the different HeND sizes, while the corresponding velocities, i.e. 〈vr〉, are presented in Fig. 5. These plots end at the time when the wave packet begins to be absorbed at the edges of the molecular grid. The temporal evolution of the expected value of the position is really smooth and the effect of the size in the trajectories is evident, even inducing a full recombination for the higher size (N = 1000).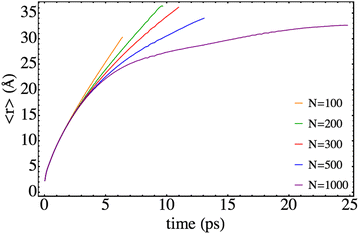 | ||
| Fig. 4 Time evolution of the mean value of the Br–Br relative coordinate for different nanodroplet sizes. | ||
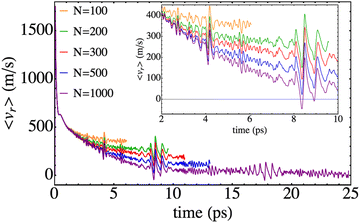 | ||
| Fig. 5 Time evolution of the mean value of the Br–Br relative velocity for different nanodroplet sizes. | ||
Regarding the expected value of the velocity, stronger dependences on time than in the previous property are obtained, which provide additional useful information on the photodissociation process (Fig. 5). It can be seen that in all cases the time evolutions have oscillatory character. This is due to the fact that the 〈vr〉 results arise from the contributions of the bound and non-bound parts of the wave packet. More concretely, the former contribution is the one that generates the oscillations (and will also experience vibrational relaxation for large enough times which are well above the ones considered here32,33). This is the only effect of this part of the wave packet to 〈vr〉 since the position is steady, i.e., it does not change during the time evolution interval investigated. Therefore, leaving out the oscillations, the non-bound (moving) part of the wave packet is the one that generates the 〈vr〉 decreasing trend of the profile that resembles the behaviour obtained in the case of Cl2(B).
Another interesting feature that can be observed in Fig. 5 consists of the existence of localized increases in the amplitude of the oscillations, which are independent of the nanodroplet size. They take place at a time of around 4 ps, 8 ps and 16 ps, respectively. From the analysis of the movies it comes out that the former is due to the splitting of the wave packet. A detailed view of these situations (Fig. 5, inner panel) shows that first a decrease of the velocity is produced that is followed by an increase. This can be interpreted as follows. When the wave packet splits, the fraction of the middle rapidly moves towards the centre of the nanodroplet. Thus, this reduction of the mean velocity is related to the small fraction of the wave packet arriving at the region where the electronic potential plays an important role, decelerating this fraction and so, decreasing the value of the velocity (negative velocity). This is followed by an increase of the velocity when this fraction of the wave packet rebounds from the potential walls.
We now focus on the Br2 total energy, i.e. EBr2, that is defined as the sum of the kinetic energy and the electronic B-state potential energy, which at the initial time is equal to 2133.2 K. This value is 5.3 times less than that for Cl2(B) (11293.4 K). Thus, this fact and the higher mass of bromine compared to chlorine lead to the much lower velocities implied in the present photodissociation. The temporal evolution of this property is represented in Fig. 6. The general profile resembles the one obtained for the chlorine molecule,25 but it is worth noting that in the present study negative EBr2 values can be achieved, since at least a part of the wave packet is placed in the electronic well of the B-excited state (i.e., corresponds to a bound case).
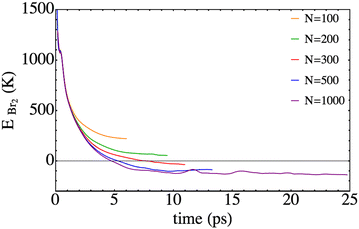 | ||
| Fig. 6 Time evolution of the total energy of Br2, defined as the sum of the Br–Br potential energy in the B-state plus the relative kinetic energy. | ||
To conclude this section, we focus on the final velocity distributions of the bromine atoms, keeping in mind that, as indicated before, the complete wave packet does not leave the nanodroplet and, hence, these distributions correspond only to the leaving fraction. Thus, we adopted a different treatment as that used in the case of the chlorine molecule (where 100% of dissociation is observed), carrying out a flux analysis of the wave packet in the position representation at the edge of the relative coordinate grid, just before the NIP begins to absorb it. An explanation of this procedure is exposed in the Appendix.
The final velocity distributions obtained are plotted in Fig. 7 for a selection of nanodroplet sizes, together with the corresponding one obtained for the gas phase process, using the same theoretical method to describe the molecule. Clearly defined oscillating patterns are found, as in the case of Cl2(B), but with velocities that are much smaller (consistent with the significantly lower excess of energy arising from the B ← X excitation of Br2). For the case of N = 500, it even reached the limit in which there is a probability of Br leaving at almost zero velocity (limit of the bound state). The effect of the nanodroplet is clear: the cage effect highly reduces the velocities of the leaving fragments and induces oscillating structures in the final velocity distribution. The average velocities of the fragments are collected in Table 1.
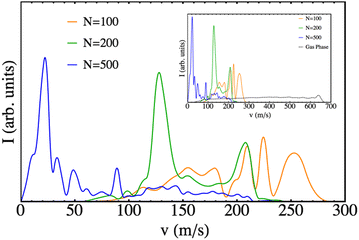 | ||
| Fig. 7 Final velocity distribution of the Br atomic fragments for different nanodroplet sizes. The gas phase results are also shown for the sake of completeness. | ||
The growing importance of the cage effect as the number of He atoms in the nanodroplet increases can be understood from its structure (cf. Fig. S1, ESI†). The empty cavity around the Br2(X) molecule has a radius of 3.8 Å, regardless of the value of N. However, the radius of the nanodroplet depends on N and is equal to 12.2, 15.0, 16.9, 19.7 and 24.3 Å for N = 100, 200, 300, 500 and 1000, respectively. Therefore, the difficulty that helium will offer for the photodissociation of the Br2(B) molecule will increase appreciably with N, because along the dissociation path the molecule will have to interact (and transfer energy) with a larger number of He atoms. Clearly, if the energy transfer from the molecule to the helium is large enough it will not be able to dissociate, as it is observed for N = 1000.
Quantum interferences, probably the most fascinating phenomena in chemical physics, are responsible for these oscillating patterns, as it was also found in the case of Cl2(B).26 Thus, the interaction of the Br2(B) molecule with the helium environment also generates in the early times of the photodissociation quantum interferences. The rich structure (oscillations) produced in the wave packet is much more evident when the wave packet is plotted in the momentum representation. This can be seen in the movies (ESI† document) where oscillations in the wave packet momentum representation begin to be evident at around t = 0.3 ps. This phenomenon, which was described for the first time in the helium nanodroplets for the Cl2(B) case and that was also found in a systematic study on the photodissociation of some “hypothetical” isotopic variants of Cl2,27 probably corresponds to a rather general behavior in these nanodroplets. Unfortunately, the difficulties in investigating this phenomenon experimentally are very large as the nanodroplets are always obtained with a wide distribution of sizes (log-normal distribution).52,53
4. Summary and conclusions
By means of a quantum mechanical hybrid strategy proposed by us, we have studied the motivating case of the Br2 photodissociation dynamics, induced by the B ← X electronic transition, for Br2(ν = 0, X)@(4He)N doped nanodroplets (T = 0.37 K), with N in the interval from 100 up to 1000 4He atoms. The time evolution of helium is described within the TDDFT framework while the time dependent wave packet quantum dynamics is used for the molecule, considering zero angular momentum. As far as we know, this is the second quantum dynamics study available on the photodissociation of molecules in superfluid helium nanodroplets.In general terms, the results obtained for some properties (expected values of the Br2(B) position, velocity and energy vs. time and final Br atom velocity distribution) are qualitatively similar to those reported previously by us for the Cl2(B ← X) related case. In particular, the oscillating Br final velocity distribution also arises from quantum interferences generated in the early times of the photodissociation process, i.e., well before the wave packet reaches the cavity wall. These quantum interferences are more evident if we consider the wave packet in the momentum representation (see the movies in the ESI†).
Nevertheless, strong differences appear in other three key properties: the photodissociation mechanism, photodissociation probability and time scale of the process. These differences arise from the lower excitation energy achieved by the Br2 (B ← X) electronic transition (collision with helium of less sudden character than that for Cl2 (B ← X)) and the higher reduced mass of Br–Br. Thus, the Br2(B) photodissociation dynamics is richer, i.e., significantly more complex than that of Cl2(B), and leads to a substantial probability of non-dissociation: 17, 18, 51, 85 and 100% for N = 100, 200, 300, 500 and 1000, respectively. For chlorine this probability is zero. Besides and also differing from Cl2(B), here there is a fragmentation of the initial wave packet in two parts: a bonded part (located around the minimum of the B potential energy curve) and another, in principle, non-bonded part that progressively moves away from the previous zone and that, eventually, could give rise to dissociation (please note that for N = 500 and N = 1000 the Br–Br recombination probability is large/very large).
Although we are aware of the very large technical difficulties faced by experimentalists in order to obtain a well defined single nanodroplet size, we hope that these results will encourage them to investigate these interesting systems, in which the selected diatomic molecules already played an important role in gas phase spectroscopy.
Author contributions
M. G. designed and supervised the research; A. V. performed the simulations; A. V. and M. G. analysed and discussed the results and they also wrote the paper.Conflicts of interest
There are no conflicts of interest to declare.Appendix
In the Appendix we will briefly show the procedure followed to determine the final velocity distributions of the dissociated atoms using flux analysis. The equations are written for a three dimensional (3D) case but the 1D situation is equivalent.Let ψ be the wave function of the system, and then the associated flux in quantum mechanics is given by the following expression:
 | (A.1) |
This quantity is defined in order to follow a continuity equation (the same as the hydrodynamic equation, eqn (A.2)) in which the probability density is given by the usual quantum mechanics formula (ρ = ψψ*):
 | (A.2) |
This equation provides to flux the usual meaning of the number of particles (or probability) flowing per unit of time and unit of area. This interpretation, in turn, allows us to define the velocity through the relationship:
| j(r,t) = ν(r,t)ρ(r,t) | (A.3) |
Then, to compute the velocity distribution corresponding to the flow of the particle density at a particular point (ranalysis), we have to add the velocity corresponding to some density that crosses the analysis region, but weighted with the density in order to account for the contribution of the corresponding velocity. Therefore, the flux must be time integrated:
 | (A.4) |
Thus, the quantity we are looking for consists of the time integral of the flux at the corresponding regions. In practice, this integral is calculated as a sum and the time spacing is given by the time step employed in the dynamics simulation. At the end, the velocity space must be discretized into bins in order to build the histogram corresponding to the distribution.
Therefore, there is some arbitrariness in doing so that might influence the resulting shape of the distribution. In order to avoid this outcome different binnings have been checked for each distribution obtained until convergence is reached. To illustrate this effect, in Fig. 8, different profiles coming from different binning situations are shown (n indicates the number of intervals used) but sharing the same input data (N = 200 case).
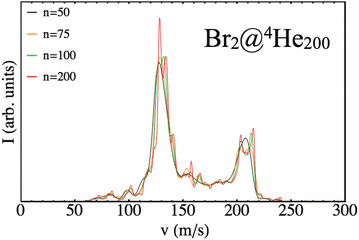 | ||
| Fig. 8 Final velocity distributions of Br arising from different binning cases (n) for a nanodroplet of 200 4He atoms. | ||
This working scheme to compute the velocity distributions is equivalent to the one using the wave packet in the momentum representation, provided the region of analysis is asymptotic enough (i.e., essentially zero interaction potential energy between the atoms and the nanodroplet).
The method used in order to estimate the quality in the flux evaluation and the temporal integration by means of the continuity equation is explained below. Integrating eqn (A.2) in the whole space leads to
 | (A.5) |
 | (A.6) |
 | (A.7) |
 | (A.8) |
Thus, the remaining norm of the wave function added to the temporal integration of the flux crossing the closed limiting surface before the region where the NIP works must be constant and have a unit value. We have determined this quantity for all the calculations obtaining values differing from 1 of the order of 10−3. Therefore, we expect that accurate enough results are obtained in both the flux calculation and the temporal integration.
Acknowledgements
This work was supported by the Spanish Ministry of Science, Innovation and Universities (project ref. MDM-2017-0767) and we also want to acknowledge some support from the Autonomous Government of Catalonia (project ref. 2017SGR 348). Thanks are also given to Professor Satoshi Yabushita (Keio University) for sending us the ab initio data of the Br2 potential energy curves shown in Fig. 1 and Professor Ricardo Mayol (University of Barcelona) for reading the manuscript. We dedicate this work to the memory of Mrs Nieves Pérez García and Mr Darío González García for their permanent support along the years.References
- J. P. Toennies and A. Vilesov, Angew. Chem., Int. Ed., 2004, 43, 2622 CrossRef CAS PubMed
.
- M. Barranco, R. Guardiola, S. Hernández, R. Mayol, J. Navarro and M. Pi, J. Low Temp. Phys., 2006, 142, 1 CrossRef CAS
.
-
A. Slenczka and J. P. Toennies, in Low Temperature and Cold Molecules, ed. I. W. M. Smith, Imperial College Press, London, 2008, pp. 345–392 Search PubMed
.
- S. Yang and A. M. Ellis, Chem. Soc. Rev., 2013, 42, 472 RSC
.
- A. Mauracher, O. Echt, A. M. Ellis, S. Yang, D. K. Bohme, J. Postler, A. Kaiser, S. Denifl and P. Scheier, Phys. Rep., 2018, 751, 1 CrossRef CAS
.
- J. Tiggesbäumker and F. Stienkemeier, Phys. Chem. Chem. Phys., 2007, 9, 4748 RSC
.
- S. Yang, A. M. Ellis, D. Spence, C. Feng, A. Boatwright, E. Latimer and C. Binns, Nanoscale, 2013, 5, 11545 RSC
.
- L. F. Gomez, E. Loginov and A. F. Vilesov, Phys. Rev. Lett., 2012, 108, 155302 CrossRef PubMed
.
- E. Latimer, D. Spence, C. Feng, A. Boatwright, A. M. Ellis and S. Yang, Nano Lett., 2014, 14, 2902 CrossRef CAS PubMed
.
- A. Scheidemann, B. Schilling and J. P. Toennies, J. Phys. Chem., 1993, 97, 2128 CrossRef CAS
.
- B. E. Callicoatt, D. D. Mar, V. A. Apkarian and K. C. Janda, J. Chem. Phys., 1996, 105, 7872 CrossRef CAS
.
- W. K. Lewis, B. E. Applegate, J. Sztáray, B. Sztáray, T. Baer, R. J. Bemish and R. E. Miller, J. Am. Chem. Soc., 2004, 126, 11283 CrossRef CAS PubMed
.
- W. K. Lewis, R. J. Bemish and R. E. Miller, J. Chem. Phys., 2005, 123, 141103 CrossRef PubMed
.
- B. E. Callicoatt, K. Fröde, L. F. Jung, T. Ruchti and K. C. Janda, J. Chem. Phys., 1998, 109, 10195 CrossRef CAS
.
- B. E. Callicoatt, K. Fröde, T. Ruchti, L. Jung, K. C. Janda and N. Halberstadt, J. Chem. Phys., 1998, 108, 9371 CrossRef CAS
.
- T. Ruchti, K. Fröde, B. E. Callicoatt, H. Ludwigs and K. C. Janda, J. Chem. Phys., 1998, 109, 10679 CrossRef CAS
.
- T. Ruchti, B. E. Callicoatt and K. C. Janda, Phys. Chem. Chem. Phys., 2000, 2, 4075 RSC
.
- G. E. Douberly, J. M. Merritt and R. E. Miller, Phys. Chem. Chem. Phys., 2005, 7, 363 RSC
.
- A. Braun and M. Drabbels, J. Chem. Phys., 2007, 127, 114303 CrossRef PubMed
.
- A. Braun and M. Drabbels, J. Chem. Phys., 2007, 127, 114304 CrossRef
.
- A. Braun and M. Drabbels, J. Chem. Phys., 2007, 127, 114305 CrossRef PubMed
.
- B. Thaler, S. Ranftl, P. Heim, S. Cesnik, L. Treiber, R. Meyer, A. W. Hauser, W. E. Ernst and M. Koch, Nat. Commun., 2018, 9, 4006 CrossRef PubMed
.
- B. Thaler, M. Meyer, P. Heim and M. Koch, Phys. Rev. Lett., 2020, 124, 115301 CrossRef CAS PubMed
.
- B. Thaler, P. Heim, L. Treiber and M. Koch, J. Chem. Phys., 2020, 152, 014307 CrossRef CAS PubMed
.
- A. Vilà, M. González and R. Mayol, J. Chem. Theory Comput., 2015, 11, 899 CrossRef PubMed
.
- A. Vilà, M. González and R. Mayol, Phys. Chem. Chem. Phys., 2015, 17, 32241 RSC
.
- A. Vilà and M. González, Phys. Chem. Chem. Phys., 2016, 18, 27630 RSC
.
- A. Vilà, M. González and R. Mayol, Phys. Chem. Chem. Phys., 2016, 18, 2006 RSC
.
- M. Blancafort-Jorquera, A. Vilà and M. González, Phys. Chem. Chem. Phys., 2018, 20, 29737 RSC
.
- A. Vilà and M. González, Phys. Chem. Chem. Phys., 2016, 18, 31869 RSC
.
- M. Blancafort-Jorquera, A. Vilà and M. González, Phys. Chem. Chem. Phys., 2019, 21, 24218 RSC
.
- A. Vilà, M. Paniagua and M. González, Phys. Chem. Chem. Phys., 2018, 20, 118 RSC
.
- M. Blancafort-Jorquera and M. González, Phys. Chem. Chem. Phys., 2021, 23, 25961 RSC
.
- M. Blancafort-Jorquera, A. Vilà and M. González, Phys. Chem. Chem. Phys., 2019, 21, 21007 RSC
.
- A. Vilà, M. González and R. Mayol, Phys. Chem. Chem. Phys., 2016, 18, 2409 RSC
.
- M. Renzler, M. Daxner, L. Kranabetter, A. Kaiser, A. W. Hauser, W. E. Ernst, A. Lindinger, R. Zillich, P. Scheier and A. M. Ellis, J. Chem. Phys., 2016, 145, 181101 CrossRef PubMed
.
- M. P. De Lara-Castells, A. W. Hauser and A. O. Mitrushchenkov, J. Phys. Chem. Lett., 2017, 8, 4284 CrossRef CAS PubMed
.
- A. W. Hauser and M. P. de Lara-Castells, Phys. Chem. Chem. Phys., 2017, 19, 1342 RSC
.
- A. Castillo-García, A. W. Hauser, M. P. de Lara-Castells and P. Villarreal, Molecules, 2021, 26, 5783 CrossRef
.
- J. Poms, A. W. Hauser and W. E. Ernst, Phys. Chem. Chem. Phys., 2012, 14, 15158 RSC
.
- A. W. Hauser, A. Volk, P. Thaler and W. E. Ernst, Phys. Chem. Chem. Phys., 2015, 17, 10805 RSC
.
- F. Dalfovo, A. Lastri, L. Pricaupenko, S. Stringari and J. Treiner, Phys. Rev. B: Condens. Matter Mater. Phys., 1995, 52, 1193 CrossRef CAS PubMed
.
- D. Mateo, A. Hernando, M. Barranco, E. Loginov, M. Drabbels and M. Pi, Phys. Chem. Chem. Phys., 2013, 15, 18388 RSC
.
- N. B. Brauer, S. Smolarek, E. Loginov, D. Mateo, A. Hernando, M. Pi, M. Barranco, W. J. Bruma and M. Drabbels, Phys. Rev. Lett., 2013, 111, 153002 CrossRef PubMed
.
- D. Mateo, F. Gonzalez and J. Eloranta, J. Phys. Chem. A, 2015, 119, 2262 CrossRef CAS PubMed
.
- Y. Asano and S. Yabushita, Chem. Phys. Lett., 2003, 372, 348 CrossRef CAS
.
- Q. Chao-Chao, H. Yan and P. Yu-Feng, Acta Phys. Sin., 2017, 66, 193301 CrossRef
.
- A. Valdés, R. Prosmiti, P. Villarreal and G. Delgado-Barrio, Mol. Phys., 2004, 102, 2277 CrossRef
.
- A. García-Vela, J. Phys. Chem. A, 2005, 109, 5545 CrossRef PubMed
.
- A. Vibók and G. G. Balint-Kurti, J. Phys. Chem., 1992, 96, 8712 CrossRef
.
- J. Williams, A. Rohrbacher, J. Seong, N. Marianayagam, K. C. Janda, R. Burcl, M. M. Szcześniak, G. Chałasiński, S. M. Cybulski and N. Halberstadt, J. Chem. Phys., 1999, 111, 997 CrossRef CAS
.
- M. Lewerenz, B. Schilling and J. P. Toennies, Chem. Phys. Lett., 1993, 206, 381 CrossRef CAS
.
- J. Harms, J. P. Toennies and F. Dalfovo, Phys. Rev. B: Condens. Matter Mater. Phys., 1998, 58, 3341 CrossRef CAS
.
Footnote |
| † Electronic supplementary information (ESI) available. See DOI: https://doi.org/10.1039/d2cp02984g |
| This journal is © the Owner Societies 2022 |

