
 Open Access Article
 This Open Access Article is licensed under a Creative Commons Attribution-Non Commercial 3.0 Unported Licence
A novel cerium(III)–isatin Schiff base complex: spectrofluorometric and DFT studies and application as a kidney biomarker for ultrasensitive detection of human creatinine†
Sheta M. Sheta *a,
Magda A. Aklb,
Heba E. Saadb and
El-Sayed R. H. El-Gharkawyb
*a,
Magda A. Aklb,
Heba E. Saadb and
El-Sayed R. H. El-Gharkawyb
aInorganic Chemistry Department, National Research Centre, 33, El-Behouth St., Dokki, Giza, 12622, Egypt. E-mail: dr.sheta.nrc@gmail.com; Fax: +20-2-33370931; Tel: +20-1009697356
bChemistry Department, Faculty of Science, Mansoura University, Mansoura, Dakahlia 35516, Egypt
First published on 5th February 2020
Abstract
In this paper, a new isatin-Schiff base L1 was prepared via a simple reaction of isatin with 2-amino-3-hydroxypyridin. Subsequently, cerium(III)-Schiff base complex C1 was obtained through the reaction of the prepared Schiff base L1 with cerium chloride via a hydrothermal method. The prepared L1, as well as C1, were fully characterized using many spectroscopic techniques, such as mass spectra, elemental analysis, UV-vis, FT-IR, 1H-NMR, 13C-NMR, FE-SEM/EDX, and HR-TEM. A photoluminescence study (PL) was carried out for the prepared complex C1. The promising photoluminescence results revealed that C1 could be used for the detection of creatinine in different human biological samples as a selective optical biosensor. The results showed that C1 after excitation at 370 nm has a strong emission band at 560 nm. The calibration graph was obtained in a wide concentration range between 2.5 and 480 nM creatinine with limits of detection (LOD) and quantitation (LOQ) of 1.07 and 3.25 nM, respectively. In addition, the correlation coefficient (r2) was found to be 0.9890. The PL spectra indicate that C1 has high selectivity toward creatinine without interference from other different analytes and can be successfully used as an optical sensor for creatinine detection. The mechanism of quenching between the Ce(III) complex and creatinine was a dynamic type. The geometry of Schiff base L1 and its cerium(III) complex C1 was proven by using density functional theory (DFT). The energy of the LUMO and HOMO, energy gap, dipole moment and structure–activity relationship were determined and confirmed.
Introduction
Cerium complexes have a wide range of applications in miscellaneous fields because of their significant electromagnetic properties.1 These complexes have an excessive influence in the fields of optics, physics, and engineering.1 They can be used as electroluminescence devices2 and bio-makers,3 they are imperative for the fabrication of optical waveguides4 and metamaterials, and they possess numerous applications, such as in antenna,5 photo-detection,6 light-emitting diodes, laser diodes and cloaking devices.7,8 Organic Ce(III) complexes are recognized to emit in the UV to green region, between 300 and 550 nm, with their emission wavelength being tunable through selection of appropriate ligands.8,9 Benefited by such tunability, the above complexes can be used as light sources. This is a protuberant characteristic of Ce(III) complexes in contrast to conservative complexes of lanthanides, such as Eu(III) and Tb(III), which emit in the green and orange region, correspondingly, due to their 4f–4f transitions.10Compared to complexes of lanthanides that display a 4f–4f transition,10 the spin allowed 4f–5d transitions in the Ce(III) complexes are predicted to result in enormous emission quantum yields (Φem), as well as a short emission lifetime (τem). Also, if the complexes with 4f–4f transitions work as an emitter, a suitable ligand structure must be selected. In practice, the modification of the structures of the ligands, such as the substitution of C–H bonds with C–D and C–F bonds, can be carried out to gain great Φem values.11 In contrast, Ce(III) complexes are approximately free from such limitations in the selection of ligands. One of the small restrictions of these species is that the coordination of solvents with hydroxyl-functionalities to Ce(III) may modify the structure of the complex, which should be avoided.12
On the other hand, Schiff bases create a significant category of organic compounds with an extensive range of biological properties, including cytotoxic, anticancer, and antifungal activities.13–15 Different derivatives of isatin are known to have an extensive variety of pharmacological properties.16 Among those paramount pharmacological effects are antibacterial,17 antifungal,8 antiviral18 and anti-HIV17 activity.
Creatine (2-amino-1-methyl-5H-imidazol-4-one)19 is metabolized into creatinine in tissues and organs, and adenosine triphosphate is known to take part in this conversion. Before this step, creatine is synthesized mainly in the pancreas, liver, and kidneys.20 Creatinine is a chemical waste product of normal muscle function in the blood that passes through the kidneys to be purified and removed in the urine. The levels of creatinine in the blood reflect both the amount of muscle a person has and their amount of kidney function.21 Around 95% of the creatine in the human body is stored in skeletal muscle and 5% is in the brain, so it is a source of energy for muscle activity and the brain.22 Most men with normal kidney function have approximately 60 to 110 μM of creatinine and women with normal kidney function have between 45 and 90 μM of creatinine. Serum creatinine allows us to dictate the glomerular filtration rate (GFR).23 Creatinine clearance (Ccr) measures how well the kidneys filter waste and can be determined after evaluating serum creatinine and calculating GFR.
The most popular methods used for the analysis of creatinine are based on colorimetry or enzymatic colorimetric methods by Jaffé's reaction,24 chromatographic methods,25 LC-UV,26 low-capacity cation-exchange chromatography,27 UV/vis spectrophotometry of a copper/creatinine complex,28 amperometric methods,29 electrochemical impedance spectroscopy30 and cyclic voltammetric methods.31
Herein, we report a Ce-complex C1, which was constructed from the reaction of Schiff base L1 and cerium chloride by a hydrothermal method. Schiff base L1 is prepared via the reaction of isatin with 2-amino-3-hydroxypyridin by a simple method. This complex shows strong emission at room temperature after excitation at 370 nm. Its emission is efficiently quenched by the addition of creatinine in the presence of other different interfering analytes. The molecular structures of L1 and C1 were theoretically studied using DFT calculations. These final data indicate that C1 can be used as an outstanding optical biosensor for simple, fast, low-cost and highly specific and selective detection of creatinine.
Results and discussion
Characterization of Schiff base L1 and Ce(III)-complex C1
The Schiff base ligand L1 and Ce(III) complex C1 were prepared easily in two systems according to Scheme 1. Both L1 and C1 are highly colored compounds, soluble in DMSO and DMF, non-hygroscopic in nature and stable in air. The most essential physical data for the prepared compounds are provided in Table 1.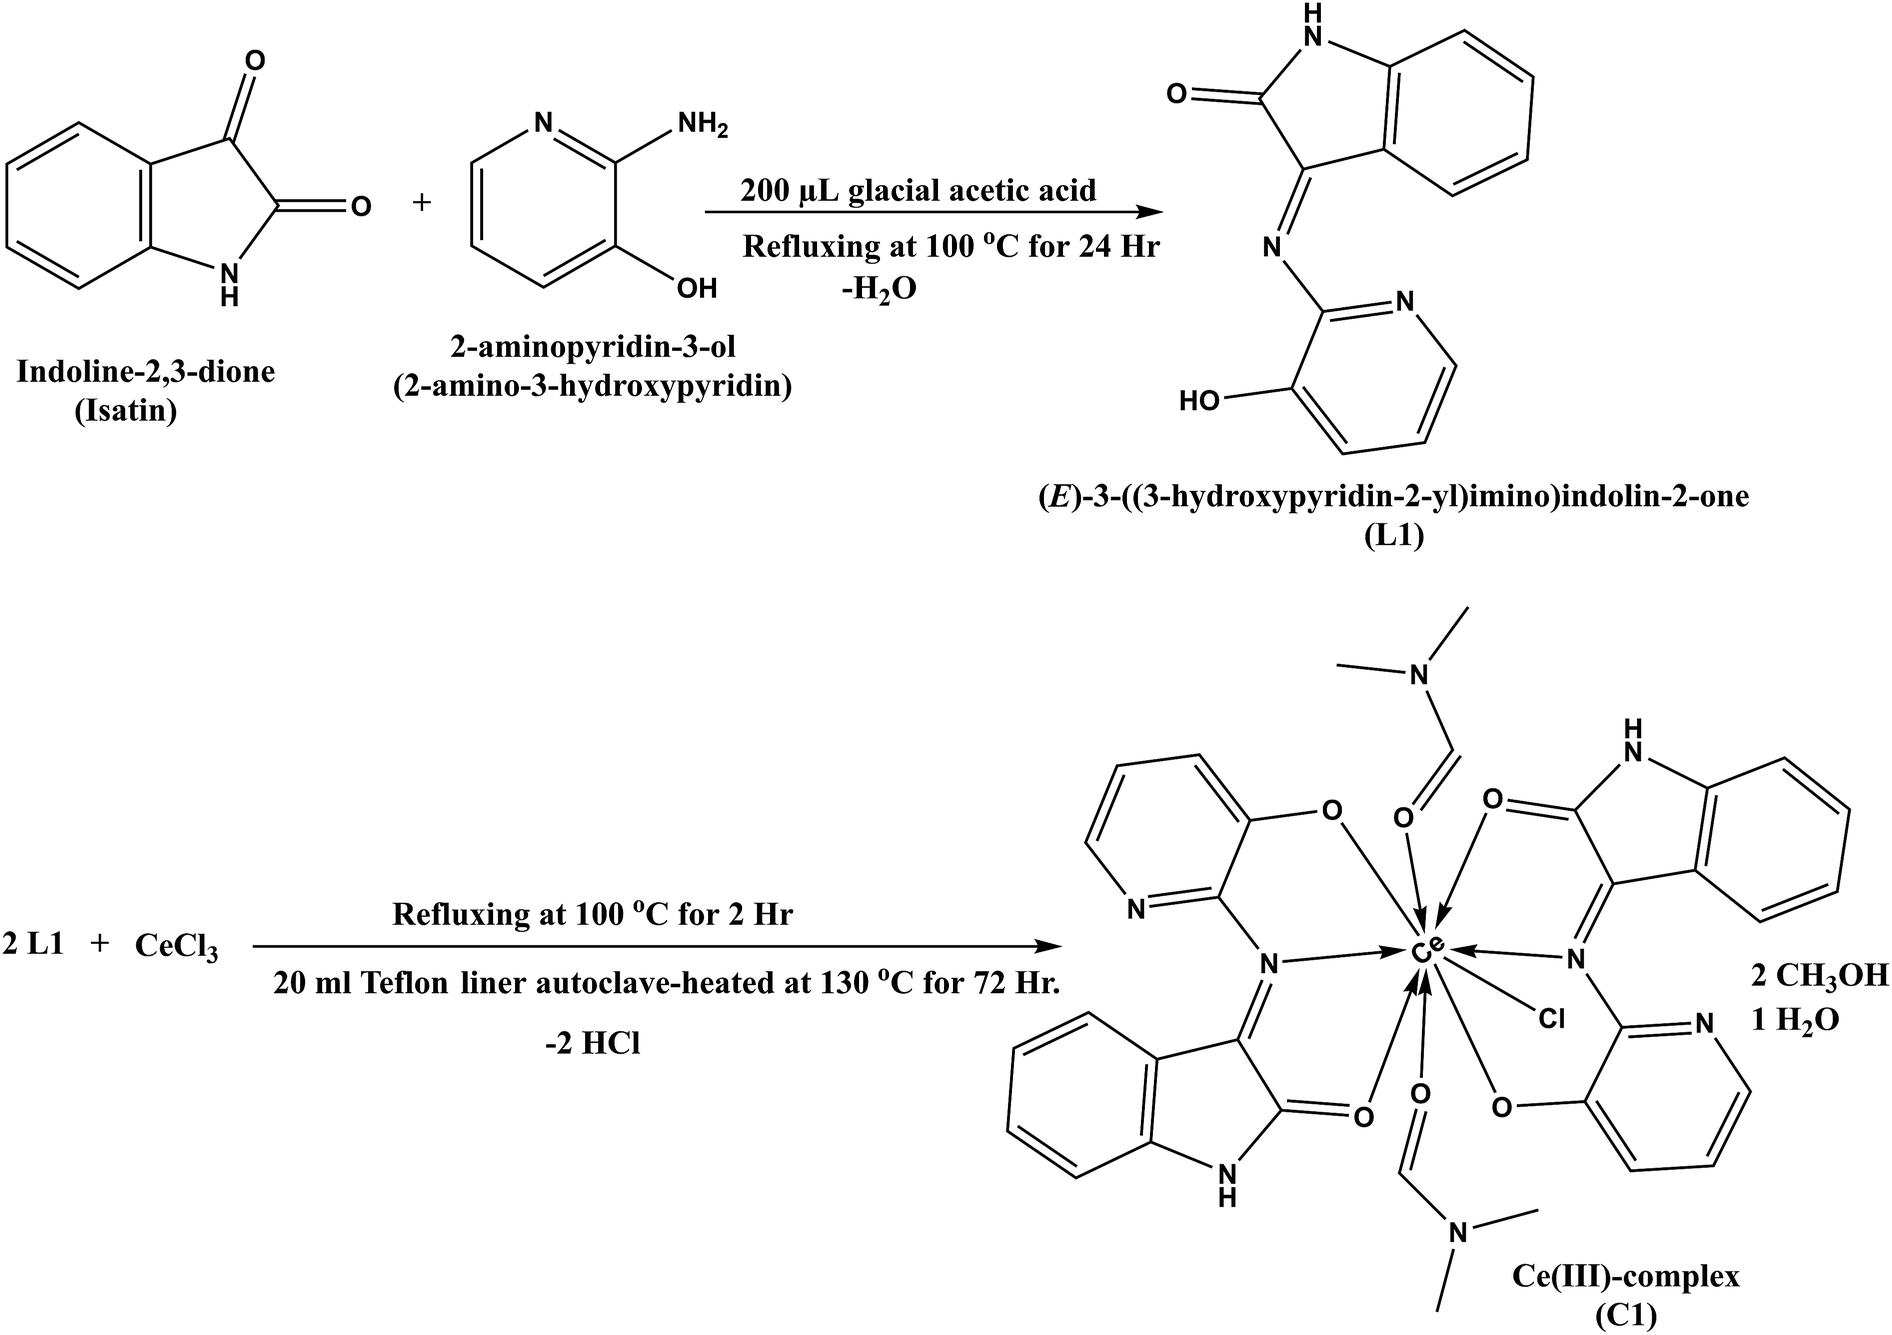 | ||
| Scheme 1 The proposed scheme of the reaction of Schiff base L1, and Ce(III)-complex C1. | ||
| Assignments | L1 | C1 | |
|---|---|---|---|
| Preparation method | Reflux | Hydrothermal | |
| Color | Light green | Dark green | |
| Aspect | Powder | Fine crystal | |
| Melting point (°C) | 113 | >300 | |
| Reaction time | 1 days | 3 days | |
| Yield (%) | 78.0 | 70.8 | |
| Chemical formula | C13H9N3O2 | C34H40CeClN8O9 | |
| Molecular weight (g mol−1) | 239.23 | 880.31 | |
| Elemental analysis (calc.)/found | C% | (65.27)/64.95 | (46.39)/46.62 |
| H% | (3.79)/3.54 | (4.58)/4.85 | |
| N% | (17.56)/16.92 | (12.73)/12.52 | |
| Characteristic infrared frequencies (cm−1) | ν(OH) | 3640–3300 | 3675–3250 |
| ν(NH) | 3120 | 3062 | |
ν(C![[double bond, length as m-dash]](https://www.rsc.org/images/entities/char_e001.gif) O) O) |
1618 | 1621 | |
| ν(CN) |
1704 | 1712 | |
| ν(C–N) | 1390 | 1353 | |
| ν(CC) |
1457 | 1465 | |
| ν(C–H) | 2930 | 2779 | |
| ν(Ce–O) | — | 665 | |
| ν(Ce–N) | — | 527 | |
| UV-λmax (nm) | 365, 449, 642 | 357, 400, 532, 630 | |
Elemental analysis
The elemental analysis of both L1 and C1 is presented in Table 1. The obtained results were in agreement with those calculated for the suggested formula. Anal. calc. (%): for ligand L1; C13H9N3O2; (239.23 g mol−1); C, 65.27; H, 3.79; N, 17.56; found C, 64.95; H, 3.54; N, 16.92. And for the cerium(III)-complex C1; C34H40CeClN8O9; (880.31 g mol−1); C, 46.39; H, 4.58; N, 12.73; found C, 46.62; H, 4.85; N, 12.52.FT-IR spectra
The most significant frequencies of both L1 and C1 in the FT-IR spectra are presented in Fig. S1 (ESI†) and Table 1. Both spectra were in adequate agreement. L1 exhibits a broad absorption band in the range from 3640–3300 cm−1, which can be assigned to the ν(OH) of the alcohol. The band at 3120 cm−1 is attributed to the ν(NH) vibrations of the ring of indole. The broadband between 1754 and 2010 cm−1 centered at 1900 cm−1 can be attributed to aromatic sp2 C–H bending patterns. The two bands at 1618 and 1704 cm−1 can be attributed to ν(CO) of the isatin moiety and ν(CN), correspondingly. The band detected at 1390 cm−1 is due to ν(C–N) groups. The bands at 1457 and 2930 cm−1 are assigned to ν(CC) groups and ν(C–H) groups, respectively.32 On the other hand, the FT-IR spectrum of C1 indicates the bonding association of the ligand with the metal ion. In contrast to the spectrum of the free ligand L1, in that of C1, we observed that there is a significant shift for the ν(OH), ν(NH), ν(CN) and ν(C–N) vibrations. Meanwhile, the ν(CO) and ν(CC) vibrations stay more or less in the same place, which indicates that (CC) does not contribute to coordination with the metal ion. Therefore, L1 acts as a neutral bidentate coordination site via ν(OH), (C–N), (CO) and azomethine nitrogen (CN) atoms. This observation is additionally supported by new bands that were found in the 665 and 527 cm−1 regions assigned to ν(Ce–O) and ν(Ce–N), respectively.33
UV-vis spectra
The electronic absorption spectra of the ligand and its metal complex observed in DMF at room temperature are provided in Fig. S2 (ESI†). From this figure, it can be established that L1 reveals three absorption bands at 365, 449, and 642 nm, which were assigned to intra ligand charge transfer (n–π* and π–π*). Meanwhile, C1 reveals four absorption bands at 357, 400, 532, and 630 nm, which were assigned to ligand–metal charge transfer transitions (LMCT) and intra-ligand charge transfers (n–π* and π–π*).341H-NMR spectra
The 1H-NMR spectrum of the ligand L1 (Fig. S3; ESI†) showed two signals at 10.21 and 9.58 ppm corresponding to NH and OH, respectively. The signals that appeared at 8.28, 7.29 and 7.21 ppm can be assigned to the phenyl ring protons. Benzene ring proton signals are noticed as a multiplet in the range of 6.94–7.43 ppm. The signals at 2.87 and 1.89 ppm are attributed to OH and CH3 protons of methanol. Meanwhile, the 1H-NMR spectrum of the Ce-complex C1 (Fig. S4; ESI†) shows a signal of OH at 11.41 ppm. The signals appearing at 8.28, 7.29 and 7.21 ppm are attributed to protons of the phenyl ring, but the multiplet signals in the range of 7.77–6.94 ppm can be attributed to the protons of a benzene ring. The signals at 2.91 and 8.02 ppm conform to the CH3 and CHO of the DMF solvent, and the signal at 2.11 ppm can be assigned to MOH.3513C-NMR spectra
The 13C-NMR spectrum of L1 (Fig. S5; ESI†) shows two signals at 170 and 159.6 ppm corresponding to the (CO) and (CN) groups of the phenyl ring. The signals that are observed at 156 and 148.6 ppm belong to the (CC) groups of the benzene ring, but the bands of DMSO and alcohol appeared in the range of 50–34 ppm. Meanwhile, the 13C-NMR spectrum of C1 (Fig. S6; ESI†) shows signals at 155, 140 and 138 ppm attributable to (CO), the carbonyl group of the DMF solvent and (CN), respectively. The signals appearing at 135 and 130 ppm belong to the phenyl ring, while the signals at 115 to 122 ppm correspond to the benzene ring. The signals appearing at 40 and 45 ppm correspond to MOH and the DMF solvent.
Mass spectra
The electron impact mass spectra of L1 and C1 were recorded and investigated at 70 eV of electron energy. Fig. S7 and Scheme S1 (ESI†) show the mass spectrum and the proposed fragmentation of L1, respectively. It is noted that the molecular ion peaks are in respectable correspondence with their suggested empirical formulae as indicated from elemental analysis. The mass spectrum fragmentation mode of the ligand demonstrates the exact mass of 239.68 (theoretically calculated was 239.23 g mol−1) conforming to the formula C13H9N3O2 (Fig. S7; ESI†). The ion of m/z = 239.68 undergoes fragmentation to a stable peak at m/z = 146.22 (theoretically calculated as 146.15 g mol−1) by losing C5H5NO atoms as shown in Scheme S1 (ESI†). The breaking of the CN bond leads to the fragmentation with m/z = 148.16. The loss of C2H4N2O atoms leads to the fragmentation with m/z = 78.11. The loss of NH2 leads to the fragmentation with m/z = 57.05. A breakdown of L1 gives the fragments in Scheme S1 (ESI†). In addition, Fig. S8 and Scheme S2 (ESI†) show the mass spectrum and the suggested fragmentation of C1, respectively. The mass spectrum fragmentation mode of the complex shows the exact mass of 880.54 (theoretically calculated as 880.31 g mol−1) conforming to the formula C34H40CeClN8O9 (Fig. S8; ESI†). The ion of m/z = 880.54 undergoes fragmentation to a stable peak at m/z = 652.94 by losing two molecules of MOH and DMF and one molecule of H2O as presented in Scheme S2 (ESI†). The loss of C13H9N3O2 atoms leads to the fragmentation with m/z = 413.79. The loss of the (Ce–Cl) bond leads to the fragmentation with m/z = 239.23. The loss of C5H5NO atoms leads to the fragmentation with m/z = 146.15. The loss of C2H3NO atoms leads to fragmentation with m/z = 93.13. A breakdown of the backbone of the complex gives the fragments in Scheme S2 (ESI†). Generally, the subsequent fragmentations of both L1 and C1 were inconsistent and fully agree with the molecular weight of the offered structures.FE-SEM/EDX
The FE-SEM images and EDX analysis of L1 and C1 are shown in Fig. 1. L1 in Fig. 1a and b exhibited the morphology of distributed overlapping sheets; while C1 in Fig. 1d and e appeared to exhibit a macrospore shape with an average pore size of 75 nm. In addition, the EDX mapping of L1 and C1 is shown in Fig. 1c and f, respectively.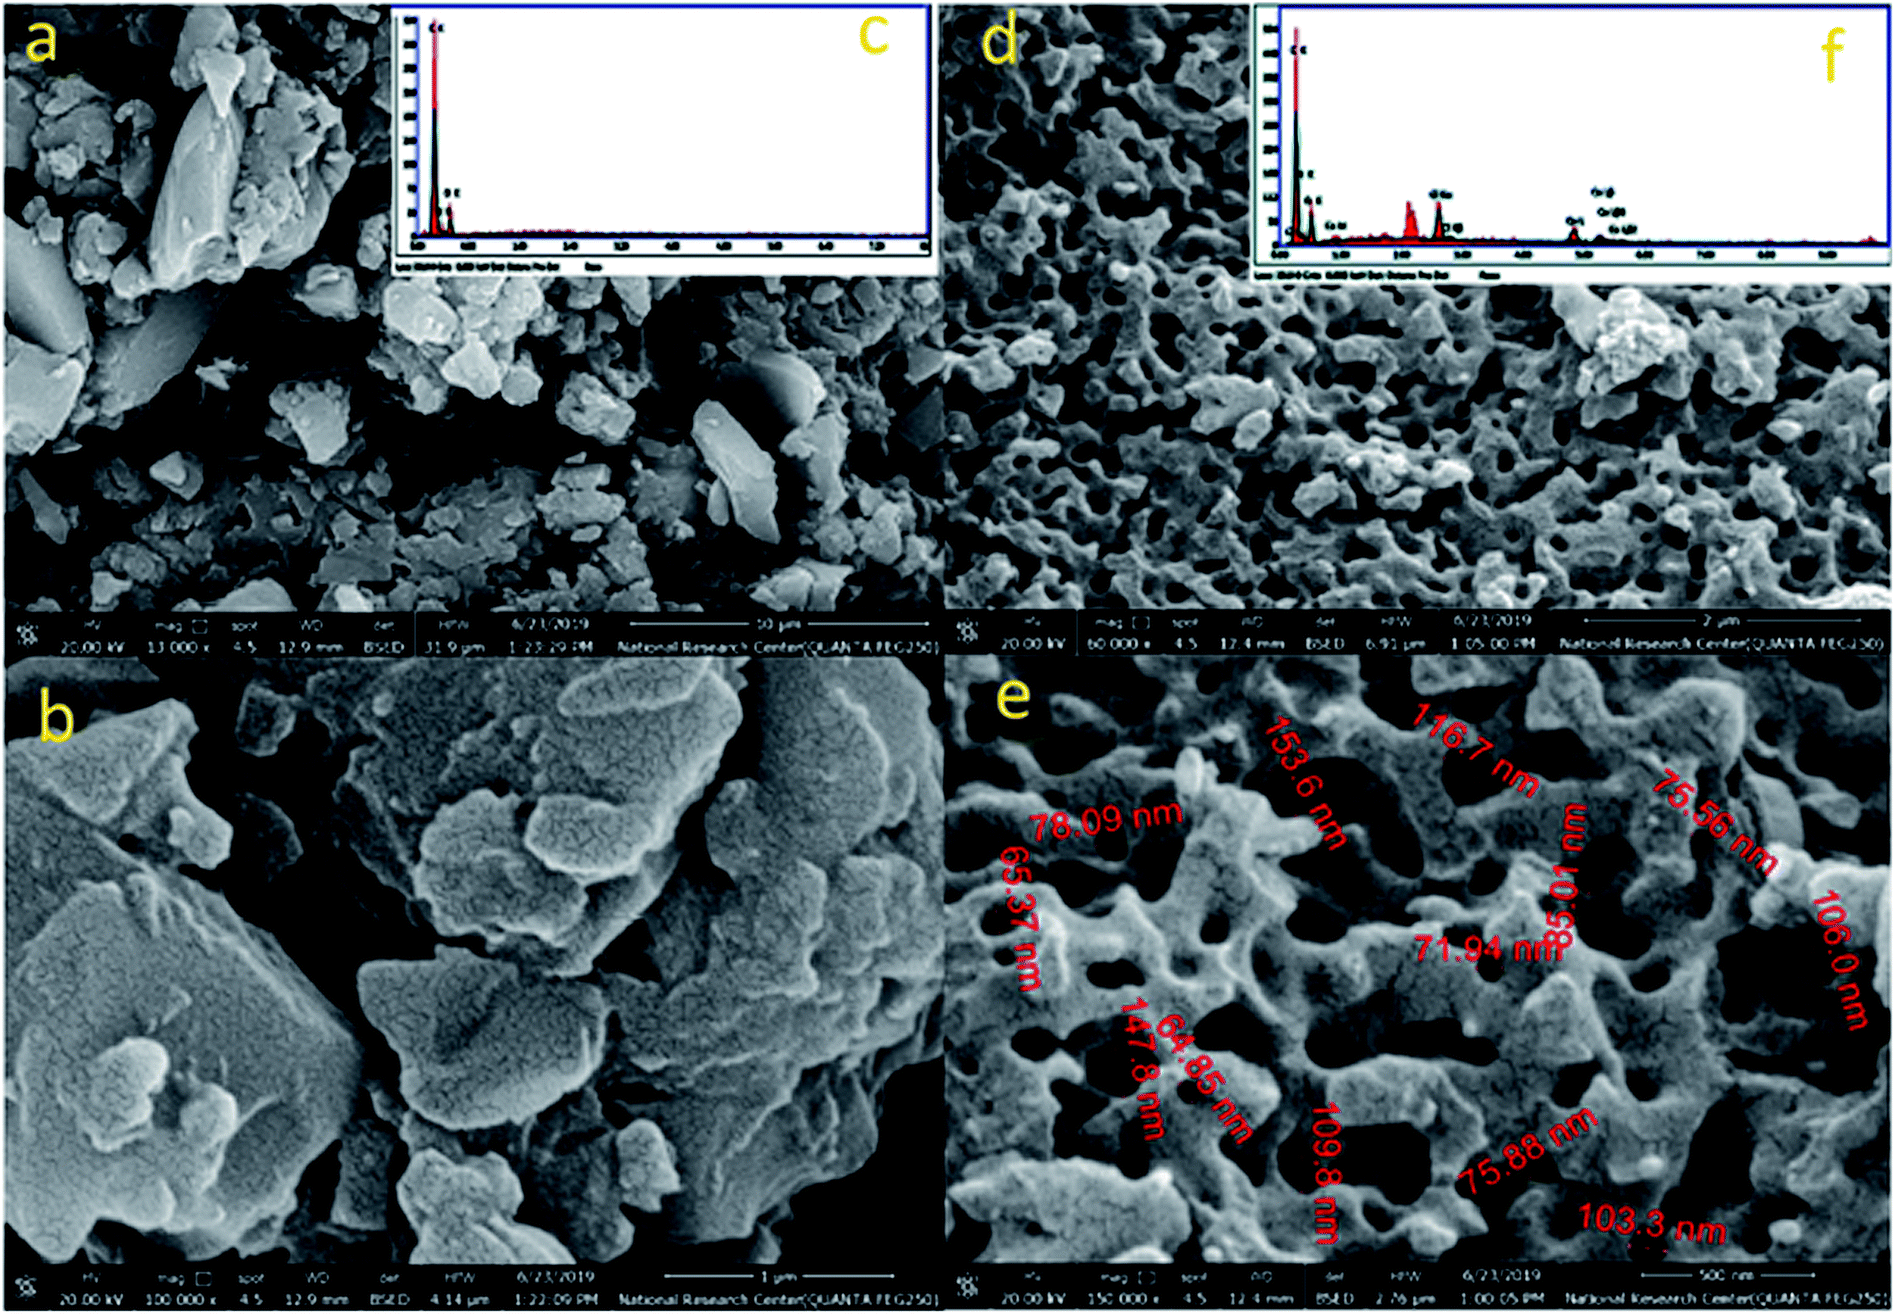 | ||
| Fig. 1 SEM and EDX images: [a–c] Schiff base L1, and [d–f] Ce(III)-complex C1. | ||
The EDX mapping showed the presence of carbon, nitrogen, and oxygen as the constructing block elements in L1, and cerium, carbon, nitrogen, chlorine, and oxygen as the constructing block elements in the distinctive particles for C1. Based on the beneficial results obtained and the good L1 and C1 distribution noticed from the SEM images, as well as the results obtained from the EDX analysis, the formation of C1 was confirmed. Additionally, the EDX mapping confirmed our explanations and these results matched with those gained by elemental analysis and with those calculated theoretically for L1; C, 65.27; N, 17.56; and O, 17.17; found: C, 65.95; N, 17.57; and O, 16.48 (Table S1; ESI†); and for C1; C, 46.39; N, 12.73; O, 16.36; Cl, 4.03; and Ce, 15.92; found: C, 47.0; N, 13.68; O, 18.49; Cl, 4.24; and Ce, 16.59 (Table S2; ESI†).
TEM
Transmission electron microscope (TEM) images for L1 and C1 are presented in Fig. 2a and b, respectively. The morphology of the ligand L1 shown in Fig. 2a was distributed overlapping sheets, while the morphology of Ce-complex C1 shown in Fig. 2b was a well-overlapping macrospore shape. The data obtained from the TEM pattern were fairly comparable and in good correspondence with the data obtained from FE-SEM. | ||
| Fig. 2 TEM image of: [a] Schiff base L1, and [b] Ce(III)-complex C1. | ||
Based on the physical and spectral information of L1 and C1 discussed, we can assume that the structures of L1 and C1 are as suggested in Fig. 3a and b, respectively. Some representative bond distances of the optimized structures are provided in Table S3 (ESI†). In addition, the cartesian coordinates of the optimized structures are provided in Tables S4 and S5 (ESI†).
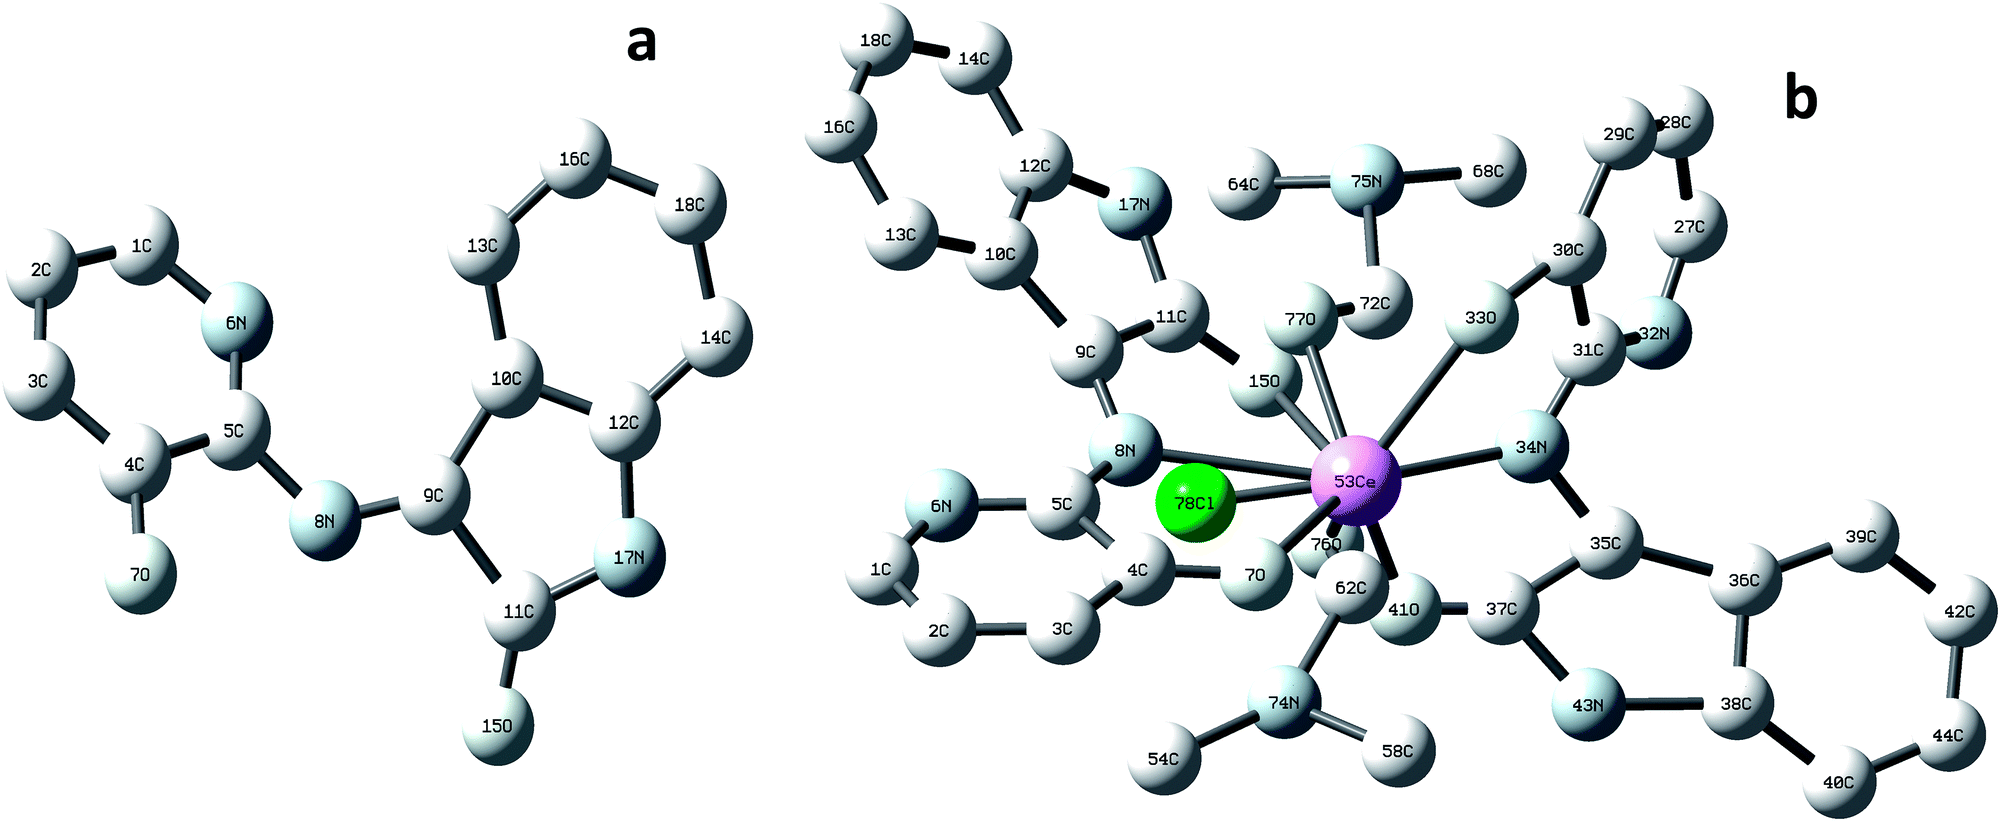 | ||
| Fig. 3 Optimized structures of [a] Schiff base L1, and [b] Ce(III)-complex C1. | ||
Theoretical and computational methods
Geometry optimizations and other DFT calculations were performed on the Schiff base L1 and its cerium(III) complex C1. DFT is considered a cost-effective method to approximate electron correlation effects. All DFT calculations were performed by using the B3LYP level of theory, Becke's three parameter (B3) nonlocal exchange with the correlation functional of Lee, Yang, and Parr (LYP).36 Nowadays, the B3LYP level is currently widely used to study organic electronic compounds because the predicted geometries are very reliable and provide good estimations for the HOMO–LUMO gaps, in good agreement with experimental values. All of the calculations were carried out at the B3LYP/6-31g(d) level for all atoms, except Ce atoms were described by using the CEP-4g basis set.37 All computations were carried out by using the Gaussian09 suite of programs.38 The Gauss View 5.0 package was used to obtain various graphic views of molecular shapes of distinctive molecular orbitals.DFT calculations
The major elements of augmented geometry of the Ce(III) complex seem to have an octahedral geometry, Fig. 3b. The highest occupied molecular orbitals (HOMOs) and lowest unoccupied molecular orbitals (LUMOs) are actual substantial elements of the theoretical molecular sketch.39 Fig. 4 represents the HOMO and LUMO of L1 and C1; the HOMO is the donor site for the electrons and the LUMO is the acceptor site of the electrons. The molecular softness and hardness of any compound can be expected from the gap between the HOMO and LUMO.40 Soft molecules have a small energy gap (Eg), whereas hard molecules have enormous (Eg) values.41,42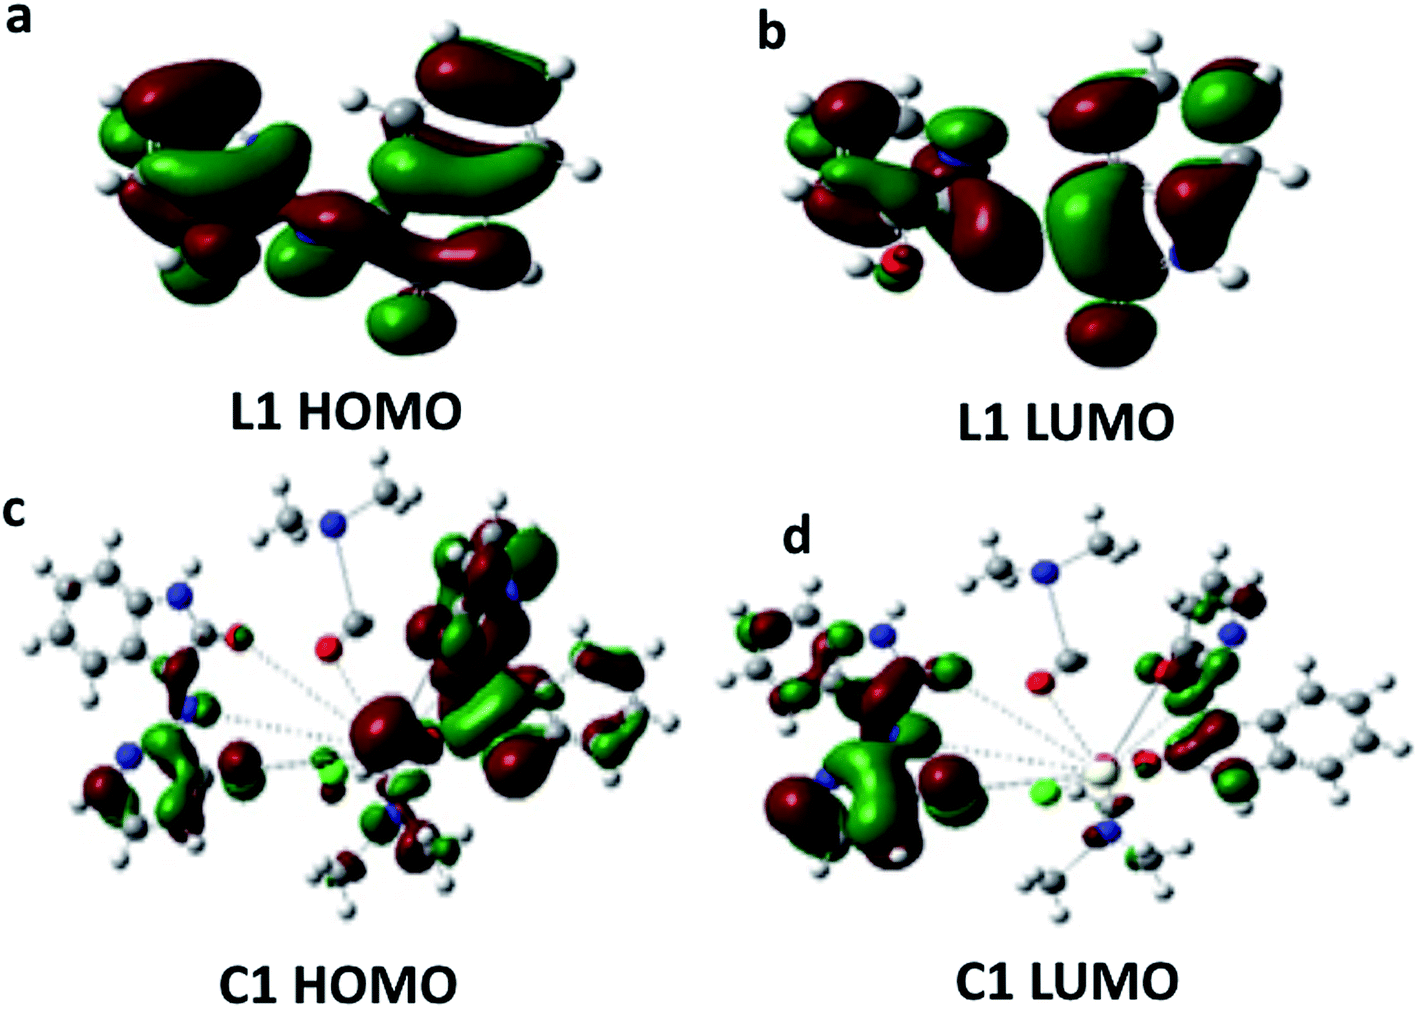 | ||
| Fig. 4 HOMO and LUMO energy level images of: [a and b] Schiff base L1, and [c and d] Ce(III)-complex C1. | ||
From the calculations of Eg, C1 was found to be more reactive than L1. The charge separation (polarity) over the molecule, which is calculated from the dipole moment (μ), illustrates that the μ of C1 is higher than the μ of L1 (μC1 > μL1). Moreover, it was noticed that there is a transfer of charge density from L1 atoms to the metal ion (Ce). In addition, there is a back-donation of electrons from the cerium ion to the Schiff base donating atoms after the complexation process. The greater reactivity of C1 over L1 is described by the difference in Eg, which determines the reactivity; as the Eg increases, the reactivity decreases and hence the quantity of electronic charge transfer from L1 to C1 (central cerium metal ion) increases. The EHOMO, ELUMO, Eg, and μ of L1 and C1 are recorded in Table 2.
| Parameter | L1 | C1 |
|---|---|---|
| EHOMO (eV) | −5.81 | −4.85 |
| ELUMO (eV) | −2.29 | −2.97 |
| Egap (eV) | 3.52 | 1.88 |
| μ (D) | 4.42 | 4.84 |
Photoluminescence study and applications
The photoluminescence of Ce-complex C1 was reported at different wavelengths of excitation as revealed in Fig. 5a. To establish the optimal wavelength for photoluminescent excitation, excitation spectra were first obtained by measuring emission at the maximum intensity wavelength. From Fig. 5a it was realized that C1 had a high emission peak at 560 nm after excitation at 370 nm. The excitation and emission spectra of C1 are shown in Fig. 5b.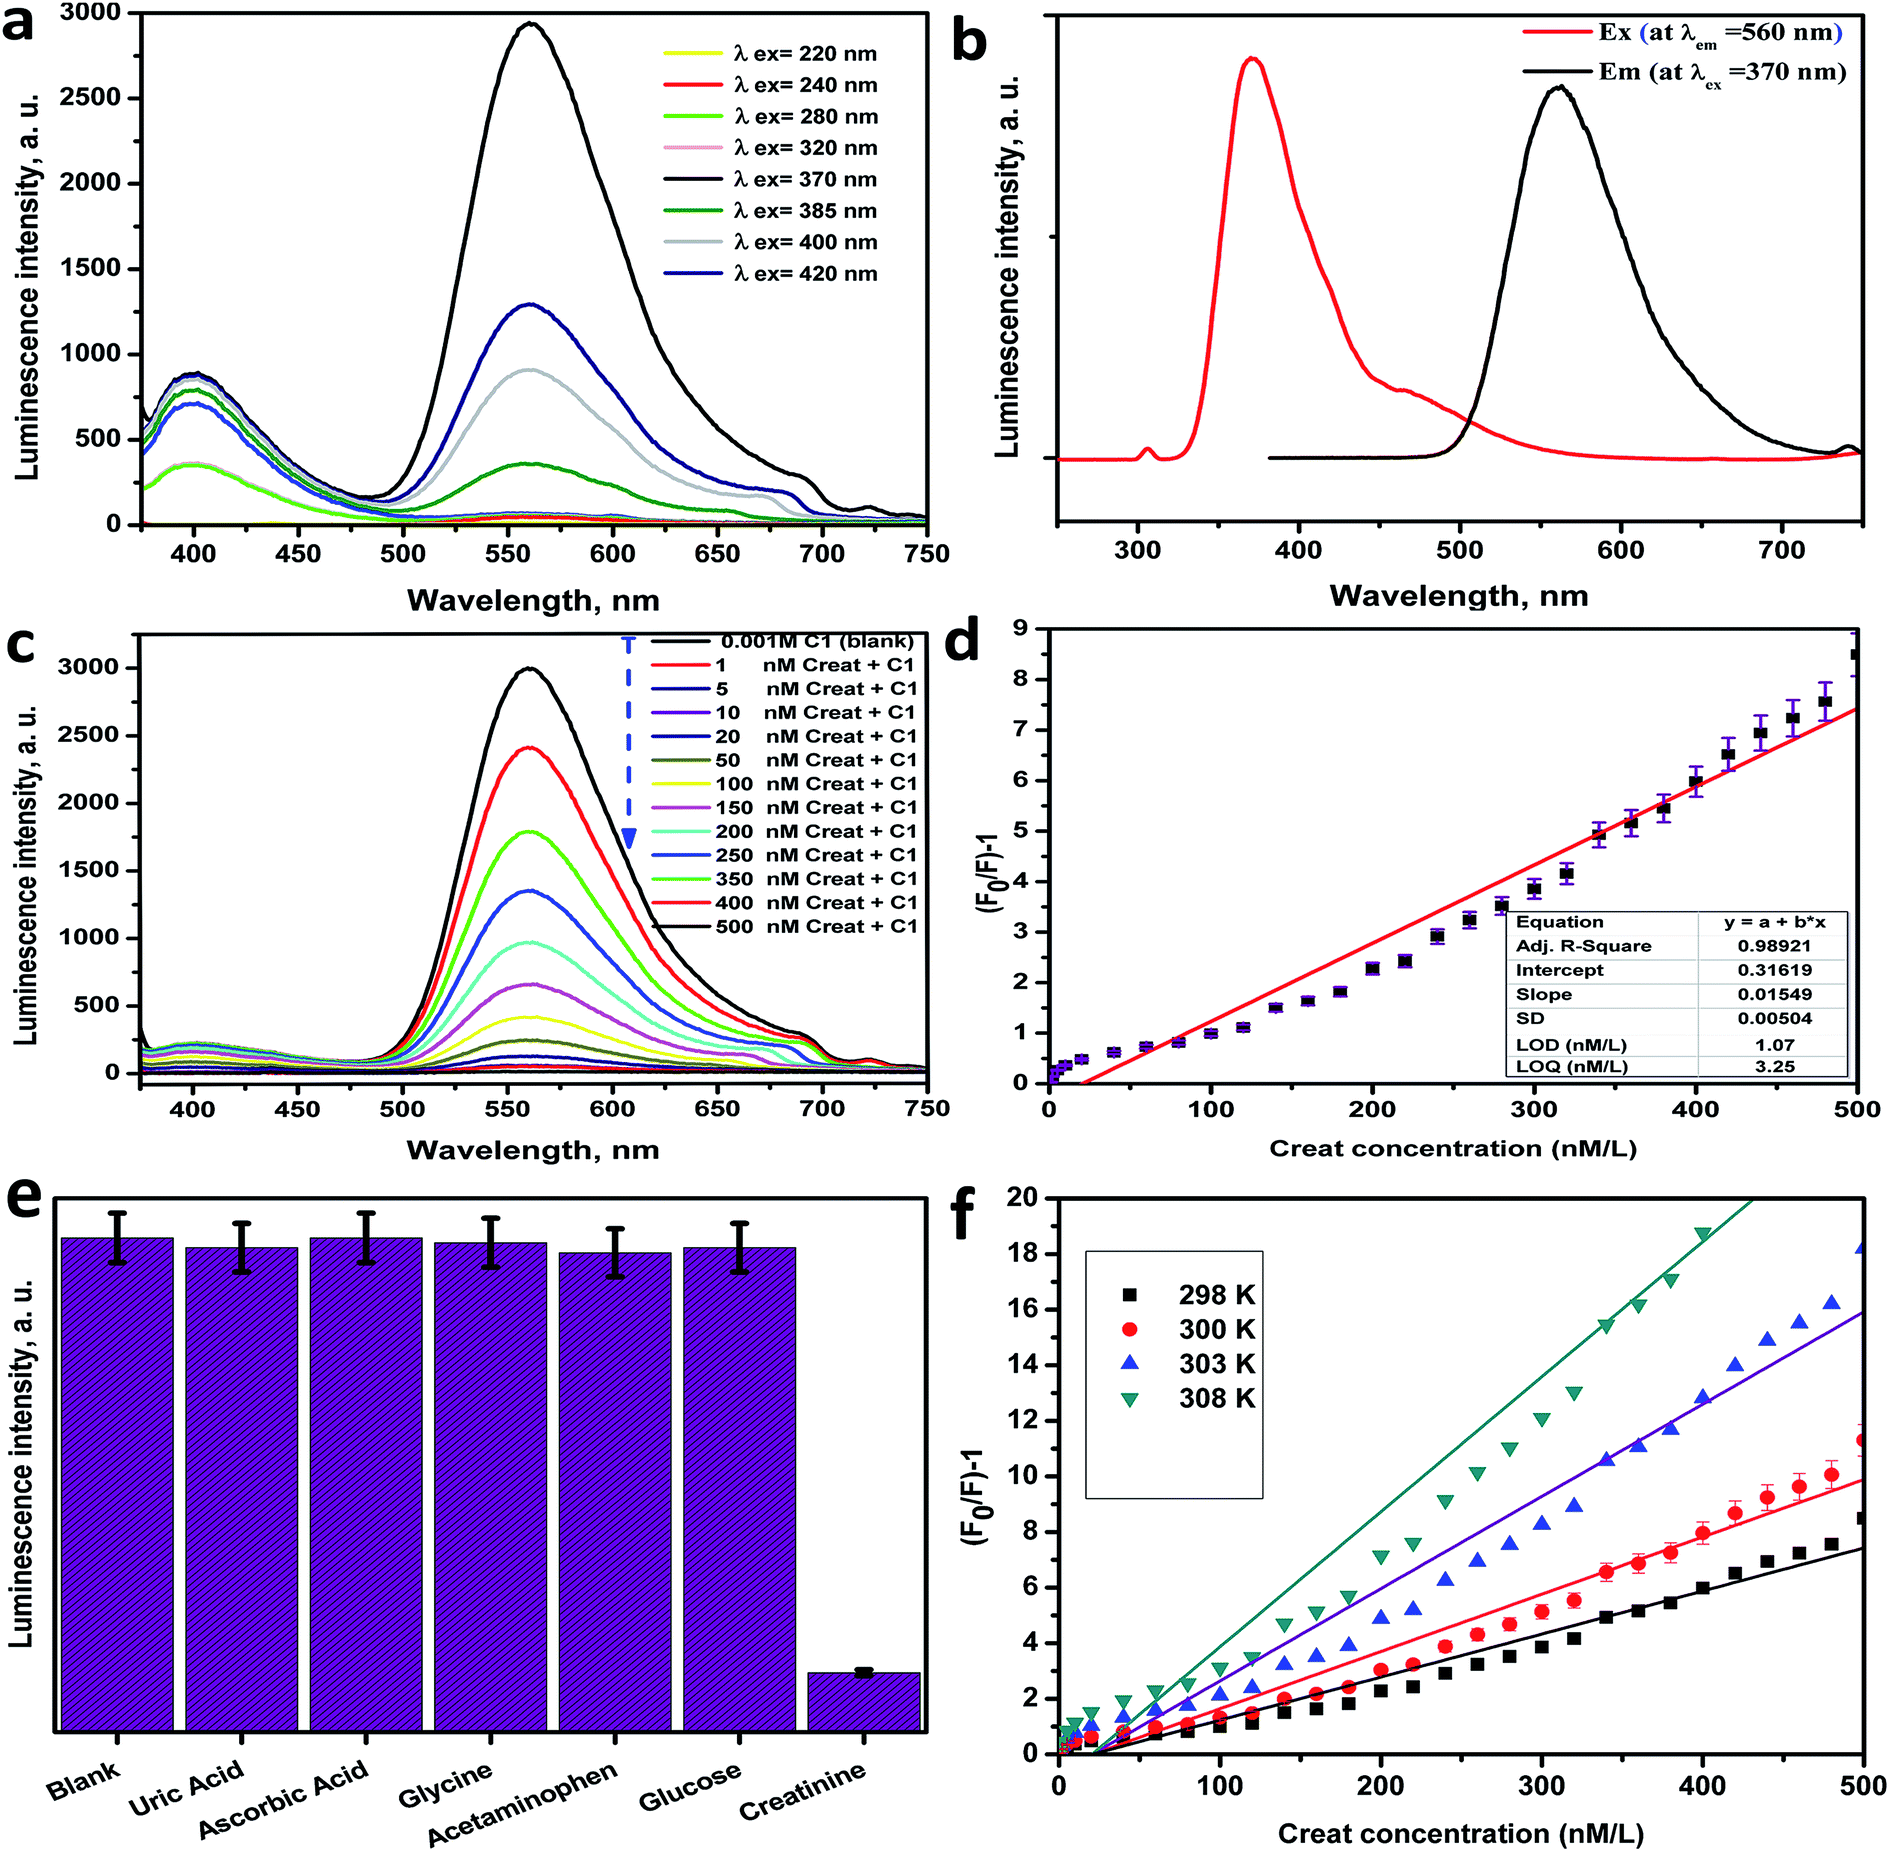 | ||
| Fig. 5 [a] The PL emission spectra at different excitation wavelengths for C1. [b] Excitation (red line) and emission (black line) spectra of C1. [c] The PL spectra showing the behavior of C1 towards human creatinine. [d] The linear relationship between the photoluminescence intensity of C1 and different concentrations of human creatinine. [e] The PL enhancement efficiency histogram of C1 against different types of interferents. [f] The Stern–Völmer plots for PL quenching of C1 by creatinine at four different temperatures. | ||
Using the Ce(III)-complex as an optical sensor for creatinine
The PL spectra of C1 (1 × 10⁻³ M in distilled water solutions) were examined versus various concentrations of creatinine (Fig. 5c). From Fig. 5c, the PL intensities of C1 were highly quenched as the creatinine concentration increased.Calibration curve and detection limit
The linear correlation graph between the PL intensity of C1 at λem = 560 nm after excitation at λex = 370 nm and the creatinine concentration in the range between 2.5 nM to 480 nM is presented in Fig. 5d, and a summary of the regression analysis data is provided in Table S6 (ESI†). The LOD was found to be 1.07 nM, whereas the LOQ was 3.25 nM, with a dynamic line range of 2.5–480 nM. The low LOD value was considered as verification of the extreme sensitivity of the applied approach. The contrast between the analytical performance of the current work and other published methods26–31 for creatinine determination is presented in Table 3. From the comparison evaluation, it can be noted that this method exhibited a fast response time, high sensitivity, high accuracy and precision, good reproducibility, applicability, good recovery and effectiveness, a wider linear range and lower values of LOD and LOQ in comparison with other reports. Also, many of the published methods are more costly, more time-consuming and carried out in several steps.| Method | Linear range (μM) | Limit of detection (μM) | Reference |
|---|---|---|---|
| LC-UV method | 20–900 | ∼1.5 | 26 |
| Low-capacity cation-exchange chromatography | 1–1000 | 0.02 | 27 |
| UV/vis spectrophotometry of a copper/creatinine complex | 8.8–530 | 2.5 | 28 |
| Amperometric detection | 10–650 | 0.5 | 29 |
| Electrochemical impedance spectroscopy | 0.05–0.2 μg mL−1 | ∼0.35 | 30 |
| Cyclic voltammetry | 10 | 0.001 | 31 |
| Photoluminescence approach | 2.5–480 nM | 1.07 nM | Present work |
Selectivity and interference study
The selectivity of the applied optical biosensor based on C1 to creatinine was investigated by observing the impact of the presence of other interfering analytes on the C1 PL intensity as shown in Fig. 5e and S9 (ESI†). The PL spectra of C1 (1 × 10⁻³ M) against different interfering analytes in distilled water solutions [uric acid 6.0 mg dL−1, ascorbic acid 0.5 mg dL−1, glycine 0.5 μM mL−1, acetaminophen 100 mg mL−1, glucose 100 mg dL−1, and creatinine 100 nM] were considered. From these figures, the intensity of the PL spectrum of C1 isn't affected by these various kinds of interfering analytes. This indicates that C1 is extremely sensitive and enormously selective for creatinine due to the enormous quenching effect even in the presence of numerous competing interfering analytes. The PL quenching histogram of C1 upon the series addition of creatinine with different concentrations is shown in Fig. S10 (ESI†).Accuracy and precision
The accuracy and the precision of the currently suggested biosensor for creatinine determination were assessed and a summary of the obtained information is provided in Table S7 (ESI†). The present investigation was done at four creatinine concentrations (5.0, 50.0, 100.0, and 250.0 nM). The process of measurement was recorded (3) times on various days and on the same day to examine the reproducibility and repeatability of our work. Based on the obtained table of data: the mean values (X) were 5.033, 48.67, 99.5, and 241.3 nM, with an average standard deviation (SD) of 0.208–2.165, and a coefficient of variation (CV) of 0.043–4.688, for intra-day measurements. In addition, X was 4.831, 49.22, 99.18, and 251.7 nM, with SD of 0.235–3.25, and CV of 0.055–3.58, for inter-day measurements. The proximity of the investigated data from the X values and the lower values of SD as well as the CV values demonstrate the extraordinary precision of this approach. Furthermore, the analyzed obtained values for the relative-error percent (RE%) for inter/intra-day measurements, which were ≤1.04%, indicate the high accuracy of the suggested creatinine biosensor.Application to real samples & recovery study
The current investigation was accomplished to examine the effectiveness, ability, and applicability of C1 to confirm creatinine in various real samples (serum and plasma). The investigation was done by spiking serum or plasma samples with creatinine standard at various concentrations (50.0, 100.0 and 200.0 nM), performing each experiment 3 times, and then the suggested method was applied to determine their creatinine content. The data obtained from the recovery (RE) investigation, including the relative standard deviation (RSD), are provided in Table S8 (ESI†). The results in Table S8† show that the recovery values (percent ± SD) of creatinine were 101.3 ± 2.02, 97.42 ± 1.34, and 98.34 ± 0.40 for the serum samples, and 98.34 ± 0.10, 98.49 ± 2.70, and 97.55 ± 2.94 for the plasma samples. Hence, the nearness of RE values to one hundred percent and the lower RSD values (less than 2.94%) together demonstrate that the current method has a quite respectable accuracy and that the current suggested method can be applied for the determination of creatinine with acceptable results.Mechanism of PL quenching
The mechanism of interaction and quenching between the sensing material (Ce-complex) and the quencher (creatinine), was determined by studying the quenching in the PL band intensities of C1 upon systematic addition of creatinine as shown in Fig. 5c.43,44 Herein, the Ce-complex acts as the electron donor site and creatinine acts as the electron acceptor site. The lanthanide luminescence behavior is due to the 4f–5d transition rather than the conventional 4f–4f transition, which means that Ce(III) complexes can be used as electroluminescent devices.45 The emission wavelengths can be adjusted by using suitable ligands,46 so the photocatalytic properties of the cerium(III) complexes are due to their outer-sphere electrons, as observed for homoleptic tris-guanidinate.47 Herein, the variation in the PL intensity of C1 with increasing creatinine concentration occurs due to the interaction between C1 and creatinine. The observed PL quenching is expected to be due to the electron or energy transfer between the donor site C1 and acceptor site (creatinine) or it may be due to the fast quenching of the excited state of Ce(III), which results from non-radiative relaxation pathways.48 The energy transfer from the excited state of C1 (as a donor site) to creatinine (as an acceptor site) through non-radiative dipole–dipole coupling is the basic possible mechanism.49 Furthermore, the FRET mechanism can be described as the quenching mechanism if the distance (Ro) (critical radius/critical transfer distance) between the donor C1 and acceptor (creatinine) is lower than 10 Å. By using the Stern–Völmer equation on the acquired results and from the linear calibration graph in Fig. 5d:| Ksv value = 0.01549; Co = 1/Ksv = 64.558; Ro = 7.35Co−1/3; Ro = 7.35 × (64.558)−1/3; Ro = 1.83 Å. |
Furthermore, a temperature dependence investigation can determine or predict the quenching mechanism category for any system that may be a dynamic or static mechanism. In the case of a dynamic mechanism, the value of Ksv increases as the temperature increases, and for the static mechanism type, the value of Ksv decreased as the temperature increased. The Stern–Völmer graph of the PL quenching of C1 with diverse concentrations of creatinine at several temperatures (298, 300, 303, and 308 K) was plotted. As shown in the Stern–Völmer plot in Fig. 5f, the plot presents effective linearity within the studied concentrations of creatinine. In addition, it was established that the slopes (Ksv values) of the C1 plots were directly proportional to the temperature (Table S9, ESI†), which proves that the quenching mechanism between C1 and creatinine is dynamic.43,52
Experimental
Materials
All solvents and chemicals used in this study are analytical reagent grade and were used as received. Isatin (C11H10), 2-amino-3-hydroxypyridin (C5H6N2O) and cerium(III)chloride anhydrous CeCl3; 99.9% were purchased from Sigma-Aldrich.Instruments
The characterization was carried out using different analytical equipment: the field emission scanning electron microscopy (FE-SEM) images and element mapping by spatially resolved energy dispersive X-ray spectroscopy (EDX) were recorded with a JEOL JSM-6510LV advanced electron microscope with a LAB-6 cathode at 520 keV (JEOL, Japan). The structure of the formed phases was examined by using a high-resolution transmission electron microscope (HR-TEM) with an acceleration voltage up to 200 kV (TEM, JEOL-JEM-2100, Tokyo, Japan). Fourier transform infrared (FT-IR) spectra were recorded on a JASCO FT/IR-460 spectrophotometer using KBr tablets, at room temperature in the range 400–4000 cm−1 (JASCO, USA). Ultra violet-visible (UV-vis) spectra were obtained for the prepared Schiff base ligand (HL) and metal complex by using a PerkinElmer 550 spectrophotometer in a 1 cm quartz cell in ethanol, over a range of 200–900 nm. Mass spectra of the solid ligand and complex were registered using a Thermo Scientific, ISQ Single Quadrupole MS (Thermo Scientific, USA). 1H-NMR and the 13C-NMR spectra were acquired in DMSO-d6 using a Gemini-300 MHz NMR spectrometer (ECA 500 II, JEOL, Japan). Elemental analysis (C, H, and N) was achieved using a Costech (ECS-4010) elemental analyzer (Costech, Italy). The photoluminescence (PL) emission spectra were obtained using a spectrofluorophotometer (Shimadzu RF-5301PC, Japan). The samples were investigated at room temperature at a different excitation wavelength and the data analysis was executed by Origin (8) software.Procedure
To determine creatinine using the Ce(III) complex, the PL spectra of C1 (1 × 10⁻³ M) in distilled water against different concentrations of standard creatinine as described above were recorded. The required concentrations were recently prepared before the measurement step. Also, each concentration was done in a separate step to avoid the carry-over and/or adsorption of this concentration of creatinine on the sample container or cuvette and then the samples were determined at the chosen excitation wavelength. A linear relationship was established between the photoluminescence intensity of Ce-complex C1 at λem = 560 nm and the creatinine concentration in the range between 2.5 and 480 nM. The graph was expressed via a regression equation: Y = a + bX where Y = photoluminescence intensity of C1 at λem = 560 nm; a = intercept; b = slope and X = concentration of creatinine in nM. The regression data analysis of photoluminescence intensity was carried out by applying the least-squares method to evaluate the slope, intercept and correlation coefficient (r2) values. The LOD and LOQ were calculated from the equations: LOD = 3.3S/b and LOQ = 10S/b53 where S is the blank standard deviation of the photoluminescence intensity values, and b is the slope of the calibration graph.
Conclusions
A novel optical creatinine approach was suggested by the preparation of a smart sensing material [Ce(III)–isatin Schiff base complex]. The current optical sensor (C1) exhibited fast response time, high sensitivity, high accuracy and precision, good reproducibility, applicability, good recovery and effectiveness to determine creatinine in various real samples (serum/plasma). This study supplies a suitable approach to develop a new kind of creatinine biosensor with an enormous linear range and lower LOD and LOQ values compared with other published reports. The nature of the interaction and quenching mechanism was also well investigated by using the Stern–Völmer equation. The results of this study indicated that the energy-transfer was responsible for the quenching of our system and the quenching mechanism between C1 and creatinine was a dynamic type. DFT calculations were executed to investigate the optimized structures of L1 and C1.Statement of human and animal rights
The human patient samples used in this study were provided by the Family Medical Laboratory, Ministry of Health, Cairo, Egypt. Informed consent was obtained. The studies were approved by the appropriate ethics committee (Ministry of Health, Egypt) and were performed in accordance with ethical standards of the responsible committee on human experimentation (institutional and national) and with the Helsinki Declaration of 1975, as revised in 2000 and 2008 ethical standards. We did not use the samples in any research involving human participants or research involving physical interventions on study participants or involving processing of personal data but conducted the research according to the method described in the article.Conflicts of interest
There are no conflicts to declare.Notes and references
- D. R. Smith, J. B. Pendry and M. C. K. Wiltshire, Science, 2004, 305, 788–792 CrossRef CAS PubMed
.
- D. Ghosh, P. Karmakar, K. Biswas, S. Balaji, A. D. Sontakke and K. Annapurna, Phys. Chem. Glasses: Eur. J. Glass Sci. Technol., Part B, 2014, 55, 196–206 CAS
- J. Tang, L. Zhou, W. Wang, C. Yang, J. H. Zhou and Y. H. Zhou, J. Lumin., 2012, 132, 1325–1328 CrossRef CAS
- M. Abdelaziz, Phys. B Condens. Matter, 2011, 406, 1300–1307 CrossRef CAS
- B.-I. Wu, W. Wang, J. Pacheco, X. Chen, T. Grzegorczyk and J. A. Kong, Prog. Electromagn. Res., 2005, 51, 295–328 CrossRef
- A. Vora, J. Gwamuri, N. Pala, A. Kulkarni, J. M. Pearce and D. O. Guney, Sci. Rep., 2014, 4901, 1–13 Search PubMed
- D. Schurig, J. J. Mock, B. J. Justice, S. A. Cummer, J. B. Pendry, A. F. Starr and D. R. Smith, Science, 2006, 314, 977–980 CrossRef CAS PubMed
- H. Kunkely and A. Vogler, J. Photochem. Photobiol., A, 2002, 151, 45–47 CrossRef CAS
- H. Yin, P. J. Carroll and E. J. Schelter, Inorg. Chem., 2016, 55, 5684–5692 CrossRef CAS PubMed
- A. Vogler and H. Kunkely, Inorg. Chim. Acta, 2006, 359, 4130–4138 CrossRef CAS
- Y. Hasegawa, Y. Kimura, K. Murakoshi, Y. Wada, J. H. Kim, N. Nakashima, T. Yamanaka and S. Yanagida, J. Phys. Chem., 1996, 100, 10201–10205 CrossRef CAS
- X. L. Zheng, Y. Liu, M. Pan, X. Q. Lü, J. Y. Zhang, C. Y. Zhao, Y. X. Tong and C. Y. Su, Angew. Chem., Int. Ed., 2007, 46, 7399–7403 CrossRef CAS PubMed
- A. D. Garnovskii, A. L. Nivorozhkin and V. I. Minkin, Coord. Chem. Rev., 1993, 126, 1–69 CrossRef CAS
- S. K. Sridhar, S. N. Pandeya and E. De Clercq, Boll. Chim. Farm., 2001, 140, 302–305 CAS
- B. Thadhaney, D. Sain, G. Pemawat and G. L. Talesara, Indian J. Chem., 2010, 49B, 368–373 CAS
- R. S. Varma and W. L. Nobles, J. Pharm. Sci., 1975, 64, 881–882 CrossRef CAS PubMed
- S. N. Pandeya, D. Sriram, G. Nath and E. De Clercq, Eur. J. Med. Chem., 2000, 35, 249–255 CrossRef CAS PubMed
- J. C. Logan, M. P. Fox, J. H. Morgan, A. M. Makohon and C. J. Pfau, J. Gen. Virol., 1975, 28, 271–283 CrossRef CAS PubMed
- S. C. Kazmierczak, F. Van Lente and E. D. Hodges, Clin. Chem., 1991, 37, 356–360 CrossRef CAS
- S. Narayanan and H. Appleton, Clin. Chem., 1980, 26, 1119 CrossRef CAS
- L. C. Chesley, J. Clin. Invest., 2008, 17, 591–597 CrossRef PubMed
- R. Cánovas, M. Cuartero and G. A. Crespo, Biosens. Bioelectron., 2019, 130, 110–124 CrossRef PubMed
- H. Strevens, D. Wide-Swensson and A. Grubb, Scand. J. Clin. Lab. Invest., 2001, 61, 575–580 CrossRef CAS PubMed
- J. A. Weber and A. P. Van Zanten, Clin. Chem., 1991, 37, 695–700 CrossRef CAS
- C. J. Kochansky and T. G. Strein, J. Chromatogr. B: Biomed. Sci. Appl., 2000, 747, 217–227 CrossRef CAS
- A. K. Dash and A. Sawhney, J. Pharm. Biomed. Anal., 2002, 29, 939–945 CrossRef CAS PubMed
- Y. Yokoyama, S. Tsuji and H. Sato, J. Chromatogr. A, 2005, 1085, 110–116 CrossRef CAS PubMed
- P. Nagaraja, K. Avinash, A. Shivakumar and H. Krishna, Spectrochim. Acta, Part A, 2012, 92, 318–324 CrossRef CAS PubMed
- S. Yadav, R. Devi, A. Kumar and C. S. Pundir, Biosens. Bioelectron., 2011, 28, 64–70 CrossRef CAS PubMed
- B. Khadro, A. Betatache, C. Sanglar, A. Bonhommé, A. Errachid and N. Jaffrezic-Renault, Sens. Lett., 2011, 9, 2261–2264 CrossRef CAS
- M. D. Guo, H. T. Liu and Y. Li, Chin. J. Anal. Chem., 1999, 244, 475–478 Search PubMed
- K. Nakamoto, in Handb. Vib. Spectrosc., ed. P. R. Griffiths, John Wiley & Sons, Ltd, Chichester, UK, 2006 Search PubMed
- M. Shebl, M. A. Ibrahim, S. M. E. Khalil, S. L. Stefan and H. Habib, Spectrochim. Acta, Part A, 2013, 115, 399–408 CrossRef CAS PubMed
- F. Zhang, H. Yao, T. Chu, G. Zhang, Y. Wang and Y. Yang, Chem.–Eur. J., 2017, 23, 10293–10300 CrossRef CAS PubMed
- S. M. Sheta, S. M. El-Sheikh, M. M. Abd-Elzaher, M. L. Ghanem and S. R. Salem, RSC Adv., 2019, 9, 20463–20471 RSC
- A. D. Becke, J. Chem. Phys., 1993, 98, 5648–5652 CrossRef CAS
- T. R. Cundari and W. J. Stevens, J. Chem. Phys., 1993, 98, 5555–5565 CrossRef CAS
- M. J. Frisch, G. W. Trucks, H. B. Schlegel, G. E. Scuseria, M. A. Robb, J. R. Cheeseman, G. Scalmani, V. Barone, B. Mennucci, G. A. Petersson, H. Nakatsuji, M. Caricato, X. Li, H. P. Hratchian, A. F. Izmaylov, J. Bloino, G. Zheng, J. L. Sonnenberg, M. Had, M. Ehara, K. Toyota, R. Fukuda, J. Hasegawa, M. Ishida, T. Nakajima, Y. Honda, O. Kitao, H. Nakai, T. Vreven, J. A. Montgomery, Jr, J. E. Peralta, F. Ogliaro, M. Bearpark, J. J. Heyd, E. Brothers, K. N. Kudin, V. N. Staroverov, T. Keith, R. Kobayashi, J. Normand, K. Raghavachari, A. Rendell, J. C. Burant, S. S. Iyengar, J. Tomasi, M. Cossi, N. Rega, J. M. Millam, M. Klene, J. E. Knox, J. B. Cross, V. Bakken, C. Adamo, J. Jaramillo, R. Gomperts, R. E. Stratmann, O. Yazyev, A. J. Austin, R. Cammi, C. Pomelli, J. W. Ochterski, R. L. Martin, K. Morokuma, V. G. Zakrzewski, G. A. Voth, P. Salvador, J. J. Dannenberg, S. Dapprich, A. D. Daniels, O. Farkas, J. B. Foresman, J. V. Ortiz, J. Cioslowski and D. J. Fox, Gaussian, Inc., Wallingford CT
- D. Shoba, S. Periandy, M. Karabacak and S. Ramalingam, Spectrochim. Acta, Part A, 2011, 83, 540–552 CrossRef CAS PubMed
- K. Fukui, Science, 1982, 218, 747–754 CrossRef CAS PubMed
- R. G. Pearson, Chemical Hardness, 2005, 26, 99–124 Search PubMed
- A. E. Reed, L. A. Curtiss and F. Weinhold, Chem. Rev., 1988, 88, 899–926 CrossRef CAS
- S. M. Sheta, S. M. El-Sheikh, M. M. Abd-Elzaher and A. R. Wassel, Appl. Organomet. Chem., 2019, 33, e4777 CrossRef
- S. M. Sheta, S. M. El-Sheikh and M. M. Abd-Elzaher, Appl. Organomet. Chem., 2019, 33, e5069 CrossRef
- P. N. Hazin, J. W. Bruno and H. G. Brittain, Organometallics, 1987, 6, 913–918 CrossRef CAS
- H. Yin, P. J. Carroll, J. M. Anna and E. J. Schelter, J. Am. Chem. Soc., 2015, 137, 9234–9237 CrossRef CAS PubMed
- D. M. Schultz and T. P. Yoon, Science, 2014, 343, 1239176 CrossRef PubMed
- S. Cotton, Lanthanide and Actinide Chemistry, John Wiley & Sons, Ltd, UK, 2006 Search PubMed
- J. R. Lakowicz, Principles of Fluorescence Spectroscopy, Springer US, New York, United States 2006 Search PubMed
- L. S. Walekar, S. P. Pawar, U. R. Kondekar, D. B. Gunjal, P. V. Anbhule, S. R. Patil and G. B. Kolekar, J. Fluoresc., 2015, 25, 1085–1093 CrossRef CAS PubMed
- Y.-Z. Zhang, B. Zhou, Y.-X. Liu, C.-X. Zhou, X.-L. Ding and Y. Liu, J. Fluoresc., 2008, 18, 109–118 CrossRef CAS PubMed
- S. M. Sheta, S. M. El-Sheikh and M. M. Abd-Elzaher, Anal. Bioanal. Chem., 2019, 411, 1339–1349 CrossRef CAS PubMed
- M. M. Abd-Elzaher, M. A. Ahmed, A. B. Farag, M. S. Attia, A. O. Youssef and S. M. Sheta, Sens. Lett., 2017, 15, 977–981 CrossRef
Footnote |
| † Electronic supplementary information (ESI) available. See DOI: 10.1039/c9ra10133k |
| This journal is © The Royal Society of Chemistry 2020 |