 Open Access Article
Effects of WO3 and SiO2 doping on CeO2–TiO2 catalysts for selective catalytic reduction of NO with ammonia
Rongrong Fan ab,
Zhaoqiang Li*ab,
Yan Wangab,
Cheng Zhangab,
Yu Wangab,
Zhiyong Dingab,
Xin Guoab and
Rong Wangab
aState Key Laboratory of Baiyunobo Rare Earth Resource Researches and Comprehensive Utilization, Baotou Research Institute of Rare Earths, Baotou 014030, China. E-mail: li_brire@163.com
bNational Engineering Research Center of Rare Earth Metallurgy and Functional Materials, Baotou 014030, China
First published on 5th February 2020
Abstract
A series of CeO2–WO3/SiO2–TiO2 (CeWxTiSiy) catalysts with different loading amounts of WO3 were synthesized by wet co-impregnation of ammonium metatungstate and cerium nitrate on a SiO2–TiO2 support, and were employed for the selective catalytic reduction (SCR) of NO by NH3. The catalytic activity of the CeO2/SiO2–TiO2 (CeSiTi) catalyst was enhanced by the addition of WO3, and the W-containing catalysts showed higher hydrothermal stability especially between 550 and 600 °C. The introduction of WO3 to the CeSiTi catalyst could produce more chemisorbed oxygen species, reducible subsurface oxygen species, acid sites and ad-NOx species. Moreover, the modification of CeO2–WO3/TiO2 (CeWTi) by SiO2 could enhance the specific surface area, especially the aged specific surface area, thus improving the hydrothermal stability of the catalyst.
1. Introduction
Nitrogen oxides (NOx) are one of the major sources of air pollution, and have caused a series of environmental problems such as acid rain, photochemical smog, and the green-house effect.1–3 The emission of NOx remains a major problem for diesel vehicles. In recent years, great efforts have been applied to the development and application of available technologies for controlling NOx emissions. Among these technologies, selective catalytic reduction (SCR) of NOx using reductants such as NH3 or hydrocarbons (HC) is one of the most promising technologies to reduce NOx. The issue of catalyst deactivation by HC poisoning needs to be resolved for the commercial application of HC–SCR.4 Currently, the SCR of NOx with NH3 (NH3–SCR) is the favored method of denoxification (deNOx), which has also been widely employed commercially for diesel vehicles to meet the ever tightening emission standards.5–8Many types of catalysts, including oxides and zeolites based on transition metals have been investigated for the NH3–SCR reaction.9 However, these catalysts have intrinsic flaws when it comes to practical applications. Transition-metal (in particular Fe and Cu) ion-exchanged zeolite catalysts have poor water and sulfur resistances.10 V2O5-based oxide catalysts have been used commercially for SCR due to its high catalytic activity and resistance to SO2 poisoning, whereas the toxicity of vanadium, the easy sublimation of V2O5 and narrow catalytic temperature window (300–400 °C) of this catalyst limit their wide application.11,12 Therefore, great efforts have been made to develop environmental friendly SCR catalysts to replace V2O5-based catalysts. Studies in recent years revealed that the presence of rare-earth components can effectively regulate the surface acidity and alkalinity, modify the structure of catalytic active centers, improve the oxygen storage/release capacities, and enhance the structural stability and active species dispersion of catalysts.13,14
As an important component of rare-earth catalytic materials, CeO2 is a potential substitute for V2O5 due to its high oxygen storage capacity and redox ability when Ce species shift between Ce4+ and Ce3+.15,16 Various studies have been conducted to develop SCR catalysts using CeO2, and several catalyst systems have been developed, including CeO2/TiO2,17 CeO2/TiO2–SiO2,18 CeO2/WO3,19 CeO2/ZrO2,20 etc. The selection of supports is important for the performance of the composite catalysts in environmental catalytic reactions, because the structural properties of supports can affect the dispersion of active sites and the contact between reactants. Various types of supports, such as Al2O3,21 medicinal stone,22 Ti-pillared clays,23 TiO2,24 have been used in environmental catalytic reactions of photocatalysis, catalytic oxidative desulfurization and organic pollutants degradation. Among them, TiO2 is a favorable candidate as the support for SCR catalysts due to its good SO2 durability and stability,25 hence CeO2/TiO2 catalyst exhibits higher SCR catalytic activity. Moreover, WO3 is widely used as a promotional additive to enhance the catalytic activity of V2O5/TiO2 catalyst. It was reported that introduction of WO3 to V2O5/TiO2 increased the amount and the strength of Brönsted acid sites on the catalyst surface.26 CeO2/WO3 catalyst also exhibits very high efficiency for the reduction of NOx.27 Shan et al. examined the promotional effects of a tungsten-doped CeO2/TiO2 catalyst and the excellent catalytic performance of the CeO2–WO3/TiO2 catalyst was associated with the highly dispersed CeO2 and primitive WO3 species on TiO2.28 Furthermore, SiO2 is widely used as catalyst supports due to their high mechanical strength and excellent thermal stability.29,30 TiO2 is usually mixed with SiO2 as the support to enhance the thermal stability and prevent the deactivating during exposure to SO2.31 However, seldom studies focus on CeO2–WO3/TiO2–SiO2 catalyst.
In this paper, a series of CeO2–WO3/TiO2–SiO2 catalysts were prepared by impregnation method and their SCR performance were evaluated in a simulated diesel engine exhaust. According to the characterization, the essence of the activity enhancement arising from the WO3 and SiO2 introduction and the active species for the reaction were proposed and elucidated in detail.
2. Experimental
2.1 Catalyst preparation
A series of CeO2–WO3/TiO2–SiO2 catalysts with different WO3 loading amount (denoted as CeWxSiyTi; x represents the weight percent of WO3, x = 0–8%; y represents the weight percent of SiO2, y = 0 or 5%) were prepared by the co-impregnation method. Cerium nitrate ((CeNO3)3·6H2O), ammonium metatungstate ((NH4)6W7O24·6H2O), and TiO2–SiO2/TiO2 support were used for the experiment. All the chemicals with purity ≥99.7% are from Sinopharm Chemical Reagent Co., Ltd, China. Firstly, cerium nitrate and ammonium metatungstate were dissolved in deionized water. TiO2–SiO2 or TiO2 powder was added to the above solution and stirred for 1 h. Secondly, the mixture exposed to ultrasonic for 2 h and then aged for 12 h. At last, the mixture was dried at 110 °C for 2 h and calcined at 550 °C for 3 h in static air. CeO2 contents in all the catalysts were 20 wt%.The fresh catalyst was thermally aged in 10% H2O in air at 600 °C for 50 h and labeled as aged-600 °C 50 h.
2.2 Catalytic activity measurement
The activity test of 0.06 g catalysts was carried out in a fixed-bed quartz reactor (inner diameter = 6 mm). The gas mixture simulates a real diesel exhaust, which contains 200 ppm NO, 200 ppm NH3, 200 ppm CO, 50 ppm C3H6, 12 vol% O2, 5 vol% H2O, 4.5 vol% CO2, and N2 as balance gas. The total flow rate was 300 mL min−1, corresponding to GHSV of 300![[thin space (1/6-em)]](https://www.rsc.org/images/entities/char_2009.gif) 000 h−1. The effluent gas, including NO, NO2, and O2 was continuously analyzed by an online flue gas analyzer. The results for the steady-state activity were collected after 20 min at each temperature. The NOx conversion was calculated as follows, whereas NOx = NO + NO2.
000 h−1. The effluent gas, including NO, NO2, and O2 was continuously analyzed by an online flue gas analyzer. The results for the steady-state activity were collected after 20 min at each temperature. The NOx conversion was calculated as follows, whereas NOx = NO + NO2.2.3 Catalysts characterization
The BET surface area was measured at −196 °C on an ASAP 2050 physical adsorption instrument (Micromeritics Corp., Norcross, GA, USA) by using the nitrogen adsorption method. The samples were pretreated in a vacuum at 300 °C for 4 h before experiments. The surface area was determined by BET method in 0–0.3 partial pressure range.X-ray diffraction (XRD) measurement was performed on an X′pert Pro diffractometer (Panalytical Corp., The Netherlands) operating at 40 mA and 40 kV with Cu Kα radiation. The 2θ data from 10 to 90° were collected with the step size of 0.03°.
Microstructures of the catalyst samples were observed with a FEI Tecnai G2 F20 electron microscope.
X-ray photoelectron spectra (XPS) were obtained with a Thermo ESCALAB 250Xi spectrometer (ThermoFisher Scientific, Waltham, MA, USA) using Al Kα radiation (1486.6 eV). Binding energies of Ce 3d and O 1s were calibrated using C 1s peak (B.E. = 284.6 eV) as standard. The composition on catalyst surface according to atomic ratios was calculated, and Shirley background and Gaussian–Lorentzian was used for peak analysis.
H2 temperature programmed reduction (H2-TPR) was carried out on a Quantachrome: Chem BET chemisorption analyzer (Micromeritics, Norcross, GA, USA). Before the experiment, 50 mg of the sample was heated from room temperature to 800 °C at a rate of 10 °C min−1. A mixture gas flow of 5 vol% H2/Ar was used as reductant at a flow rate of 60 mL min−1. Before detection by the TCD, the gas was purified by a trap containing CaO + NaOH materials in order to remove the H2O and CO2.
The temperature-programmed desorption (TPD) of NH3 or NOx was conducted on a Quantachrome: Chem BET chemisorption analyzer supplied by the Micromeritics Company. 50 mg of the sample was pretreated at 300 °C (10 °C min−1) in He flow at 60 mL min−1 for 2 h, then cooled down to 40 °C and purged with 5 vol% NH3/He (500 ppm NO + 3% O2) until adsorption saturation, followed by flushing with 20 mL min−1 He at the same temperature to remove physical absorption species. The desorption was then performed in the range of 40–800 °C at a speed of 10 °C min−1.
3. Results and discussion
3.1 SCR catalytic activity
The effect of WO3 and SiO2 addition on the deNOx performance of CeTi catalyst is illustrated in Fig. 1. As shown in Fig. 1a, CeTi and CeW4Ti showed higher NOx conversion than CeSiTi and CeW4SiTi, respectively, indicating that the catalytic activity was even suppressed by SiO2. While the negative effect on CeW4SiTi was less obvious for catalysts with WO3 loaded, suggesting that WO3 had a promotional impact on activity, which can also be seen from CeTi and CeWTi catalyst. NOx conversion over CeW4Ti was higher than CeTi at 150–550 °C. Furthermore, CeWxSiTi catalysts with different WO3 loadings were prepared to investigate the effect of WO3. It was clear that the addition of WO3 to CeSiTi could significantly enhance the catalytic activities and broaden reactivity window. CeSiTi catalyst exhibited relatively low activities in the whole temperature range, with maximum NOx conversion of 84% at 400 °C. After the addition of WO3, NOx conversion of CeW2SiTi was ∼20% greater at 250–350 °C and ∼10% at 250 or 400 °C than CeSiTi, and the maximum NOx conversion reached to 92%. With the increasing of WO3 loading from 2% to 7%, NOx conversion especially at 250 °C was greatly improved from 22% to 72%. For CeW7SiTi catalyst, nearly 100% NOx conversion was obtained in the temperature range of 300–450 °C. Further increasing the WO3 loading to 8%, CeW8SiTi showed nearly the same catalytic activity as CeW7SiTi. This suggested that the WO3 addition amount is close to its distributed capacity.32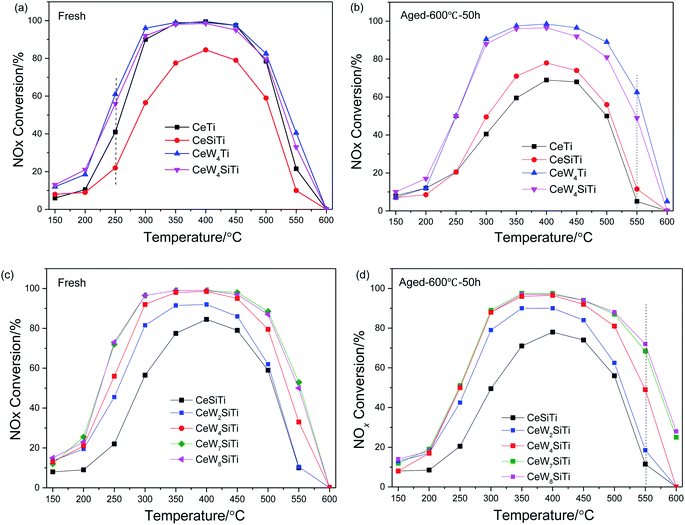 | ||
| Fig. 1 Effect of WO3 and SiO2 over CeWxTiSiy catalysts on deNOx performance. (a) and (c) Fresh samples; (b) and (d) thermally aged samples. | ||
SCR performance of the catalysts after hydrothermal aging treatment is shown in Fig. 1b and d. Compared with the fresh sample, activity of aged CeTi dropped dramatically in a wide temperature range of 250–550 °C. The maximum decrease of NOx conversion appearing at 300 °C was up to 50%, indicating that hydrothermal aging had a severe impact on CeTi catalyst. In contrast, NOx conversion of CeSiTi decreased slightly with only 7% drop at 300 °C, demonstrating that SiO2 could greatly enhanced thermal stability of catalysts. For catalysts with WO3 doped (CeW4Ti and CeWxSiTi), catalytic activities were remained after hydrothermally treated. Remarkably, compared with the fresh samples, NOx conversions of these catalysts at temperature 550–600 °C were even higher. For example, NOx conversion of aged CeW4Ti and CeWxSiTi at 550 °C were 22% and 16% higher than that of their fresh samples, respectively. Therefore, WO3 and SiO2 were synergistically beneficial for hydrothermal stability of the catalysts.
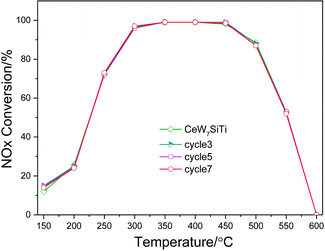
To evaluate the stability of the catalyst, CeW7SiTi was chosen to carry out the reuse cycle experiment, as described on sub-Section 2.2. After one test cycle finished, the sample was cooled down to room temperature first, then heated to 600 °C for another cycle. Catalytic activities in each cycle were exhibited in Fig. 2. It can be seen that there was no obvious reduction in the catalytic activity after 7 reuse cycles, indicating perfect reusability and good stability of the catalyst.
3.2 XRD and BET results
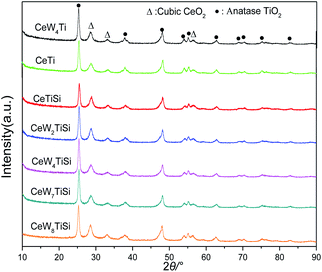
The XRD patterns of CeWxSiyTi catalysts are shown in Fig. 3. Only diffraction peaks attributed to cubic CeO2 crystallites (ICDD PDF#34-0394) and anatase phase (ICDD PDF# 21-1272) of TiO2 were detected, no WO3 or SiO2 phase was observed,16 which suggested that W and Si species probably exist in an amorphous phase or as highly dispersed species.33 The intensities of CeO2 peak slowly increased with the WO3 content increasing, indicating that CeO2 crystallites grown slowly, which may be due to the blocking effect of the CeO2 by the impregnated tungsten oxide.34 Accordingly, the average crystallite size calculated using the Scherrer equation is shown in Table 1. The crystallite size increased from 15.4 nm to 17.0 nm with WO3 loadings of CeWxSiTi increasing from 0% to 8%. Moreover, as presented in Table 1, the lattice parameter corresponding to the ceria phase was also calculated via Bragg's Law.35 The lattice constant and d-spacing of CeO2 increased a little by impregnating tungsten oxide. For CeWxSiTi, d-spacing expanded from 0.268 nm to 0.272 nm, and the lattice constant increased from 0.533 nm to 0.535 nm. Likewise for CeWxTi catalysts, from CeTi to CeW4Ti, crystallite size elevated from 16.3 nm to 17.3 nm, d-spacing from 0.267 nm to 0.271 nm, and lattice constant from 0.532 nm to 0.534 nm. Generally, the lattice constant of ceria is mainly associated with the ratio of Ce3+ (0.110 nm)/Ce4+ (0.087 nm).34 Therefore, the increasing lattice constant may be result from more Ce3+ species brought by WO3 incorporation, as discussed in the following XPS results.| Catalysts | Crystallite size of CeO2 (nm) | d-spacing (nm) | Lattice constant of CeO2 (nm) |
|---|---|---|---|
| CeTi | 16.3 | 0.267 | 0.532 |
| CeW4Ti | 17.3 | 0.271 | 0.534 |
| CeSiTi | 15.4 | 0.268 | 0.533 |
| CeW2SiTi | 15.9 | 0.268 | 0.534 |
| CeW4SiTi | 16.5 | 0.268 | 0.534 |
| CeW7SiTi | 16.5 | 0.268 | 0.534 |
| CeW8SiTi | 17.0 | 0.272 | 0.535 |
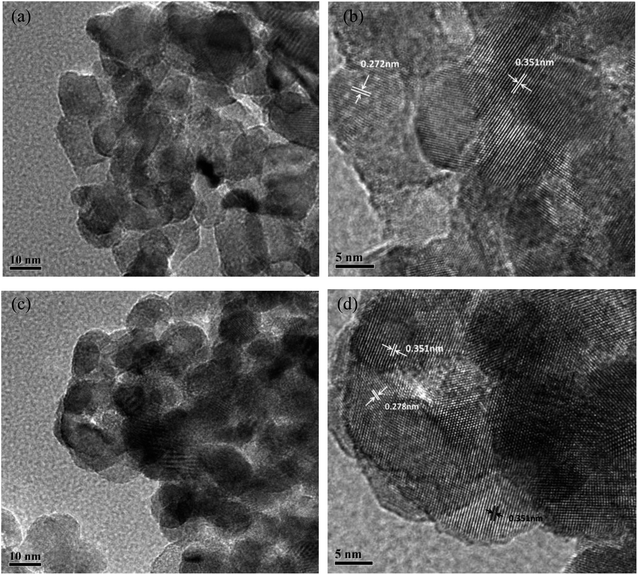
The HR-TEM micrographs of different catalysts are exhibited in Fig. 4. Particle size of CeTi and CeW4Ti catalysts were about 10–20 nm. For CeTi, lattice fringes of 0.272 nm and 0.351 nm matched CeO2 (200) and anatase (101) phase, respectively.2 After addition of WO3, lattice fringe of CeO2 (200) increase to 0.278 nm, which was consistent with the XRD results.
The BET surface areas of CeWxTiSiy catalysts as well as total pore volumes and average pore diameters are presented in Table 2. It is clear that with WO3 content increasing, a slight decrease in BET surface area is observed. This may be due to the growing cluster of CeO2 crystallites causing the agglomeration of the catalyst surface according to the XRD results.36
| VP (cm3 g−1) | DP (nm) | SBET (m2 g−1) | ΔSBETa (%) | ||||
|---|---|---|---|---|---|---|---|
| Fresh sample | Aged sample | Fresh sample | Aged sample | Fresh sample | Aged sample | ||
a  |
|||||||
| CeTi | 0.2685 | 0.2471 | 15.98 | 23.51 | 67 | 42 | 37.3 |
| CeW4Ti | 0.2489 | 0.2632 | 15.19 | 18.35 | 66 | 57 | 13.6 |
| CeSiTi | 0.2487 | 0.2777 | 12.30 | 13.87 | 81 | 80 | 1.2 |
| CeW2SiTi | 0.2302 | 0.2821 | 11.99 | 14.91 | 77 | 71 | 7.8 |
| CeW4SiTi | 0.2326 | 0.2541 | 12.48 | 15.91 | 75 | 68 | 9.3 |
| CeW7SiTi | 0.2328 | 0.2599 | 12.82 | 15.90 | 73 | 65 | 11.0 |
| CeW8SiTi | 0.2331 | 0.2547 | 13.31 | 15.60 | 70 | 63 | 10.0 |
Compared with that of their fresh counterpart, the total pore volumes and average pore diameters of aged CeWxTiSiy catalysts increased, while BET surface area decreased. Notably for CeTi, BET surface area drastically dropped from 67 to 42 m2 g−1 (a 37.3% decrease). Whereas the surface area loss of CeW4Ti and CeWxTiSi were much lower (7.8–13.6%), indicating hydrothermal stability was improved by addition of WO3 and SiO2. Remarkably, the BET surface area of aged CeSiTi (80 m2 g−1) is almost the same as the fresh sample (81 m2 g−1), showing excellent hydrothermal stability. All these indicated that the addition of active component WO3 and SiO2 could coordinatively preserve the BET surface area of hydrothermally aged catalysts, thus enhance hydrothermal stability of the catalysts, which were in good accordance with results demonstrated in Fig. 1.
3.3 XPS results
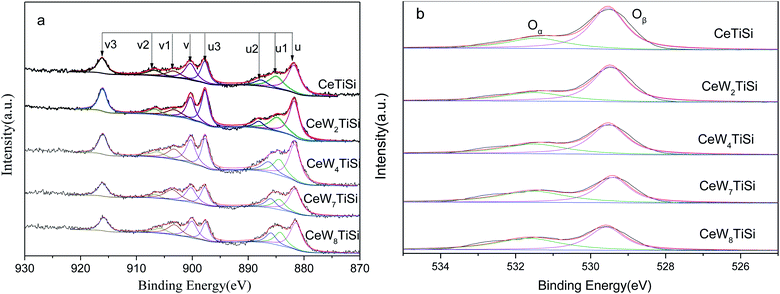
To understand the chemical states of elements over the surface of CeWxTiSiy catalysts, XPS spectra of Ce and O are presented in Fig. 5. XPS spectra of Ce 3d are shown as Fig. 5a. The sub-bands labeled u1 and v1 represent the 3d104f1 initial electronic state, corresponding to Ce3+, whereas the peaks labeled u, u2, u3, v, v2, and v3 represent the 3d104f0 state of Ce4+ ions. Ce3+/(Ce3+ + Ce4+) ratio was calculated according to the area ratio of Ce peaks and displayed in Table 3. It can be seen that the addition of WO3 to the catalyst slightly increased Ce3+ ratio on the surface of the catalysts. Hence, it is likely that W promote the transformation from Ce4+ to Ce3+ ions. Ce3+ could create more charge imbalance, vacancies, and chemisorbed oxygen on the surface, which is beneficial for SCR performance.| Catalysts | Ce3+/(Ce3+ + Ce4+) | Oα/(Oα + Oβ) |
|---|---|---|
| CeSiTi | 21.2% | 29.2% |
| CeW2SiTi | 21.2% | 30.8% |
| CeW4SiTi | 21.9% | 36.3% |
| CeW7SiTi | 23.9% | 47.2% |
| CeW8SiTi | 24.4% | 48.1% |
| CeTi | 21.1% | 23.3% |
| CeW4Ti | 23.5% | 28.7% |
Fig. 5b displays the O 1s XPS spectra of different catalysts. The O 1s peaks were fitted into two sub-bands. The bands at 531.0–531.9 eV are assigned to surface-chemisorbed oxygen (denoted as Oα). And the sub-bands from 529.5 to 530.0 eV are attributable to the lattice O2− oxygen (denoted as Oβ). The surface-adsorbed oxygen is considered to be more reactive in oxidation reactions since its mobility is higher than that of lattice oxygen, and Wu et al.37 have insisted that a high Oα ratio is beneficial for the oxidation of NO to NO2 in the SCR reaction, resulting in an improvement to a “fast SCR” reaction. According to Table 3, Oα/(Oα + Oβ) ratio of CeWxTiSi elevated from 29.2% to 48.1% as the WO3 content increasing, thereby improving the activity of the catalysts. Similar results were obtained in CeTi & CeW4Ti catalysts. Additionally, for CeTi and CeW4Ti catalysts, SiO2 doping increased the Oα/(Oα + Oβ) ratio. However, the activities of SiO2 free catalysts were better, as shown in Fig. 1. This indicated that some synergistic effect should take place between the Ce, W species and SiO2 support.
3.4 NOx adsorption
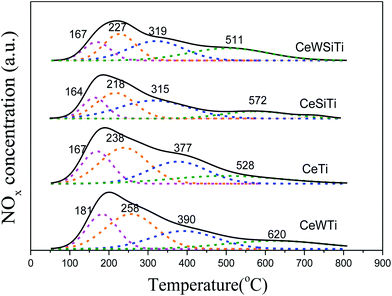
To investigate the influence of WO3 on the NOx adsorption/desorption of the catalysts, NOx–TPD was performed. Fig. 6 displays the TPD profiles of NOx on the catalysts. The NOx profiles were mainly divided into four different peaks by peak fitting according to the Gaussian deconvolution method. The first peak at 164–181 °C were associated with the desorption of physisorbed NOx. The NOx peak at 218–258 °C were mainly due to the decomposition of chemisorbed NOx species. The peaks at 315–390 °C and 511–620 °C were probably related to the decomposition of bridging nitrate species and bidentate nitrate species with higher thermal stability.38 The NOx adsorption capacity of CeW4SiTi and CeW4Ti calculated in Table 4 were 1.29 and 2.05 mmol g−1, respectively, which were higher than that of CeSiTi (1.02 mmol g−1) and CeTi (1.87 mmol g−1). It indicated that the addition of W increased the amount of NOx adsorbed species. Nitrate species (ad-NOx), formed on the catalyst surface, are known to play an important role in NO reduction. ad-NOx species desorbed above 300 °C are presumed to participate in NO reduction.39,40 The total areas of peaks attributed to nitrate species over WO3-containing catalysts were larger than that over CeTi and CeSiTi catalyst, indicating the addition of W could bring more ad-NOx species, which was beneficial for the NH3–SCR. This elucidates the promotional effect of WO3 on the activity of the catalysts in terms of the adsorption perspective.| Catalysts | Integral areas | Total NOx desorption (mmol g−1) | |||
|---|---|---|---|---|---|
| Peak 1 (164–181 °C) | Peak 2 (218–258 °C) | Peak 3 (315–390 °C) | Peak 4 (511–620 °C) | ||
| CeWTi | 1919 | 3141 | 2121 | 1461 | 2.05 |
| CeTi | 1524 | 2668 | 2016 | 1336 | 1.87 |
| CeWSiTi | 786 | 1531 | 1991 | 751 | 1.29 |
| CeSiTi | 540 | 914 | 1162 | 1064 | 1.02 |
3.5 Surface acidity
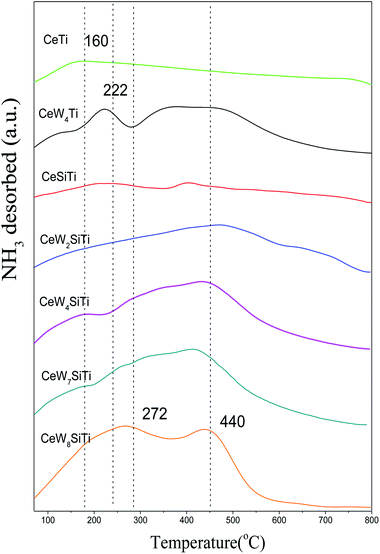
Surface acidity plays a critical role in SCR reaction. Surface acid sites promote ammonia adsorption on solid surfaces especially at high temperatures. The amounts and strengths of acid sites of CeWxTiSiy catalysts were measured by NH3–TPD and shown in Fig. 7. All the catalysts exhibited several broad peaks in the temperature range of 100–800 °C, which were attributed to NH3 desorbed by weak (150–350 °C), medium (350–500 °C) and strong (500–800 °C) acid sites.37 CeTi catalyst mainly showed a single broad peak at 160 °C ascribed to NH3 desorbed by weak acid sites. While except the first peak at around 140 °C, CeW4Ti catalyst displayed a sharp desorption peak at 222 °C and a broad peak at 417 °C, which was ascribed to medium acid sites. Besides, its NH3 desorption amount was 1.01 mmol g−1 according to Table 5, higher than 0.61 mmol g−1 of CeTi. CeWxTiSi catalysts exhibited peaks at 160, 272 and 440 °C, mainly assigned to NH3 desorption by weak and medium acid sites. With WO3 loading amounts increasing from 0% to 8%, NH3 desorption amount increased from 0.14 mmol g−1 to 2.02 mmol g−1. All these results implied that the addition of WO3 could increase amounts of acid sites of the catalysts, bringing more NH3 adsorption sites, which plays an important role in the SCR reaction.10| Catalysts | NH3 desorption (mmol g−1) | H2 consumption (mmol g−1) |
|---|---|---|
| CeSiTi | 0.14 | 1.47 |
| CeW2SiTi | 0.38 | 5.44 |
| CeW4SiTi | 1.38 | 6.68 |
| CeW7SiTi | 1.50 | 8.17 |
| CeW8SiTi | 2.02 | 8.65 |
| CeTi | 0.61 | 4.41 |
| CeW4Ti | 1.01 | 4.70 |
3.6 Redox properties
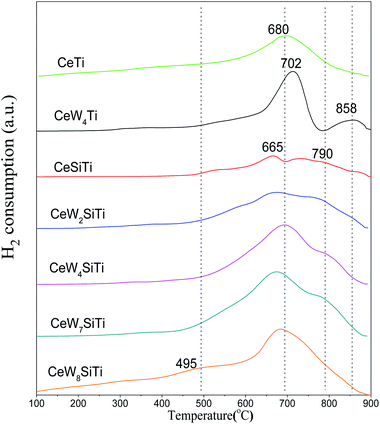
H2-TPR analysis was performed to investigate the presence of reducible species in the addition of WO3 and SiO2 to CeO2/TiO2–SiO2. Fig. 8 illustrates the H2-TPR profiles of CeWxTiSiy catalysts. All catalysts showed broad peak around 495 °C, ascribed to surface oxygen reduction of ceria.34 CeTi catalyst presented a sharp reduction peak at 680 °C, attributing to reduction of bulk oxygen in ceria. For CeWTi and CeWxTiSi catalysts, it is observed that reduction peaks of CeO2 and WO3 overlapped on the catalysts in the temperature range of WO3 reduction. The broad overlapping peaks ranged from 665 to 702 °C are attributed to the reduction of WO3 to WO2 as well as bulk oxygen of CeO2,2,27 which is due to the interaction of tungsten with cerium oxide. The reduction peaks ranged from 790–858 °C were ascribed to the reduction of WO2 to W.29 The second reduction peak of the WOx-containing catalysts shifted to higher temperatures, revealing a strong interaction between CeO2 and WO3 species with WO3 addition. For CeWxTiSi catalysts, with WO3 content increasing, H2 consumption increased from 1.47 mmol g−1 to 8.65 mmol g−1 as shown in Table 5, indicating that the addition of WO3 could bring more reducible subsurface oxygen and increase the redox property, which facilitates SCR reaction. The results are in accordance with SCR activities.4. Conclusion
In this work, WO3 was doped into CeO2/TiO2 and CeO2/TiO2–SiO2 catalysts by impregnation method. WO3 has a promotional effect on the activity of the catalysts and the optimal loading of WO3 species was 7%. After hydrothermal aging treatment, NOx conversion of W-containing catalysts at 500–600 °C even exceeded that of fresh samples, showing excellent hydrothermal stability. XRD and BET results show that the addition of WO3 could promote CeO2 and WO3 crystallites disperse better over the catalyst surface. XPS results prove that WO3 bring more appearance of Ce3+ and surface chemisorbed oxygen species so that more NO would be oxidized to NO2, which was a benefit for the SCR process. NH3 and NOx–TPD results indicate that WO3 provide more acid sites and more adsorbed NOx and NH3 species, which was also beneficial for the SCR reaction. TPR results suggest that WO3 improve redox property of the catalysts.Introduction of SiO2 lower the catalytic activities of the catalysts. While after hydrothermally treating, the surface area of SiO2-containing catalysts mostly preserved, hence enhancing the hydrothermal stability of the catalysts. There is synergistic effect between SiO2 and WO3 on keeping hydrothermal stability of the catalysts. From the results of XPS, TPD and H2-TPR, the strong interaction between ceria, tungsten and silica could contribute to the excellent deNOx performance of CeWxTiSiy mixed oxide catalyst.
Conflicts of interest
There are no conflicts to declare.Acknowledgements
This research was funded by the Science and Technology Projects of China Northern Rare Earth (Group) High-tech Co., Ltd. (Grant No. BFXT-2018-D-1) and Natural Science Foundation of Inner Mongolia (Grant No. 2017MS0209).References
- J. Chen, Y. Chen, M. Zhou, Z. Huang, J. Gao, Z. Ma, J. Chen and X. Tang, Environ. Sci. Technol., 2017, 51, 473–478 CrossRef CAS PubMed.
- Y. Jiang, Z. Xing, X. Wang, S. Huang, X. Wang and Q. Liu, Fuel, 2015, 151, 124–129 CrossRef CAS.
- S. Liu, X. Feng, J. Liu, Q. Lin, L. Xiong, Y. Wang, H. Xu, J. Wang and Y. Chen, New J. Chem., 2019, 43, 2258–2268 RSC.
- F. Liu, Y. Yu and H. He, Chem. Commun., 2014, 50, 8445–8463 RSC.
- J. Wang, H. Zhao, G. Haller and Y. Li, Appl. Catal., B, 2017, 202, 346–354 CrossRef CAS.
- H. Hu, S. Cai, H. Li, L. Huang, L. Shi and D. Zhang, J. Phys. Chem. C, 2015, 119, 22924–22933 CrossRef CAS.
- D. W. Kwon and S. C. Hong, Appl. Surf. Sci., 2015, 356, 181–190 CrossRef CAS.
- W. Zhao, Y. Tang, Y. Wan, L. Li, S. Yao, X. Li, J. Gu, Y. Li and J. Shi, J. Hazard. Mater., 2014, 278, 350–359 CrossRef CAS PubMed.
- W. Shan, F. Liu, Y. Yu and H. He, Chin. J. Catal., 2014, 35, 1251–1259 CrossRef CAS.
- J. Xu, H. Yu, C. Zhang, F. Guo and J. Xie, New J. Chem., 2019, 43, 3996–4007 RSC.
- L. Chen, J. Li and M. Ge, J. Phys. Chem. C, 2009, 113, 21177–21184 CrossRef CAS.
- Z. Yan, X. Shi, Y. Yu and H. He, J. Environ. Sci., 2018, 73, 155–161 CrossRef PubMed.
- G. Zhang, W. Han, H. Zhao, L. Zong and Z. Tang, Appl. Catal., B, 2018, 226, 117–126 CrossRef CAS.
- T. Boningari, A. Somogyvari and P. G. Smirniotis, Ind. Eng. Chem. Res., 2017, 56, 5483–5494 CrossRef CAS.
- L. Xu, C. Wang, H. Chang, Q. Wu, T. Zhang and J. Li, Environ. Sci. Technol., 2018, 52, 7064–7071 CrossRef CAS PubMed.
- Y. Geng, H. Huang, X. Chen, H. Ding, S. Yang, F. Liu and W. Shan, RSC Adv., 2016, 6, 64803–64810 RSC.
- X. Gao, Y. Jiang, Y. Fu, Y. Zhong, Z. Luo and K. Cen, Catal. Commun., 2010, 11, 465–469 CrossRef CAS.
- Y. Peng, C. Liu, X. Zhang and J. Li, Appl. Catal., B, 2013, 140, 276–282 CrossRef.
- W. Shan, F. Liu, H. He, X. Shi and C. Zhang, Chem. Commun., 2011, 47, 8046–8048 RSC.
- W. Zhao, Z. Li, Y. Wang, R. Fan, C. Zhang, Y. Wang, X. Guo, R. Wang and S. Zhang, Catalysts, 2018, 8, 375 CrossRef.
- L. Kang, H. Liu, H. He and C. Yang, Fuel, 2018, 234, 1229–1237 CrossRef CAS.
- Q. Luo, Q. Zhou, Y. Lin, S. Wu, H. Liu, D. Cheng, Y. Zhong and C. Yang, Catal. Sci. Technol., 2019, 9, 6166–6179 RSC.
- S. Wu, Y. Lin, C. Yang, C. Du, Q. Teng, Y. Ma, D. Zhang, L. Nie and Y. Zhong, Chemosphere, 2019, 237, 124478 CrossRef PubMed.
- L. Qiu, Y. Cheng, C. Yang, G. Zeng, Z. Long, S. Wei, K. Zhao and L. Luo, RSC Adv., 2016, 6, 17036 RSC.
- L. Zong, J. Zhang, G. Lu and Z. Tang, Catal. Surv. Asia, 2018, 22, 105–117 CrossRef.
- L. Chen, J. Li, M. Ge and R. Zhu, Catal. Today, 2010, 153, 77–83 CrossRef CAS.
- W. Shan, Y. Geng, X. Chen, N. Huang, F. Liu and S. Yang, Catal. Sci. Technol., 2016, 6, 1195–1200 RSC.
- W. Shan, F. Liu, H. He, X. Shi and C. Zhang, Appl. Catal., B, 2012, 115, 100–106 CrossRef.
- L. Cao, X. Wu, Y. Xu, Q. Lin, J. Hu, Y. Chen, R. Ran and D. Weng, Catal. Commun., 2019, 120, 55–58 CrossRef CAS.
- L. Qiu, Y. Wang, D. Pang, F. Ouyang and C. Zhang, Catal. Commun., 2016, 78, 22–25 CrossRef CAS.
- M. Kobayashi, R. Kuma and A. Morita, Catal. Lett., 2006, 112, 37–44 CrossRef CAS.
- K. K. Akurati, A. Vital, J. P. Dellemann, K. Michalow, T. Graule, D. Ferri and A. Baiker, Appl. Catal., B, 2008, 79, 53–62 CrossRef CAS.
- Y. Peng, K. Li and J. Li, Appl. Catal., B, 2013, 140, 483–492 CrossRef.
- Z. Ma, D. Weng, X. Wu and Z. Si, J. Environ. Sci., 2012, 24, 1305–1316 CrossRef CAS.
- Y. Wang, Z. Li, R. Fan, X. Guo, C. Zhang, Z. Ding, R. Wang and W. Liu, Catalysts, 2019, 9, 797 CrossRef CAS.
- L. Chen, D. Weng, J. Wang, D. Weng and L. Cao, Chin. J. Catal., 2018, 39, 1804–1813 CrossRef CAS.
- Z. Wu, R. Jin, Y. Liu and H. Wang, Catal. Commun., 2008, 9, 2217–2220 CrossRef CAS.
- F. Liu and H. He, J. Phys. Chem. C, 2010, 114, 16929–16936 CrossRef CAS.
- J. Li, Y. Zhu, R. Ke and J. Hao, Appl. Catal., B, 2008, 80, 202–213 CrossRef CAS.
- J. Li, J. Hao, L. Fu, T. Zhu, Z. Liu and X. Cui, Appl. Catal., A, 2004, 265, 43–52 CrossRef CAS.
| This journal is © The Royal Society of Chemistry 2020 |


