Er3+-to-dye energy transfer in DNA-coated core and core/shell/shell upconverting nanoparticles with 980 nm and 808 nm excitation of Yb3+ and Nd3+†
Laura
Francés-Soriano‡
 abc,
Nicola
Peruffo§‡
 d,
Marta Maria
Natile
 *d and
Niko
Hildebrandt
 *ab
*ab
aInstitute for Integrative Biology of the Cell (I2BC), Université Paris-Saclay, Université Paris-Sud, CNRS, CEA, 91405 Orsay Cedex, France. E-mail: niko.hildebrandt@univ-rouen.fr
bnanoFRET.com, Laboratoire COBRA (Chimie Organique, Bioorganique, Réactivité et Analyse), Université de Rouen Normandie, CNRS, INSA, 76821 Mont-Saint-Aignan Cedex, France
cInstituto de Ciencia Molecular (ICMOL), University of Valencia, C/Catedrático José Beltrán, 2, Paterna, 46980, Spain
dInstitute of Condensed Matter Chemistry and Technologies for Energy (ICMATE), National Research Council (CNR) and Department of Chemical Sciences, University of Padova, Via Francesco Marzolo 1, 35131 Padova PD, Italy. E-mail: martamaria.natile@unipd.it
First published on 4th February 2020
Abstract
The capability of upconverting nanoparticles (UCNPs) to convert near infrared (NIR) into visible light has become an important feature for biosensing, imaging, therapy, and their combination. While significant achievements have been accomplished during the last decade developing nanohybrids based on UCNPs as energy donors in Förster resonance energy transfer (FRET) systems, it is still challenging to understand and control FRET from UCNPs to dyes and to adapt the NIR excitation wavelength. Here, we describe the synthesis, characterization, and steady-state and time-resolved FRET analysis of UCNP–DNA nanohybrids, in which dye labelled single stranded (ss)DNA was attached to Yb–Er-co-doped core UCNPs (c-UCNPs) and c-UCNPs with a thin Nd-doped shell and a second thin undoped shell (css-UCNPs). Despite differences in sizes, compositions, donor–acceptor distances, brightness, and excitation wavelength (980 nm for Yb3+ and 808 nm for Nd3+), all UCNP–DNA nanohybrids showed very similar concentration dependent FRET-quenching of UCNP luminescence with efficiencies between 0 and ∼20%. We analyzed luminescence intensities, decay times, and rise times and could show the entanglement of excitation and emission kinetics by simply changing the excitation wavelength from 980 nm to 808 nm for the same css-UCNPs. Time-gated FRET-sensitized dye luminescence showed dye-ssDNA concentration dependence over four orders of magnitude (1 nM to 10 μM), which suggested a possible application to nucleic acid biosensing for both 808 and 980 nm excitation.
Introduction
Förster resonance energy transfer (FRET) is a non-radiative energy transfer from an excited emissive donor (D) to an absorbing acceptor (A) molecule or nanoparticle through dipole–dipole interactions.1,2 FRET is a direct and rapid method used in a wide range of applications such as biosensing, bioimaging or photodynamic therapy.3–8 Efficient FRET requires two main prerequisites. First, the D–A pair should be located in close proximity, typically between 1 and 10 nm. Second, there needs to be a spectral match (energetic resonance) between the emission spectrum of the donor and the absorption spectrum of the acceptor.9,10 FRET is also affected by the photoluminescence (PL) quantum yield (QY) of the donor, the molar extinction coefficients of the acceptor, the relative orientation of the transition dipole moments in the D–A pair, the refractive index of the surrounding medium, and the photostability of both donor and acceptor.Upconverting nanoparticles (UCNPs) have attracted strong interest for their application as donors in FRET. UCNPs are a class of inorganic nanoparticles that are able to emit ultraviolet (UV), visible (Vis), or near-infrared (NIR) light after absorbing NIR light, i.e., they can generate upconversion luminescence (UCL).11–15 They exhibit exceptional optical and chemical properties such as narrow emission bands, large anti-Stokes shifts, long PL lifetimes, resistance to photoblinking and photobleaching, and high thermo- and chemical stability.16,17 NIR excitation allows for a deeper penetration into biological samples (e.g., tissues) because of reduced light absorption and scattering compared to UV or Vis light.14 Moreover, UCNPs possess almost negligible cytotoxicity.18,19 Thus, UCNPs have become important PL agents for FRET-based sensing and imaging in biological applications.20–22
While energy transfer from/to quantum dots (considered as a point-dipole and following the FRET mechanism)23 or to gold nanoparticles (considered as surface dipoles and following the nanosurface energy transfer mechanism – NSET)24 have been extensively investigated and well understood, UCNP-based energy transfer is only in its infancy of comprehension. In UCNPs, every lanthanide ion emitter (activators, e.g., Er3+ or Tm3+) within the UCNP volume must be considered as a single donor and therefore, D–A distances (e.g., with dyes on the UCNP surface) are very difficult to determine with high accuracy due to the following reasons: (i) Many activators inside the UCNP (close to the center) are too far away from a surface acceptors and only produce donor background PL, which makes it difficult to evaluate donor PL quenching for FRET analysis. (ii) The QY of the FRET donor is not the QY of the UCNP but the QY of each activator ion, which is very difficult to determine and may differ for the various activators. (iii) The many UCL-related energy transfer and energy migration steps (for both activators and sensitizers, e.g., Yb3+ and Nd3+) both populate and depopulate different non-emitting and emitting energy levels. (iv) In many cases, PL intensity and PL lifetime data do not provide the same results.25–28 Owing to these difficulties, energy transfer processes involving UCNP donors are more intriguing to study because they cannot be simply predicted by conventional FRET theory. For example, Dukhno et al. have recently developed a semi-empirical Monte Carlo model for predicting the behavior of UCNP-dye systems.29
Despite the complicated dynamics, several studies have investigated the energy transfer processes for UCNPs, which were mainly related to FRET.26–35 These studies used Yb/Er or Yb/Tm co-doped UCNPs and organic dyes (e.g., BODIPY or rhodamine B) or other NPs (e.g., quantum dots or perovskites) as acceptors. They demonstrated the critical role of the distribution of activators in the UCNPs, i.e., only those ions close to the UCNP surface are able to undergo FRET to an acceptor attached to the surface. Therefore, the shell thickness, composition of core and/or shell, UCNP size, and even the organic capping are parameters to optimize in order to accomplish efficient FRET processes.
Nd3+-doped UCNPs shift the excitation wavelength from 980 nm (Yb3+ excitation) to 808 nm, where the water absorption is around 0.02 cm−1, more than 20 times lower than at 980 nm (0.482 cm−1).36 Moreover, the Nd3+ absorption cross-section (∼1.2 × 10⁻¹⁹ cm2) is one order of magnitude higher than Yb3+.37 Consequently, the incorporation of Nd3+ ions into UCNPs can avoid water heating in long-term experiments, improve the light penetration depth, and increase the overall UCNP QY.36 While such Nd3+-sensitized UCNPs have become very interesting for in vitro/in vivo biological applications,38 they have not been used to study FRET to dyes and compare the results to Yb3+-sensitized UCNPs. Despite the enhanced properties mentioned above, UCNPs co-doped with Nd3+ as sensitizer and Er3+ or Tm3+ as activators display low QYs, owing to the energy back transfer from activators to Nd3+.39 To overcome this problem, researchers have developed multilayered structures and used Yb3+as a bridge between Nd3+ and the activator ions. In such tri-doped nanostructures the Nd3+ ions harvest 808 nm light and transfers the energy to Yb3+.40,41 As a result, the Yb3+ ions are excited and able to transfer the energy to the activators (energy transfer upconversion – ETU). To accomplish high QYs, Nd3+ sensitizers and Er3+ (or Tm3+) activators should be spatially separated along core and different shell structures, i.e. activators in the core and Nd3+ and Yb3+ sensitizers in the shell, suppressing the cross-relaxation process from activators to Nd3+.42
In our present study, we have synthesized two different UCNP structures, namely “c-UCNP” and “css-UCNP” (Scheme 1). c-UCNP consisted of β-NaYF4:Yb3+(20%),Er3+(2%) core, whereas css-UCNP was composed of a β-NaYF4:Yb3+(20%),Er3+(2%)/NaYF4:Nd3+(20%)/NaYF4 core/shell/shell structure. These UCNPs were further modified with a cyanine 3.5-labeled single-stranded DNA (Cy3.5-ssDNA) by anchoring it directly to positively charged UCNP surfaces through the numerous negatively charged phosphate groups in the DNA backbone. We studied the FRET processes from both UCNPs to Cy3.5 by steady-state and time-resolved luminescence spectroscopy with NIR irradiation at 980 nm and 808 nm and different Cy3.5-ssDNA concentrations.
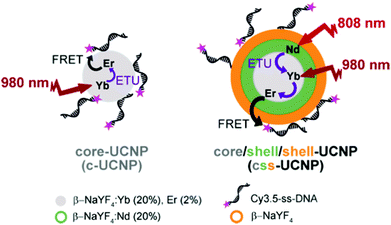 | ||
| Scheme 1 Schematic representation of the two types of UCNPs and different energy transfer processes investigated in this study. | ||
Results and discussion
Synthesis and characterization of c-UCNPs and css-UCNPs
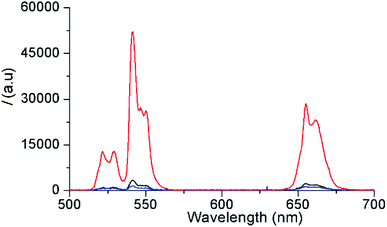
First, oleate-capped β-NaYF4:Yb3+(20%),Er3+(2%) c-UCNPs and β-NaYF4:Yb3+(20%),Er3+(2%)/NaYF4:Nd3+(20%)/NaYF4 css-UCNPs with pure hexagonal phase structures were prepared, as confirmed by X-ray diffraction (XRD, Fig. S1(A)†). The c-UCNPs were obtained by the Ostwald ripening method following a modified procedure.43 The css-UCNPs were synthesized following a layer-by-layer method employing sacrificial nanoparticles (s-UCNPs) as the shell precursor material.44 These s-UCNPs (NaYF4:Nd (20%) or NaYF4) were produced by thermal decomposition methods and were found to be ca. 9 nm in diameter and of pure cubic α-phase (Fig. S1(B) and S2†). Once the β-NaYF4:Yb3+(20%),Er3+(2%) c-UCNPs were formed, Nd-doped s-UCNPs were injected and allowed to ripen onto the surface of the c-UCNPs as an epitaxial, hexagonal-phase shell (300 °C, 15 min).44 This process was repeated once more, using undoped α-NaYF4 resulting in a second shell layer. The first (inner) layer contained the Nd3+ ions, which allowed for 808 nm excitation while keeping Nd3+ and Yb3+/Er3+ ions separated (in shell and core, respectively) to mitigate energy back transfer from Er3+ to Nd3+. The second (outer) layer consisted of an inert shell that minimized surface quenching effects, leading to brighter UCL.45 Successful epitaxial shell growth on the c-UCNPs was corroborated by transmission electron microscopy (TEM, Fig. S3†). The average diameter of c-UCNPs (26 ± 2 nm) was increased to 28 ± 2 nm by addition of the Nd3+-doped shell and to 31 ± 3 nm for the additional undoped shell. The size of c-UCNPs (different synthesis than for css-UCNPs) was 27 ± 2 nm (TEM, Fig. S4†). Both UCNPs were uniform in size and with a very small dispersion. The percentage of oleate on the UCNPs surface was determined by thermogravimetric analysis (TGA, Fig. S5†). The weight loss observed at ∼450 °C was ∼33% for s-UCNPs, 12% for c-UCNPs, and 11% for css-UCNPs. The lower amount of organic capping layer in c-UCNPs and css-UCNPs was caused by the higher surface-to-volume ratio of the s-UCNPs.Both types of UCNPs showed the typical Er3+ emission bands (between 510 and 560 nm and between 640 and 680 nm) upon 980 nm and 808 nm excitation, respectively (Fig. 1). As expected, shell-coating of the c-UCNPs resulted in a significant increase of the UCL brightness (13-fold) when the Yb3+ sensitizers inside the core (there is no Yb3+ inside the shells) were excited with 980 nm (red compared to black curve in Fig. 1). Excitation of css-UCNPs at 808 nm, i.e., excitation of the Nd3+ sensitizers in the inner shell, resulted in ∼14-fold lower UCL intensity compared to direct excitation of Yb3+ (980 nm) inside the core (blue compared to red curve in Fig. 1). This significantly lower intensity was also expected. While the absorption cross section of Nd3+ at 808 nm is higher and the water absorption at 808 nm is lower compared to Yb3+ and 980 nm (vide supra), the amount of Nd3+ ions in the ∼1 nm thick inner shell is lower than the one of Yb3+ ions in the ∼26 nm diameter core (4-fold lower when comparing the shell and core volumes and taking into account the equal doping ratio of 20% for both Yb3+ and Nd3+). Moreover, the energy must be transferred from Nd3+ to Yb3+ and separation of Nd3+ (in the shell) and Er3+ (in the core) can only mitigate but not completely suppress energy backtransfer. More sophisticated multilayered UCNP structures are necessary to actually produce UCNPs that are brighter at 808 nm excitation compared to 980 nm excitation.46–49
DNA-conjugation of UCNPs
Considering that as prepared UCNPs were obtained with a hydrophobic oleate surface coating, a two-steps ligand exchange method was used to obtain hydrophilic ssDNA-conjugated UCNPs.DNA possesses numerous negatively-charged phosphate groups, which can be attached via electrostatic interactions to the positively charged UCNPs. In the first step, oleate ligands were replaced with weakly bonded tetrafluoroborate anions (BF4−), by using the NOBF4 protocol.50,51 The second step consisted of the replacement of BF4− anions with ssDNA (cf. Experimental section for details).50 To study the efficiency of ssDNA coating and the stability of the prepared ssDNA–UCNP conjugates, different ssDNA![[thin space (1/6-em)]](https://www.rsc.org/images/entities/char_2009.gif) :
:![[thin space (1/6-em)]](https://www.rsc.org/images/entities/char_2009.gif) UCNP ratios were considered. Cy3.5-ssDNA allowed us to study both the stability of the ssDNA–UCNPs and UCNP-to-dye FRET under NIR irradiation as a function of Cy3.5-ssDNA concentration. Because attachment of Cy3.5-ssDNA to the UCNP surface was based on non-specific electrostatic interaction, the Cy3.5-ssDNA could adapt different orientations, possibly ranging from full DNA attachment (tangential to the UCNP surface) to full DNA extension (radial to the UCNP surface).30 Such different DNA-surface assemblies influence both the stability of the UCNP-Cy3.5-ssDNA conjugates (the better the UCNP surface is covered the higher its stability in aqueous media) and the donor–acceptor distance (tangential orientation places the Cy3.5 acceptor close to the Er3+ donors, whereas radial orientation places it further away). To ensure both sufficient surface coating and close-enough donor–acceptor distance, we selected a ssDNA that was neither too short nor too long. The 20-nucleotide ssDNA used in our study should provide sufficient interaction with the UCNP surface and extend no more than 3 nm, when taking into account an extension of ∼0.15 nm per nucleotide as previously found for ssDNA attached to quantum dot surfaces.52 With the resonance condition between UCNP donors and Cy3.5 acceptors being fulfilled, as shown by the spectral overlap between the green PL band of the UCNPs (λexc = 980 nm) and Cy3.5 absorption (Fig. 2), this maximum extension should provide favorable condition for a possible energy transfer. For both stability and FRET evaluation, the nominal Cy3.5-ssDNA
UCNP ratios were considered. Cy3.5-ssDNA allowed us to study both the stability of the ssDNA–UCNPs and UCNP-to-dye FRET under NIR irradiation as a function of Cy3.5-ssDNA concentration. Because attachment of Cy3.5-ssDNA to the UCNP surface was based on non-specific electrostatic interaction, the Cy3.5-ssDNA could adapt different orientations, possibly ranging from full DNA attachment (tangential to the UCNP surface) to full DNA extension (radial to the UCNP surface).30 Such different DNA-surface assemblies influence both the stability of the UCNP-Cy3.5-ssDNA conjugates (the better the UCNP surface is covered the higher its stability in aqueous media) and the donor–acceptor distance (tangential orientation places the Cy3.5 acceptor close to the Er3+ donors, whereas radial orientation places it further away). To ensure both sufficient surface coating and close-enough donor–acceptor distance, we selected a ssDNA that was neither too short nor too long. The 20-nucleotide ssDNA used in our study should provide sufficient interaction with the UCNP surface and extend no more than 3 nm, when taking into account an extension of ∼0.15 nm per nucleotide as previously found for ssDNA attached to quantum dot surfaces.52 With the resonance condition between UCNP donors and Cy3.5 acceptors being fulfilled, as shown by the spectral overlap between the green PL band of the UCNPs (λexc = 980 nm) and Cy3.5 absorption (Fig. 2), this maximum extension should provide favorable condition for a possible energy transfer. For both stability and FRET evaluation, the nominal Cy3.5-ssDNA![[thin space (1/6-em)]](https://www.rsc.org/images/entities/char_2009.gif) :
:![[thin space (1/6-em)]](https://www.rsc.org/images/entities/char_2009.gif) UCNP ratio was adjusted from ca. 0.1 to 4 nmol mg−1 using c-UCNPs.
UCNP ratio was adjusted from ca. 0.1 to 4 nmol mg−1 using c-UCNPs.
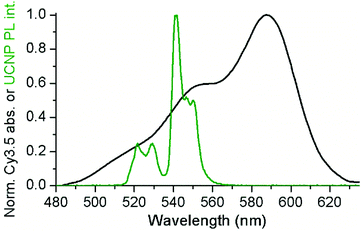 | ||
| Fig. 2 The green PL bands of UCNPs (green) overlap with the absorption spectrum of Cy3.5 (black). See ESI† for calculation of overlap integrals. | ||
The stability of an aqueous dispersion of DNA–c-UCNPs as a function of Cy3.5-ssDNA per c-UCNP ratio was evaluated by dynamic light scattering (DLS, Fig. S6†). Hydrodynamic diameters and polydispersity indices (PDI) were measured in triplicate for each sample and Table S1† displays the averaged values.
We noticed the formation of large aggregates for the ratios of 2.0 and 2.5 nmol mg−1, with average sizes above 500 nm. Below 2.0 nmol mg−1, the amount of ssDNA was not sufficient to favor aggregation. For higher Cy3.5-ssDNA per c-UCNP ratios (4.0 nmol mg−1) nanohybrids displayed a better stability in water over time and no size changes were observed even after several measurement, which we ascribed to an efficient UCNP surface coating with DNA.
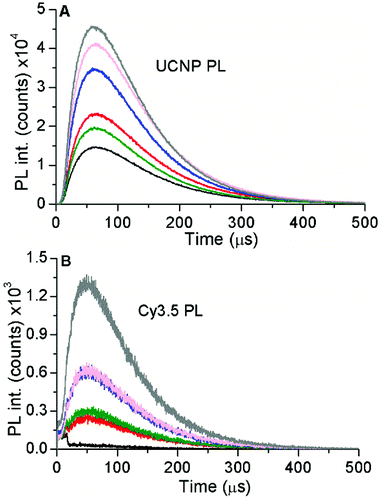
The optical properties of Cy3.5 and c-UCNP as a function of Cy3.5-ssDNA per c-UCNP ratio were investigated by absorption and PL spectroscopy. Probing Cy3.5 resulted in increasing intensities (with increasing Cy3.5-ssDNA per c-UCNP ratio) for absorption (Fig. S7†), PL emission (Fig. S8†), and PL excitation (Fig. S9†), as expected due to the increasing Cy3.5 concentration. Upon NIR-excitation of UCNPs, the PL decay curves of both the green Er3+ PL of UCNPs (Fig. 3A) and the red PL of Cy3.5 (Fig. 3B) showed the characteristic rise and decay profiles of UCNPs, which extend over a few hundred microseconds. Taking into account that Cy3.5 cannot be excited at 980 nm and that the PL decay of Cy3.5 is in the nanosecond range, the long PL decay of Cy3.5 provided clear evidence of dye-sensitization via FRET from UCNPs.
The intensities of the time-resolved PL curves also confirmed the stability results obtained with DLS (vide supra). Increasing amounts of Cy3.5-ssDNA clearly improved the UCNP PL (higher intensities), which also resulted in higher UCNP-sensitized Cy3.5 PL intensities. Interestingly, the Cy3.5 PL intensity increase did not follow the same trend as the UCNP PL intensity. For the lowest Cy3.5-ssDNA per c-UCNP ratio (0.1 nmol mg−1), Cy3.5-sensitization was negligible, most probably caused by the low Cy3.5 concentrations, which also resulted in very low Cy3.5 absorption (Fig. S7†) and emission upon direct Cy3.5 excitation (Fig. S8†). The higher ratios (0.5 to 2.5 nmol mg−1) showed significant Cy3.5 sensitization but without a ratio-specific intensity increase (as found for UCNP PL), which can be ascribed to the reduced stability of the Cy3.5-ssDNA–c-UCNP conjugates at these conjugation ratios. Similar to DLS, the best results (highest intensities for both UCNP and Cy3.5 PL) were found for the nominal ratio of 4 nmol Cy3.5-ssDNA per mg c-UCNP and we used this conjugation condition for the following FRET investigations with both c-UCNPs and css-UCNPs.
FRET studies
For maintaining a constant amount of DNA on the UCNP surface (3.54 nmol DNA per mg UCNP), we used both Cy3.5-ssDNA and unmodified ssDNA. The concentrations of Cy3.5-ssDNA in the synthesis mixture was increased from 0 to 4 μM (0, 0.001, 0.01, 0.05, 0.1, 0.5, 1.0, 2.0, 3.0, and 4.0 μM) while the amount of ssDNA was decreased from 4 to 0 μM. The UCNP concentration was kept constant at 1 mg mL−1. To obtain sufficient PL intensity for steady-state spectroscopy analysis (vide infra), all concentrations were 10-fold higher but DNA per UCNP ratios were the same.First, DLS and ζ-potential measurements were performed on c-UCNPs and css-UCNPs capped entirely with Cy3.5-ssDNA and ssDNA, respectively. This approach allowed us to obtain information about the effect of the dye on the stability of UCNP–DNA conjugates. It is noteworthy that the hydrodynamic diameters of UCNP–Cy3.5-ssDNA conjugates were significantly smaller than those of UCNP–ssDNA (e.g., ∼136 nm vs. ∼176 nm, Table S2†). While this is somewhat counterintuitive, it may be caused by dye-related changes in the hydration layer rather than a reduced size. The ζ-potentials (Table S2†) of all UCNP–ssDNA conjugates (with and without Cy3.5) were negative (between ca. −4 and −13 mV) and there was no significant difference between ssDNA and Cy3.5-ssDNA. Considering the positive surface charge (ζ-potential of +23.3 mV) of the BF4-coated UCNPs, the negative values provided good evidence that ssDNA (with and without Cy3.5), with its numerous negatively charged phosphate groups, was successfully attached to the UCNP surfaces.
We first used steady-state PL spectroscopy to analyze DNA-mediated FRET from UCNP to Cy3.5 for different conjugates of c-UCNP-Cy3.5-ssDNA/ssDNA and css-UCNP-Cy3.5-ssDNA/ssDNA upon excitation at 980 and 808 nm (Fig. S10 and S11†). Importantly, the cores of c-UCNPs and css-UCNPs contained almost an equivalent amount of sensitizer and activator ions. Therefore, differences between the samples’ optical properties could be ascribed to the two shells in the css-UCNPs. Under 980 nm excitation, Yb3+ and Er3+ co-doped materials undergo UCL mainly via ETU. Yb3+ ions absorb NIR light (2F7/2 → 2F5/2) and, subsequently transfer the energy to emitting Er3+ excited states involving a two or three photon processes.
The radiative deactivation of these Er3+ excited states results in three main emission bands at ca. 520 nm (2H11/2 → 4I15/2), 540 nm (4S3/2 → 4I15/2), and 660 nm (4F9/2 → 4I15/2).53 Excitation at 808 nm adds an additional energy transfer step from Nd3+ to Yb3+. Nd3+ is excited from the 4I9/2 to 4F5/2 state, relaxes non-radiatively to the 4F3/2 level through multiphonon processes and then energy is transferred to nearby Yb3+ ions in the NPs core, exciting them to the 2F5/2 state.
For all UCNP–DNA nanohybrids, Cy3.5-ssDNA concentration dependent UCL quenching of the green PL bands (510–560 nm) of Er3+ could be clearly observed. Because the red PL band (640–675 nm) did not overlap with Cy3.5 absorption (no energetic resonance) but is sensitive to small sample-related intensity fluctuations, the green-to-red UCL intensity ratio (I540/I660) was used to analyze the Cy3.5-ssDNA concentration dependence of FRET quenching. While the green-to-red UCL ratio was higher for css-UCNP[λex = 980 nm] (most probably due to the more than 10-fold brighter UCL – cf. Fig. 1), the relative quenching was very similar for all UCNP–DNA conjugates (Fig. 4 and Fig. S12, S13†).
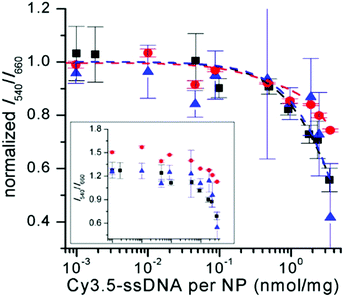 | ||
| Fig. 4 Cy3.5-ssDNA concentration dependent PL intensity ratios (I540/I660 – normalized to unity for samples without Cy3.5-ssDNA) of c-UCNP (black) and css-UCNP (red) upon excitation at 980 nm and of css-UCNP upon 808 nm excitation (blue). The inset shows the non-normalized data (abscissa has the same scale than the normalized graph – larger version of the inset can be found in Fig. S13†). PL intensities were integrated over the entire green and red PL bands (510 to 560 nm for I540 and 640 to 675 nm for I660). | ||
The much stronger UCL signal of css-UCNP[λex = 980 nm] also resulted in more precise measurements (error bars of css-UCNP[λex = 808 nm] and c-UCNP[λex = 980 nm] are significantly larger – cf. Fig. 4).
Low concentrations of Cy3.5-ssDNA (below ∼0.1 nmol mg−1, which corresponds to ∼1/40 Cy3.5-ssDNA/ssDNA or ∼100 Cy3.5-ssDNA per UCNP) did not result in significant UCL quenching, whereas full coverage of UCNPs with Cy3.5-ssDNA led to quenching between ∼25% for css-UCNP[λex = 980 nm] and ∼55% for css-UCNP[λex = 808 nm].
Taking into account that the signals of c-UCNP and css-UCNP[λex = 808 nm] were even lower when FRET-quenched, the css-UCNP[λex = 980 nm] data was quantitatively the most reliable, whereas the other two UCNP–DNA nanohybrids confirmed the clear trend of Cy3.5-ssDNA concentration dependent quenching. This assessment of similar FRET-quenching for all UCNP–DNA conjugates (despite their differences in D–A distances and excitation wavelengths) with a maximum efficiency around 20% was also confirmed by time-resolved measurements (vide infra).
While UCL quenching was obvious, we could unfortunately not observe significant FRET-sensitized Cy3.5 PL. One reason was the lacking sensitivity of our steady-state spectroscopy setup (fibre-coupled CCD spectrometer), which required the use of relatively high UCNP–DNA concentrations (10 mg mL−1, vide supra). More importantly, the relatively high concentration of the dye increased the probability of the formation of non-fluorescent H-aggregates, which acted as trap states for both FRET from UCNPs or homo-FRET from other dyes. Such trap states at high concentrations of dyes on nanoparticles can lead to strong self-quenching of the fluorescence.54 The formation of H-aggregates was confirmed by UV-Vis absorption spectra of nanohybrids with different amounts of Cy3.5-ssDNA (Fig. S7†) even at low concentrations of UCNP–DNA nanohybrids (1 mg mL−1). These spectra showed a more intense blue absorption shoulder (around 550 nm) compared to non-aggregated dyes (Fig. 2), which is typical for H-aggregates.55–57
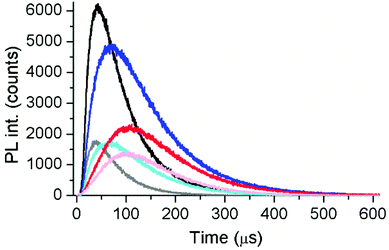
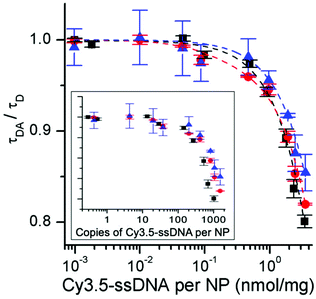
To gain further insight into the energy transfer processes, we carried out time-resolved PL measurements with filter-based photomultiplier detection. This allowed us to analyze the decay times of both FRET-quenched UCL and FRET-sensitized Cy3.5 fluorescence (Table S3†) and the rise times of FRET-quenched UCL (Table S4†) for all UCNP–DNA nanohybrids. Moreover, we could use a UCNP–DNA concentration of 1 mg mL−1. For a direct comparison with the steady-state data, we first analyzed the green emission (∼540 nm) of c-UCNPs and css-UCNPs upon 980 and 808 nm excitation (Fig. 5 and Fig. S14†). Consistent with the steady-state PL results (Fig. 4), increasing concentrations of Cy3.5-ssDNA per UCNP resulted in increased UCL decay time quenching, which was similar for all UCNP–DNA conjugates (Fig. 6).
The more sensitive detection setup and the independence of PL lifetime from sample concentration resulted in significantly less deviations compared to the steady-state measurements.
They also confirmed our assessment that the Cy3.5-ssDNA concentration dependent FRET quenching is the same for all UCNPs, almost negligible for low Cy3.5-ssDNA concentrations (although the more sensitive setup leads to an onset of FRET quenching at slightly lower concentrations), and reaches a maximum of approximately 20% at coverage of UCNPs with only Cy3.5-ssDNA (Fig. 6).
Owing to the smaller size of the c-UCNPs, their molar concentration is higher compared to the css-UCNPs (for the same weight of 1 mg). Therefore, UCL quenching as a function of copies (molecules) of Cy3.5-ssDNA (Fig. 6 inset) results in slightly less Cy3.5-ssDNA for the same quenching efficiencies when comparing c-UCNPs and css-UCNPs. This finding makes sense because the c-UCNP size is smaller and the D–A distance is shorter (no shell).
The different UCNPs and excitation wavelengths also resulted in different absolute decay times (Fig. 7A). c-UCNPs had the shortest decays because of direct contact of the Er3+ emitters with the environment, which was avoided in the shelled css-UCNPs. The shorter decay times of css-UCNP[λex = 808 nm] compared to css-UCNP[λex = 980 nm] were less intuitive because only the excitation wavelengths were different, whereas the UCNPs were exactly the same.
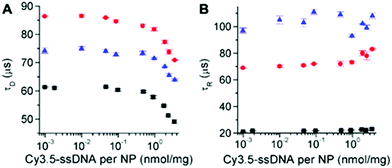 | ||
| Fig. 7 UCL decay (A) and rise (B) times of c-UCNPs (black) and css-UCNPs (red) upon excitation at 980 nm and of css-UCNPs upon 808 nm excitation (blue) as a function of Cy3.5-ssDNA concentration. | ||
This finding reflects the direct relation between excitation and emission in UCNPs, which is caused by the many long-lived excited states and many possible pathways of both excitation and deexcitation. The UCL rise times confirmed the differences (Fig. 7B). c-UCNPs were deactivated very quickly (τD ∼ 60 μs) and therefore the emissive excited state cannot be populated for a very long time (relatively short rise time of τR ∼ 20 μs). The well-protected Er3+ emitters in the css-UCNPs were deactivated more slowly (τD ∼ 85 μs) and thus, population of the emissive excited state could become longer (τR ∼ 70 μs). On the other hand, excitation of the emissive state via additional pathways from Nd3+ to Yb3+ was slower (τR ∼ 100 μs). This slower excitation could also be the reason for the quicker deactivation (τD ∼ 75 μs) because there is less excitation during deactivation. While these considerations only provide a very simplistic view, the differences in both decay and rise times, even for the same UCNPs that were excited at different wavelengths/activators, clearly showed the entanglement of excitation and deactivation pathways in UCNPs. The Cy3.5-ssDNA concentration dependence of both decay and rise times (decay times decrease and rise times slightly increase at high Cy3.5-ssDNA concentrations) is another indicator that the additional FRET pathway influences both excitation and deactivation of UCNPs. More detailed investigations, which were out of the scope of our present study, will be necessary to obtain a better understanding of the relation between FRET and UCNP excitation and deactivation.
The time-resolved spectroscopy setup was also able to detect sufficient FRET-sensitized Cy3.5 fluorescence around 607 nm (Fig. S15†), which allowed us to analyze FRET-sensitized decay times (Table S3†), whereas the signals were unfortunately too weak to adequately fit rise times. For low Cy3.5-ssDNA concentrations (below ∼0.1 nmol mg−1), FRET-sensitized fluorescence (in the μs range) was only weakly above background levels and decay times could not be determined. This was in agreement with both steady-state and time-resolved UCL quenching, which did not show significant FRET at low concentrations either. For higher concentrations, the decay times were very similar to those found for UCL-quenching.
Taking into account that the intrinsic fluorescence lifetime of Cy3.5 is in the order of nanoseconds, this long decay time transition from UCNP to Cy3.5 clearly confirmed that the Cy3.5 excitation energy was provided by FRET from the long-lived excited states of Er3+. Interestingly, the time-gated intensities (integrated intensities from 20 μs to 300 μs in the Cy3.5 decay curves) increased with increasing Cy3.5-ssDNA concentrations over approximately four orders of magnitude (Fig. S16†) for both c-UCNP–DNA and css-UCNP–DNA nanohybrids. Although the aim of our study was not the development of DNA biosensors, the DNA concentration dependence of these systems (at both 980 and 808 nm) showed that they could in principle be used for DNA sensing.
Experimental
Materials and methods
Synthetic procedures
![[thin space (1/6-em)]](https://www.rsc.org/images/entities/char_2009.gif) :
:![[thin space (1/6-em)]](https://www.rsc.org/images/entities/char_2009.gif) 3) and isolated by centrifugation (4000 rpm, 15 min). Finally, the white pellet was stored in ethanol.
3) and isolated by centrifugation (4000 rpm, 15 min). Finally, the white pellet was stored in ethanol.
![[thin space (1/6-em)]](https://www.rsc.org/images/entities/char_2009.gif) :
:![[thin space (1/6-em)]](https://www.rsc.org/images/entities/char_2009.gif) 1) were added. The dispersion was stirred in a vortex for 30 s. Then, UCNPs-BF4 were recovered by centrifugation (15 min, 4300 rpm, RT). The precipitate was sonicated twice with 2.2 mL of a toluene
1) were added. The dispersion was stirred in a vortex for 30 s. Then, UCNPs-BF4 were recovered by centrifugation (15 min, 4300 rpm, RT). The precipitate was sonicated twice with 2.2 mL of a toluene![[thin space (1/6-em)]](https://www.rsc.org/images/entities/char_2009.gif) :
:![[thin space (1/6-em)]](https://www.rsc.org/images/entities/char_2009.gif) hexane mixture (1
hexane mixture (1![[thin space (1/6-em)]](https://www.rsc.org/images/entities/char_2009.gif) :
:![[thin space (1/6-em)]](https://www.rsc.org/images/entities/char_2009.gif) 1 by volume) for 15 minutes and then, centrifuged again (15 min, 4300 rpm, RT). The colorless pellet was stored in 1 mL of DMF (10 mg mL−1), ready for the successive ligand exchange. Then, 0.1 mL of the UCNPs-BF4 in DMF (1 mg UCNPs) dispersion were transferred in a 2 mL Eppendorf tube and the desired amount of Cy3.5-ssDNA was added to the solution. The Cy3.5-ssDNA
1 by volume) for 15 minutes and then, centrifuged again (15 min, 4300 rpm, RT). The colorless pellet was stored in 1 mL of DMF (10 mg mL−1), ready for the successive ligand exchange. Then, 0.1 mL of the UCNPs-BF4 in DMF (1 mg UCNPs) dispersion were transferred in a 2 mL Eppendorf tube and the desired amount of Cy3.5-ssDNA was added to the solution. The Cy3.5-ssDNA![[thin space (1/6-em)]](https://www.rsc.org/images/entities/char_2009.gif) :
:![[thin space (1/6-em)]](https://www.rsc.org/images/entities/char_2009.gif) UCNPs nominal ratios were 0.1, 0.5, 1, 2, 2.5 and 4 nmol mg−1. Next, RNA-free water was added up to 1 mL of total volume. The dispersion was stirred in an orbital shaker (600 rpm, 3 hours, RT) and finally incubated overnight at 4 °C. After that, the reaction mixture was centrifuged (12 min, 12
UCNPs nominal ratios were 0.1, 0.5, 1, 2, 2.5 and 4 nmol mg−1. Next, RNA-free water was added up to 1 mL of total volume. The dispersion was stirred in an orbital shaker (600 rpm, 3 hours, RT) and finally incubated overnight at 4 °C. After that, the reaction mixture was centrifuged (12 min, 12![[thin space (1/6-em)]](https://www.rsc.org/images/entities/char_2009.gif) 000 rpm, RT) and the pellet was redispersed in 1 mL of RNA-free water, sonicated for 20 min and centrifuged again (12 min, 12
000 rpm, RT) and the pellet was redispersed in 1 mL of RNA-free water, sonicated for 20 min and centrifuged again (12 min, 12![[thin space (1/6-em)]](https://www.rsc.org/images/entities/char_2009.gif) 000 rpm, RT). The washing cycle sonication/centrifugation was repeated three times in total (3 mL of water). The purified Cy3.5-ssDNA–UCNPs were redispersed in 1 mL of RNA-free water (1 mg mL−1) and stored at 4 °C for further experiments. The final amounts of the ssDNA-Cy3.5 on the UCNPs surface were determined by absorbance measurements and were 0.09 nmol mg−1, 0.47 nmol mg−1, 0.97 nmol mg−1, 1.89 nmol mg−1, 2.46 nmol mg−1, 3.54 nmol mg−1, respectively.
000 rpm, RT). The washing cycle sonication/centrifugation was repeated three times in total (3 mL of water). The purified Cy3.5-ssDNA–UCNPs were redispersed in 1 mL of RNA-free water (1 mg mL−1) and stored at 4 °C for further experiments. The final amounts of the ssDNA-Cy3.5 on the UCNPs surface were determined by absorbance measurements and were 0.09 nmol mg−1, 0.47 nmol mg−1, 0.97 nmol mg−1, 1.89 nmol mg−1, 2.46 nmol mg−1, 3.54 nmol mg−1, respectively.
Conclusions
FRET with UCNPs and modification of the UCNP excitation wavelength from 980 nm to 808 nm by using Nd3+ activators instead of Yb3+ are two important topics in the development of UCNP-based biosensors and imaging agents. However, combining FRET and Yb3+/Nd3+ co-doping in UCNPs to gain a more profound understanding of UCNP-to-dye FRET and to use this understanding for better biosensor development has not been investigated. With the aim to learn more about UCNP-based FRET and to possibly apply this knowledge for future UCNP-FRET biosensors, we synthesized Yb3+/Er3+ co-doped UCNPs and coated them with a thin Nd3+-doped shell and a second undoped shell to yield comparable Yb3+/Er3+-core UCNPs (c-UCNP) and Yb3+/Er3+-core/Nd3+-shell/protective-shell UCNPs (css-UCNPs).Owing to the same core for both UCNPs, they differed only in their brightness (css-UCNPs were protected from the environment by the outer undoped shell) and the possible excitation wavelength (in c-UCNPs only Yb3+ could be excited by 980 nm whereas in css-UCNPs Yb3+ in the core could be excited by 980 nm and Nd3+ in the inner shell could be excited by 808 nm). The higher brightness was experimentally confirmed by a ∼13-fold increase from c-UCNP[λex = 980 nm] to css-UCNP[λex = 980 nm]. Although the shell contained only ∼4 times less Nd-ions than Yb-ions in the core, css-UCNP[λex = 808 nm] were ∼14-fold less bright than css-UCNP[λex = 980 nm]. Despite the lower water absorption at 808 nm and the higher absorption cross section of Nd3+ compared to Yb3+, the decreased brightness was most probably caused by energy backtransfer from Er3+ to Nd3+ at the core–shell interface, and showed that more sophisticated core/shell architectures are necessary for fully exploiting the advantageous properties of Nd3+ activators.
More important than the somewhat expected differences in the UCL of c-UCNPs and css-UCNPs, the attachment of Cy3.5-ssDNA and unlabeled ssDNA on the UCNP surfaces via electrostatic interactions allowed us to investigate FRET for the different types of UCNPs at the different excitation modes (980 nm or 808 nm). Cy3.5-ssDNA dependent FRET-quenching of UCNP luminescence of up to ca. 20% was found for all UCNP–DNA conjugates. The use of both steady-state and time-resolved PL spectroscopy was necessary to conclude that the FRET-quenching was similar for the different UCNP–DNA conjugates (with c-UCNPs and css-UCNPs) and excitation conditions (with 980 nm and 808 nm). When comparing our results with other UCNP-to-dye energy transfer studies, which often revealed significant differences between steady-state and time-resolved PL results with quenching efficiencies below 50% in the most cases (Table 1), the determined quenching efficiency of ∼20% seems realistic and the importance of a broad characterization (different types of UCNPs, different excitation wavelengths, both steady-state and time-resolved PL detection) becomes evident.
| UCNPs | Dye | Quenching (%) | Ref. | ||
|---|---|---|---|---|---|
| Composition | Size (nm) | SS | TR | ||
| NaYF4:Yb,Er | 27 ± 2 | Cy3.5 | 20 | 20 | * |
| NaYF4:Yb,Er@NaYF4:Nd@NaYF4 | 31 ± 3 | Cy3.5 | 20 | 20 | * |
| NaYF4:Yb,Er@NaYF4 | 27.4 | Rose bengal | 30 | 50 | 31 |
| NaYF4:Yb,Er | 38.4 ± 1.7 | BODIPY | 50 | 19 | 26 |
| NaYF4:Yb,Er | 20 | Rose bengal | 83 | 40 | 27 |
| NaYF4:Yb,Er,Tm | 23.1 ± 1.1 | Napthalimide and porphyrin | 80 | 50 | 58 |
| NaYF4:Yb,Er | 10 to 43 | Rose bengal Sulforhodamine B | — | 10 to 55 | 28 |
| NaYF4:Yb,Er@NaYF4 | 10 to 43 | Rose bengal Sulforhodamine B | — | 10 to 60 | 28 |
| NaYF4:Yb,Er | 30.6 ± 1.1 | Rhodamine B | 20 | 10 | 29 |
| NaGdF4:Yb,Er | 17 ± 2 | Cy3.5 | — | 49 | 30 |
| NaGdF4:Yb,Er@NaGdF4 | 24 ± 3 | Cy3.5 | — | 25 | 30 |
| NaGdF4@NaGdF4:Yb,Er | 15 ± 3 | Cy3.5 | — | 45 | 30 |
| NaYF4:Yb,Tm | 6.3 | DBD-6 | — | 30 | 59 |
| NaYF4:Yb,Tm@NaYF4 | 5.5 | DBD-6 | — | 15 | 59 |
| NaYF4:Yb,Er@NaYF4 | 26 to 44 | Rose bengal | 10 to 20 | — | 60 |
The higher sensitivity of the time-resolved setup and the concentration-independence of PL lifetimes provided us with a more precise picture of the energy transfer processes because we were able to investigate rise and decay times of UCL as well as FRET-sensitized Cy3.5 PL. This time-resolved data showed that the longer donor–acceptor distances in css-UCNPs (in which the two shells separate the dye-acceptors further from the Er3+ donors in the core) were alleviated by the improved optical properties of the shell-protected donors and resulted in very similar FRET-quenching of UCL for all UCNP–DNA conjugates. The differences in UCL decay and rise times even for the same css-UCNPs but depending on the excitation wavelength (980 nm or 808 nm) also showed that excitation and deactivation (via emission or FRET) are closely related, most probably due to the different and multiple energy pathways and long-lived excited states in UCNPs.
While our results showed the importance of a detailed analysis of UCNP FRET under varying but comparable conditions and with both steady-state and time-resolved PL spectroscopy, we could also show that the time-gated FRET-sensitized Cy3.5 PL intensity could be used for quantifying DNA in water over approximately four orders of magnitude. Although this detection was independent of the type of UCNP or the mode of excitation, the brightest css-UCNP[λex = 980 nm] provided the highest precision whereas the lower Cy3.5 PL intensities of css-UCNP[λex = 808 nm] showed the necessity of optimizing Nd-excitation based UCNP-FRET. Nevertheless, this proof-of-concept for UCNP-FRET quantification of DNA by both 980 nm and 808 nm excitation is very encouraging for future studies toward applicable nucleic acid biosensors and our results demonstrated the importance of a profound and careful spectroscopic analysis of such UCNP–DNA nanohybrids.
Conflicts of interest
There are no conflicts to declare.Acknowledgements
We thank the French Agence National de Recherche (ANR, ERA-Net project “NANOHYPE”), the Subprograma Atracció de Talent Contractes Postdoctorals de la Universitat de València, the European Commission (Marie Skłodowska-Curie Actions, Individual Fellowship of Laura Francés-Soriano), and the ERASMUS+ programme of University of Padova for financial support and the COST-action CM1403 (The European Upconversion Network) for stimulating scientific discussion among the participating partners.Notes and references
- FRET – Förster Resonance Energy Transfer, ed. I. Medintz and N. Hildebrandt, John Wiley & Sons, 2013 Search PubMed.
- J. R. Lakowicz, Principles of Fluorescence Spectroscopy, Springer US, 2006 Search PubMed.
- O. Tagit and N. Hildebrandt, ACS Sens., 2017, 2, 31–45 CrossRef CAS PubMed.
- K. E. Sapsford, L. Berti and I. L. Medintz, Angew. Chem., Int. Ed., 2006, 45, 4562–4589 CrossRef CAS PubMed.
- A. C. S. Samia, X. Chen and C. Burda, J. Am. Chem. Soc., 2003, 125, 15736–15737 CrossRef CAS PubMed.
- D. Geißler and N. Hildebrandt, Anal. Bioanal. Chem., 2016, 408, 4475–4483 CrossRef PubMed.
- M. Cardoso Dos Santos and N. Hildebrandt, TrAC, Trends Anal. Chem., 2016, 84, 60–71 CrossRef CAS.
- W. R. Algar, N. Hildebrandt, S. S. Vogel and I. L. Medintz, Nat. Methods, 2019, 16, 815–829 CrossRef CAS PubMed.
- B. W. van der Meer, FRET – Förster Reson. Energy Transf, 2013 Search PubMed.
- N. Hildebrandt, in FRET – Förster Resonance Energy Transfer, Wiley-VCH Verlag GmbH & Co. KGaA, 2013, pp. 105–163 Search PubMed.
- C. Li, J. Zuo, Q. Li, Y. Chang, Y. Zhang, L. Tu, X. Liu, B. Xue, H. Zhao, H. Zhang and X. Kong, Biosens. Bioelectron., 2017, 92, 335–341 CrossRef CAS PubMed.
- S. Li, L. Xu, M. Sun, X. Wu, L. Liu, H. Kuang and C. Xu, Adv. Mater., 2017, 29, 1606086 CrossRef PubMed.
- P. Jiang, M. He, L. Shen, A. Shi and Z. Liu, Sens. Actuators, B, 2017, 239, 319–324 CrossRef CAS.
- S. F. Himmelstoß and T. Hirsch, Methods Appl. Fluoresc., 2019, 7, 22002 CrossRef PubMed.
- B. del Rosal and D. Jaque, Methods Appl. Fluoresc., 2019, 7, 22001 CrossRef CAS PubMed.
- G. Jalani, V. Tam, F. Vetrone and M. Cerruti, J. Am. Chem. Soc., 2018, 140, 10923–10931 CrossRef CAS PubMed.
- B. Chen, Q. Su, W. Kong, Y. Wang, P. Shi and F. Wang, J. Mater. Chem. B, 2018, 6, 2924–2944 RSC.
- A. Gnach, T. Lipinski, A. Bednarkiewicz, J. Rybka and J. A. Capobianco, Chem. Soc. Rev., 2015, 44, 1561–1584 RSC.
- H. Oliveira, A. Bednarkiewicz, A. Falk, E. Fröhlich, D. Lisjak, A. Prina-Mello, S. Resch, C. Schimpel, I. V. Vrček, E. Wysokińska and H. H. Gorris, Adv. Healthcare Mater., 2019, 8, 1801233 CAS.
- Z. Zhang, S. Shikha, J. Liu, J. Zhang, Q. Mei and Y. Zhang, Anal. Chem., 2019, 91, 548–568 CrossRef CAS PubMed.
- C. Wang, X. Li and F. Zhang, Analyst, 2016, 141, 3601–3620 RSC.
- Y. Liu, X. Meng and W. Bu, Coord. Chem. Rev., 2019, 379, 82–98 CrossRef CAS.
- N. Hildebrandt, C. M. Spillmann, W. R. Algar, T. Pons, M. H. Stewart, E. Oh, K. Susumu, S. A. Díaz, J. B. Delehanty and I. L. Medintz, Chem. Rev., 2017, 117, 536–711 CrossRef CAS PubMed.
- C. Chen and N. Hildebrandt, TrAC, Trends Anal. Chem., 2020, 123, 115748 CrossRef.
- P. A. Rojas-Gutierrez, S. Bhuckory, C. Mingoes, N. Hildebrandt, C. DeWolf and J. A. Capobianco, ACS Appl. Nano Mater., 2018, 1, 5345–5354 CrossRef CAS.
- L. Francés-Soriano, M. Liras, A. Kowalczyk, A. Bednarkiewicz, M. González-Béjar and J. Pérez-Prieto, Nanoscale, 2016, 8, 204–208 RSC.
- K. Liu, X. Liu, Q. Zeng, Y. Zhang, L. Tu, T. Liu, X. Kong, Y. Wang, F. Cao, S. A. G. Lambrechts, M. C. G. Aalders and H. Zhang, ACS Nano, 2012, 6, 4054–4062 CrossRef CAS PubMed.
- V. Muhr, C. Würth, M. Kraft, M. Buchner, A. J. Baeumner, U. Resch-Genger and T. Hirsch, Anal. Chem., 2017, 89, 4868–4874 CrossRef CAS PubMed.
- O. Dukhno, F. Przybilla, M. Collot, A. Klymchenko, V. Pivovarenko, M. Buchner, V. Muhr, T. Hirsch and Y. Mély, Nanoscale, 2017, 9, 11994–12004 RSC.
- S. Bhuckory, E. Hemmer, Y. T. Wu, A. Yahia-Ammar, F. Vetrone and N. Hildebrandt, Eur. J. Inorg. Chem., 2017, 2017, 5186–5195 CrossRef CAS.
- Y. Wang, K. Liu, X. Liu, K. Dohnalová, T. Gregorkiewicz, X. Kong, M. C. G. Aalders, W. J. Buma and H. Zhang, J. Phys. Chem. Lett., 2011, 2, 2083–2088 CrossRef CAS.
- S. Lahtinen, Q. Wang and T. Soukka, Anal. Chem., 2016, 88, 653–658 CrossRef CAS PubMed.
- L. Mattsson, K. D. Wegner, N. Hildebrandt and T. Soukka, RSC Adv., 2015, 5, 13270–13277 RSC.
- M. González-Béjar, M. Liras, L. Francés-Soriano, V. Voliani, V. Herranz-Pérez, M. Duran-Moreno, J. M. Garcia-Verdugo, E. I. Alarcon, J. C. Scaiano and J. Pérez-Prieto, J. Mater. Chem. B, 2014, 2, 4554–4563 RSC.
- L. Francés-Soriano, S. Gonzalez-Carrero, E. Navarro-Raga, R. E. Galian, M. González-Béjar and J. Pérez-Prieto, Adv. Funct. Mater., 2016, 26, 5131–5138 CrossRef.
- B. Liu, C. Li, P. Yang, Z. Hou and J. Lin, Adv. Mater., 2017, 29, 1605434 CrossRef PubMed.
- M. J. Weber, Phys. Rev. B: Solid State, 1971, 4, 3153–3159 CrossRef.
- M.-H. Chan and R.-S. Liu, Nanoscale, 2017, 9, 18153–18168 RSC.
- S. T. Dibaba, X. Ge, W. Ren and L. Sun, J. Rare Earths, 2019, 37, 791–805 CrossRef CAS.
- Y. Zhang, Z. Yu, J. Li, Y. Ao, J. Xue, Z. Zeng, X. Yang and T. T. Y. Tan, ACS Nano, 2017, 11, 2846–2857 CrossRef CAS PubMed.
- F. Ai, Q. Ju, X. Zhang, X. Chen, F. Wang and G. Zhu, Sci. Rep., 2015, 5, 10785 CrossRef CAS PubMed.
- Z. Hou, K. Deng, C. Li, X. Deng, H. Lian, Z. Cheng, D. Jin and J. Lin, Biomaterials, 2016, 101, 32–46 CrossRef CAS PubMed.
- M. S. Meijer, V. S. Talens, M. F. Hilbers, R. E. Kieltyka, A. M. Brouwer, M. M. Natile and S. Bonnet, Langmuir, 2019, 35, 12079–12090 CrossRef CAS PubMed.
- N. J. J. Johnson, A. Korinek, C. Dong and F. C. J. M. van Veggel, J. Am. Chem. Soc., 2012, 134, 11068–11071 CrossRef CAS PubMed.
- N. J. J. Johnson, S. He, S. Diao, E. M. Chan, H. Dai and A. Almutairi, J. Am. Chem. Soc., 2017, 139, 3275–3282 CrossRef CAS PubMed.
- X. Xie, N. Gao, R. Deng, Q. Sun, Q.-H. Xu and X. Liu, J. Am. Chem. Soc., 2013, 135, 12608–12611 CrossRef CAS PubMed.
- F. He, C. Li, X. Zhang, Y. Chen, X. Deng, B. Liu, Z. Hou, S. Huang, D. Jin and J. Lin, Dalton Trans., 2016, 45, 1708–1716 RSC.
- Y. Zhong, G. Tian, Z. Gu, Y. Yang, L. Gu, Y. Zhao, Y. Ma and J. Yao, Adv. Mater., 2014, 26, 2831–2837 CrossRef CAS PubMed.
- L. M. Wiesholler, F. Frenzel, B. Grauel, C. Würth, U. Resch-Genger and T. Hirsch, Nanoscale, 2019, 11, 13440–13449 RSC.
- S. Wilhelm, M. Kaiser, C. Würth, J. Heiland, C. Carrillo-Carrion, V. Muhr, O. S. Wolfbeis, W. J. Parak, U. Resch-Genger and T. Hirsch, Nanoscale, 2015, 7, 1403–1410 RSC.
- A. Dong, X. Ye, J. Chen, Y. Kang, T. Gordon, J. M. Kikkawa and C. B. Murray, J. Am. Chem. Soc., 2011, 133, 998–1006 CrossRef CAS PubMed.
- J. Guo, X. Qiu, C. Mingoes, J. R. Deschamps, K. Susumu, I. L. Medintz and N. Hildebrandt, ACS Nano, 2019, 13, 505–514 CrossRef CAS PubMed.
- M. Y. Hossan, A. Hor, Q. Luu, S. J. Smith, P. S. May and M. T. Berry, J. Phys. Chem. C, 2017, 121, 16592–16606 CrossRef CAS.
- C. Chen, B. Corry, L. Huang and N. Hildebrandt, J. Am. Chem. Soc., 2019, 141, 11123–11141 CrossRef CAS PubMed.
- P. D. M. Sauer, D. J. Enderlein and J. Hofkens, Handbook of Fluorescence Spectroscopy and Imaging: From Single Molecules to Ensembles, Wiley-VCH, 2011 Search PubMed.
- N. G. Zhegalova, S. He, H. Zhou, D. M. Kim and M. Y. Berezin, Contrast Media Mol. Imaging, 2014, 9, 355–362 CrossRef CAS PubMed.
- J. Kang, O. Kaczmarek, J. Liebscher and L. Dähne, Int. J. Polym. Sci., 2010, 2010, 7 Search PubMed.
- L. Francés-Soriano, M. A. Zakharko, M. González-Béjar, P. A. Panchenko, V. Herranz-Pérez, D. A. Pritmov, M. A. Grin, A. F. Mironov, J. M. García-Verdugo, O. A. Fedorova and J. Pérez-Prieto, Chem. Mater., 2018, 30, 3677–3682 CrossRef.
- A. L. De Guereñu, P. Bastian, P. Wessig, L. John and M. U. Kumke, Biosensors, 2019, 9, 9 CrossRef PubMed.
- Y. Ding, F. Wu, Y. Zhang, X. Liu, E. M. L. D. De Jong, T. Gregorkiewicz, X. Hong, Y. Liu, M. C. G. Aalders, W. J. Buma and H. Zhang, J. Phys. Chem. Lett., 2015, 6, 2518–2523 CrossRef CAS PubMed.
Footnotes |
| † Electronic supplementary information (ESI) available: XRD, TEM, TGA, DLS, hydrodynamic diameter, absorption and emission spectra, decay and rise times values, FRET efficiency. See DOI: 10.1039/c9an02532d |
| ‡ These authors have contributed equally. All authors have given approval to the final version of the manuscript. |
| § Present address: Department of Chemical Sciences, University of Padova, Via Francesco Marzolo 1, 35131 Padova, Italy. |
| This journal is © The Royal Society of Chemistry 2020 |

