Pd–Pt nanostructures on carbon nanofibers as an oxygen reduction electrocatalyst
Andres Godinez-Garcia and
Dominic F. Gervasio*
Department of Chemical & Environmental Engineering, the University of Arizona, Tucson, AZ 85721, USA. E-mail: gervasio@email.arizona.edu
First published on 29th August 2014
Abstract
A new oxygen reduction catalyst is made of Pd and Pt nanostructures (Pd–Pt) supported on a herring-bone arrangement of carbon nanofibers (NFs) and is synthesized in one pot by the sequential reduction of Pd2+ and Pt4+ in aqueous chloride solution with ethylene glycol and then adding the carbon NF to precipitate the catalyst. The exchange current density for the oxygen reduction reaction (ORR) on Pd–Pt is 1.44 × 10⁻⁴ mA cm−2 versus 1.41 × 10⁻⁴ mA cm−2 for pure Pt as determined using a thin-film rotating disk electrode (TF-RDE) method. A single cell hydrogen anode and oxygen cathode fuel cell in which the cathode is catalyzed with Pd–Pt gives a performance as good as or better than with a commercial Pt catalyst in the cathode for the same total metal loading, 0.5 mgmetal cm−2. This shows the catalyst made of Pd–Pt supported on carbon NF is a low cost alternative to Pt on carbon, because it gives the same or better activity with less Pt.
Introduction
The depletion of petroleum reserves and climate change due to carbon dioxide emissions are drawing renewed attention to fuel cell technologies, because fuel cells have higher efficiencies and lower emissions compared to conventional internal combustion engines. Fuel cells are electrochemical devices that directly convert chemical energy stored in hydrogen or other fuels to electrical energy1 and are often classified according to the electrolyte employed. One favored class is polymer electrolyte membrane (PEM) fuel cell (FC), whose small size and light weight make this technology promising for zero-emission transportation. However the need for lowered cost and improved durability challenge widespread commercialization.2–5The core of a PEM fuel cell is the membrane electrode assembly (MEA), which consists of a thin polymer electrolyte membrane, whose 2 surfaces are covered by anode and cathode catalyst layers, and then gas diffusion layers. The MEA is prone to degradation under the duty cycles required for an automotive fuel cell. These duty cycles consist of rapid potential cycling, changes in temperature, changes in humidity, and many start-up and shut-down events.6,7 The three main causes of decreasing PEMFC performance are (1) Pt dissolution,6 (2) corrosion of catalyst support7 and (3) chemical oxidative degradation of the membrane by radicals generated during fuel cell operation.8 In order to overcome these 3 causes of performance loss, alternative materials have been proposed to improve the characteristics of the catalysts,9–11 supports7 and membranes12 in PEM fuel cells to improve durability in harsh conditions and changing temperature.13,14
The catalyst is perhaps the most expensive component in a fuel cell. Lowering catalyst cost has been difficult, because only nanostructured noble metals, e.g., gold, palladium and platinum, show the requisite long term stability and activity under the working conditions of a PEMFC.15–17 Lowering noble metal content, while retaining activity, is a strategy for reducing metal cost. There are ways to decrease the amount of precious metals; one way is to use a core–shell nanostructure, because these structures have the most expensive material only on the surface of a lower cost core. The core–shell nanostructure can be formed using a sequential reduction of metal ions.17 In this work, Pd–Pt nanostructures were synthesized by a sequential reduction of Pd2+ and then Pt4+ using ethylene glycol. This Pd–Pt catalytic material can be easily mass produced and has better performance that a commercial Pt catalyst with the same total loading of metals. The new Pd–Pt nanostructures were supported on high surface area herring-bone carbon nanofiber (NF) and the electrochemical kinetic parameters for the oxygen reduction reaction, which is the rate limiting reaction in a fuel cell power generation, were obtained using the thin-film rotating disk electrode technique (TF-RDE).18
Experimental
Synthesis
To obtain the metallic nanostructures, first, the ionic metal chloride species were dissolved in aqueous KCl solution and then chemically reduced to metallic species. Palladium(II) chloride (PdCl2) does not have good solubility in water, however it readily dissolves when a small amount of KCl is added to the solution, because a coordination complex, K2PdCl4, forms that is very soluble in water. This occurs according to the following chemical reaction.19| PdCl2 + 2 KCl → K2PdCl4 |
Accordingly, 200 ml of a solution 0.0027 M KCl was prepared and then 5.65 × 10⁻⁵ mol of PdCl2 was added. Then the chemicals were mixed using an ultrasonic agitation at 65 °C for one hour, and, the color of the solution changed from opaque orange to transparent yellow. Next 100 ml of ethylene glycol was added and was stirred with a magnetic stir bar for 40 min at the boiling point under reflux of the solvent. The solution became intensely dark in color indicating the formation of Pd metal nanoparticles. At this point 50 ml of 3.1 × 10⁻⁵ mol of aqueous chloroplatinic acid hexahydrate was added and the solution stirred for another 40 min. After this time, 48 mg of carbon NF (Creos 4-171 herring-bone from MER corporation) was added and stirred briefly with a magnetic stir bar and then by ultrasonic stirring for 10 min, and then by the stir bar for 3 hours. All the metal particles deposited on the surface of the carbon NF support and precipitated. The composite metal and NF particles were centrifuged and washed five times with deionized water to completely remove any remaining ions and ethylene glycol. This procedure was used to make three catalysts consisting of 20 wt% Pd–Pt/NF, and 20 wt% Pd/NF and 20 wt% Pt/NF by similar procedures. A 50 wt% Pd–Pt/NF catalyst was also made by altering the initial concentration of reagents in solution in the ratio of the desired loading.
Physical characterization
X-ray diffraction (XRD) was employed to determine the phases in the powder catalyst, using a Scintag XDS 2000 PTS Diffractometer, CuKα1, λ = l.5405. For catalyst morphology a field-emission SEM Instrument, a Hitachi S-4800 Type II/ThermoNORAN NSS EDS, was operated at 15 kV. The TEM images were obtained using a Hitachi H8100 TEM – a 200 kV conventional TEM with high brightness LaB6 electron source, large specimen-tilt (>30°) capabilities, phase contrast resolution of better than 0.26 (point) and 0.14 nm (line). The Hitachi H8100 TEM is equipped with small probe forming lenses for nanodiffraction, convergent bean electron diffraction (CBED) and hollow-cone illumination and a heating stage (up to 1000 °C) and a LN2 cooling stage coupled with charge-coupled device (CCD) high resolution camera for dynamic in situ experiments.Electrochemical characterization
Electrochemical experiments were evaluated in a double compartment three-electrode test cell at 298 K. The electrolyte was a 0.5 M H2SO4 solution prepared from deionized water which was degassed with N2, during voltammetric activation of the working electrode, and saturated with O2 for 20 min before each electrochemical measurement to determine the kinetics of the ORR. A spectroscopic graphite rod was used as the counter electrode and saturated calomel electrode (SCE made with Cl (4 M)|Hg2Cl2(s)|Hg(l)|Pt and ESCE = 0.241 V versus NHE) was the reference electrode.MEA preparation
The membrane electrode assembly (MEA) was prepared using a catalytic ink with 50 wt% Pd–Pt catalyst dispersed on a carbon cloth gas diffusion layer (GDL) with an area of 4 cm2. The catalytic ink was 4 mg of the catalyst mixed with 456 μl of isopropyl alcohol and 25 μl of 5 wt% Nafion solution (from Sigma-Aldrich) under ultrasonic agitation for 30 min. After the catalyst layer was deposited on the GDL, a Nafion layer was over coated from 25 μl of Nafion solution plus 175 μl isopropyl alcohol. The prepared electrode and a commercial electrode were hot pressed to a Nafion 115 membrane by pressing at a pressure of 0.625 ton/cm2 and temperature of 135 °C in air for 2.5 min. For both the cathode and anode, the catalyst loading was 0.5 mgcatalyst cm−2. For comparison, an MEA was made from a commercial gas diffusion electrode (GDE) from Fuel Cells Etc for anode and cathode. Fuel cells were studied at room temperature and pressure.Results and discussion
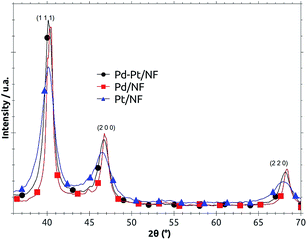
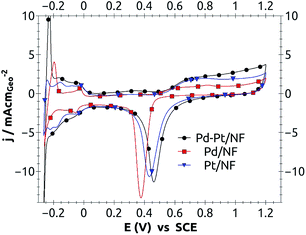
The X-ray diffraction spectra for the newly synthesized Pd, Pt and Pd–Pt/NF catalysts are shown in Fig. 1. The authentic Pd and Pt characteristic diffraction signals are depicted for comparison. It can be observed that the planes (111), (200) and (220) corresponding to pure palladium and pure platinum don't match with those of Pd–Pt synthesized catalyst. Also it can be observed that the planes of the bimetallic material are in middle of those of the Pd and Pt. This last observation is a strong indication that the synthesized material obtained is a Pd–Pt bimetallic alloy, despite the fact that the Pd precursor was added first and the Pt precursor afterwards.Before using the catalysts, in a single PEMFC, they were characterized by electrochemical techniques to gain insights about: their physical structures, reaction mechanisms and electrochemical catalytic activities. A rapid overview of the oxidation and reduction processes, on an electrode, was obtained by cyclic voltammetry in which electrode potential was scanned and the current-response was read (Fig. 2). From these voltammograms it was possible to discern that the Pd–Pt catalyst had different electrochemical properties than pure Pd or Pt, as was expected from the XRD results. From Fig. 2, a positive potential shift for the Pd–Pt/NF peak can clearly be seen compared to those for Pd and Pt. The oxygen reduction peak potential showed a minimum at 0.377 V, 0.432 V and 0.462 V; for Pd, Pt and Pd–Pt/NF, respectively (see Table 1). This shift for the Pd–Pt peak indicated that combining both metals produced synergistic catalytic effects.
| 20 wt% catalyst/NF | −b/V dec−1 | α | j0/mA cm−2 |
|---|---|---|---|
| Pd/NF | 0.110 | 0.53 | 1.07 × 10⁻⁵ |
| Pt/NF | 0.110 | 0.53 | 1.41 × 10⁻⁴ |
| Pd–Pt/NF | 0.114 | 0.51 | 1.44 × 10⁻⁴ |
It should be noted that the metallic ions were added and reduced one after the other, and due to this sequential reduction it was expected to yield segregated Pd and Pt nanoparticles. However, the metals combined to form mixed Pd–Pt nanostructures (see XRD diffraction patterns, Fig. 1), which showed synergistic catalytic effects, similar to those observed with the core–shell structure synthesized by Adzic et al.14,15
Also in Fig. 2, it was observed that the adsorption and desorption peaks were similar but had fine differences. The differences among the three catalysts were attributed to changes of the adsorption energy for the hydrogen on the different surfaces of each catalyst; which resulted from the intrinsic properties of each material and the different morphologies on the surfaces of the nanostructures.
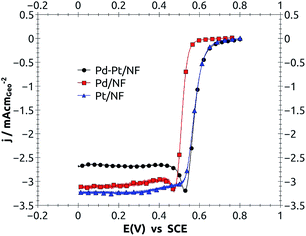
From the linear sweep polarization curves at potentials higher than 0.55 V vs. SCE where electron transfer dominated the overall current density (Fig. 3), it was observed that the 20 wt% Pd–Pt catalyst had practically the same current density as pure Pt., which means that the intrinsic kinetic parameters for the oxygen reduction reaction were almost equal. These were calculated using the thin-film rotating disk electrode technique and the Tafel equation (ref. 18); the results are summarized and shown in Table 1.
It is clear from Table 1 that the kinetic parameters for Pd–Pt/NF and Pt/NF [the exchange current density (j0), transfer coefficient (α) and Tafel slope (−b)] were practically the same. The exchange current density (j0) for Pd–Pt was 1.44 × 10⁻⁴ which was higher than 1.41 × 10⁻⁴ mA cm−2 obtained for pure Pt, which indicated that Pd–Pt was the most active catalyst.
The electrochemical kinetic parameters are intrinsic properties of each catalyst surface; they only depend on the surface composition and surface structure. Considering this, one expected a diminishing effect upon adding Pd into the Pd–Pt catalyst when averaging the amount of Pt and Pd and their individual activities from Table 1. However the electrochemical kinetics of Pd–Pt catalyst was like that of a pure platinum surface. So the absence of Pd signs in the I–V curves (Fig. 2 and 3) can only be explained if Pt is covering most of the Pd nanoparticles. The slight excess of relative activity (1.44/1.41) may be experimental error or a geometry effect.
In the Fig. 4 are shown the TEM images for the Pd/NF (Fig. 4a) and Pt/NF (Fig. 4b), and in the same figure a SEM picture with low magnification of the Pd–Pt/NF sample (Fig. 4c) is presented while that in the Fig. 4d a picture with a higher magnification is shown. From Fig. 4, the distribution of particle size for the three catalytic nanoparticles is shown. The Pd size distribution was in the range of 6 and 14 nm (Fig. 4c) and while that for the Pd–Pt nanostructures was in the range of 6–16 nm with the highest frequency at 10 nm (see Fig. 4c and d). So the average particle size was higher for Pd–Pt than that obtained for pure platinum which is in the range of 2.5 and 4.5 nm;6 this last feature can be an advantage for Pd–Pt nanostructures since the stability of a nanoparticle increases with increasing diameter according to the Gibbs–Thomson equation [see page 301 of ref. 6].
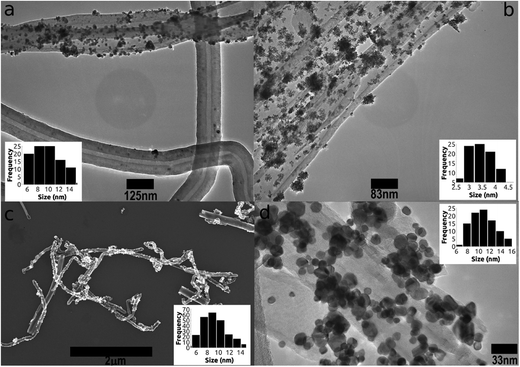 | ||
| Fig. 4 (a) TEM image and distribution of particle size for the Pd/NF catalyst, (b) for the Pt/NF catalyst, (c) for the Pd–Pt/NF, and (d) a higher magnification of the Pd–Pt/NF catalyst sample. | ||
In the Fig. 4a is possible to observe that some nanofibers were almost uncovered while some of the nanofibers were almost completely covered with Pd nanoparticles.
This coverage difference can be rationalized, and possibly optimized, a number of ways. From Fig. 4, it can be seen that the structure of the nanofibers were different. Some nanofibers had wider walls, whose surface was less prone to metal coverage. Nanofibers with narrower walls showed a higher affinity for metallic nanoparticles. The wider wall nanofibers had more inert surfaces, because they have a more ordered structure, and with less surface defects, so the wider walls showed less attraction for metallic nanoparticles. The heat treatment during the NF synthesis can change the structure of the nanofibers. To get more consistency in the fibers requires that the heat transfer during the synthesis of the nanofibers should be more homogeneous, in order to improve control of structure and therefore the density of nanoparticles on the nanofibers. Lastly, during the initial nucleation of the metallic catalysts, some nanofibers can be exposed more to reagents than others. Therefore a more homogeneous distribution of metal on fiber can be achieved using more intense ultrasound during deposition of the metallic nanostructures on the nanofibers.
Oxygen reduction is the slowest electrochemical reaction in a PEMFC. After analyzing the electrochemical properties of Pd–Pt for oxygen reduction reaction, it was clear that this Pd–Pt material showed excellent properties for use as a catalyst for the PEMFC air cathode. So a membrane electrode assembly (MEA) was prepared using the 50 wt% Pd–Pt catalyst to make a catalytic ink which was dispersed on a carbon cloth gas diffusion layer (GDL). In this way the cathode for the MEA in a PEM fuel cell was obtained. The prepared cathode was hot pressed on a Nafion 115 membrane and a commercial Pt catalyzed electrode (Fuel Cells Etc) was used as the anode. The total metal loading for all electrodes was 0.5 mg of catalyst per cm2.
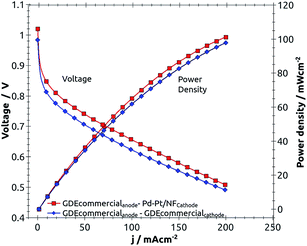
Fig. 5 shows the performances of fuel cells with the Pd–Pt cathode (red square) and a commercial gas fed electrode used as the oxygen cathode (blue diamond) at room temperature.
From Fig. 5, it is clear there was a higher performance of the single fuel cell, when Pd–Pt was used in the cathode and a commercial Pt electrode was used in the anode versus when a commercial Pt electrode was used for both the cathode and anode. Because of the relative kinetic parameters of the ORR for Pd–Pt and Pt (relative j0 = 1.44/1.41) are virtually the same; the performances were expected to be virtually the same, however the fuel cell with the Pd–Pt catalyzed cathode was slightly better than the one with a Pt catalyzed cathode. Simple explanations for the greater than 2% enhanced improvement of the performance of the single fuel cell with the Pd–Pt over Pt catalyst are that mass transport in the MEA with Pd–Pt is better or that the surface area of the metal in the Pd–Pt nanostructures is higher than that of pure Pt nanoparticles.20
In order to get higher performance with Pd–Pt catalyst, Pt must cover the Pd nanoparticles, since the Pd surface had a much lower activity that the Pt surface for the ORR (see Table 1), and the enhanced performance of the fuel cell would be maintained as long as Pt over coated palladium. Clearly, the amount of platinum in the Pd–Pt nanoparticles can be decreased below 50%, but how much below 50% is difficult to know. Some empirical optimization should be done in order to determine the exact amount of Pt and Pd in solution leads to the minimum Pt to form a surface shell of Pt over a Pd core while stably maintaining the catalytic activity of the Pd–Pt catalyst.14,15 This optimization and stability testing is the subject of ongoing work to find the optimal catalyst, that is, the Pd–Pt catalyst with the lowest cost and highest performance.
Conclusion
Pd–Pt nanostructures were synthesized by a sequential reduction of Pd2+ and Pt4+ using an ethylene glycol reduction method and deposited on herringbone-oriented carbon nanofibers. The Pd and Pt supported on carbon nanofibers were characterized by XRD, SEM and TEM as well as electrochemical techniques and showed characteristics of a surface structure rich in platinum. The electrochemical kinetic parameters for catalytic oxygen electroreduction with the Pd–Pt catalyst are equal to pure Pt. A better performance in a single fuel cell was found with a Pd–Pt catalyzed cathode than with a pure Pt commercial cathode catalyst when both had the same loading of 0.5 mg of total metal per cm2. Therefore this Pd–Pt catalyst, synthesized using the described method, is a promising alternative to pure Pt catalyst as a lower-cost catalyst for the cathode of a PEMFC.Acknowledgements
A.G.G. appreciates the funding provided by the national council of science and technology (CONACYT) for the postdoctoral stay in the University of Arizona (U of A) through the program of postdoctoral and sabbatical stays 2012–2014, also to at Steven Hernandez of the material science department (from UA) for its SEM training, and at MER corporation for providing the carbon nanofibers.References
- Y. Wang, K. S. Chen, J. Mishler, S. C. Cho and X. C. Adroher, A review of polymer electrolyte membrane fuel cells: technology, applications, and needs on fundamental research, Appl. Energy, 2011, 88, 981–1007 CrossRef CAS PubMed.
- A. Godínez-García, J. F. Pérez-Robles, H. V. Martínez-Tejada and O. Solorza-Feria, Characterization and electrocatalytic properties of sonochemical synthesized PdAg nanoparticles, Mater. Chem. Phys., 2012, 134, 1013–1019 CrossRef PubMed.
- A. Godínez-García, A. García-García, H. V. Martínez-Tejada, J. F. Pérez-Robles and S. F. Omar, Electrochemical Properties of Nanostructured AgxPt100−x/C Electrocatalyst for Oxygen Reduction Reaction, J. New Mater. Electrochem. Syst., 2012, 15, 129–135 Search PubMed.
- N. Macauley, et al. Pt Band Formation Enhances the Stability of Fuel Cell Membranes, ECS Electrochem. Lett., 2013, 2, F33–F35 CrossRef CAS PubMed.
- A. Brouzgou, S. Q. Song and P. Tsiakaras, Low and non-platinum electrocatalysts for PEMFCs: current status, challenges and prospects, Appl. Catal., B, 2012, 127, 371–388 CrossRef CAS PubMed.
- Y. Shao-Horn, et al. Instability of Supported Platinum Nanoparticles in Low-Temperature Fuel Cells, Top. Catal., 2007, 46, 285–305 CrossRef CAS.
- Y. Shao, J. Liu, Y. Wang and Y. Lin, Novel catalyst support materials for PEM fuel cells: current status and future prospects, J. Mater. Chem., 2009, 19, 46 RSC.
- L. Ghassemzadeh, K. Kreuer, J. Maier and K. Mu, Chemical Degradation of Nafion Membranes under Mimic Fuel Cell Conditions as Investigated by Solid-State NMR Spectroscopy, J. Phys. Chem. C, 2010, 114, 14635–14645 CAS.
- Y. Bing, H. Liu, L. Zhang, D. Ghosh and J. Zhang, Nanostructured Pt-alloy electrocatalysts for PEM fuel cell oxygen reduction reaction, Chem. Soc. Rev., 2010, 39, 2184–2202 RSC.
- H. Yang, Platinum-based electrocatalysts with core–shell nanostructures, Angew. Chem., Int. Ed., 2011, 50, 2674–2676 CrossRef CAS PubMed.
- C. A. Farberow, et al. Mechanistic Studies of Oxygen Reduction by Hydrogen on PdAg(110), ACS Catal., 2013, 3, 1622–1632 CrossRef CAS.
- J. Kerres, A. Ullrich, F. Meier and T. Haring, Synthesis and characterization of novel acid–base polymer blends for application in membrane fuel cells, Solid State Ionics, 1999, 125, 243–249 CrossRef CAS.
- K. D. Kreuer, On the development of proton conducting polymer membranes for hydrogen and methanol fuel cells, J. Membr. Sci., 2001, 185, 29–39 CrossRef CAS.
- K. Sasaki, H. Naohara, Y. Cai, Y. M. Choi, P. Liu, M. B. Vukmirovic, J. X. Wang and R. R. Adzic, Core-Protected Platinum Monolayer Shell High-Stability Electrocatalysts for Fuel-Cell Cathode, Angew. Chem., Int. Ed., 2010, 49, 8602–8607 CrossRef CAS PubMed.
- K. Sasaki, J. X. Wang, H. Naohara, N. Marinkovic, K. L. More, H. Inada and R. R. Adzic, Recent Advances in Platinum Monolayer Electrocatalysts for Oxygen Reduction Reaction: Scale-up Synthesis, Structure, and Activity of Pt Shells on Pd Cores, Electrochim. Acta, 2010, 55(8), 2645–2652 CrossRef CAS PubMed.
- J. Zhang, K. Sasaki, E. Sutter and R. R. Adzic, Stabilization of platinum oxygen-reduction electrocatalysts using gold clusters, Science, 2007, 315, 220–222 CrossRef CAS PubMed.
- S. Mandal, A. B. Mandale and M. Sastry, Keggin ion-mediated synthesis of aqueous phase-pure Au@Pd and Au@Pt core–shell nanoparticles, J. Mater. Chem., 2004, 14, 2868 RSC.
- K. J. J. Mayrhofer, et al. Measurement of oxygen reduction activities via the rotating disc electrode method: from Pt model surfaces to carbon-supported high surface area catalysts, Electrochim. Acta, 2008, 53, 3181–3188 CrossRef CAS PubMed.
- B. Gabriele, M. Costa, G. Salernoe and G. P. Chiusoli, An efficient and selective palladium-catalysed oxidative dicarbonylation of alkynes to alkyl- or aryl- maleic esters, J. Chem. Soc., Perkin Trans. 1, 1994, 83–87 RSC.
- I.-S. Park, K.-W. Park, J.-H. Choi, C. R. Park and Y.-E. Sung, Electrocatalytic enhancement of methanol oxidation by graphite nanofibers with a high loading of PtRu alloy nanoparticles, Carbon, 2007, 45, 28–33 CrossRef CAS PubMed.
| This journal is © The Royal Society of Chemistry 2014 |

