First principles investigation of point defect-related properties in Ti2AlN

Ji Zheng Duana, Jian Rong Zhanga, Cang Long Wang*a, Ye Qiub, Wen Shan Duan*a and Lei Yang*ab
aInstitute of Modern physics, Chinese Academy of Sciences, College of Physics and Electronic Engineering and Joint Laboratory of Atomic and Molecular Physics of NWNU&IMPCAS, Northwest Normal University, Lanzhou 730000, China. E-mail: clwang@impcas.ac.cn; duanws@nwnu.edu.cn; lyang@impcas.ac.cn
bDepartment of Physics, Lanzhou University, Lanzhou 730000, China

Received 16th July 2014 , Accepted 7th August 2014

First published on 7th August 2014


Abstract

The formation and migration energies of the mono-vacancies, foreign impurities (H, He and O atoms) and interstitials in Ti2AlN have been investigated using first principles calculations. The results have shown that the mono-vacancy formation is energetically most favorable for the Al atom. There are three stable configurations for the foreign impurities, the Al-layer triangle center site, the interstitial site (⅓,⅔,0.6578) and the vacancy site. It was also found that the O substitution is easily formed. For interstitials, the octahedral interstitial (Ti, N, H or O) and Al-layer triangle interstitial (Al or He) sites were observed in our simulation. Moreover, the H, O and N interstitials are dominant in Ti2AlN. These results could provide theoretical guidance for future experiments and for the application of Ti2AlN.

1 Introduction

Mn+1AXn phase materials are layered ternary compounds, where M is an early transition metal, A is a group IIIA or IVA element, X is C or N, and n = 1, 2, or 3.1 Such materials have a special structure. The space group is generally P63-mmc and the Mn+1Xn layers are interleaved with layers of A-atoms. Due to their unique structure and combination of metallic and ceramic properties, these materials have aroused a great interest in the research community. Like ceramics, the MAX phase possesses low density, a low thermal expansion coefficient, high modules, high strength, and good high-temperature oxidation resistance. Also, similar to metals, they are good electrical and thermal conductors, readily machinable, tolerant to damage, and resistant to thermal shock. The unique combination of these properties enables these ceramics to be promising candidate materials for use in diverse fields such as high-temperature structural applications, wear and corrosion protection surface coatings, nuclear applications, impact-resistant materials, as projectile proof armour, for bullet proof vests, etc.2–9

One of the MAX phases, Ti2AlN, exhibits better mechanical properties than that of Ti2AlC.10–16 The most common fabrication method for bulk Ti2AlN is hot pressing from a powder mixture of either Ti and AlN (ref. 17) or Ti, TiN and Al.13 In addition, single-crystal Ti2AlN thin films have been prepared by reactive magnetron sputtering.18–20 Recently, Cui et al. improved the synthetic method by using spark plasma sintering. Ceramics can be rapidly sintered at relatively low temperatures and over a short time.12 Due to its exceptional thermal and mechanical properties, the MAX phase compound Ti2AlN has a wide range of possible technological and engineering applications. Particularly, Ti2AlN could become a candidate for high temperature structure materials and protective coatings in future nuclear reactors.21–23

Irradiation with fast neutrons induces various changes in the mechanical and physical properties of materials. For example, in a fusion process, it is known that the fast fusion neutrons and high fluxes of ions will produce a large amount of defects, which mainly consist of self-interstitial atoms and vacancies. The point defects can aggregate into clusters and migrate through the crystal lattice. They can interact with the microstructure, including other point defects, solution atoms, dislocations and precipitates. The change in the microstructure under irradiation is the main cause of material degradation. Thus, as future nuclear structural materials, knowledge of the point defect properties is crucial for developing an understanding of the kinetics and dynamics of microstructural changes in MAX phases under radiation damage conditions.

At high temperature in air, Ti2AlN has to endure oxidation from O2. The oxidation mechanism of Ti2AlN may limit its high-temperature application.12,24 In addition, hydrogen (H) and helium (He) are usually generated in fission and fusion reactors. The presence of these impurities (H and He) plays a critical role in the microstructural evolution of the materials.25 As a result of their low solubility, the impurities can be trapped in regions of excess volume, such as dislocations, grain boundaries, vacancies and vacancy clusters. These defects can be the sources of several mechanisms such as swelling, surface blistering, plane cleavage, which will irreversibly degrade the material properties.26 To date, despite extensive and successful efforts at characterization of the mechanical and electronic properties of Ti2AlN,27 very little evidence has been presented for the investigation of the defect-related properties of Ti2AlN.

In this paper, we use the first principles method to calculate the formation energy and the migration energy of a mono-vacancy, foreign impurity (H, He or O atom) and interstitial for each element in Ti2AlN. Our results show that the point defect formation and migration energies in Ti2AlN are higher compared with those in Ti2AlC.28–30 A protective Al2O3 layer can be formed to prevent oxidation in Ti2AlN. The most stable octahedral interstitial and Al-layer triangle interstitial are observed in Ti2AlN. Therefore, Ti2AlN could be a better candidate material in high temperature and nuclear reactors.

2 Computational method

The first principles calculations reported herein are performed with the Density Functional Theory (DFT) simulation package CASTEP,31 using plane-wave pseudo-potentials. The interaction of valance electrons with the ions is described with ultrasoft pseudopotentials.32 The exchange and correlation effects are described by the generalised gradient approximation (GGA) with the Perdew–Burke–Ernzerhof (PBE) function.33 The plane-wave cutoff energy was set to 500 eV and the Brilliouin zone integration was performed by using a 7 × 7 × 3 k mesh within the Monkhorst–Pack scheme for geometry optimization. In the electronic density of states calculations, the Brillouin zone was sampled using a k-point grid of 5 × 5 × 2. The self-consistent loop terminates when the total energy is converged to 1.0 × 10⁻⁶ eV per atom, the maximum force on each unconstrained atom is less than 0.03 eV Å−1, the maximum stress is lower than 0.05 GPa and the maximum displacement is smaller than 0.001 Å. We employed 32 (2 × 2 × 1 supercell) atoms for electronic properties and single point-defect calculations, which has been proven to be sufficient in our convergence test wherein 72 (3 × 3 × 1 supercell) atoms were employed.

The formation energy of a neutral defect is defined as

 
image file: c4ra07200f-t2.tif(1)

where Etot[X] is the total energy of the supercell with defect X, and Etot[Ti2AlN] is the total energy of the perfect Ti2AlN supercell. The integer ni indicates the number of atoms of type i (host atoms or impurity atoms) that have been added to (+) or removed from (−) the supercell to form a defect, and the μi are the corresponding chemical potentials of these species which represent the energy of reservoirs containing the atomic types.34

The chemical potentials of the pure phases in eqn (1) depend on the experimental growth conditions, and for the gas species, the chemical potentials strongly depend on the partial pressure and the temperature. However, they are subject to specific bounds. The chemical potentials μTi, μAl and μN are subject to an upper bound: under extreme Ti-rich, Al-rich and N-rich conditions, μTiμTi[Bulk], μAlμAl[Bulk] and μNμN[N2] (the energy of N in a N2 molecule). We can also impose lower bounds, the upper limit on μTi and μAl results in a lower limit on μN. Similarly, the upper limit on μTi, μN or μAl, μN results in a lower limit on μAl or μTi. The lower bounds use the following expressions:8,34–36

 
2μminTi = μ[Ti2AlN]μAl[Bulk]μN[N2] (2)
 
μminAl = μ[Ti2AlN]μTi[Bulk]μN[N2] (3)
 
μminN = μ[Ti2AlN]μTi[Bulk]μAl[Bulk] (4)

The chemical potential μHe is the energy of a single helium (He) atom in the empty reference cell, since He is a closed-shell atom and it is not chemically reactive with other elements. The reference state hydrogen (H) and oxygen (O) chemical potentials satisfy the conditions, i.e., μminOμOμO(O2) and μminHμHμH(H2), here μminO and μminH are given by:

 
μminH = EtotEtot[HInt] (5)
 
μminO = EtotEtot[OInt] (6)

The Etot[HInt] represents the energy of Ti2AlN that contains one interstitial hydrogen atom. The Etot[OInt] represents the energy of Ti2AlN that contains one interstitial oxygen atom.

For a stable compound, it must not only be more stable than its constituent free atoms, but also stable with respect to its constituent atoms in their ground-state crystal structure. The concept of formation energy ΔμTi2AlN for Ti2AlN is defined as

 
ΔμTi2AlN = μTi2AlN[bulk] − (2μTi[bulk] + μAl[bulk] + μN[N2]) (7)
where ΔμTi2AlN is the formation energy of Ti2AlN, and our calculated result is equal to 5.21 eV. We also calculated the formation energy of Ti2AlN using the PBE0 function, and the result was 5.54 eV, which shows a good agreement with the GGA-PBE function.

The mono-vacancy self-diffusion barrier of each species was obtained, assuming that the jump occurred between neighbouring vacancies and along the (0001) basel plane. The migration energy Em was calculated by investigating the transition state linking the two end defective configurations, and was given as follows:

 
Em = EnE0 (8)
where En is the total energy of the transition state along the reaction path in a specific Ti2AlN system. E0 represents the lowest total energy of the same system at one of the end points of the reaction path. The linear synchronous transit (LST) or quadratic synchronous transit (QST) methods was used along with a conjugate gradient algorithm for determining the migration barriers.37

3 Results and discussion

We calculated the equilibrium lattice configurations of perfect Ti2AlN. The optimized lattice constants a, c and c/a are shown in Table 1, together with the experimental values for comparison. The computed lattice constants deviate from the experimental values by less than 1%. This indicates that there is a good agreement between the calculated results and the experimental results, and ensures the reliability and accuracy of the present first-principles calculations.
Table 1 Lattice parameters (in Å), mono-vacancy formation volumes (ΔV), formation energies (Ef, at corresponding rich conditions) and migration energies (Em) of Ti2AlN
Compound a (Å) c (Å) c/a ΔV3) Ef (eV) Em (eV)
DFT Exp. DFT Exp. DFT Exp.
Ti2AlN 2.995 2.991 13.64 13.621 4.55 4.55    
Ti2AlN(Ti) 2.997   13.62   4.54   −0.864 3.34 2.835
Ti2AlN(Al) 3.000   13.59   4.53   −1.351 3.02 0.68
Ti2AlN(N) 2.998   13.63   4.55   0.273 4.86 3.32


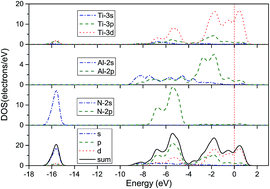
We also calculated the total and partial electron density of states (DOS) of Ti2AlN, as shown in Fig. 1. The DOS at the Fermi level is dominated by the Ti transition metal. This implies that the electrical conductivity of Ti2AlN originates primarily from the 3d electrons in Ti, which is in good agreement with an alternative calculation.10,38 The Ti 3d electrons overlapped with the Al and N 2p states at an energy of −5.6 eV and −1.8 eV respectively. This indicates that the Ti–Al and Ti–N bonds can be formed in Ti2AlN. This conclusion is also in agreement with other M2AlC compounds.38


image file: c4ra07200f-f1.tif
Fig. 1 The total and partial DOS of Ti2AlN.

3.1 Formation and migration energies of mono-vacancy in Ti2AlN

In the presence of a mono-vacancy, the lattice constant a increases while the lattice constant c reduces. When a Ti or Al mono-vacancy appears in Ti2AlN, the cell volume of Ti2AlN decreases. On the contrary, the cell volume increases in the presence of a N mono-vacancy.

The vacancy formation energies as a function of the atomic chemical potential of each component in Ti2AlN are shown in Fig. 2. In Ti2AlN, the mono-vacancy formation energies of the Ti, Al and N atoms at their rich conditions are EfTi = 3.34 eV, EfAl = 3.02 eV and EfN = 4.86 eV, respectively, as shown in Fig. 1. The formation energies are determined to be in the sequence EfN > EfTi > EfAl. This indicates that the Al vacancy is the most energetically favorable mono-vacancy in Ti2AlN.


image file: c4ra07200f-f2.tif
Fig. 2 The Ti, Al and N mono-vacancy formation energies plotted with respect to the chemical potential of each component in Ti2AlN.

As shown in Table 1, the energy barriers of EmTi, EmAl and EmN representing the energies of vacancy migration in the Ti2AlN supercell are 2.835 eV, 0.68 eV and 3.32 eV, respectively for the Ti, Al and N atoms. It is noted that the vacancy-mediated migration in Ti2AlN is energetically most favorable for VAl. This may be the reason why, under an oxidizing environment, Al atoms in Ti2AlN are usually observed diffusing towards the surface, to form a protective Al2O3 layer.36,39 Due to the stronger chemical bonding in the NaCl-type TiN unit,30,36,38 the mobility of Ti and N atoms by vacancy-assisted diffusion is retarded much more than that of Al atoms.

Comparing the mono-vacancy formation energies of Ti2AlN and Ti2AlC, we find that the smallest mono-vacancy formation energy is 2.8 eV for Al in the Ti2AlC,30 which indicates that it is easier to form an Al mono-vacancy in Ti2AlC than in Ti2AlN.

As previously reported, the mono-vacancy migration energy is 0.83 eV for the Al in Ti2AlC,29 while it is 0.68 eV for the Ti2AlN. In this sense, it is easier to form an Al2O3 scale on Ti2AlN than on Ti2AlC.30,38

3.2 Substitution formation energy for Ti2AlN

Impurities often occupy free space in a defect crystal. In order to understand the behaviors of the usual impurities in a Ti2AlN crystal under high temperature condition or in an irradiation environment, we mainly studied three types of impurities, H, He and O. The nine different substitution formation energies were calculated from eqn (1), and are shown in Table 2, where the Hesub−Ti, Hesub−Al and Hesub−N represent the He atom substitution of the Ti, Al and N atoms in Ti2AlN, respectively. Similarly, the Hsub−Ti, Hsub−Al and Hsub−N represent the H atom substitution of the Ti, Al and N atoms in Ti2AlN, respectively. The Osub−Ti, Osub−Al and Osub−N represent O atom substitution of the Ti, Al and N atoms, respectively. We assume that these impurities occupy the normal Ti, Al or N lattice sites. After the geometry relaxation technique, these impurities can form different configurations, as shown in Fig. 3. Table 2 shows the calculated formation energy and formation volume. The detailed analysis then follow below.
Table 2 H, He and O substitution formation energies Ef (in eV) and formation volumes ΔV3) for Ti2AlN. μ represents the chemical potential of the substitution atom under rich (μrich) or poor (μpoor) conditions
Substitution μ Hsub Hesub Osub
Hsub−Ti Hsub−Al Hsub−N Hesub−Ti Hesub−Al Hesub−N Osub−Ti Osub−Al Osub−N
Ef (eV) μrich −0.4 −3.28 −2.58 1.8 −1.0 2.45 −3.21 −5.53 −6.0
μpoor 0.78 −2.08 −1.37       −0.56 −2.87 −3.34
ΔV3)   0.598 −4.228 0.243 2.651 2.135 3.399 4.435 2.714 −0.512


image file: c4ra07200f-f3.tif
Fig. 3 Schematic representations of Ti2AlN configurations containing mono-substitution, all atoms are at their relaxed positions. (a) H or O substitute for a Ti atom; (b) H or O substitute for an Al atom; (c) H or O substitute for a N atom.

• The substitution of H, He or O for a Ti atom

For Hsub−Ti and Osub−Ti, their configurations are shown in Fig. 3(a). The results clearly demonstrate that both H and O prefer to occupy the position which is away from a vacancy. It is noted from Fig. 3(a) that the H or O atom moves into the Al layer and occupies the triangle center site which was formed by three Al atoms. The resulting Al–H bond length is 1.861 Å and the Al–O bond length is 1.841 Å. The Al layer is more likely to combine with O atoms and form Al2O3, a protective layer preventing the oxidation of MAX phase materials.27,30,40–42 In Al2O3, the Al–O bond length is 1.8562 Å,43 which is approximately equal to the bond length of Al–O in the MAX phase of Ti2AlN. According to the vacancy migration mechanism, the A layer is easy to remove from Mn+1AXn to form a Mn+1Xn matrix,5,44 which is in agreement with our simulation results that the migration energy of the vacancy for Al is lower than that of Ti and N. The above analysis can help verify that Al2O3 can be formed in Ti2AlN.

The Hesub−Ti prefers to occupy the position of (⅔,⅓,0.6), which is different from the position of the Ti atom in Ti2AlN (⅔,⅓,0.586). The He atom forms a tetrahedron with three Al atoms, and their bond length is 2.696 Å. The formation volume is 0.598 Å3 indicating the expansion of the volume of Ti2AlN.

• The substitution of H, He or O for an Al atom

The Hesub−Al occupies the Al vacancy center and the distance to the neighbouring Ti atoms is 2.875 Å, which is longer than the Ti–Al bond in the perfect Ti2AlN crystal (2.839 Å). As previously mentioned, the He is a closed shell atom and not chemically reactive with other elements. Therefore, it does not bond with neighbouring Ti atoms. The formation volume of Hesub−Al is 2.135 Å3. This indicates that the crystal size expands. On the contrary, in the presence of Hsub−Al, an attraction occurs between H and Ti atoms, and the Ti–H bond length is 2.768 Å, which leads a reduction of the crystal size (−4.228 Å3).

For Osub−Al, a tetrahedron can be observed, as shown in Fig. 3(b). The position of the O atom is (⅓,⅔,0.6578) and it does not occupy the Al vacancy. The Al–O bond length is 1.959 Å.

• The substitution of H, He or O for a N atom

The H, He and O atoms prefer to occupy the site of the N-vacancy, as shown in Fig. 3(c). The distances of Ti–N (in the perfect Ti2AlN crystal), Ti–H, Ti–He and Ti–O are 2.099 Å, 2.152 Å, 2.231 Å and 2.114 Å, respectively. The formation volumes of Hsub−N, Hesub−N and Osub−N are 0.243 Å3, 3.339 Å3 and −0.512 Å3, respectively. It is noted that the crystal size will expand for H and He atoms. This may be the reason why Ti2AlN distorts or swells under high temperature or an irradiation environment. However, it is noted that Osub−N leads to a reduction of the crystal size, which may be attributed to the attraction between Al and O. In addition, the lattice constant a decreases by 0.1%.

The H, He and O substitutional formation energies of each element in Ti2AlN are shown in Table 2. It is noted from Table 2 that the Osub−N formation energy (image file: c4ra07200f-t7.tif, at O-rich condition) is the minimum one, when compared with the substitution formation energies for the other elements studied. The He atom substitution formation energies are relatively stable because He is a noble gas and can not chemically react with other elements. The formation energies for He substitution of Ti, Al and N atoms in Ti2AlN are 1.8 eV, −1.0 eV and 2.45 eV, respectively. The formation energies for H substitution of Al and N are negative under the limited conditions, which indicates that these two types of defects are more easily formed. It is also noted from Fig. 4 that the substitution formation energies satisfy the sequence image file: c4ra07200f-t8.tif at the fixed chemical potential conditions.


image file: c4ra07200f-f4.tif
Fig. 4 The H and O substitution formation energies as a function of the atomic chemical potential in Ti2AlN.

The density of states (DOS) of these impurities are shown in Fig. 5.


image file: c4ra07200f-f5.tif
Fig. 5 (a) The density of states (DOS) of Hsub in Ti2AlN; (b) the density of states (DOS) of Hesub in Ti2AlN; (c) the density of states (DOS) of Osub in Ti2AlN.

• H substitution

Fig. 5(a) presents the DOS of Hsub−Ti, Hsub−Al and Hsub−N, respectively. It is noted that the Hsub−N energy peaks clearly move towards the right compared with Hsub−Ti and Hsub−Al. There is a pseudo-gap for Hsub−Al. It indicates that Hsub−Al is relatively stable, which is in agreement with its lowest formation energy.

• He substitution

The DOS of He-substitutions are shown in Fig.5(b). As is well known, He is a closed-shell noble gas atom, and any hybridization is energetically unfavorable. The isolated small peaks attributed to the He atom are at the values of −12.2 eV for Hesub−Ti, −12.5 eV for Hesub−Al and −17.2 eV for Hesub−N, and are in agreement with the features of the He atom.

• O substitution

It is noted from Fig.5(c) that the DOS peak of Osub−N is higher than that of Osub−Ti in the range of −9 eV to −7 eV, which is mainly contributed by the O atom's s-orbital. At the −5.1 eV energy peak, the Osub−Al peak is higher than that of the other two O substitutions, which indicates the increased strength of the covalent bond for Osub−Al. In addition, a pseudo-gap around the Fermi level appears for Osub−Al which indicates that the Osub−Al is relatively stable. This result is in agreement with the lowest formation energy of Osub−Al.

3.3 Interstitial formation energy in Ti2AlN

Herein, we have investigated two types of interstitials. One is self-interstitials (Ti, Al and N), and the other is foreign interstitials, such as H, He and O. The initial positions of the interstitials were at the Al-layer center, as reported by Moritz Baben et al.24 After Potential Energy Surface (PES) geometry optimization, these interstitials were located at the lowest energy position, as shown in Fig. 6. We also calculated the bond length, formation volume and formation energy as shown in Table 3.
image file: c4ra07200f-f6.tif
Fig. 6 Schematic representations of Ti2AlN configurations containing a mono-interstitial, all atoms are at their relaxed positions. (a) Ti, N, H or O octahedral interstitial, (b) Al or He Al-layer triangle interstitial.
Table 3 The bond distances (d) of un-relaxed and relaxed configurations, the formation volumes (ΔV) and the different interstitial formation energies (Ef) depend on chemical potentials (μpoor or μrich) in Ti2AlN. dI−Ti and dI−Al represent different interstitials with the neighbouring Ti and Al atoms, respectively
Interstitial dI−Ti (Å) dI−Al (Å) ΔV3) Ef (eV)
un-relaxed relaxed un-relaxed relaxed μpoor μrich
Ti 2.11 2.50 1.99 2.35 23.08 7.61 5.02
N 2.14 2.05 3.881 3.83 −0.82
H 2.00 2.17 3.735 0 −1.2
O 2.14 2.05 0.608 0 −2.56
He     7.075 3.77
Al     1.73 2.19 16.564 9.14 3.96


3.3.1 Octahedron interstitial. As shown in Fig. 6(a), the Ti, N, H or O atom occupies the octahedral site in Ti2AlN. The un-relaxed bond length between the interstitial Ti and its neighbouring Ti (and Al) atom is 2.11 Å (and 1.99 Å). However, the relaxed bond lengths have been elongated by about 18%. The formation energy of the Ti interstitial Eint−Tif is as high as 7.61 (or 5.02) eV under Ti-rich (or poor) chemical potential conditions. It seems that the Ti interstitial shows a strong repulsion of neighbouring atoms and leads to an increase in the crystal size. It is also inferred that the Ti interstitial is quite difficult to form in Ti2AlN.

The formation energies of the N, H and O interstitials under their rich chemical potential conditions are −0.82 eV, −1.2 eV and −2.56 eV, respectively (Fig. 7). These three interstitials lead to an increase in the crystal size. The distance between the H and Ti atom is 2.00 Å, while the distance is 2.17 Å between the H and Al atom. This indicates that the Ti atom attracts the H atom. The N and O atoms are chemically similar as they are next to each other in the periodic table. Thus, they have the same bond lengths with neighbouring Ti and Al atoms, i.e. the Ti–O(N) and Al–O(N) bond lengths are 2.14 Å and 2.05 Å, respectively. It is also noted that the difference in bond lengths for the N–Ti, N–Al, O–Ti and O–Al are negligible.


image file: c4ra07200f-f7.tif
Fig. 7 The Ti, Al, N, H, He and O interstitial formation energies as a function of the atomic chemical potentials in Ti2AlN.
3.3.2 Al-layer triangle interstitial. The He and Al interstitial atoms in the Al layer are located at the center of a triangle composed of three Al atoms, as shown in Fig. 6(b). It is seen from Table 3 that the Al self-interstitial moves away from the neighbouring three Al atoms to a distance of 2.19 Å. Therefore, the atom distance is increased compared with the un-relaxed position. The interstitials formation volume (ΔV) are 7.075 Å3 for He and 16.564 Å3 for Al. Therefore, these interstitials lead to the expansion of the crystal size. The corresponding formation energies Efint−He and Efint−Al are 3.77 eV and 3.96 eV (Al-rich) or 9.14 eV (Al-poor), respectively. It is noted that the formation energies of the triangle interstitial are higher than those of the octahedral interstitial, in addition to the Ti and N (in N-poor condition) octahedral interstitials. Therefore, the He and Al interstitials are more difficult to form.

In Fig. 8, we have presented the DOS of different interstitials. It is noted that there is a small isolated peak at the point of −16.6 eV for the He interstitial, which is attributed to the He atom's p-orbital. In the range of −9 eV to −7.8 eV, the energy peaks of the O and N interstitials increase, which is mainly attributed to the O p-orbital and the N p-orbital, respectively. In the range of −6 eV to −4.5 eV, there is a strong hybridization of the s and p orbitals, which shows a covalent character. Around the Fermi level, the N interstitial induces a wide pseudo-gap energy, which implies a strong covalent bond and a relatively stable crystal. This result is in agreement with the formation energy of the N interstitial (Efint−N = −0.82 eV) under the N-rich conditions.


image file: c4ra07200f-f8.tif
Fig. 8 (a) The density of states (DOS) of HInt, HeInt and OInt in Ti2AlN; (b) the density of states (DOS) of TiInt, AlInt and NInt in Ti2AlN.

4 Conclusions

The formation and migration energies of mono-vacancies, foreign impurities (H, He or O atoms) and interstitials for each element in Ti2AlN have been investigated using first principles calculations. The obtained results have shown that the N mono-vacancy is the most difficult to form, while mono-vacancy formation in Ti2AlN is energetically most favorable for the Al atom.

The H, He and O substitution formation energies satisfy the sequence image file: c4ra07200f-t9.tif. The formation energies of O substitution for Ti, Al and N are all negative. This implies that O substitution in Ti2AlN occurs more easily. There are three stable configurations for these substitutions. Both the H and O atom moved away from the Ti vacancy site, and were captured at the Al-layer triangle center site, which was composed of three Al atoms. Similarly, the O atom can also move away from the Al vacancy and locate at the interstitial site (⅓,⅔,0.6578). The other types of substitution were captured at the vacancy site. The DOS of Hsub−Ti and Osub−N show that they are relatively stable configurations.

For self-interstitials (Ti, Al and N) and foreign interstitials (H, He and O), the formation energy of the Ti interstitial is the highest one for Ti2AlN under Ti-rich conditions. The formation energies of the H, O and N interstitials under corresponding rich conditions are negative, indicating that they are easily formed in Ti2AlN. There are two stable configurations for these interstitials, one is the octahedral interstitial, which is formed by the Ti, N, H or O atom, the other is the Al-layer triangle interstitial, which is formed by the Al or He atom. It is also found from the DOS of these interstitials that the N interstitial is relatively stable in Ti2AlN. These results contribute to the understanding of the origin of defect-related properties and the phase stability of Ti2AlN under high temperature and an irradiation environment.

Acknowledgements

This work was supported by the “Strategic Priority Research Program” of the Chinese Academy of Sciences (Grant no. XDA03030100), the National Magnetic Confinement Fusion Science Program of China (Grant no. 2014GB104002) and the National Natural Science Foundation of China (Grant no. 11304324, 91026005 and 61162017).

References

  1. M. W. Barsoum, Prog. Solid State Chem., 2000, 28, 201–281 CrossRef CAS.
  2. M. W. Barsoum and T. El-Raghy, Am. Sci., 2001, 89, 334–343 CrossRef.
  3. E. N. Hoffman, D. W. Vinson, R. L. Sindelar, D. J. Tallman, G. Kohse and M. W. Barsoum, Nucl. Eng. Des., 2012, 244, 17–24 CrossRef CAS PubMed.
  4. L. Wu, J. X. Chen, M. Y. Liu, Y. W. Bao and Y. C. Zhou, Wear, 2009, 266, 158–166 CrossRef CAS PubMed.
  5. M. Naguib, O. Mashtalir, J. Carle, V. Presser, J. Lu, L. Hultman, Y. Gogotsi and M. W. Barsoum, ACS Nano, 2012, 6, 1322–1331 CrossRef CAS PubMed.
  6. M. W. Barsoum, D. Brodkin and T. El-Raghy, Scr. Mater., 1997, 36, 534–541 CrossRef.
  7. N. J. Lane, S. C. Vogel, E. N. Caspi and M. W. Barsoum, J. Appl. Phys., 2013, 113, 183519 CrossRef PubMed.
  8. S. J. Zhao, J. M. Xue, Y. G. Wang and Q. Huang, J. Appl. Phys., 2014, 115, 023503 CrossRef PubMed.
  9. S. Rech, A. Surpi, S. Vezz, A. Patelli, A. Trentin, J. Glor, J. Frodelius, L. Hultman and P. Eklund, Vacuum, 2013, 94, 69–73 CrossRef CAS PubMed.
  10. T. Liao, J. Y. Wang and Y. C. Zhou, Phys. Rev. B: Condens. Matter Mater. Phys., 2006, 73, 214109 CrossRef.
  11. W. K. Pang, I. M. Low, S. J. Kennedy and R. I. Smith, Mater. Sci. Eng., A, 2010, 528, 137–142 CrossRef PubMed.
  12. B. Cui, R. Sa, D. D. Jayaseelan, F. Inam, M. J. Reece and W. E. Lee, Acta Mater., 2012, 60, 1079–1092 CrossRef CAS PubMed.
  13. Z. J. Lin, M. J. Zhuo, M. S. Li, J. Y. Wang and Y. C. Zhou, Scr. Mater., 2007, 56, 1115–1118 CrossRef CAS PubMed.
  14. T. F. Zhang, Q. M. Wang, J. Lee, P. Ke, R. Nowak and K. H. Kim, Surf. Coat. Technol., 2012, 212, 199–206 CrossRef CAS PubMed.
  15. Y. Yang, M. Keunecke, C. Stein, L. J. Gao, J. Gong, X. Jiang, K. Bewilogua and C. Sun, Surf. Coat. Technol., 2012, 206, 2661–2666 CrossRef CAS PubMed.
  16. T. Joelsson, A. Flink, J. Birch and L. Hultman, J. Appl. Phys., 2007, 102, 074918 CrossRef PubMed.
  17. M. W. Barsoum, M. Ali and E. El-Raghy, Metall. Mater. Trans. A, 2000, 31, 1857 CrossRef PubMed.
  18. T. Joelsson, A. Horling, J. Birch and L. Hultman, Appl. Phys. Lett., 2005, 86, 111913 CrossRef PubMed.
  19. P. O. Å. Persson, S. Kodambaka, I. Petrov and L. Hultman, Acta Mater., 2007, 55, 4401–4407 CrossRef CAS PubMed.
  20. T. Joelsson, A. Flink, J. Birch and L. Hultman, J. Appl. Phys., 2007, 102, 074918 CrossRef PubMed.
  21. K. R. Whittle, M. G. Blackford, R. D. Aughterson, S. Moricca, G. R. Lumpkin, D. P. Riley and N. J. Zaluzec, Acta Mater., 2010, 58, 4362–4368 CrossRef CAS PubMed.
  22. J. C. Napp, I. Monnet, Ph. Grosseau, F. Audubert, B. Guilhot, B. Guilhot, M. Benabdesselam and L. Thom, J. Nucl. Mater., 2011, 409, 53–61 CrossRef PubMed.
  23. M. Beckers, N. Schell, R. M. S. Martins, A. Mcklich, W. Möller and L. Hultman, J. Appl. Phys., 2007, 102, 074916 CrossRef PubMed.
  24. M. Baben, L. Shang, J. Emmerlich and J. M. Schneider, Acta Mater., 2012, 60, 4810–4818 CrossRef CAS PubMed.
  25. R. E. Stoller, J. Nucl. Mater., 1990, 174, 289 CrossRef CAS.
  26. T. Ishizaki, Q. Xu, T. Yoshiie, S. Nagata and T. Troev, J. Nucl. Mater., 2002, 961, 307–311 Search PubMed.
  27. M. Bugnet, T. Cabioch, V. Mauchamp, Ph. Guerin, M. Marteau and M. Jaouen, J. Mater. Sci., 2010, 45, 5547–5552 CrossRef CAS.
  28. J. Y. Wang, Y. C. Zhou, T. Liao, J. Zhang and Z. J. Lin, Scr. Mater., 2008, 58, 227–230 CrossRef CAS PubMed.
  29. X. H. Wang and Y. C. Zhou, Oxid. Met., 2003, 59, 303 CrossRef CAS.
  30. T. Liao, J. Y. Wang and Y. C. Zhou, Scr. Mater., 2008, 59, 854–857 CrossRef CAS PubMed.
  31. S. J. Clark, M. D. Segall, C. J. Pickard, P. J. Hasnip, M. J. Probert, K. Refson and M. C. Payne, Z. Kristallogr., 2005, 220, 567–570 CrossRef CAS.
  32. D. Vanderbilt, Phys. Rev. B: Condens. Matter Mater. Phys., 1990, 41, 7892 CrossRef.
  33. J. P. Perdew, K. Burke and M. Ernzerhof, Phys. Rev. B: Condens. Matter Mater. Phys., 1996, 77, 3865 CAS.
  34. C. Freysoldt, B. Grabowski, T. Hickel, J. Neugebauer, G. Kresse, A. Janotti and C. G. Van de Walle, Rev. Mod. Phys., 2014, 86, 253 CrossRef.
  35. C. G. Van de Walle and J. Neugebauer, J. Appl. Phys., 2004, 95, 3851 CrossRef CAS PubMed.
  36. T. Liao, J. Y. Wang and Y. C. Zhou, Appl. Phys. Lett., 2008, 93, 261911 CrossRef PubMed.
  37. N. Govind, M. Petersen, G. Fitzgerald, D. King-Smith and J. Andzelm, Comput. Mater. Sci., 2003, 28, 250 CrossRef CAS.
  38. M. Magnuson, M. Mattesini, S. Li, C. Höglund, M. Beckers, L. Hultman and O. Eriksson, Phys. Rev. B: Condens. Matter Mater. Phys., 2007, 76, 195127 CrossRef.
  39. Q. Wang, W. Garkas, A. F. Renteria, C. Leyens, C. Sun and K. Kim, IOP Conf. Ser.: Mater. Sci. Eng., 2011, 18, 082025 CrossRef.
  40. X. H. Wang and Y. C. Zhou, Chem. Mater., 2003, 15, 3716 CrossRef CAS.
  41. M. W. Barsoum and L. Farber, Science, 1999, 284, 937 CrossRef CAS.
  42. J. Emmerlich, D. Music, P. Ekund, O. Wilhelmsson, U. Jansson, J. M. Schneider, H. Högber and L. Hultman, Acta Mater., 2007, 55, 1479 CrossRef CAS PubMed.
  43. H. Sawada, Mater. Res. Bull., 1994, 29, 127–133 CrossRef CAS.
  44. M. Naguib, M. Kurtoglu, V. Presser, J. Lu, J. Niu, M. Heon, L. Hultman, Y. Gogotsi and M. W. Barsoum, Adv. Mater., 2011, 23, 4248–4253 CrossRef CAS PubMed.

This journal is © The Royal Society of Chemistry 2014