
 Open Access Article
 This Open Access Article is licensed under a
 Creative Commons Attribution 3.0 Unported Licence
Frame-by-frame observations of structure fluctuations in single mass-selected Au clusters using aberration-corrected electron microscopy
Malcolm
Dearg
 ab,
Cesare
Roncaglia
c,
Diana
Nelli
c,
El Yakout
El Koraychy
c,
Riccardo
Ferrando
c,
Thomas J. A.
Slater
*a and
Richard E.
Palmer
*d
ab,
Cesare
Roncaglia
c,
Diana
Nelli
c,
El Yakout
El Koraychy
c,
Riccardo
Ferrando
c,
Thomas J. A.
Slater
*a and
Richard E.
Palmer
*d
aCardiff Catalysis Institute, School of Chemistry, Cardiff University, Cardiff CF24 4HF, UK. E-mail: slatert2@cardiff.ac.uk
bSchool of Physics, Engineering and Technology, University of York, York YO10 5DD, UK
cDipartimento di Fisica, Universita di Genova, Via Dodecaneso 33, 16146 Genova, Italy
dNanomaterials Lab, Swansea University, Bay Campus, Fabian Way, Swansea SA1 8EN, UK. E-mail: r.e.palmer@swansea.ac.uk
First published on 19th October 2023
Abstract
The multi-dimensional potential energy surface (PES) of a nanoparticle, such as a bare cluster of metal atoms, controls both the structure and dynamic behaviour of the particle. These properties are the subject of numerous theoretical simulations. However, quantitative experimental measurements of critical PES parameters are needed to regulate the models employed in the theoretical work. Experimental measurements of parameters are currently few in number, while model parameters taken from bulk systems may not be suitable for nanosystems. Here we describe a new measurement methodology, in which the isomer structures of a single deposited nanocluster are obtained frame-by-frame in an aberration-corrected scanning transmission electron microscope (ac-STEM) in high angle annular dark field (HAADF) mode. Several gold clusters containing 309 ± 15 atoms were analysed individually after deposition from a mass-selected cluster source onto an amorphous carbon film. The main isomers identified are icosahedral (Ih), decahedral (Dh) and face-centred-cubic (fcc) (the bulk structure), alongside many amorphous (glassy) structures. The results, which are broadly consistent with static ac-STEM measurements of an ensemble of such clusters, open the way to dynamic measurements of many different nanoparticles of diverse sizes, shapes and compositions.
New conceptsThe submitted paper demonstrates, for the first time, the observation of transitions between cluster structures for small metallic clusters. The work is the first to report “branching ratios” between different cluster structures, demonstrating the probability of one structure transitioning to a different structure. This development allows us to draw initial conclusions about the difference in potential energy between different structures, e.g. that it is much easier to transition between decahedral and icosahedral structures than to transition from one of these structures to an fcc structure. The exploitation of this new methodology and the results contained in this manuscript will significantly enhance the study of atomic clusters, where significant theoretical research has not been verified with experimental studies. |
Introduction
Measurements of single molecules or single particles, whether optical or otherwise, represent a revolution in experimental science,1,2 avoiding the averaging inherent in the more familiar and generally easier ensemble measurements. However, static measurements of a single particle can be misleading, if they are not typical of the whole ensemble. Thus connecting, statistically, single particle measurements with representative data across the ensemble is a key scientific goal. This challenge applies specifically in electron microscopy of physical systems, where sub-atomic resolution is now increasingly common given the availability of aberration-corrected instruments.3 Dynamic measurements of single particles, as we demonstrate here, provide one means to bridge the gap and exploits the ergodic theorem.4Our experimental demonstration of dynamic video imaging of single nanoparticles in the aberration-corrected STEM addresses a set of size-selected gold clusters containing 309 ± 15 atoms, deposited at low energy from a mass-selected cluster beam source onto an amorphous carbon (a-C) film. This kind of nanocluster system is the subject of much interest in the context of the transition between atomic and bulk properties that cluster physics represents, as well as the multiple applications in science and technology that arise from the tunable behaviour.5,6 The measurements represent a first step towards determination of the full potential energy surface of Au clusters of this size. We obtain the isomer structures of single deposited nanoclusters via frame-by-frame analysis as the structure fluctuates. The structure of a single cluster fluctuates due to the small differences in potential energy between different structural isomers (e.g. 0.04 eV between fcc and decahedral structures in 561 atom sized Au7), with sufficient energy to overcome these small barriers coming from thermal energy (at room temperature) and through energy imparted by the electron beam while imaging. The videos were recorded in the HAADF mode of the ac-STEM. Several gold clusters containing 309 ± 15 atoms were analysed individually and the abundances of the different competing isomers were compared from one cluster to another, and against a static ensemble measurement.
Fig. 1 illustrates the data obtained from the ac-STEM video measurements on deposited mass-selected Au309 clusters. Plotted are two traces, taken from two different clusters for comparison, showing the appearance of the different competing structural isomers in 500 sequential 1 second frames of aberration-corrected STEM imaging. It is apparent that the relative abundances of the competing isomers are different in the two example clusters. The identification of the cluster structure in each frame is demonstrated in Fig. 2, which shows a segment of the trace from Fig. 1(a). Here, the individual images of the cluster from seven successive frames are shown, together with the best fit from the simulation atlas8 to the cluster image in each frame. The simulation atlas is a set of multislice simulations of candidate structures of gold clusters with exactly 309 atoms and covers a complete range of polar and azimuthal angles (in steps of 10°), so that rotation of the cluster under the beam is accounted for and the experimental images analysed are not limited to clusters aligned along high symmetry axes.7,9,10 However, the atlas does not include the interaction between the cluster and surface. We judge this effect to be local (at the atomic scale) in the case of clusters soft-landed on a-C and presumed bound to naturally occurring point defects on the surface.11
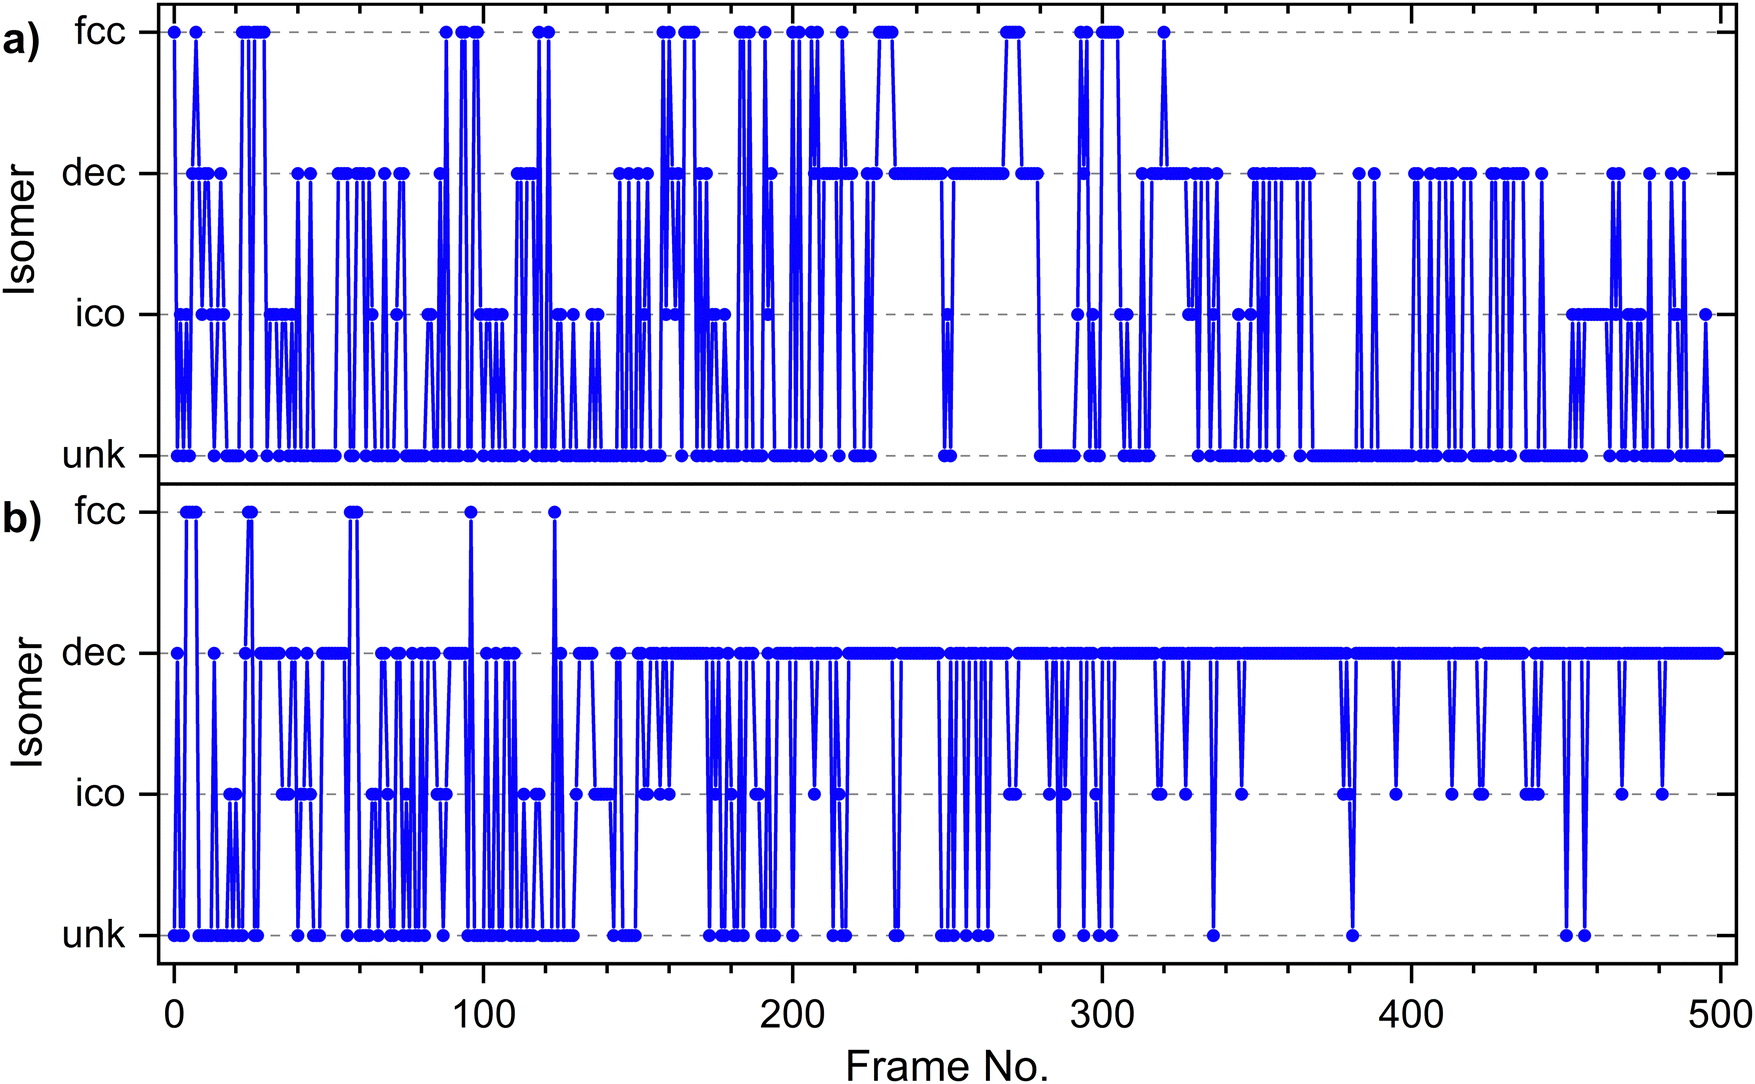 | ||
| Fig. 1 Plots of isomer assignment frame-by-frame for 500 frames of 1 second each, extracted from two different single cluster HAADF-STEM image series. | ||
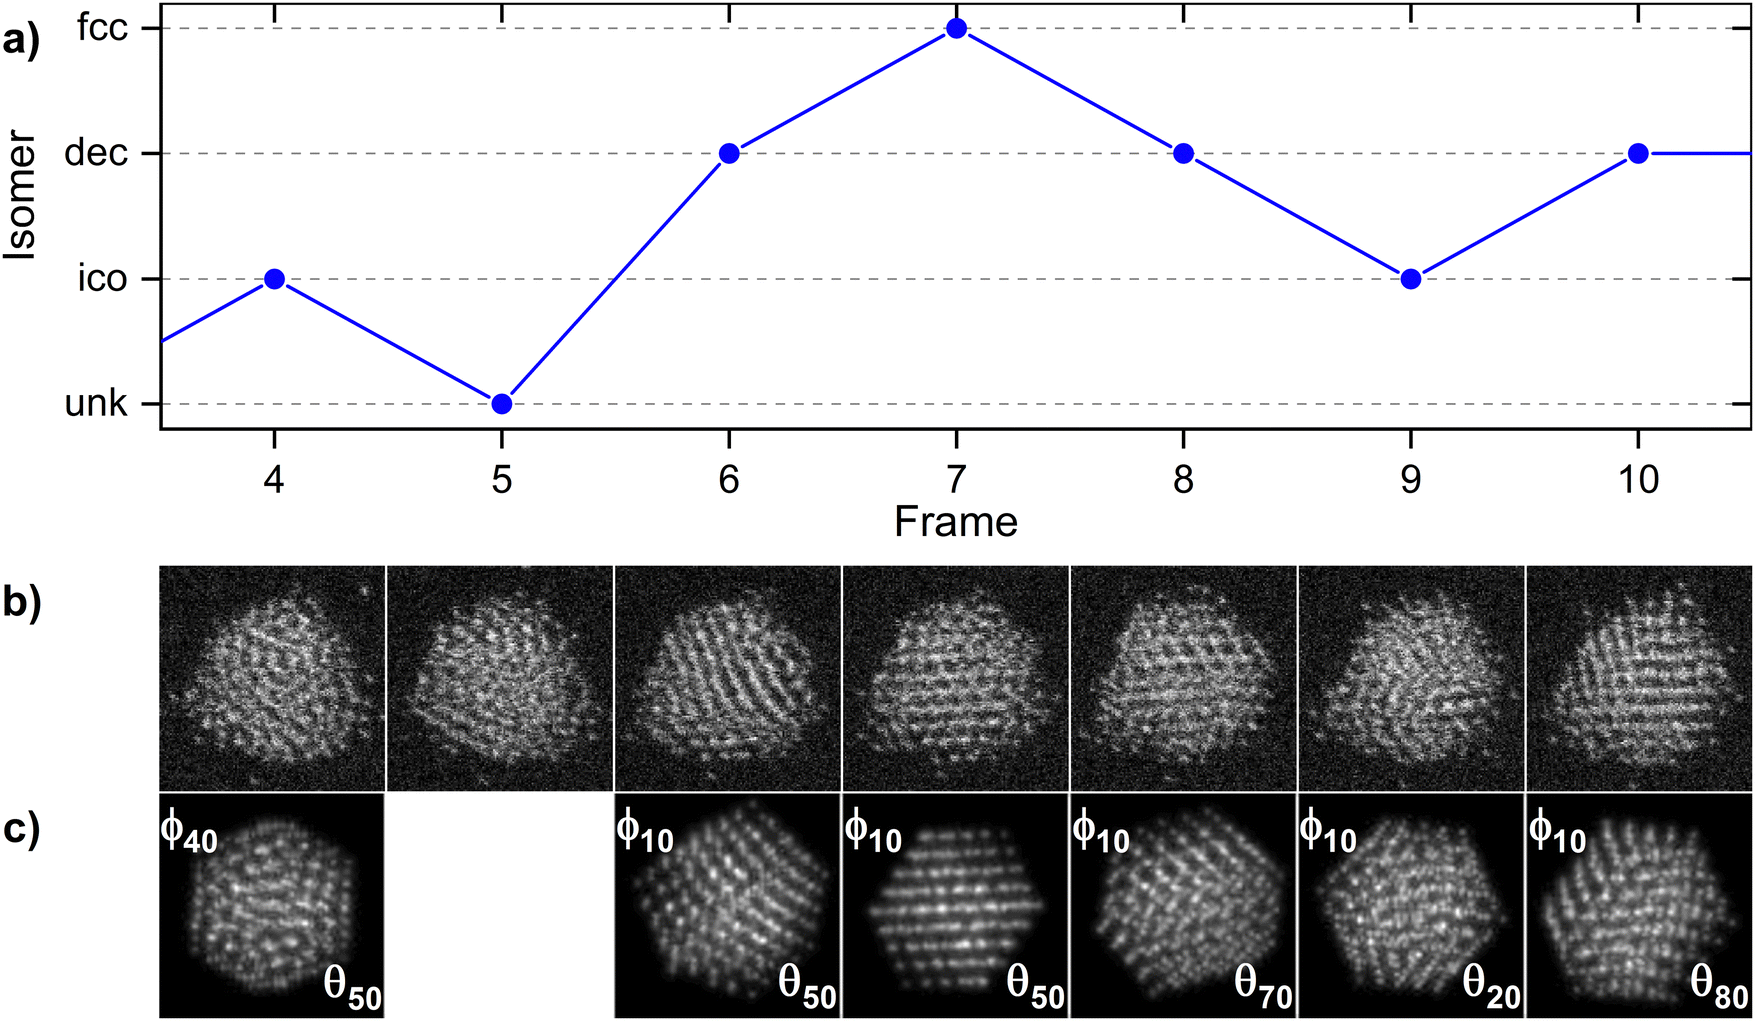 | ||
| Fig. 2 (a) A sub-region of the isomer trace (frames 4–10) shown in Fig. 1(a). (b) The corresponding HAADF-STEM images for each frame and (c) the matched simulation for each ordered structure from the simulation atlas (labelled with associated azimuthal and polar rotation angles). | ||
Fig. 3 displays a histogram of the abundances of each structural isomer extracted from the frame-by-frame analysis of the videos of the two clusters whose traces are shown in Fig. 1. From these and other histograms we can say, in broad terms, that the decahedral and amorphous structures are more common, while the fcc and icosahedral isomers appear less frequently. Here, amorphous/glassy structures are assigned when there is no discernible periodicity within the image of a cluster. The main difference between the two cluster traces is the very different ratio of decahedral and glassy structures. We hypothesize that this difference between the two cluster abundance spectra arises because the size distribution of the deposited clusters is, as noted, not completely monodisperse and thus the clusters may have different sizes. The integrated intensity of a cluster in the ac-STEM HAADF measurements can be used to quantify the number of atoms in an individual cluster, but the precision is not better than the mass resolution associated with the deposition process (approximately ± 15 atoms). An additional check of cluster size is provided by measurement of projected diameters, which gives an approximation of the number of atoms if we assume clusters take on their unsupported Wulff shape. Averaging over the abundances obtained from a set of four experimental image series leads to the average histogram shown in Fig. 3(c). This average over the dynamic data from the set of four clusters is compared with a static analysis of 58 clusters imaged in 25 separate locations on the same grid. The two graphs, dynamic and static, are in broad agreement, certainly when the observed variation in the traces from one cluster to another is taken into account. Thus we can say that, at least in broad terms, the ergodic theorem is followed.
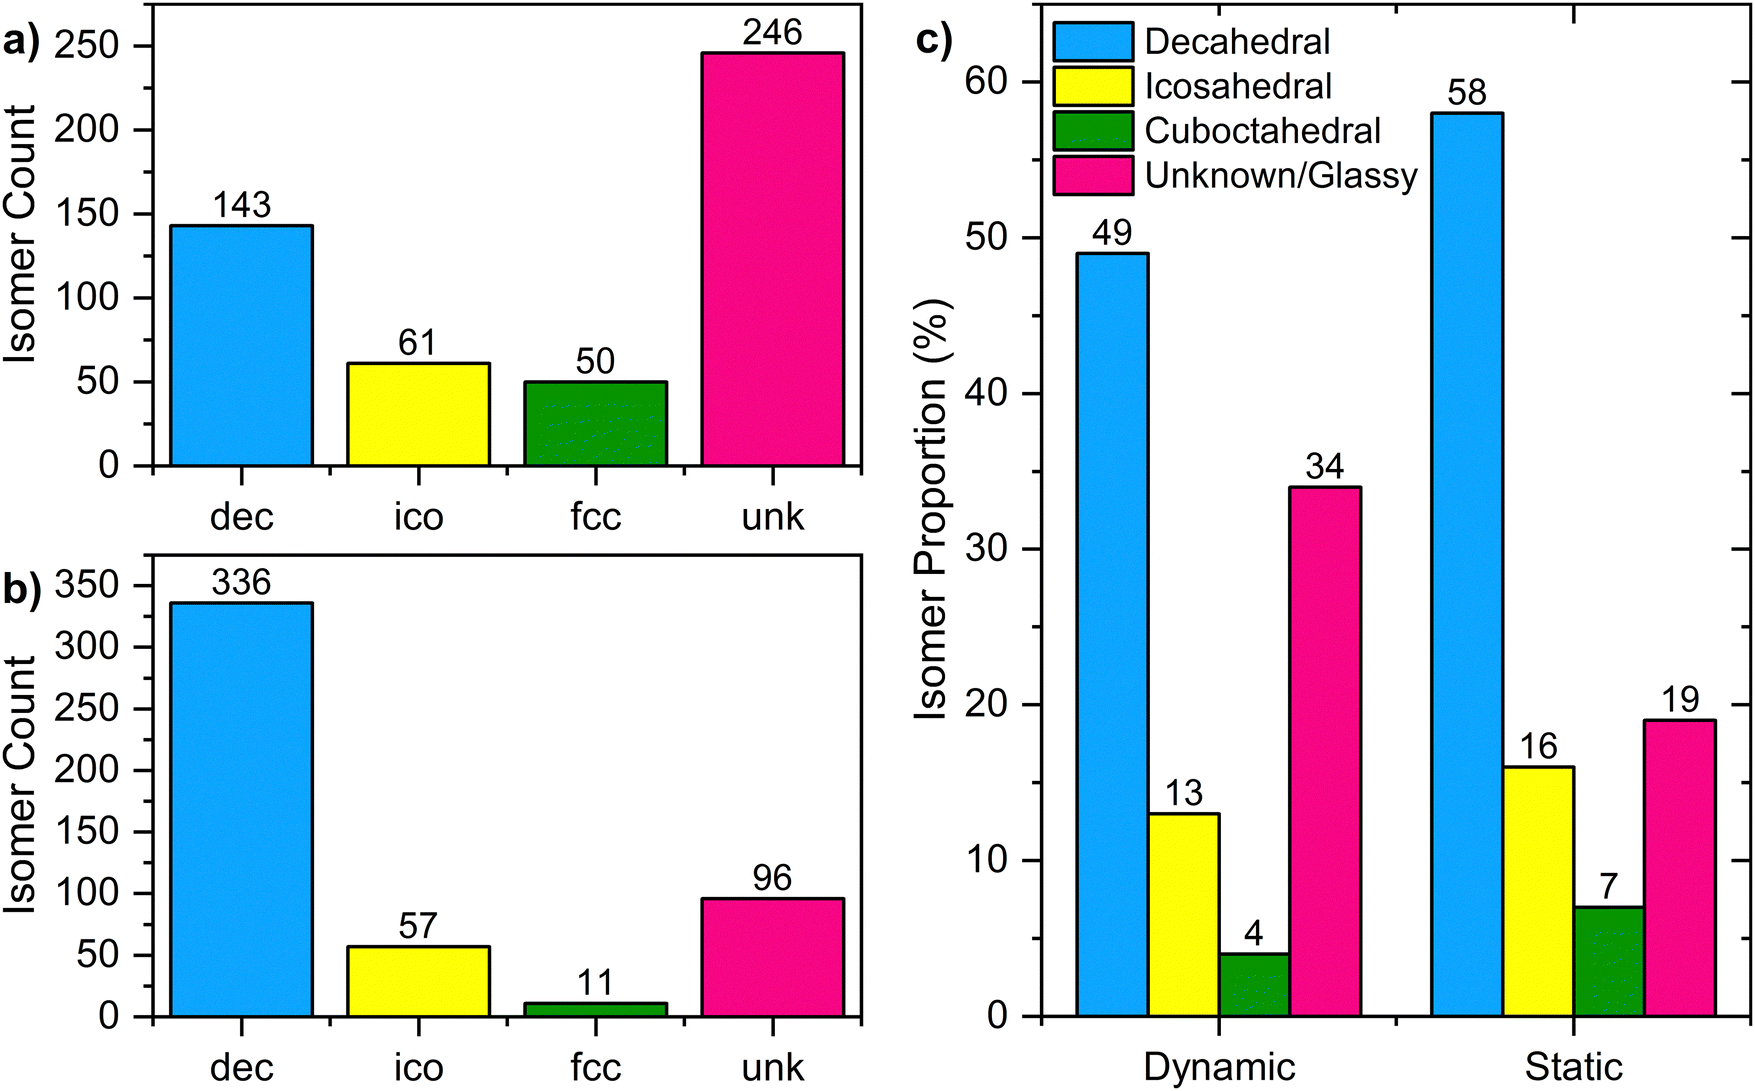 | ||
| Fig. 3 Histograms of isomer abundances for the traces in (a) Fig. 1(a) and (b) Fig. 1(b). (c) Histogram of isomer abundances from a set of four dynamic image series compared with an ensemble of clusters (static imaging). | ||
Of further interest in the new dynamic data are the “branching ratios” that can be extracted; in other words, the probability that a cluster exhibiting one kind of isomer structure switches to the other kinds of atomic configuration. Table 1 gives the branching ratios extracted from the set of four different cluster video traces, each of 500 frames. To illustrate the kind of information that can be deduced from such measurements, we note that the probability of transition to fcc structures from decahedral or icosahedral structures is very low (1% for decahedra and 2% for icosahedra). Moreover, fcc structures transition to amorphous/unknown structures (36%) more frequently than either decahedral (16%) or icosahedral (7%) structures. It would seem that the barriers between fcc isomers on one hand and dechedral and icosahedral on the other hand are substantial. By contrast, 28% of the transitions from icosahedral structures are to decahedral frames, which suggests that the energy barriers between these structures are relatively low.
| Original isomer | Transition to (%) | |||
|---|---|---|---|---|
| Decahedral | Icosahedral | fcc | Glassy | |
| Decahedral | 76 | 8 | 1 | 15 |
| Icosahedral | 28 | 32 | 2 | 38 |
| fcc | 16 | 7 | 41 | 36 |
| Glassy | 22 | 14 | 5 | 59 |
The possible dependence of preferred cluster structure on exact size within the deposited mass distribution of clusters is illuminated by the results of theoretical calculations for free Au309 clusters and adjacent sizes. The most probable structural isomers in the size regime of the experiments were searched by means of global optimization (basin hopping12) with a Gupta potential.13–16Fig. 4 plots the theoretical probabilities for the abundance of the decahedral and fcc isomers versus cluster size across a subset of the experimental range at a temperature of 300 K, calculated using the harmonic superposition approximation17,18 (see Methods). Most notable is the strong dependence of the relative probabilities on the precise size. The switching in the relative probabilities of fcc and decahedral isomers with size gives support to the explanation of the two types of isomer trace shown in Fig. 1 with abundances plotted in Fig. 3. Clearly each cluster we observe has a specific size, even if we do not know exactly what it is. Consider as an example the very different ratio found theoretically for sizes 307 and 315 in Fig. 4, both of these sizes lie within the experimental bounds. Therefore the future use of much tighter experimental mass resolution would be very interesting if feasible.
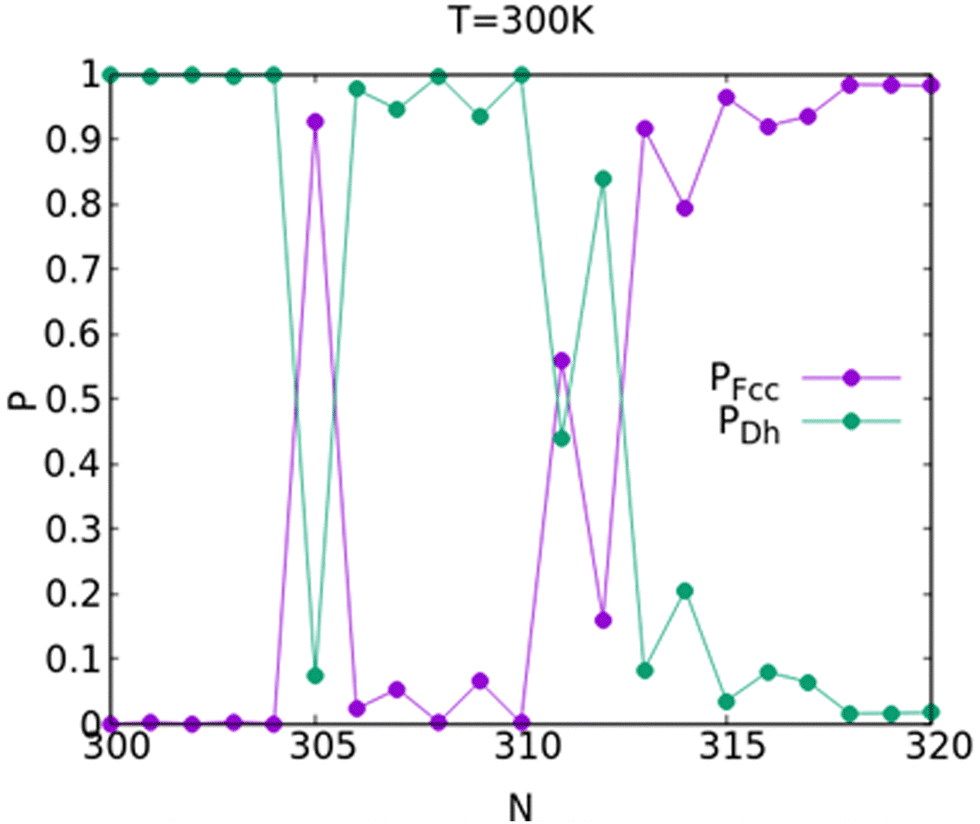 | ||
| Fig. 4 Room-temperature probability as a function of size for decahedral (Dh) and face-centered-cubic (fcc) structural families, as calculated by HSA. | ||
In summary, we have shown that video imaging of a single deposited gold cluster in the ac-STEM, coupled with structure analysis by the simulation atlas approach, reveals how each cluster fluctuates between different atomic structures (isomers) on the time scale of seconds. The four kinds of structure identified are three ordered isomers – fcc, decahedral and icosahedral – plus amorphous/glassy structures. The measured abundances of the isomers in individual cluster traces vary from cluster to cluster, but the most common ordered structure observed for Au clusters with 309 ± 15 atoms is the decahedron. Cluster traces tend to fall into two categories according to high or low proportions of amorphous/glassy structures.
The measurements demonstrated here open the way to the collection of a considerable body of data on the structural dynamics of deposited nanoparticles with atomic resolution. One application of the data is to regulate and refine the structural/energetic models of clusters used today. These are employed widely in simulations of nanostructures, and are important for our understanding of these fundamentally intriguing systems with diverse applications. This study is a first step towards these goals, with acquisition parameters chosen based on signal-to-noise and limits of the imaging system (in terms of frame-rates). In the future, we aim to explore the effects of changing beam current and dwell time to ensure that the effect of the electron beam on measurements is well-understood.
Experimental
The Au clusters were produced using a magnetron sputtering, gas-condensation cluster beam source,20 incorporating a lateral time-of-flight mass filter21 which was used to select clusters of size 309 ± 15 atoms. Clusters were soft-landed [18 eV deposition energy] onto an amorphous carbon film, supported on a copper TEM grid, from Agar Scientific. The HAADF-STEM imaging was conducted using a JEOL ARM300 instrument, located in the ePSIC centre at Diamond Light Source, operated at 300 kV accelerating voltage and equipped with a spherical aberration probe corrector. Images were acquired with a 26 mrad convergence semi-angle and a HAADF inner angle of 58 mrad. The beam current was 25 pA, image series had either 256 × 256 or 512 × 512 pixels and the per-pixel dwell time on the image series was 5 or 10 μs, for a total frame time of approximately 1 second for each image series. The per-pixel dwell time was chosen as the fastest limit of the refresh rate of the script used to perform the acquisition. The frequency of transition is on the order of seconds (as seen from the persistence of structure across multiple frames in this study) and therefore this frame rate was deemed to be acceptable to measure the frequency of isomer transition.The simulation atlas employed was produced using the abTEM Python package,22 with atomic models created using the atomic simulation environment (ASE).23 HAADF-STEM images were simulated via abTEM using the plane-wave reciprocal-space interpolated scattering matrix (PRISM) algorithm.24 Assignments of cluster structure were made manually through visual comparison between the experimental cluster images and all images contained in the simulation atlas. In comparing the assignments of two independent assigners, we have determined an accuracy of approximately 90% for manual assignment of two different datasets.
Global optimization searches were made with the basin hopping algorithm,12 using our own code.25–27 For each size, three independent simulations of 250![[thin space (1/6-em)]](https://www.rsc.org/images/entities/char_2009.gif) 000 steps were performed, using different seeds and parameters, to ensure a better exploration of the energy landscape. Parameters for the gold interaction potential were taken from Baletto et al.28 At least ten structures were collected for each size, including the global minimum and other isomers belonging to different structural families (such as Dh, fcc and Ih). From these data sets, the harmonic superposition approximation was employed to estimate the probability for each structural motif, as a function of size and temperature, as explained in Roncaglia et al.29
000 steps were performed, using different seeds and parameters, to ensure a better exploration of the energy landscape. Parameters for the gold interaction potential were taken from Baletto et al.28 At least ten structures were collected for each size, including the global minimum and other isomers belonging to different structural families (such as Dh, fcc and Ih). From these data sets, the harmonic superposition approximation was employed to estimate the probability for each structural motif, as a function of size and temperature, as explained in Roncaglia et al.29
Conflicts of interest
There are no conflicts to declare.Acknowledgements
We are grateful to Henry P Hoddinott for the deposition of the clusters using the Swansea University Nanocluster Source (SUNS) located at the Diamond Light Source, beamline B07, hosted by Prof. Georg Held, and to Prof. Bernd von Issendorff and colleagues for their contribution to building the source. We thank Diamond Light Source for access and support in use of the electron Physical Science Imaging Centre (TEM Instrument E01, Proposal Number: MG28449), and gratefully acknowledge EPSRC grant EP/V029797/2 for support of the electron microscopy. This work is founded on the pioneering video studies of deposited clusters conducted by Dr Dawn Foster and described in her PhD thesis.19References
- M. Lelek, M. T. Gyparaki, G. Beliu, F. Schueder, J. Griffié, S. Manley, R. Jungmann, M. Sauer, M. Lakadamyali and C. Zimmer, Nat. Rev. Methods Primers, 2021, 1, 1–27 CrossRef PubMed.
- L. Xiao and E. S. Yeung, Annu. Rev. Anal. Chem., 2014, 7, 89–111 CrossRef CAS PubMed.
- D. J. Smith, Microsc. Microanal., 2008, 14, 2–15 CrossRef CAS PubMed.
- J. P. Eckmann and D. Ruelle, Rev. Mod. Phys., 1985, 57, 617 CrossRef CAS.
- P. Priecel, H. A. Salami, R. H. Padilla, Z. Zhong and J. A. Lopez-Sanchez, Chin. J. Catal., 2016, 37, 1619–1650 CrossRef CAS.
- M. Boronat, A. Leyva-Pérez and A. Corma, Acc. Chem. Res., 2014, 47, 834–844 CrossRef CAS PubMed.
- D. M. Foster, R. Ferrando and R. E. Palmer, Nat. Commun., 2018, 9, 1–6 CrossRef CAS PubMed.
- Z. W. Wang and R. E. Palmer, Phys. Rev. Lett., 2012, 108, 245502 CrossRef CAS PubMed.
- D. M. Wells, G. Rossi, R. Ferrando and R. E. Palmer, Nanoscale, 2015, 7, 6498–6503 RSC.
- J. Vernieres, N. Tarrat, S. Lethbridge, E. Watchorn-Rokutan, T. Slater, D. Loffreda and R. E. Palmer, Commun. Chem., 2023, 6, 1–5 CrossRef PubMed.
- I. Fampiou and A. Ramasubramaniam, J. Phys. Chem. C, 2012, 116, 6543–6555 CrossRef CAS.
- D. J. Wales and J. P. K. Doye, J. Phys. Chem. A, 1997, 101, 5111–5116 CrossRef CAS.
- F. Cyrot-Lackmann and F. Ducastelle, Phys. Rev. B: Solid State, 1971, 4, 2406 CrossRef.
- R. P. Gupta, Phys. Rev. B: Condens. Matter Mater. Phys., 1981, 23, 6265 CrossRef CAS.
- V. Rosato, M. Guillope and B. Legrand, Philos. Mag. A, 1989, 59, 321–336 CrossRef.
- F. Cleri and V. Rosato, Phys. Rev. B: Condens. Matter Mater. Phys., 1993, 48, 22 CrossRef CAS PubMed.
- J. P. K. Doye and F. Calvo, Phys. Rev. Lett., 2001, 86, 3570 CrossRef CAS PubMed.
- D. Wales, Energy Landscapes, Cambridge University Press, 2003 Search PubMed.
- D. M. Foster, PhD thesis, University of Birmingham, 2017.
- S. Pratontep, S. J. Carroll, C. Xirouchaki, M. Streun and R. E. Palmer, Rev. Sci. Instrum., 2005, 76, 045103 CrossRef.
- B. Von Issendorff and R. E. Palmer, Rev. Sci. Instrum., 1999, 70, 4497 CrossRef CAS.
- J. Madsen and T. Susi, Open Research Europe, 2021, 1, 24 Search PubMed.
- A. Hjorth Larsen, J. JØrgen Mortensen, J. Blomqvist, I. E. Castelli, R. Christensen, M. Dułak, J. Friis, M. N. Groves, B. Hammer, C. Hargus, E. D. Hermes, P. C. Jennings, P. Bjerre Jensen, J. Kermode, J. R. Kitchin, E. Leonhard Kolsbjerg, J. Kubal, K. Kaasbjerg, S. Lysgaard, J. Bergmann Maronsson, T. Maxson, T. Olsen, L. Pastewka, A. Peterson, C. Rostgaard, J. SchiØtz, O. Schütt, M. Strange, K. S. Thygesen, T. Vegge, L. Vilhelmsen, M. Walter, Z. Zeng and K. W. Jacobsen, J. Phys.: Condens. Matter, 2017, 29, 273002 CrossRef PubMed.
- C. Ophus, Adv. Struct. Chem. Imaging, 2017, 3, 1–11 CrossRef PubMed.
- G. Rossi and R. Ferrando, Chem. Phys. Lett., 2006, 423, 17–22 CrossRef CAS.
- G. Rossi and R. Ferrando, J. Phys.: Condens. Matter, 2009, 21, 084208 CrossRef CAS PubMed.
- G. Rossi and R. Ferrando, Comput. Theor. Chem., 2017, 1107, 66–73 CrossRef CAS.
- F. Baletto, R. Ferrando, A. Fortunelli, F. Montalenti and C. Mottet, J. Chem. Phys., 2002, 116, 3856–3863 CrossRef CAS.
- C. Roncaglia, D. Rapetti and R. Ferrando, Phys. Chem. Chem. Phys., 2021, 23, 23325–23335 RSC.
| This journal is © The Royal Society of Chemistry 2024 |