 Open Access Article
Creative Commons Attribution 3.0 Unported Licence
Adsorption of mercury(II) with an Fe3O4 magnetic polypyrrole–graphene oxide nanocomposite
Chao
Zhou
,
He
Zhu
,
Qin
Wang
,
Junxiu
Wang
,
Juan
Cheng
,
Yongfu
Guo
 *,
Xiaoji
Zhou
and
Renbi
Bai
*
Center for Separation and Purification Materials & Technologies, Suzhou University of Science and Technology, Suzhou 215009, P. R. China. E-mail: yongfuguo@163.com; Tel: +86-512-68092987
First published on 27th March 2017
Abstract
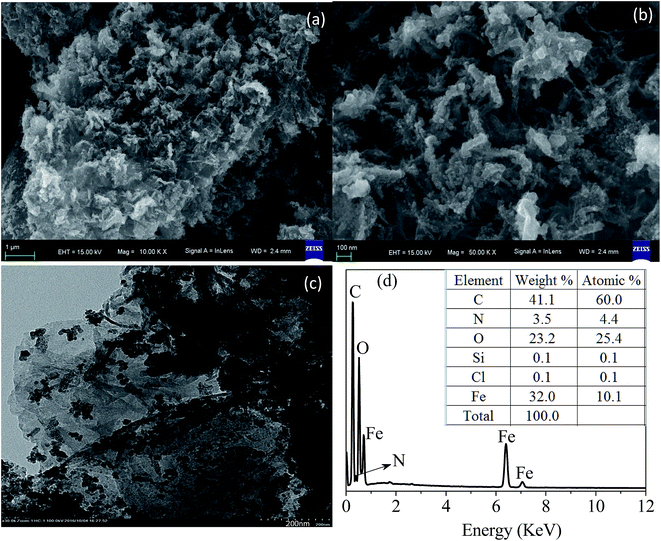
To enhance the ability to remove mercury(II) from aqueous media, an Fe3O4 magnetic nanocomposite (PPy–GO) composed of polypyrrole (PPy) and graphene oxide (GO) was synthesized in situ and characterized via scanning electron microscopy (SEM), energy dispersive X-ray spectroscopy (EDX), transmission electron microscopy (TEM), X-ray photoelectron spectrometry (XPS), X-ray diffraction (XRD), Fourier transform-infrared spectroscopy (FT-IR), zeta potential analysis, vibrating sample magnetometer (VSM) and the Brunauer–Emmett–Teller (BET) method. The performance of the magnetic PPy–GO for adsorbing mercury(II) from water along with the effects of solution pH, adsorbent dosage, coexisting ions, reaction time and temperature were studied in detail. The adsorption kinetics, isotherms and thermodynamics were investigated in detail to gain insights into the adsorption process. The results show that the BET surface area of the magnetic PPy–GO reached 1737.6 m2 g−1. The Langmuir capacity of the magnetic PPy–GO for mercury(II) adsorption was 400.0 mg g−1 at 300 K and pH 7 ± 0.1. After adsorption, the magnetic PPy–GO nanocomposite could be efficiently separated from water via a magnetic field. The adsorption process was endothermic and spontaneous and occurred in accord with the Langmuir and pseudo-second-order models. The overall adsorption of mercury(II) not only involved chemisorption, but was also partially governed by intra-particle diffusion. Data from the preliminary application of magnetic PPy–GO to remove heavy metals from real electroplating effluent indicated a high removal efficiency of over 99% for mercury(II). Finally, a possible adsorption mechanism was discussed. All data showed that the magnetic PPy–GO material is a promising adsorbent to remove mercury(II) from aqueous media.
1. Introduction
The pollution of heavy metals has become more and more serious due to the flourishing development of community economy, industry and agriculture.1 Mercury, cadmium, nickel, copper, lead, zinc and chromium are the most common heavy metals contributing to serious pollution.2,3 Among these trace heavy metals, mercury(II) has drawn much attention because of its adverse impact on human beings and the natural environment. After wastewater containing mercury is discharged into natural water, the accumulation of mercuric compounds in the bodies of humans and animals occurs, resulting in adverse effects.4 In many countries, mercury is considered as a serious and hazardous pollutant. The maximum acceptable content of mercury for human beings recommended by the WHO is 6 μg L−1 in drinking water.5It is very important to separate mercury from aqueous media before they are released into water bodies. Many methods can be employed to separate mercury from aqueous media, including physical, chemical and biological methods.6 Among these technologies, adsorption is often used to remove heavy metals owing to its higher efficiency and wider adaptability.7,8
Graphene oxide (GO), a derivative of graphene with an extremely large BET surface area, contains plentiful oxygen-containing functional groups with negative charges in its structure, including hydroxyl, epoxide and carboxyl groups.9,10 These hydrophilic oxygen-containing functional groups make GO easily dissolve to form homogeneous suspensions under ultrasonic exfoliation.11 These advantages also give GO the potential to separate heavy metal ions from aqueous media. Yang et al. employed GO to remove Cr(III) from water.12 Tan et al. also reported the removal of Ni(II) and Cd(II) from aqueous solutions using GO materials.13
Nevertheless, it is difficult to separate GO from aqueous media after adsorption due to its low specific weight and small particle size. Magnetic separation provides a promising technique for the separation of GO materials due to its simplicity,14 high efficiency and rapid speed compared to filtration and centrifugation.1,15,16
For instance, Wang et al. applied magnetic chitosan/GO to adsorb Pb(II) and obtained a maximum adsorption capacity of 79 mg g−1 (BET surface area = 392.5 m2 g−1, pH = 5);17 Cui et al. used xanthate-functionalized magnetic GO to remove mercury(II) and reached a capacity of 118.6 mg g−1 (BET surface area = 30.1 m2 g−1, pH = 7).18
However, the adsorption capacity of GO for heavy metals in water is still not high enough due to its low BET value when it is used as the basic adsorption material.19
Polypyrrole (PPy), one of the most common conductive polymers, has some unique characteristics such as high conductivity, good environmental stability, non-toxicity, low cost and ease of preparing, and PPy has been widely used in batteries, sensors, supercapacitors and microwave shielding devices.
Researchers have found that positive charges exist in the PPy polymer due to the presence of nitrogen atoms. Moreover, PPy polymer can participate in ion exchange with anions in aqueous solution owing to its high surface energy, making it an ideal adsorbent material. Based on these properties, researchers have begun to study the application of PPy polymer to the adsorption of heavy metal ions in water.20
Shafiabadi et al. employed polypyrrole (PPy)/SBA-15 to remove mercury(II) and realized an adsorption capacity of 200 mg g−1 (BET surface area = 97.6 m2 g−1, pH = 8).21 Chávez-Guajardo et al. used a polypyrrole/maghemite magnetic nanocomposite to remove Cr(VI) and obtained a capacity of 208.8 mg g−1 (BET surface area = 30 m2 g−1, pH = 2).22
However, it is easy for PPy polymer to agglomerate in water due to the existence of Π* in the main chain of the PPy polymer. In addition, the small BET value and poor dispersion in water of PPy polymer result in a low adsorption capacity for heavy metals. At present, the practical uses of adsorption devices in water treatment usually involve a fixed bed/column/tower and employ fillers with large density and large size. Thus, it is difficult to apply PPy polymer and GO in practical engineering owing to their small sizes and low densities.
Based on the above considerations, the combination of PPy polymer and GO with the addition of magnetic nanoparticles should not only enhance the physical and chemical properties of PPy and GO, but also increase their density and size. At the same time, this method can also remarkably increase the BET surface areas of the two nanomaterials and improve their dispersion in water so as to enhance the adsorption capacity for heavy metals. This is expected to allow the application of PPy polymer and GO materials in a fixed bed/column/tower in practical engineering activities.
Therefore, a magnetic polypyrrole–graphene oxide nanocomposite (PPy–GO) was chemically synthesized with pyrrole monomer and GO in situ via the doping of magnetic nanoparticles. The as-prepared magnetic PPy–GO nanocomposite was employed to remove mercury(II) from aqueous solution. Batch adsorption experiments were carried out to investigate in detail the performance of the magnetic PPy–GO for the removal of mercury(II). The study is summarized by the following steps: (a) produce the magnetic PPy–GO adsorbent with large BET surface area; (b) investigate influence of solution pH, adsorbent dosage, equilibrium time, adsorption temperature and coexisting ions; (c) investigate the adaptability of several adsorption models; (d) discuss the probable adsorption mechanism for mercury(II) onto the magnetic PPy–GO.
2. Experimental
2.1 Materials and reagents
Pyrrole monomer (Py, 98%), graphite (750–850 mesh), iron sulfate heptahydrate (FeSO4·7H2O) and hydrogen peroxide (H2O2) were obtained from Sinopharm Chemical Reagent Co., Ltd (Shanghai, China). Potassium permanganate (KMnO4), mercury(II) chloride (HgCl2), sodium nitrate (NaNO3), iron chloride hexahydrate (FeCl3·6H2O), sulfuric acid (H2SO4), nitric acid (HNO3), hydrochloric acid (HCl), potassium peroxydisulfate (K2S2O8) and phosphorus pentoxide (P2O5) were provided by Aladdin Chemical. The chemicals used were all of analytical grade.2.2 Preparation of materials
The above product (2.0 g) was put into concentrated H2SO4 (273 K, 50 mL) containing NaNO3 (1.0 g) with agitation to prevent the temperature of the mixture from exceeding 293 K. The mixture was kept at 6 h at 273 K. Then, KMnO4 (6.0 g) was added gradually and agitated for 12 h at 308 K.
The above reactions were finished by adding ultra-pure water (280 mL) and H2O2 solution (30%, v/v, 5 mL) within 30 min. Subsequently, a bright yellow mixture appeared. The mixture was then washed with HCl (10%, v/v). The resulting solution was centrifuged and washed until the solution pH became neutral. Finally, the product was desiccated by freeze-drying for further experiments.
2.3 Adsorption experiments
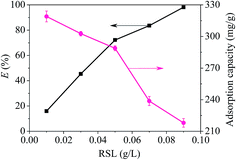
A reserve solution of mercury(II) (1.0 g L−1) was obtained by dissolving HgCl2 (0.6767 g) in a mixed solution (500 mL) containing HCl (0.01%, v/v) and HNO3 (0.1%, v/v). The test was operated under various conditions, including different mercury(II) contents (20–100 mg L−1), a range of reaction times (t), pH values (2–10), adsorbent amounts (0.01–0.09 g L−1) and temperatures (T, 300–320 K).The equilibrium adsorption capacities (qe, mg g−1) were determined by eqn (1):
 | (1) |
 | (2) |
2.4 Analytical methods
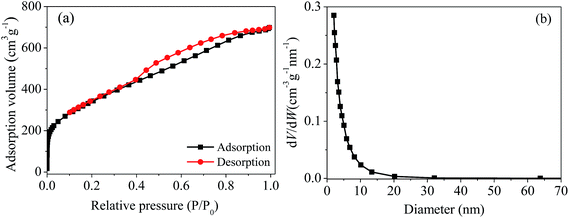
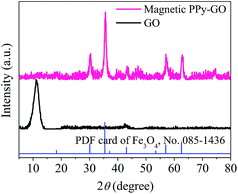
The BET value was determined from the nitrogen adsorption/desorption plot using a specific surface area analyzer (V-Sorb 2800TP, Gold APP, China). The textural properties and surface morphologies were characterized by SEM (ZEISS, Germany) and TEM (JEM-2100, Japan). The elemental analysis was obtained by EDX.Analyses of the organic functional groups and lattice structure were conducted via FT-IR (Nicolet 6700, Thermo-Nicolet, USA) and XRD (D8 Advance, Bruker, Germany). The range of diffraction angles (2θ) was 5° to 80°.
An electrophoresis analyzer (ZetaPALS, Brookhaven, USA) was employed to determine the zeta potential values of the absorbents under different pH values. An XPS meter (250Xi, Thermo-VG Scientific, USA) was applied to analyze the element valence state. The magnetic property was confirmed by a VSM meter (Lakeshore 7404, USA) with a 10 kOe magnetic field at 298 K. The contents of mercury(II) ions were analyzed by cold atomic absorption adsorption spectrophotometry (F732-VJ, Jiangfeng, China).
3. Results and discussion
3.1 Characterization
The combination of PPy, GO and Fe3O4 nanoparticles is conducive to improving the drawbacks of PPy and GO mentioned above by increasing the density, size and BET values of the composite nanomaterials and improving their dispersion in water so as to enhance the adsorption capacity for heavy metals.
The pore size distribution of magnetic PPy–GO is shown in Fig. 2(b). The average pore diameter and pore volume were 4.2 nm and 0.89 cm3 g−1, respectively. According to the BET determination, it can draw a conclusion that the characteristics of the magnetic PPy–GO will be conducive to adsorbing mercury(II).
Moreover, no peaks of Ppy were observed; these peaks may have been completely covered by the strong diffraction peaks of Fe3O4 due to the effects of the magnetic nanoparticles in the magnetic PPy–GO.9
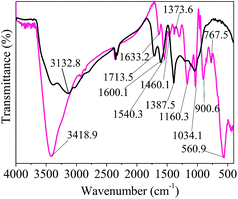
![[double bond, length as m-dash]](https://www.rsc.org/images/entities/char_e001.gif) O).17 The strong peaks appearing at 1600.1 and 1540.3 cm−1 were related to the C
O).17 The strong peaks appearing at 1600.1 and 1540.3 cm−1 were related to the C![[double bond, length as m-dash]](https://www.rsc.org/images/entities/char_e001.gif) C bonds in the GO and Py rings, respectively, further confirming the presence of polypyrrole.28
C bonds in the GO and Py rings, respectively, further confirming the presence of polypyrrole.28
The obvious peak at 1460.1 cm−1 could be attributed to the C–H stretching vibration in the structure of the pyrrole ring.28 The peaks at near 1380 cm−1 correspond to the vibrations of C–O in the carboxyl groups.29 The two peaks at around 1373 cm−1 correspond to C–N bond stretching vibrations in the structure of the pyrrole ring.28,30 The presence of the peak at 1160.3 cm−1 indicated the presence of C–O–C bonds in the GO rings.30 A very strong band at 1034.1 cm−1 was assigned to the in-plane deformation of the C–H and N–H bonds of the pyrrole ring.30,31
The adsorption bands at 900.6 and 767.5 cm−1 were attributed to the deformation and out-of-plane vibration of C–H or wagging vibration of pyrrole, respectively.25,28 The peak at 560.9 cm−1 indicated the presence of Fe–O vibration and the successful combination of Fe3O4 nanocomposite with GO, which is consistent with the XRD data.
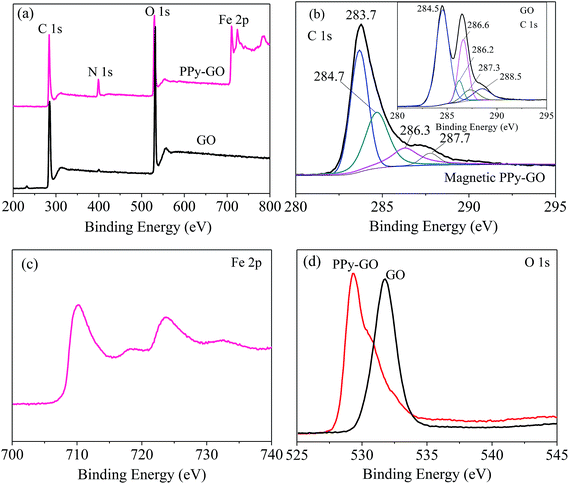
In Fig. 5(b), the peaks at 283.7, 284.7 and 284.5 eV were all assigned to the C–C or/and C![[double bond, length as m-dash]](https://www.rsc.org/images/entities/char_e001.gif) C bonds in the ring structures of the magnetic PPy–GO and GO.32 However, there was an obvious difference among the above three C 1s peaks because of the presence of sp2 hybridized carbon.
C bonds in the ring structures of the magnetic PPy–GO and GO.32 However, there was an obvious difference among the above three C 1s peaks because of the presence of sp2 hybridized carbon.
The peak at 286.6 eV belonged to epoxy and alkoxy.19,33 The peaks at 286.2 and 286.3 eV should correspond to the carbon-linking hydroxyl groups (C–OH) in GO.16,33 The peaks at 287.3 and 287.7 eV should be attributed to carbonyl groups (C![[double bond, length as m-dash]](https://www.rsc.org/images/entities/char_e001.gif) O) in the structure of GO.33 The peak located at 288.5 eV was assigned to the COOH groups in GO.32,33
O) in the structure of GO.33 The peak located at 288.5 eV was assigned to the COOH groups in GO.32,33
The binding energies of Fe 2p1/2 and 2p3/2 were 710.3 and 723.8 eV, respectively [Fig. 5(c)]. As shown in Fig. 5(d), the peak belonging to O 1s moved from 531.7 eV for GO to 529.3 eV for magnetic PPy–GO, which can be attributed to the characteristics of lattice oxygen in the Fe3O4 nanoparticles. Moreover, the binding energy of N 1s at 399.3 eV (not shown) confirmed the presence and successful synthesis of PPy polymer.
3.2 Adsorption studies
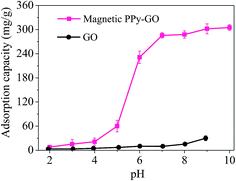 | ||
| Fig. 8 Adsorption capacities of GO and magnetic PPy–GO under various pH conditions. Conditions: T = 300 K, RSL = 0.05 g L−1 and C0 = 20 mg L−1 for magnetic PPy–GO; T = 298 K, RSL = 0.5 g L−1 and C0 = 100 mg L−1 for GO.32 | ||
Upon further increasing the solution pH, the adsorption capacity of the magnetic PPy–GO continued to increase, but the rate of increase gradually became slow (pH greater than 7).
The existence morphologies of mercury(II) in water can explain the above phenomenon. The species of mercury present in water change with solution pH as follows: main Hg2+ and minor HgCl+ (pH less than 4.0); main HgCl2 and trace Hg(OH)2 (pH 4–6); HgCl2, HgOH+, Hg(OH)3+ and minor Hg(OH)2 (pH of 6–8); and mainly insoluble Hg(OH)2 (pH greater than 8).36–38
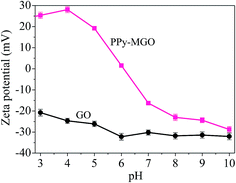
At low pH, the electrostatic repulsion between magnetic PPy–GO and Hg2+ hindered the removal of mercury(II). With the increase in pH from 5 to 7, the surface of magnetic PPy–GO became negatively charged, which was beneficial to the adsorption of Hg2+ and Hg(OH)2. The increase in negative charges on the surface of magnetic PPy–GO was obvious (see the zeta potential shown in Fig. 7), corresponding to the quick increase in adsorption capacity.
However, when solution pH was greater than 7, the increase in the adsorption capacity of the magnetic PPy–GO gradually became slow, which should be attributed to the deposition of mercury ions as Hg(OH)2 (Ksp = 3.13 × 10⁻²⁶), resulting in the removal of mercury(II).39 Simultaneously, this might have originated from the lone electron pairs of the nitrogen atoms that coordinated with Hg2+ to form relatively stable complexes, promoting the further removal of mercury(II).30 Additionally, some active sites with negative charges would be produced from the de-protonation of oxygen-containing functional groups and PPy polymer at higher pH.39 Thus, a pH of 7 was selected as the subsequent experimental value.
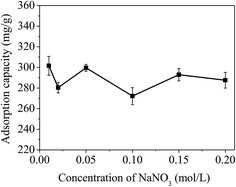 | ||
| Fig. 10 Effect of ionic strength on the removal of mercury(II). Condition: T = 300 K, C0 = 20 mg L−1, RSL = 0.05 g L−1, pH = 7.0 ± 0.1. | ||
Some literature pointed out that alkali metal ions including Na+ and K+ can compete with mercury(II) for the limited active sites due to the electrostatic effect.41 The experimental results showed that increasing the ionic concentration could increase competitive adsorption between Na+ cations and mercury(II). It is clear that electrostatic effects play a significant role during the adsorption of mercury(II).
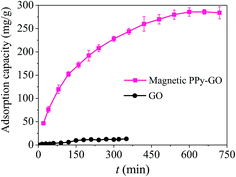 | ||
| Fig. 11 Effect of time on the removal of Hg(II) with GO and magnetic PPy–GO. Conditions: T = 300 K, C0 = 20 mg L−1, RSL = 0.05 g L−1 and pH = 7.0 ± 0.1 for magnetic PPy–GO; T = 298 K, RSL = 0.5 g L−1, C0 = 100 mg L−1 and pH = 6.0 for GO.32 | ||
The above results are attributed to the many active metal-binding sites on the surface of the magnetic PPy–GO at the beginning of the experiment. After a period of time, it became difficult for mercury(II) to occupy the remaining active sites because fewer adsorption sites were available, and the repulsive forces between the mercury(II) on the surface of the magnetic PPy–GO and mercury(II) in the solution phase. Additionally, the concentration gradients of mercury(II) between the solid surface and liquid-phase surface gradually decreased, resulting in a decelerating adsorption rate.
3.3 Adsorption kinetics
Adsorption kinetics can not only give a clear relationship between the adsorption amount of mercury(II) and contact time, but also provide some necessary information about the adsorption mechanism.42 To study the kinetic process of the adsorption for mercury(II), pseudo-first-order [eqn (3)] and pseudo-second-order kinetic models [eqn (4)] were used to investigate and fit the experimental results:ln(qe − qt) = ln![[thin space (1/6-em)]](https://www.rsc.org/images/entities/char_2009.gif) qe − k1t qe − k1t | (3) |
 | (4) |
Normally, the intra-particle model [eqn (5)] is employed to study the diffusion occurring in the inter-crystalline spaces of the adsorbent, particularly for GO-based materials:
| qt = kdit0.5 + Ci | (5) |
 | (6) |
The above four models can produce different lines, indicating a composite adsorption process that includes film diffusion, exterior surface diffusion and intra-particle diffusion.43 Based on the literature, the plot of t0.5vs. qt will be linear if the process of intra-particle mass-transfer is involved.43
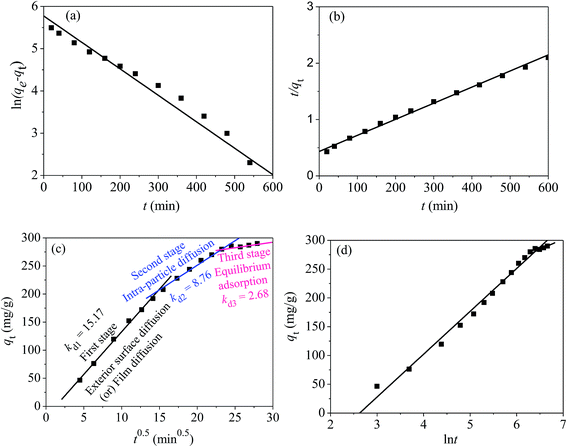
According to the fitted kinetic results shown in Table 1, the linear regression coefficient R22 (0.998) of the pseudo-second-order kinetic model was higher than the coefficient (R12 = 0.974) of the pseudo-first-order kinetic model [Fig. 12(a) and (b)]. The qe,cal value of the pseudo-second-order equation was more relevant to the experimental value qe,exp. Hence, the removal process of mercury(II) ions conformed to pseudo-second-order model and involved some chemisorption.
| Pseudo-first-order | Pseudo-second-order | |||||
|---|---|---|---|---|---|---|
| q e,exp (mg g−1) | q e,cal (mg g−1) | k 1 (min−1) | R 1 2 | q e,cal (mg g−1) | k 2 (mg mg−1 min−1) | R 2 2 |
| 285.7 | 349.7 | 0.0062 | 0.974 | 321.7 | 0.189 | 0.998 |
| Intra-particle diffusion | ||||||||
|---|---|---|---|---|---|---|---|---|
| k d1 (mg g−1 min−0.5) | C 1 (mg g−1) | R 1 2 | k d2 (mg g−1 min−0.5) | C 2 (mg g−1) | R 2 2 | k d3 (mg g−1 min−0.5) | C 3 (mg g−1) | R 3 2 |
| 15.17 | −18.93 | 0.996 | 8.76 | 76.16 | 0.994 | 2.68 | 215.11 | 0.999 |
| Elovich model | |||||
|---|---|---|---|---|---|
| α 1 (mmol g−1 min−1) | β 1 (g mmol−1) | R 1 2 | α 2 (mmol g−1 min−1) | β 2 (g mmol−1) | R 2 2 |
| 1026.49 | 0.013 | 0.987 | 148.25 | 0.028 | 0.999 |
The plots in Fig. 12(c) show three linear stages, indicating an adsorption process controlled by three stages. The values of Kdi, Ci and R2 in three stages are tabularized in Table 1.
The initial stage from 4.470.5 to 15.490.5 exhibited a sharp gradient attributed to exterior surface diffusion or film diffusion, corresponding to an instantaneous adsorption process (Kd1 = 15.17) and indicating that a large amount of mercury(II) was quickly adsorbed via the external plane of the adsorbent. The second stage from 15.490.5 to 24.490.5 was attributed to intra-particle diffusion. The third stage (plateau stage) from 24.490.5 to 27.930.5 belonged to equilibrium adsorption and represented a gradual saturation adsorption process.
The values of Kdi that represent the diffusion rates at different points during the adsorption process are tabulated in Table 1. Adsorption rate decreased in the following order: Kd1 > Kd2 > Kd3. This is explained as follows. As adsorption on the external surface reached saturation, the rate of mercury(II) penetrating into the inter-crystalline regions of magnetic PPy–GO was gradually decreased and finally reached an equilibrium stage (Kd3 = 2.68).
Moreover, Ci (shown in Table 1) was not equal to zero, indicating that the adsorption of mercury(II) involved some chemisorption and was partially controlled by intra-particle diffusion.18,44
Fig. 12(d) shows a linearized plot based on the Elovich model. The intercept and slope of the plot are normally employed to determine the initial adsorption rate α and constant β. From Fig. 12(d) it can be seen that αi was greater than βi at each fitting segment. In addition, the desorption coefficient β2 (0.028) was higher than β1 (0.013), indicating a gradually decelerating adsorption process trending towards an equilibrium stage; these findings were consistent with the fitting results from intra-particle diffusion.
The above results reveal that the general adsorption process of mercury(II) onto magnetic PPy–GO was controlled by chemical adsorption.
3.4 Adsorption isotherms
Adsorption isotherms are key to optimizing the application of adsorbents as they can be used to assess the performance of the adsorbent as well as to describe the interactions between adsorbates and adsorbents.9 For the sake of assessing the effect of temperature on the adsorption process, adsorption isotherms were constructed at various temperatures from 300 to 320 K.The temperature effect (Fig. 13) reveals that the adsorption capacity of magnetic PPy–GO was enhanced as temperature increased, indicating a preferable adsorption performance at higher temperatures. In comparison, the adsorption capacity of GO was only slightly enhanced as the temperature increased from 298 to 323 K. This results is explained as follows. As the temperature increased, the interaction between the solvent and adsorbent surface decreased, leading to more available adsorption sites.
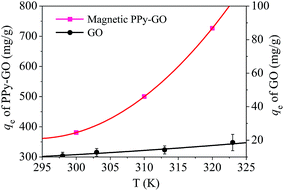 | ||
| Fig. 13 Adsorption isotherms of mercury(II) onto the magnetic PPy–GO nanocomposite. Conditions: pH = 7 ± 0.1, RSL = 0.05 g L−1 and C0 = 100 mg L−1 for the magnetic PPy–GO; pH = 6, RSL = 0.5 g L−1 and C0 = 100 mg L−1 for the GO.32 | ||
The Langmuir and Freundlich equations are often employed for analyzing thermodynamic parameters. The Langmuir model considers homogeneous, monolayer adsorption with no inter-reaction between the adsorbed molecules and is given in linear form by eqn (7):
 | (7) |
 | (8) |
 | (9) |
The parameters of the adsorption isotherms (Fig. 14) for the adsorption of mercury(II) onto the magnetic PPy–GO at various temperatures are listed in Table 2.
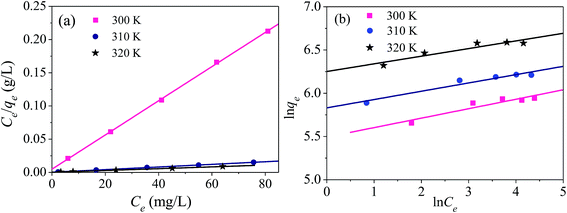 | ||
| Fig. 14 Adsorption isotherms for the adsorption of mercury(II) onto magnetic PPy–GO: Langmuir (a) and Freundlich (b) models. Conditions: pH = 7 ± 0.1, RSL = 0.05 g L−1, C0 = 20–100 mg L−1. | ||
| Experimental conditions | Langmuir | Freundlich | |||||
|---|---|---|---|---|---|---|---|
| Q m (mg g−1) | K L (L mg−1) | R 1 2 | R L | 1/n | K C (mg1−n Ln g−1) | R 2 2 | |
| T = 300 K | 400.0 | 0.52 | 0.999 | 0.019 | 0.109 | 243.0 | 0.841 |
| T = 310 K | 526.3 | 0.86 | 0.999 | 0.011 | 0.096 | 340.7 | 0.924 |
| T = 320 K | 769.2 | 1.08 | 0.999 | 0.009 | 0.088 | 518.7 | 0.852 |
In comparison with Freundlich model, the Langmuir model was more consistent with the adsorption of mercury(II) based on correlation coefficient R2, indicating monolayer adsorption. The maximum adsorption capacities of mercury(II) were 400.0 mg g−1 (T = 300 K) and 769.2 mg g−1 (T = 320 K).
According to the data obtained from Fig. 14, the values of RL were determined to be 0.019 (T = 300 K), 0.011 (T = 310 K) and 0.009 (T = 320 K). Normally, the separation factor RL represents favorable adsorption (0 < RL < 1), linear adsorption (RL = 1), irreversible adsorption (RL = 0) or unfavorable adsorption (RL > 1).1,46 The obtained values of RL were less than one, indicating favorable adsorption of mercury(II) onto the magnetic PPy–GO.
Smaller values of 1/n indicate a higher adsorption intensity and the involvement of a chemical process during the adsorption of mercury(II), in agreement with the larger KC values obtained using the Langmuir model.
Based on the data of k1, k2, KL and KC from kinetics and isotherm models, respectively, it can be concluded that it is easy for mercury(II) to adsorb onto the magnetic PPy–GO, and that the magnetic PPy–GO material has a higher adsorption rate and capacity. According to the above results and the adsorption data shown in Table 3, the adsorption capability of magnetic PPy–GO for mercury(II) surpasses the performances of many other adsorbents, indicating that the magnetic PPy–GO material is a promising adsorbent.
| Adsorbents | BET (m2 g−1) | Q m (mg g−1) | Ref. |
|---|---|---|---|
| Magnetic PPy–GO | 1737.6 | 400.0 (pH = 7) | This work |
| GO | 9.2 | 32.7 (pH = 6) | 32 |
| Magnetic GO (MGO) | 58.6 | 71.3 (pH = 6) | 32 |
| 3D reduced graphene oxide aerogel | 185 (pH = 6) | 47 | |
| Glutamine-modified chitosan magnetic composite microspheres | 199.2 (pH = 5) | 48 | |
| Poly-dithiocrabamate series | Less than 12 | 22.1 (pH = 5) | 49 |
| Coal-based activated carbon | 900 | 48.9 (pH = 4) | 50 |
| Chitosan-coated magnetic nanoparticles | 10 (pH = 3) | 51 | |
| MnO2/CNT nanocomposites | 110.4 | 58.8 (pH = 6) | 52 |
| Multi-walled carbon nanotubes | 13.2 (pH = 8) | 53 | |
| Multi-walled carbon nanotubes | 270 | 25.6 (pH = 7) | 54 |
| Dithizone-immobilized zeolite | 2.6 (pH = 7) | 39 | |
| Bamboo leaf powder | 27.1 (pH = 8) | 55 | |
| Synthetic terpolymer | 53.5 (pH = 4.5) | 56 | |
| Chitosan | 56 (pH = 5) | 57 | |
| Magnetic porous microspheres | 86.4 | 28.3 (pH = 7.4) | 58 |
| Biochar | 4.5 | 8 (pH = 7.7) | 59 |
| Natural pyrite | 20.1 | 80.2 (pH = 8) | 60 |
3.5 Adsorption thermodynamics
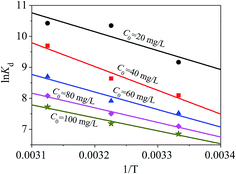
The thermodynamic performance of the magnetic PPy–GO material for mercury(II) adsorption was examined and evaluated via Gibbs free energy (ΔG0), standard entropy [ΔS0 (J mol−1 K−1)] and standard enthalpy [ΔH0 (kJ mol−1)] using eqn (10): | (10) |
The value of ΔG0 can be determined by eqn (11):
ΔG0 = −RT![[thin space (1/6-em)]](https://www.rsc.org/images/entities/char_2009.gif) ln ln![[thin space (1/6-em)]](https://www.rsc.org/images/entities/char_2009.gif) Kd, Kd, | (11) |
The values of ΔG0, ΔS0 and ΔH0 are shown in Fig. 15, and the corresponding data are listed in Table 4. Fig. 15 shows that the adsorption for mercury(II) had an endothermic nature and involved certain chemical reactions because of the large positive ΔH0.46 The adsorption of mercury(II) was influenced by temperature and had randomness on the solid–liquid surface based on positive ΔS0.61
| C 0 (mg L−1) | ΔH0 (kJ mol−1) | ΔS0 (J mol−1 K−1) | ΔG0 (kJ mol−1) | ||
|---|---|---|---|---|---|
| 300 K | 310 K | 320 K | |||
| 20.0 | 50.7 | 246.6 | −22.9 | −26.7 | −27.7 |
| 40.0 | 63.8 | 279.1 | −20.2 | −22.3 | −25.8 |
| 60.0 | 47.1 | 218.9 | −18.8 | −20.4 | −23.2 |
| 80.0 | 39.2 | 189.5 | −17.7 | −19.4 | −21.5 |
| 100.0 | 34.7 | 172.4 | −17.1 | −18.5 | −20.5 |
The negative ΔG0 suggested a feasible and spontaneous adsorption process.46,61 In addition, the decreasing ΔG0 with increasing temperature revealed that mercury(II) adsorption onto magnetic PPy–GO was more advantageous at higher temperature, which was consistent with the data shown in Fig. 13. The small ΔG0 (less than −40 kJ mol−1) indicated that the interaction between adsorbed mercury(II) and the magnetic PPy–GO material involved a strong chemical reaction.46
3.6 Stability of magnetic PPy–GO
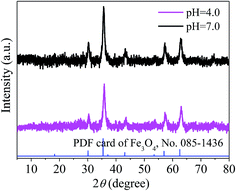
To evaluate the stability of the adsorbent, magnetic PPy–GO was separated after reaction, rinsed three times with 0.5 L ethanol solution (10 vol% HCl acid) and 1 L ultra-pure water, and then dried at 378 K. Adsorbent stability was evaluated at two different reaction conditions (pH = 4.0 and pH = 7.0) based on the regeneration performance. Based on the test data (not shown), the decreases in the adsorption capacities of the magnetic PPy–GO at pH 4.0 and 7.0 were about 15.8% and 13.7% after three cycles and 20.8% and 22.7% after five cycles, respectively.The results indicated that the pH of the solution containing mercury(II) affected the adsorption capacity of the as-prepared adsorbent. This result might be related to the speciation mercury(II) and the charge of the adsorbent at different pH values. The isoelectric point of Fe3O4 is pH = 6.5; thus, Fe3O4 possesses a positive charge at pH ≤ 6.5 and a negative charge at pH ≥ 6.5, similar to the magnetic PPy–GO.
To further investigate the stability of the as-prepared adsorbent, XRD was employed to characterize the magnetic PPy–GO after reaction at pH 4.0 and 7.0. Based on the XRD patterns shown in Fig. 16, there is little difference in peak position before and after use at pH 4.0 and 7.0. These results suggest that the as-prepared magnetic PPy–GO is relatively stable.
3.7 Removal of mercury(II) from real electroplating effluent
Electroplating wastewater is a serious pollutant of the environment and water bodies and contains many types of poisonous and harmful substances, including massive heavy metals in addition to organics. Some heavy metal ions in electroplating wastewater, particularly mercury, chromium, nickel and lead, cause serious harm to the human body and organisms. Conventional methods including chemical precipitation and biological treatment cannot completely remove all these heavy metal ions to meet the Chinese national standard of “Emission Standard of Pollutants for Electroplating” (GB 21900-2008). Therefore, adsorption may represent a more suitable method for the treatment of electroplating wastewater.To investigate the potential for applying the as-prepared magnetic PPy–GO adsorbent in real wastewater treatment, real electroplating wastewater (after pre-treatment) was used as a raw wastewater sample to be treated. The wastewater was obtained from the effluent of a local company, Suzhou Third Electroplating Co., Ltd. The concentrations of mercury(II), chromium(VI), nickel(II), lead(II) and iron(III) were 0.05–0.1, 0.8–1.5, 0.8–2.2, 0.3–0.6 and 2.5–5.0 mg L−1, respectively. The CODcr value of the wastewater was about 50–70 mg L−1. The experiment was carried out three times to obtain an average efficiency under the conditions of RSL = 0.05 g L−1 and pH = 7 ± 0.2.
The results show that the removal efficiency of total mercury reached over 99%, and the removal efficiencies of other the metal ions were over 80%. The effluent quality after adsorption basically met the Chinese national standard with the exception of a slight excess of chromium(VI). The results show that the as-prepared magnetic PPy–GO material is indeed a potential adsorbent and can be used as a base material to adsorb heavy metals.
3.8 Adsorption mechanism
The experimental results indicated that pH had an obvious effect on the removal of mercury(II). In addition, the zeta potentials and FT-IR data showed that oxygen-containing functional groups played a significant role in the removal of mercury(II). The zeta potentials also indicated that the quantity of negative charges possessed by magnetic PPy–GO increased significantly with increasing solution pH, which was beneficial to the adsorption of positively charged mercury(II) via electrostatic attraction.The results of adsorption experiments and Langmuir fitting showed that the magnetic PPy–GO had a high adsorption capacity for mercury(II). The main possible mechanism included the formation of ionic pairs, hydrogen bonding between oxygen-containing functional groups and various mercury species (Hg2+, HgOH+, Hg(OH)3+, HgCl+, HOHgO− and −OHgO−), ion exchange, and electrostatic attraction. Moreover, these above morphologies of mercury had a more favorable size and higher mobility than Hg2+, resulting in a higher adsorption capability for mercury(II).
The possible interactions between the magnetic PPy–GO and various mercury(II) species are formulated as follows:
| R–OH → R–O− + H+ (dissociation and de-protonation, major), | (12) |
| R–COOH → R–COO− + H+ (dissociation and de-protonation, major), | (13) |
| 2R–O− + Hg2+ → R–O–Hg–O–R (ionic-pair formation, more major), | (14) |
| 2R–COO− + Hg2+ → R–COO–Hg–OOC–R (ionic-pair formation, more major), | (15) |
| R–O− + R–COO− + Hg2+ → R–O–Hg–OOC–R (ionic-pair formation, more major), | (16) |
| R–O− + HgOH+ → R–O⋯HgOH (electrostatic attraction, major), | (17) |
| R–COO− + HgOH+ → R–COO⋯HgOH (electrostatic attraction, major), | (18) |
| R–O− + Hg(OH)+3 → R–O⋯Hg(OH)3 (electrostatic attraction, major), | (19) |
| R–COO− + Hg(OH)+3 → R–COO⋯Hg(OH)3 (electrostatic attraction, major), | (20) |
| R–COO− + HgCl+ → R–COO⋯HgCl (electrostatic attraction, major), | (21) |
| R–O− + HgCl+ → R–O⋯HgCl (electrostatic attraction, major), | (22) |
| R–O–H + H–O–Hg–O− → R–O–H⋯O–Hg–OH (hydrogen bond, minor), | (23) |
| 2R–O–H + O−Hg–O− → R–O–H⋯O–Hg–O⋯H–O−R (hydrogen bond, minor), | (24) |
| R–COOH + HO–Hg–O− → R–COO–H⋯O–Hg–OH (hydrogen bond, minor) and | (25) |
| 2R–COOH + O−–Hg–O− → R–COO–H⋯ O–Hg–O⋯H–OOC–R (hydrogen bond, minor), | (26) |
In addition to the above equations, the PPy polymer can also react with various mercury species via electrostatic attraction after dissociation or/and de-protonation as follows:
 | (27) |
 | (28) |
 | (29) |
The above reactions suggest that a large number of OH− radicals can react with H+ resulting from –OH, –COOH or Py polymer under high solution pH, promoting the reaction. Moreover, high solution pH is favorable for the adsorption of cationic mercury(II) with positive charge.
The fitting of kinetics and thermodynamics suggested that mercury(II) removal was favorable, occurred in three stages (an initial stage of exterior surface diffusion or film diffusion, intra-particle diffusion and a plateau stage of equilibrium adsorption), and involved some chemisorption.
In addition, thermodynamic study also showed that the adsorption processes for mercury(II) was endothermic and spontaneous, and there were strong chemical interactions between the adsorbed mercury(II) and the magnetic PPy–GO material.
4. Conclusions
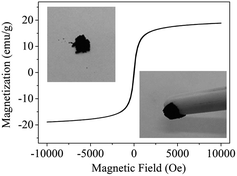
In this work, a Fe3O4 magnetic nanomaterial (PPy–GO) was synthetized and characterized for the removal of mercury(II) ions. XRD, EDX, XPS and the measurement of magnetization properties demonstrated that the Fe3O4 and PPy nanoparticles were successfully combined with GO.Solution pH had a strong influence on the adsorption of mercury(II). When solution pH and RSL were 7 and 0.05 g L−1, respectively, the Langmuir adsorption capacity of the magnetic PPy–GO reached 400.0 mg g−1. The content of Na+ had a weak influence on mercury(II) adsorption. The pseudo-second-order and Langmuir models provided the best fits to the data. The overall adsorption process of mercury(II) onto magnetic PPy–GO involved chemisorption as well as intra-particle diffusion. The thermodynamics indicated that the adsorption of mercury(II) was endothermic and spontaneous.
The application of PPy–GO to the adsorption of heavy metals from real electroplating wastewater indicated that the magnetic PPy–GO material has a high adsorption efficiency. After the adsorption of mercury(II), the magnetic PPy–GO material could be easily separated from aqueous media. These results indicated that the magnetic PPy–GO material is a promising adsorbent for the removal of mercury(II) from aqueous media.
Acknowledgements
This work was sponsored by the National Natural Science Foundation of China (No. 51578354), Natural Science Foundation of Jiangsu Province (No. BK20141179), Six Talent Peaks Program (2016-JNHB-067), Suzhou Science and Technology Bureau (SS201667), Qing Lan Project and Research Innovation Project for College Graduates of Jiangsu Province (SJZZ15_0170, SJZZ16_0248).References
- L. Tran, P. X. Wu, Y. J. Zhu, L. Yang and N. W. Zhu, J. Colloid Interface Sci., 2015, 445, 348 CrossRef CAS PubMed.
- A. A. Ismaiel, M. K. Aroua and R. Yusoff, Chem. Eng. J., 2013, 225, 306 CrossRef.
- S. Siva, S. Sudharsan and R. S. Kannan, RSC Adv., 2015, 5, 79665 RSC.
- M. F. Yardim, T. Budinova, E. Ekinci, N. Petrov, M. Razvigorova and V. Minkova, Chemosphere, 2003, 52, 835 CrossRef CAS.
- O. Hakami, Y. Zhang and C. J. Banks, Water Res., 2012, 46, 3913 CrossRef CAS.
- A. Saria and M. Tuzen, J. Hazard. Mater., 2009, 171, 500 CrossRef.
- D. K. Mondal, B. K. Nandi and M. K. Purkait, J. Environ. Chem. Eng., 2013, 1, 891 CrossRef CAS.
- B. Qiu, H. Gu, X. Yan, J. Guo, Y. Wang, D. Sun, Q. Wang, M. Khan, X. Zhang and B. Weeks, J. Mater. Chem. A, 2014, 2, 17454 RSC.
- X. Peng, W. Zhang, L. Gai, H. Jiang, Y. Wang and L. Zhao, Chem. Eng. J., 2015, 280, 197 CrossRef CAS.
- H. Wang, X. Yuan, G. Zeng, Y. Wu, Y. Liu, Q. Jiang and S. Gu, Adv. Colloid Interface Sci., 2015, 221, 41 CrossRef CAS.
- Z. Wu, X. Yuan, J. Zhang, H. Wang, L. Jiang and G. Zeng, ChemCatChem, 2017, 9, 41 CrossRef CAS.
- S. Yang, L. Li, Z. Pei, C. Li, J. Lv, J. Xie, B. Wen and S. Zhang, Colloids Surf., A, 2014, 457, 100 CrossRef CAS.
- P. Tan, J. Sun, Y. Y. Hu, Z. Fang, Q. Bi, Y. C. Chen and J. H. Cheng, J. Hazard. Mater., 2015, 297, 251 CrossRef CAS PubMed.
- Q. Yan, Z. Zhang, Y. Zhang, A. Umar, Z. Guo, D. O'Hare and Q. Wang, Eur. J. Inorg. Chem., 2015, 2015, 4182 CrossRef CAS.
- Y. Qin, M. Long, B. Tan and B. Zhou, Micro Nano Lett., 2014, 6, 125 CrossRef CAS.
- F. Gao, H. Gu, H. Wang, X. Wang, B. Xiang and Z. Guo, RSC Adv., 2015, 5, 60208 RSC.
- Y. H. Wang, L. L. Li, C. N. Luo, X. J. Wang and H. M. Duan, Int. J. Biol. Macromol., 2016, 86, 505 CrossRef CAS.
- L. M. Cui, X. Y. Guo, Q. Wei, Y. G. Wang, L. Gao, L. G. Yan, T. Yan and B. Du, J. Colloid Interface Sci., 2015, 439, 112 CrossRef CAS.
- Z. Wu, H. Zhong, X. Yuan, H. Wang, L. Wang, X. Chen, G. Zeng and Y. Wu, Water Res., 2014, 67, 330 CrossRef CAS.
- H. Mahmud, A. K. O. Huq and R. B. Yahya, RSC Adv., 2016, 6, 14778 RSC.
- M. Shafiabadi, A. Dashti and H. A. Tayebi, Synth. Met., 2016, 212, 154 CrossRef CAS.
- A. E. Chávez-Guajardo, J. C. Medina-Llamas, L. Maqueira, C. A. S. Andrade, K. G. B. Alves and C. P. de Melo, Chem. Eng. J., 2015, 281, 826 CrossRef.
- N. I. Kovtyukhova, P. J. Ollivier, B. R. Martin, T. E. Mallouk, S. A. Chizhik, E. V. B. And and A. D. Gorchinskiy, Chem. Mater., 1999, 11, 771 CrossRef CAS.
- W. S. Hummers and R. E. Offeman, J. Am. Chem. Soc., 1958, 80, 1339 CrossRef CAS.
- N. H. Mthombeni, S. Mbakop, A. Ochieng and M. S. Onyango, J. Taiwan Inst. Chem. Eng., 2016, 66, 172 CrossRef CAS.
- H. Feng, B. Wang, T. Lin, N. Chen, N. Wang and B. Chen, J. Power Sources, 2014, 246, 621 CrossRef CAS.
- M. Bhaumik, A. Maity, V. V. Srinivasu and M. S. Onyango, J. Hazard. Mater., 2011, 190, 381 CrossRef CAS PubMed.
- R. Karthik and S. Meenakshi, Synth. Met., 2014, 198, 181 CrossRef CAS.
- V. Gari and M. Kim, Monatsh. Chem., 2015, 146, 1445 CrossRef.
- V. Chandra and K. S. Kim, Chem. Commun., 2011, 47, 3942 RSC.
- Y. Wang, Y. Wang, X. Yan, S. Wu, L. Shao, Y. Liu and Z. Guo, Chemosphere, 2016, 153, 485 CrossRef CAS.
- Y. F. Guo, J. Deng, J. Y. Zhu, X. J. Zhou and R. B. Bai, RSC Adv., 2016, 6, 82523 RSC.
- J. W. Zhang, M. S. Azam, C. Shi, J. Huang, B. Bin, Q. X. Liu and H. B. Zeng, RSC Adv., 2015, 5, 32272 RSC.
- W. Hou, X. Yuan, W. Yan, X. Chen, L. Leng, W. Hui, L. Hui and G. Zeng, Chem. Eng. J., 2015, 262, 597 CrossRef.
- M. Zabihi, A. Ahmadpour and A. H. Asl, J. Hazard. Mater., 2009, 167, 230 CrossRef CAS.
- Z. Wang, J. Xu, Y. Hu, H. Zhao, J. Zhou, Y. Liu, Z. Lou and X. Xu, J. Taiwan Inst. Chem. Eng., 2016, 60, 394 CrossRef CAS.
- V. Chandra and K. S. Kim, Chem. Commun., 2011, 47, 3942 RSC.
- J. Zhu, B. Deng, J. Yang and D. Gang, Carbon, 2009, 47, 2014 CrossRef CAS.
- M. Mudasir, K. Karelius, N. H. Aprilita and E. T. Wahyuni, J. Environ. Chem. Eng., 2016, 4, 1839 CrossRef CAS.
- M. Bhaumik, T. Y. Leswifi, A. Maity, V. V. Srinivasu and M. S. Onyango, J. Hazard. Mater., 2011, 186, 150 CrossRef CAS.
- S. Schiewer and M. H. Wong, Chemosphere, 2000, 41, 271 CrossRef CAS.
- K. Z. Setshedi, M. Bhaumik, M. S. Onyango and A. Maity, Chem. Eng. J., 2015, 262, 921 CrossRef CAS.
- C. M. Kede, P. P. Ndibewu, M. M. Kalumba, N. A. Panichev, H. M. Ngomo and J. M. Ketcha, S. Afr. J. Chem., 2015, 68, 226 CAS.
- B. Henriques, G. Goncalves, N. Emami, E. Pereira, M. Vila and P. Marques, J. Hazard. Mater., 2016, 301, 453 CrossRef CAS PubMed.
- X. Peng, W. Zhang, L. Gai, H. Jiang, Y. Wang and L. Zhao, Chem. Eng. J., 2015, 280, 197 CrossRef CAS.
- Y. F. Guo, J. Deng, J. Y. Zhu, C. Zhou, C. Y. Zhou, X. J. Zhou and R. B. Bai, RSC Adv., 2016, 6, 39762 RSC.
- S. B. Wu, L. T. Kong and J. H. Liu, Res. Chem. Intermed., 2016, 42, 4513 CrossRef CAS.
- X. Tao, K. Li, H. Yan, H. Yang and A. M. Li, Environ. Pollut., 2016, 209, 21 CrossRef CAS.
- O. S. Akintola, T. A. Saleh, M. M. Khaled and O. C. S. Al Hamouz, J. Taiwan Inst. Chem. Eng., 2016, 60, 602 CrossRef CAS.
- Y. F. Guo, Z. Wang, X. J. Zhou and R. B. Bai, Res. Chem. Intermed., 2016, 10, 1 CAS.
- S. Nasirimoghaddam, S. Zeinali and S. Sabbaghi, J. Ind. Eng. Chem., 2015, 27, 79 CrossRef CAS.
- H. K. Moghaddam and M. Pakizeh, J. Ind. Eng. Chem., 2015, 21, 221 CrossRef CAS.
- B. Tawabini, S. Al-Khaldi, M. Atieh and M. Khaled, Water Sci. Technol., 2010, 61, 591 CrossRef CAS PubMed.
- K. Yaghmaeian, R. K. Mashizi, S. Nasseri, A. H. Mahvi, M. Alimohammadi and S. Nazmara, J. Environ. Health Sci. Eng., 2015, 13, 9 CrossRef.
- D. K. Mondal, B. K. Nandi and M. K. Purkait, J. Environ. Chem. Eng., 2013, 1, 891 CrossRef CAS.
- V. Sangu, K. Kannan and K. Srinivasan, Indian J. Chem. Technol., 2015, 22, 219 Search PubMed.
- T. Takimoto, H. Tsue, R. Tamura and H. Sasaki, Heterocycles, 2015, 90, 842 CrossRef CAS.
- F. H. Wang, W. Jiang, Y. Fang and C. W. Cheng, Chem. Eng. J., 2015, 259, 827 CrossRef CAS.
- J. C. Tang, H. H. Lv, Y. Y. Gong and Y. Huang, Bioresour. Technol., 2015, 196, 355 CrossRef CAS.
- Y. H. Duan, D. S. Han, B. Batchelor and A. Abdel-Wahab, Colloids Surf., A, 2016, 490, 326 CrossRef CAS.
- Q. D. Qin, J. Ma and K. Liu, J. Hazard. Mater., 2009, 162, 133 CrossRef CAS.
| This journal is © The Royal Society of Chemistry 2017 |

