
Analytical methodology for the simultaneous determination of NMG-Sb(V), iSb(V), and iSb(III) species by anion exchange liquid chromatography in Glucantime® and its biological application in Wistar rat urine†
Nicole
Roldán
 abd,
Danitza
Pizarro
a,
Frederic
Frezard
c,
Manuel
Bravo
a,
Marcelo
Verdugo
d,
Noriyuki
Suzuki
d,
Yasumitsu
Ogra
d and
Waldo
Quiroz
*a
abd,
Danitza
Pizarro
a,
Frederic
Frezard
c,
Manuel
Bravo
a,
Marcelo
Verdugo
d,
Noriyuki
Suzuki
d,
Yasumitsu
Ogra
d and
Waldo
Quiroz
*a
aLaboratorio de Química Analítica y Ambiental, Instituto de Química, Pontificia Universidad Católica de Valparaíso, Avenida Universidad 330, Valparaíso, Chile. E-mail: waldo.quiroz@pucv.cl; Tel: +56 32 22744925
bLaboratorio de Química Biológica, Instituto de Química, Pontificia Universidad Católica de Valparaíso, Chile
cDepartment of Physiology and Biophysics, Institute of Biological Sciences – Federal University of Minas Gerais (UFMG), Av. Antônio Carlos 6627, Belo Horizonte 31270-901, MG, Brazil
dLaboratory of Toxicology and Environmental Health, Graduate School of Pharmaceutical Sciences, Chiba University, Japan
First published on 16th November 2018
Abstract
Several methodologies have been studied to determine the species of antimony (Sb) present in Glucantime®. However, these techniques have certain disadvantages, such as a low resolution between N-methylglucamine (NMG-Sb(V)) and inorganic pentavalent Sb (iSb(V)). Furthermore, there is a problem regarding the stability of inorganic trivalent Sb (iSb(III)) during sample treatment. The main aim of this work was to develop an analytical methodology for the separation of the Sb species of NMG-Sb(V), iSb(V), and iSb(III) in Glucantime®. To achieve this, a methodology was developed based on anion exchange high performance liquid chromatography hydride generation atomic fluorescence (HPLC-HG-AFS) in gradient elution mode with different concentrations of Na2H2EDTA as the mobile phase. The results show that 0.473 mM Na2H2EDTA should be used for 1.20 min as the first mobile phase for the separation of NMG-Sb(V), which should then be changed to 20 mM for the elution of the inorganic species. The results also reveal that the iSb(III) content may be underestimated when sample filtration is used prior to the separation step. Instead of filtration, this study demonstrates that adjustment to pH 9 and dilution with deionized water are a better strategy to determine the iSb(III) content. This method proves to be reproducible for application in urine samples from rats injected intraperitoneally with NMG-Sb(V).
Introduction
Glucantime® is a medicine used to treat leishmaniasis, which is a parasitic disease that affects 12 million people worldwide with a mortality rate of approximately 50![[thin space (1/6-em)]](https://www.rsc.org/images/entities/char_2009.gif) 000 people.1,2 Glucantime® and Pentostam® are the most commonly used medicines against leishmaniasis, which have meglumine antimoniate (MA) and sodium stibogluconate (SSG) as active compounds, respectively.3–5 Both drugs contain iSb(V), and Glucantime® contains an organic Sb(V) complex with N-methylglucamine (NMG).6
000 people.1,2 Glucantime® and Pentostam® are the most commonly used medicines against leishmaniasis, which have meglumine antimoniate (MA) and sodium stibogluconate (SSG) as active compounds, respectively.3–5 Both drugs contain iSb(V), and Glucantime® contains an organic Sb(V) complex with N-methylglucamine (NMG).6
The final compositions of MA and SSG solutions could not be determined until Frezard et al. found out how to identify them through an electrospray mass spectrometry (ESI-MS) analysis. Pentavalent drugs are composed of ionic compounds, and in the case of MA solutions, the anionic species were determined as [(NMG-4H)SbV(OH)3]− and [(2NMG-5H)(SbV)2(OH)8]− 2H2O, while [(2NMG-5H)SbV(OH)]+ and [(3NMG-8H)(SbV)2(OH)4]+ were determined as the cationic species. The antimonial structure and the charge of these species depend on the pH and concentration.4
Antimony speciation is important since the toxicity of this element depends on its chemical structure. Sb2O3 is classified as 2B in the IARC classification, whereas the pentavalent compounds Sb2O5 and SbCl5 are not.7 From a toxicological perspective, it is important to develop analytical methods for the determination of Sb species in samples such as antimonial drugs and urine. The urinary tract is a pathway that has already been described for Sb excretion in humans after the administration of leishmaniasis drug.8,9 It has been reported that iSb(V) is capable of transforming into iSb(III) due to its redox potential in acidic environments10,11 and red blood cells,12 and this transformation is harmful to humans.
Most analytical methods for the determination of Sb species have been performed by ion exchange chromatography. Among the most widely used analytical methods for the separation and detection of iSb(V) and iSb(III) are liquid chromatography coupled to detectors such as ICP-MS and AFS.13–15 To date, these analytical methods have mostly been applied to samples from terrestrial ecosystems such as water, sediments, and soil.16–18 Analytical methodologies have been proposed to determine Sb species in urine from patients treated with Glucantime® or Pentostam®. However, some analytical problems have arisen, such as a lack of sensitivity, dead-time elution, and low chromatographic resolution. In addition, the absence of certified reference materials for Sb species in biological samples makes it difficult to estimate the accuracy of the proposed methods.19
Two chromatographic methods have been reported for the determination of Sb species in biological fluids or leishmaniasis drugs.20,21 Miekeley and colleagues carried out the first study in 2002 using anion exchange chromatography (PRP-X100 Hamilton, 150 mm × 4.1 mm id, Hamilton, USA) for the separation and detection of iSb(V), iSb(III), and NMG-Sb(V), which was coupled to ICP-MS. Disodium dihydrogen ethylene diamine tetraacetate salt dihydrate (Na2H2EDTA) was used as the mobile phase (2 mM at pH 4.7).20 The recovery rates obtained for the trivalent species were 64–113% in urine and 88–96% in plasma. The iSb(V) recovery rates were 72–117% in urine and 92–108% in plasma, which indicates that the method is reliable.
However, it is important to emphasize that this recovery study was carried out with inorganic species, and there has been no recovery study on organic species. The separation of NMG-Sb(V) and iSb(V) also had low resolution, which hampers the quantification of iSb(V). This co-elution can be explained by considering that the molecular ion of the drug (NMG-Sb(V)) could be a cation in solution and elutes before Sb(V), which is a single-charge anion (Sb(OH)6−). In urine, the results showed a metabolic bioreduction of iSb(V) to iSb(III) within the organism, which may explain the observed toxicity in patients treated with these drugs. However, studies to uncover the toxicity mechanisms associated with this species in organisms are still lacking.22
Seby et al.21 studied the differences in the levels of iSb(III) found in Glucantime®. The reported iSb(III) levels in Glucantime® were 0.2–15.5 mg mL−1.21 This divergence was associated with either artefact formation during the sample treatment or a hypothetical instrumental bias generated from methods with low selectivity, such as electrochemical methods.23–25 To determine the total Sb(V) content (iSb(V) + Sb(V)-NMG), the authors proposed breaking the Sb(V)-NMG complex by using HCl at different concentrations (0.1–5 M). They also studied the stability of iSb(III) and iSb(V) in 5 M HCl. The interconversion of iSb(V) to iSb(III)generated an overestimation of Sb(III), which can be attributed to the reducing capacity of HCl.21
As demonstrated, there is scarce information about the distribution and transformation of Sb compounds in both biological fluids and Sb(V) drugs, mainly because there are no reliable analytical methods, and many analytical figures of merit still remain unsatisfactory. Considering urine is the main route of excretion of Sb in treated patients and the many unsatisfactory analytical figures of merit, the main aim of this work is to develop an analytical method for the simultaneous determination of iSb(III), iSb(V), and NMG-Sb(V) species in urine and Glucantime®.
Experimental section
Reagents and standards
Solutions were prepared in high-purity water (18 MΩ) from a Nanopure system (Barnstead, Dubuque, IA, USA), and the chemical reagents were of high analytical grade. The glassware was cleaned with deionized water, soaked overnight in 10% (v/v) HNO3, and rinsed with deionized water before use. Standard solutions of iSb(V) and iSb(III) for chromatography were prepared by dissolving the solid in deionized water daily and stored in a plastic bottle at 4 °C until use. These solutions were prepared from potassium hexahydroxo-antimonate (KSb(OH)6) (Aldrich, 99.95% purity) and potassium antimonyl tartrate K(SbO)C4H4O6H2O (Aldrich, 99.95% purity), respectively.Glucantime® and MA were obtained from Sanofi (São Paulo, Brazil) and donated by Frederic Frezard for the development of the analytical method. For biological application in rats, MA was prepared according to the method reported by Demicheli et al. and was characterized by NMR-H, ESI-MS(+).26 This method was used to analyze the purity (86 and 14% for NMG-Sb(V) and iSb(V), respectively; ESI Fig. 1†).
Due to the high concentration of the Sb species present in Glucantime®, the spike and recovery studies had to be carried out with high concentration standards. For this reason, the concentrated standards of NMG, iSb(V) and iSb(III) were prepared by adding appropriate solutes to 10 mL of deionized water at 40 °C under constant stirring. Afterwards, NMG, iSb(V) and iSb(III) standards were stored in a plastic container at 4 °C until use. Final injection solutions were all adjusted to pH = 9. It is important to mention that the concentrated standards remained stable and no significant transformations were detected which was daily checked following the chromatographic peaks of each species.
Both mobile phases (0.473 and 20 mmol L−1 Na2H2EDTA) were prepared in the same manner. The mobile phases were prepared the day before and sonicated for 40 minutes at 25 °C. Both solutions were prepared by dissolving Na2H2EDTA·2H2O, (p.a. Merck) in high-purity water. Hydride generation solutions were prepared according to the method reported by De Gregori et al. Briefly, a carrier solution (3 mol L−1 HCl) was prepared from concentrated hydrochloric acid (Merck). NaBH4 solutions (3%, m/v) were prepared daily by dissolving an appropriate amount of NaBH4 (analytical-reagent grade, Merck) in 0.4% (m/v) NaOH solution (Merck).27
Instrumental conditions
Anion exchange HPLC was used for the separation and detection of Sb species based on previous work.13 HPLC was coupled with an ICP-MS detector (Agilent Series 7700) for the determination of Sb species in urine, while HG-AFS was used as a detector system for Glucantime®. The chromatography and detection conditions are summarized in Table 1.| HPLC | |
|---|---|
| For HG-AFS detection HPLC Jasco Easton, MD, USA PU-2089 S plus model | |
| For ICP-MS detection HPLC Prominence, Shimadzu, Kyoto, Japan | |
| Column | Hamilton PRP-X100 (100 × 4.6 mm id, particle size 5 (μm) |
| Mobile phases | First mobile phases: 0.473 mmol L−1 EDTA |
| Second mobile phases: 20 mmol L−1 EDTA | |
| Flow rate (mL min−1) | First 0.865 with first mobile phases and then 1.0 with second mobile phase |
| Injection volume | 100 μL |
Sample treatment
Animal experiments
All animal experiments were conducted according to the Principles of Laboratory Animal Care (NIH version, revised 1996) and the Guidelines of the Animal Investigation Committee, Chiba University, Japan (28–60, 28/01/2016). Specific-pathogen-free (SPF) male Wistar rats (5 weeks of age) were purchased from Japan SLC (Shizuoka, Japan) and were housed in a humidity-controlled room maintained at 25 ± 2 °C with a 12 h light–dark cycle. The rats were fed a commercial diet (MF, Oriental Yeast Co., Ltd., Tokyo, Japan) and tap water ad libitum. Three rats received a daily intraperitoneal injection of NMG-Sb(V) at a dose equivalent to 20 mg kg−1 body weight of total Sb for 5 days. Urine samples were collected once a day from a metabolic cage and cover device where the biological fluid is transferred and accumulated for 24 hours in a falcon tube. For the determination of Sb species in rat urine, 2 μL of the collected urine was diluted with 1 mL of deionized water before injection into HPLC coupled with ICP-MS (HPLC-ICP-MS). The column was eluted under the same conditions described above. The eluate was introduced directly into the nebulizer tube of the ICP-MS. 121Sb and 123Sb isotope signals were always recorded. However, considering sensitivity, all figures of merit and quantifications were evaluated following the Sb peak at 121 m/z. Neither the mobile phase nor the urine matrix caused significant problems in the performance of the speciation method using a HPLC-ICP-MS hyphenated system.Results and discussion
Chromatographic study
This study primarily focused on the separation and detection of NMG-Sb(V) according to the work scheme presented in Fig. 1. Our group reported the elution and detection of iSb(V) and iSb(III) by anion exchange chromatography and detection by atomic fluorescence in previous studies.12,13,16,17 In the first stage, the stibine generation of the compound NMG-Sb(V) was evaluated and compared with the iSb(V) signal, which our group has reported previously (ESI Fig. 2†).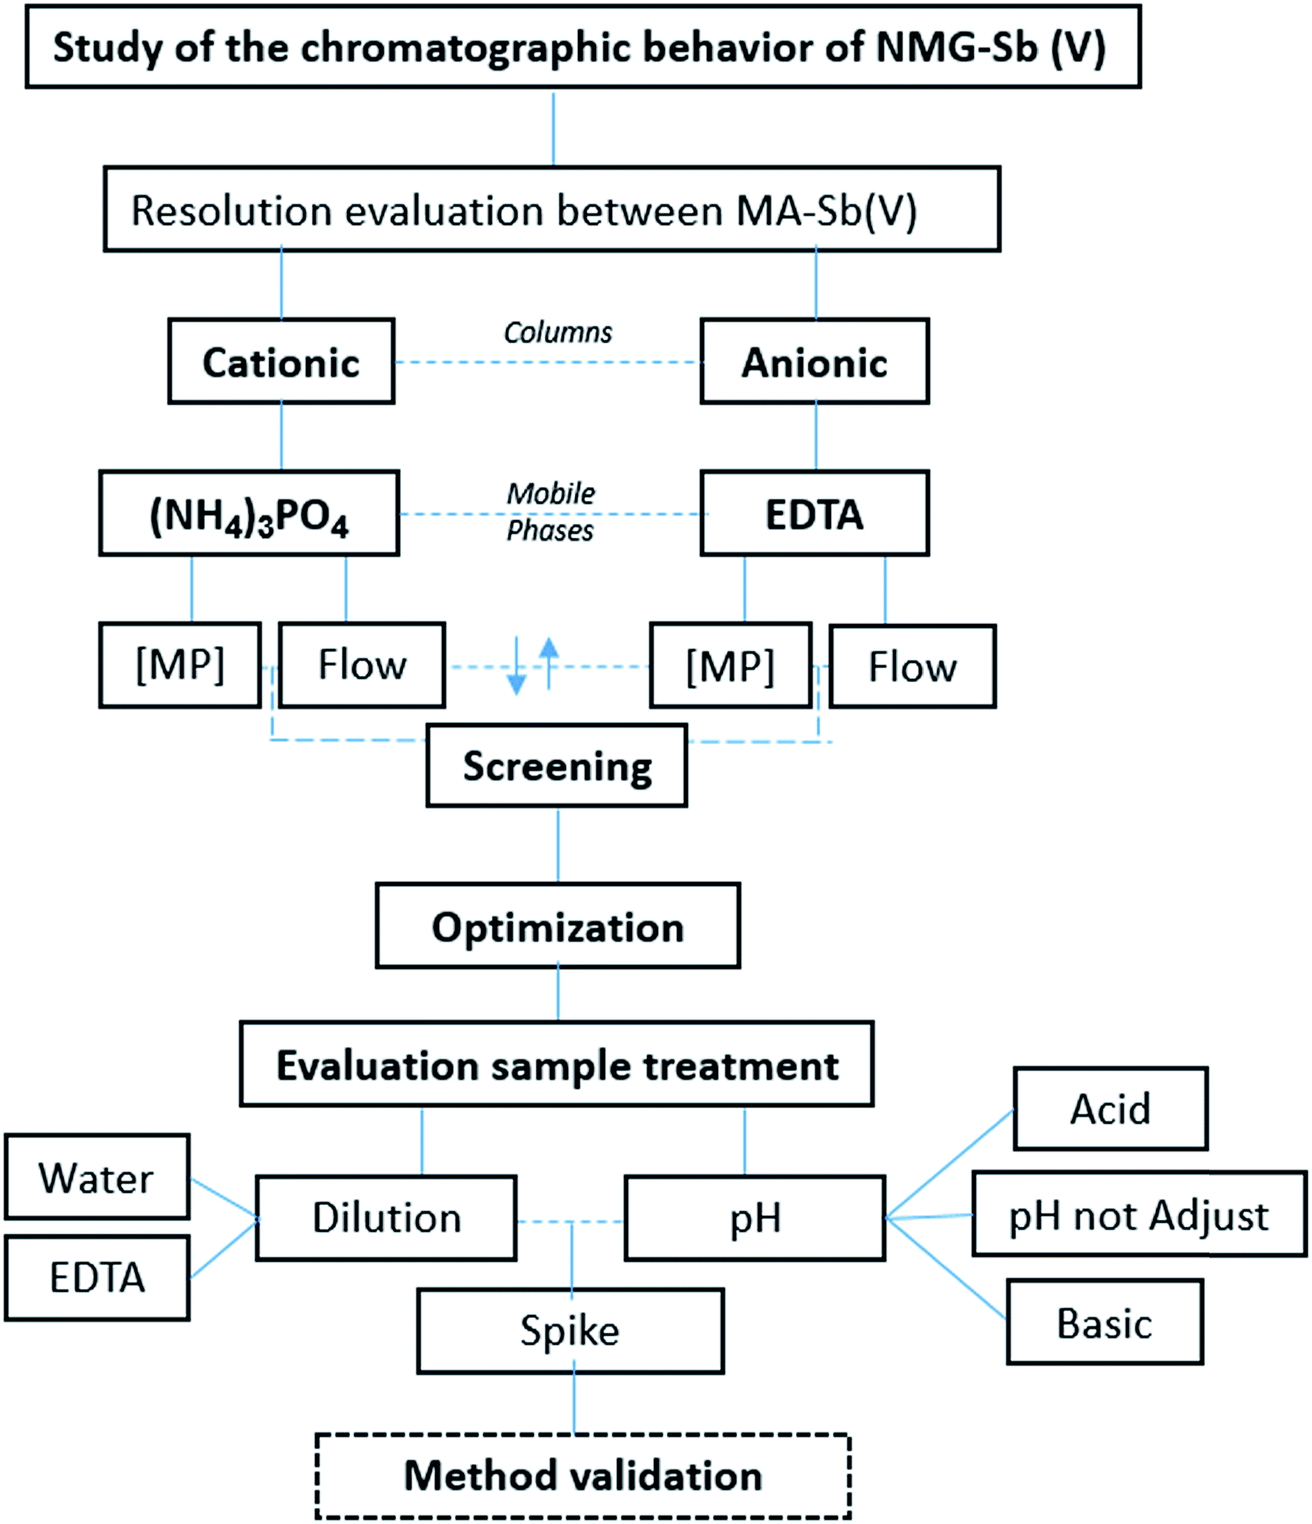 | ||
| Fig. 1 ummary of the developed analytical method. | ||
First, we tested the chromatographic behavior of the Sb species on a PRP-X200 column (250 mm × 4.1 mm) with a single mobile phase of 25 mM (NH4)2HPO4 and flows of 0.5 and 1.0 mL min−1. After that, 0.5 and 1 mL of the same mobile phase (50 mM) were used. The generation of the NMG-Sb(V) signal without the column was previously evaluated with an HG-AFS system, which generated a high and stable signal. It is necessary to consider that this column is a cation exchange column, which could provide good results for NMG-Sb(V). It has already been demonstrated that this compound can exist in solution as a neutral or cationic species, depending on the formation of the complex.28
We expected to observe an inversion in the order of elution of iSb(V) and NMG-Sb(V) given the nature of iSb(V), which is an anion in solution with lower affinity to the column than the neutral or positive charge of NMG-Sb(V) in solution. The results showed that Sb(V) does not elute with an (NH4)2HPO4 concentration of 25 mM at 0.5 and 1.0 mL min−1, so the concentration of the mobile phase was increased to 50 mM to accelerate the elution of iSb(V). As can be seen in Fig. 2, at an ammonium phosphate concentration of 50 mM, iSb(V) and NMG-Sb(V) elute at approximately the same time in different flows. Therefore, the option of separating the analytes under these conditions was discarded.
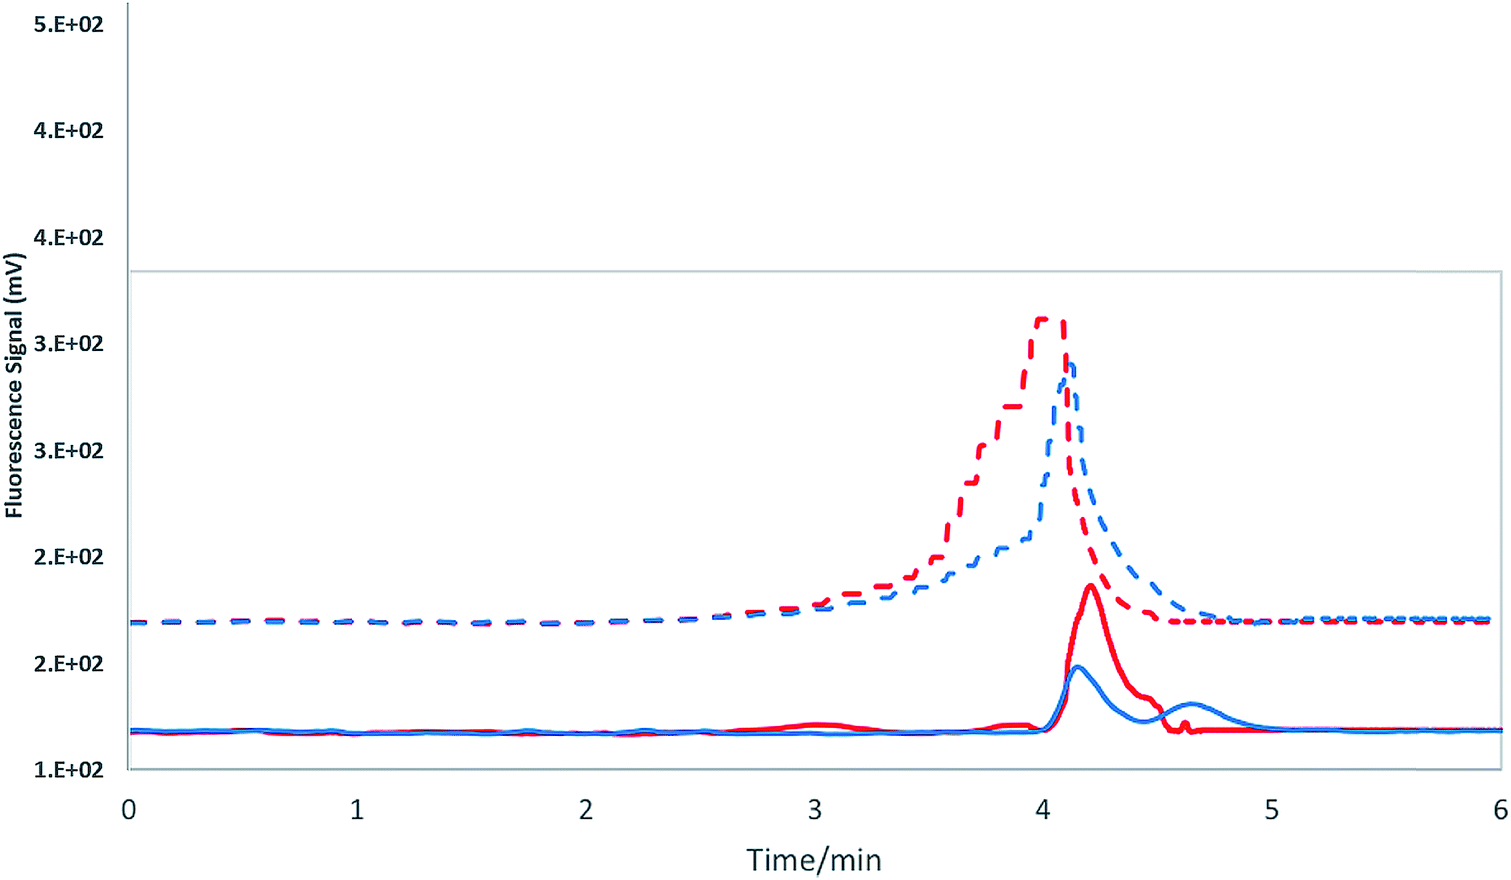 | ||
| Fig. 2 HPLC-HG-AFS. Cationic exchange column: PRP-X200. Mobile phase: 50 mM ammonium phosphate. Continuous line – flow: 0.5 mL min−1, red: iSb(V) and blue: NMG-Sb(V). Segmented line – flow: 1.0 mL min−1, red: iSb(V) and blue: NMG-Sb(V). | ||
The second approach was to study the chromatographic behavior of NMG-Sb(V) by HPLC-HG-AFS in anion exchange mode. This was performed using a 5 cm PRP-X100 column (Hamilton PRP-X100, 100 × 4.1 mm and 5 μm in diameter) with a mobile phase of 20 mM Na2H2EDTA (pH measured: 4.3–4.5) at a flow of 1.0 mL min−1. The analysis was performed under previously published chromatographic conditions.12 The results in Fig. 3 show that more than one chromatographic peak was observed at different sample pH values in some cases, which could be due to the partial dissociation of the NMG-Sb(V) complex into iSb(V).
 | ||
| Fig. 3 HPLC-HG-AFS. Anion exchange column: PRP-X100. Mobile phase: EDTA, 2 mM. (A) 5 cm column. (B) 10 cm column. | ||
When using 2 mM Na2H2EDTA at a flow of 1 mL min−1, the separation of the analytes is not satisfactory at any of the sample pH values studied, as shown in Fig. 3A.20 To improve the resolution, the same type of column but with a greater length of 10 cm was used to increase the theoretical plate number, and the concentration of Na2H2EDTA was decreased to 1 mM. The results are shown in Fig. 3B. The results clearly show that the best conditions were 2 mM Na2H2EDTA and the longer column, which made it possible to observe the separation of the analytes at different pH. Thus, we conducted the screening and optimization under these conditions.
Screening and optimization
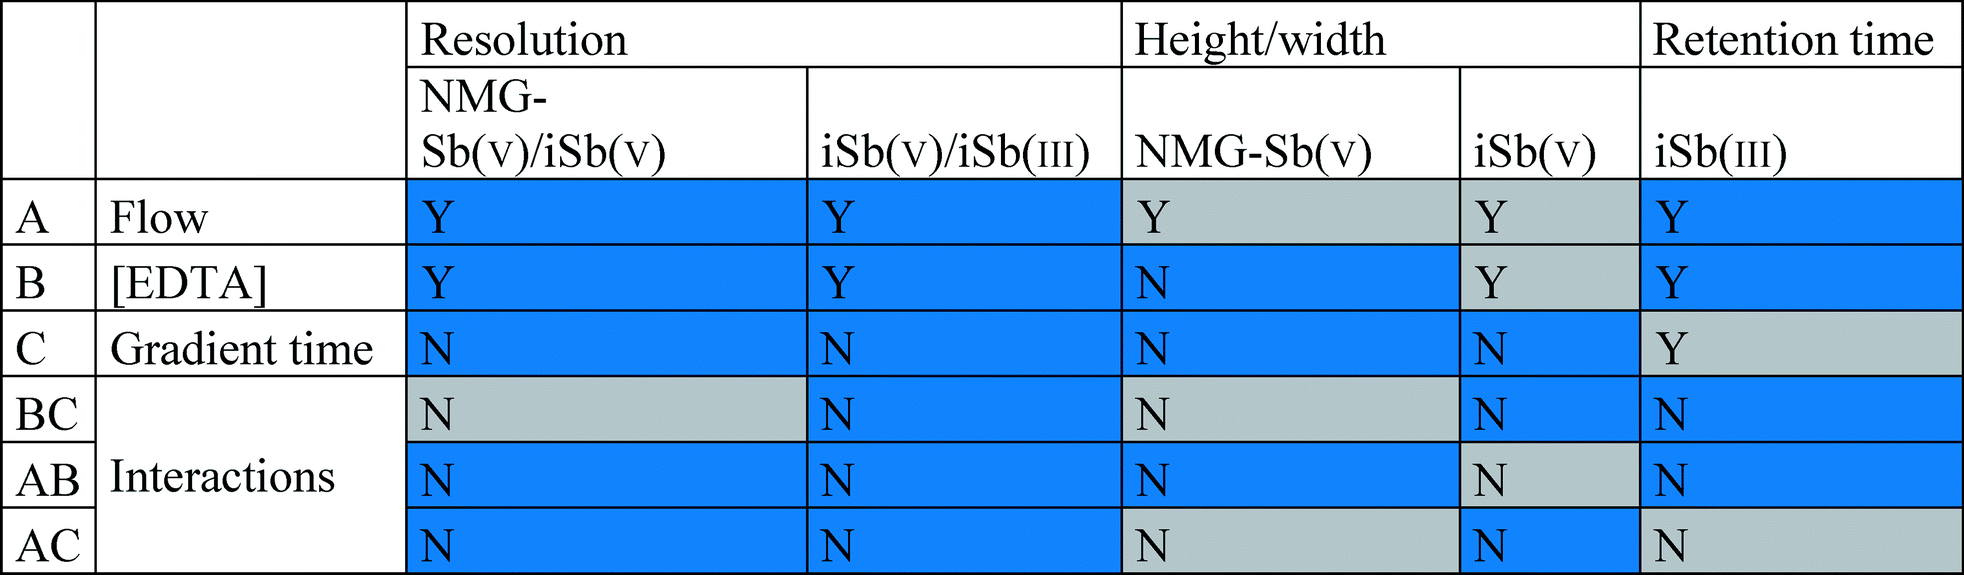
A 23 fractional factorial design was carried out using Statgraphics®, in which the coded variables were the mobile phase flow (0.50–1.00 mL min−1), mobile phase concentration (1–5 mM Na2H2EDTA), and gradient time (2–3.4 min). The responses were the retention time of NMG-Sb(V) and Sb(V), resolution, and height/width ratio of the analytes (Table 2). The screening indicated that the flow and concentration of the mobile phase were significant variables, but not the gradient time (Table 3; the Pareto diagrams are provided in the ESI†). Therefore, the gradient time variable was eliminated from the optimization process.| Codified variables | Levels | ||||
|---|---|---|---|---|---|
| (−)α | −1 | 0 | 1 | (+)α | |
| Screening | |||||
| Flow (mL min−1) (X1) | 0.50 | 0.75 | 1.0 | ||
| EDTA concentration (mM) (X2) | 1.0 | 3.0 | 5.0 | ||
| First step gradient time (min) (X3) | 2.0 | 2.7 | 3.4 | ||
|
|||||
| Optimization | |||||
| Flow (mL min−1) (X1) | 0.32 | 0.45 | 0.75 | 1.10 | 1.23 |
| EDTA concentration (mM) (X2) | 0.17 | 1.00 | 3.00 | 5.00 | 5.83 |
| a Blue = negative effect and gray = positive effect. Y = statistical significance and N = no statistical significance. |
|---|
|
In order to optimize the chromatographic conditions, it was established that the flow should be evaluated in the range of 0.32–1.1 mL min−1, while the mobile phase concentration should be evaluated between 0.17 and 5.00 mM Na2H2EDTA (ESI Table 1†). The method was then optimized with the following characteristics: central composition (2 central points) where the codifiable variables were the mobile phase, flow, concentration, retention-time responses of the analyte, resolution, and width/height ratio. This step consisted of 60 experiments, which were carried out for 3 consecutive days (given that each analysis lasted 14 minutes in total).
A sensitivity check was always performed during the experiments every day. The optimization shows that the best resolution conditions and width/height ratio for NMG-Sb(V)/Sb(V) were a flow of 0.865 mL min−1 with 0.473 mM Na2H2EDTA (ESI Fig. 3†) until the elution of the first analyte (1.20 min), and then the mobile phase should be changed to 20 mM Na2H2EDTA for the elution of iSb(V) and iSb(III) with a flow of 1.0 mL min−1 according to a method used by Quiroz et al. (Fig. 4).13 The chromatogram obtained under the optimum conditions is shown in Fig. 5.
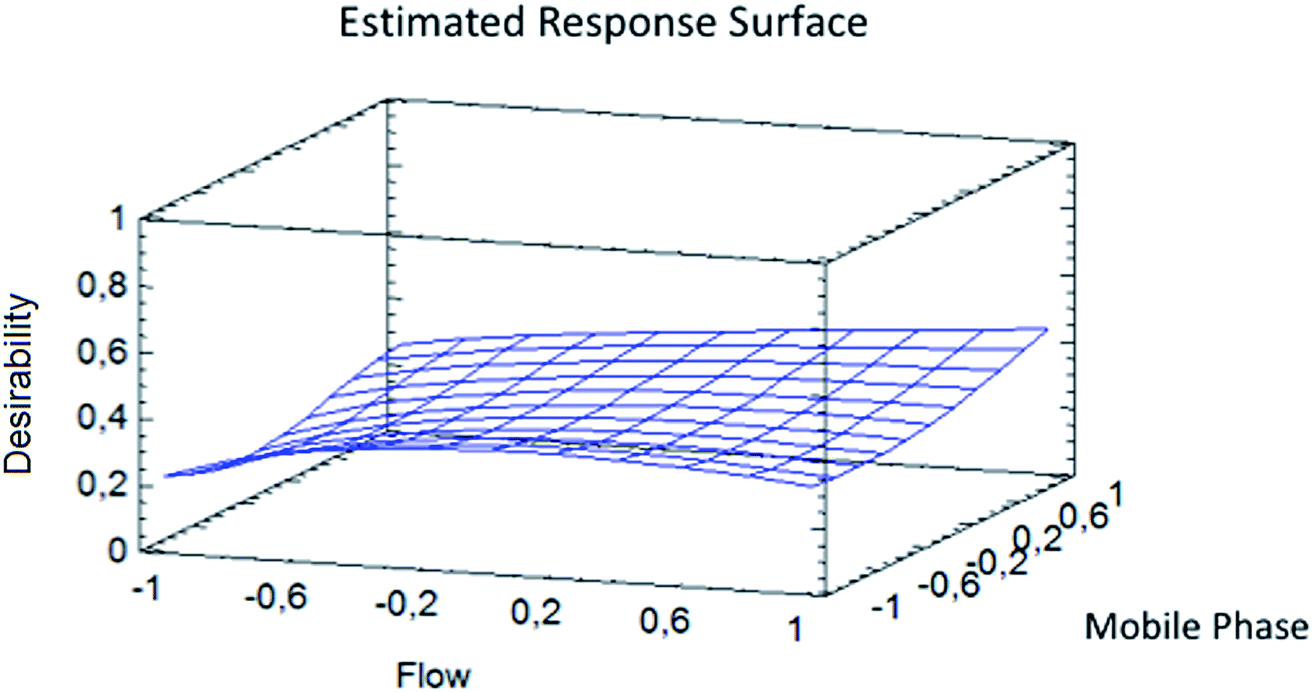 | ||
| Fig. 4 Response surface for the optimization of the width/height of Sb(V) and NMG-Sb(V) and resolution of Sb(V)/NMG-Sb(V). | ||
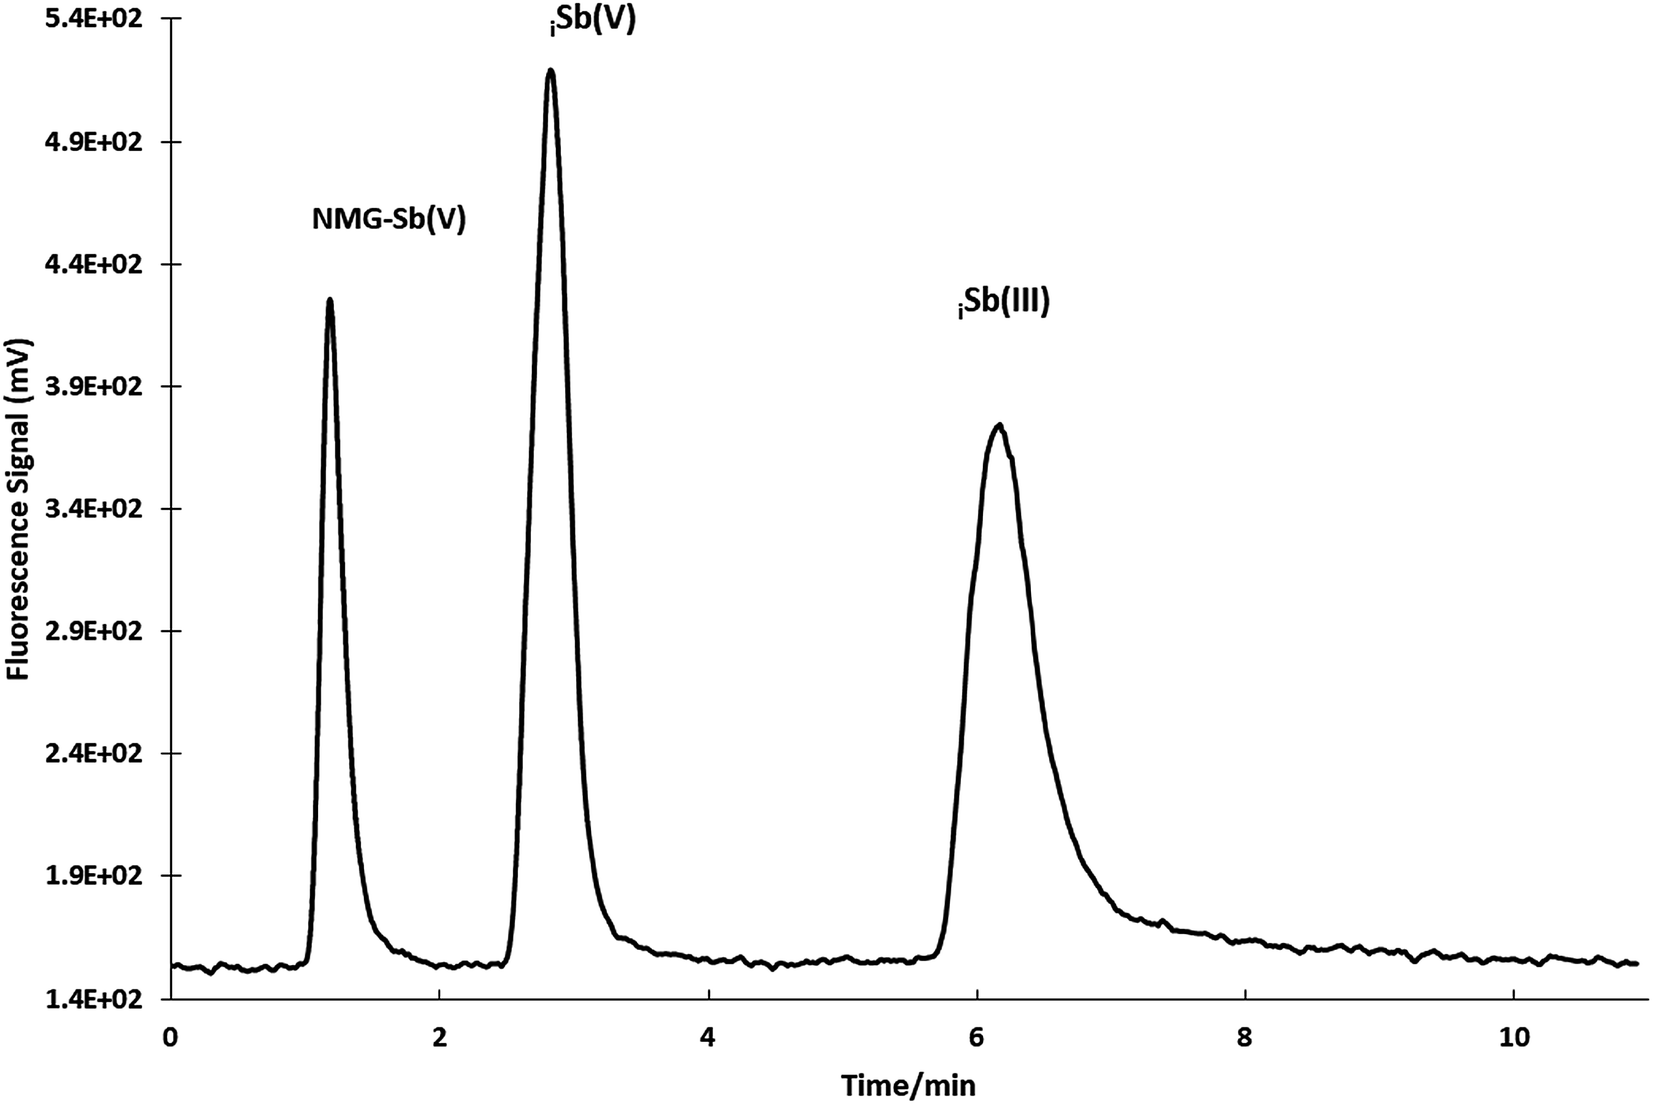 | ||
| Fig. 5 Separation of NMG-Sb(V), iSb(V) and iSb(III) by HPLC-HG-AFS under optimized conditions (50 μg L−1 concentration of each species and 100 μL loop). | ||
Sample treatment
 | ||
| Fig. 6 Separation of NMG-Sb(V), iSb(V) and iSb(III) in Glucantime® by HPLC-HG-AFS: (A) diluted with water at pH 2, neutral pH and pH 9. (B) Diluted with EDTA at pH 2, neutral pH and pH 9 (50 μg L−1 concentration of each species and 100 μL loop). | ||
Only 2 peaks are observed at pH 2 in water and Na2H2EDTA: one representing the co-elution of MA and iSb(V) and a second peak representing iSb(III), as shown in Fig. 6. Due to this resolution problem, this condition was discarded for the sample treatment. NMG-Sb(V) is believed to be hydrolyzed at acidic pH and separated from its iSb(V) component. Seby et al. made a similar observation in 2012. All of the above results in an increase in the iSb(V) signal. In addition, the iSb(III) peak increases considerably, which may be explained by the partial reduction of iSb(V) to iSb(III).21
At neutral pH and pH 9, the peaks of NMG-Sb(V)/Sb(V) were well resolved. In addition, at pH 9, the peaks became higher, and similar results were obtained in water or Na2H2EDTA. For simplicity of the sample preparation, calibration solutions and samples were prepared using water at neutral pH.
Filtering step and Sb(III) stability
The Glucantime® matrix causes a change in the retention times of iSb(III). For this reason, the identity was established using the retention time obtained by adding the synthetic standards to the drug matrix. Published sample-treatment protocols use sample filtration before the HPLC separation step.20,21 The need for filtration in this type of analysis is obvious for the separation of particulate materials. However, in the case of iSb(III), this stage must be applied with a criterion since it is known that the molar solubility of iSb(III) is very low. There is also a possibility that some Sb species form solid compounds with excipients of Glucantime® and would hypothetically be retained in the filter. If this occurs, the quantification of these Sb species could be underestimated.Therefore, we evaluated the filtering stage while considering that the dilution of the sample could cause solubilization of eventual insoluble particles. Diluted samples were thus injected without filtering to evaluate this option. As shown in Fig. 7, there were 2 peaks corresponding to NMG-Sb(V) and iSb(V) for the filtered sample. For the unfiltered sample, there was a third peak corresponding to iSb(III). The results support our hypothesis and show that the drug contains iSb(III), which is lost during the filtering process.
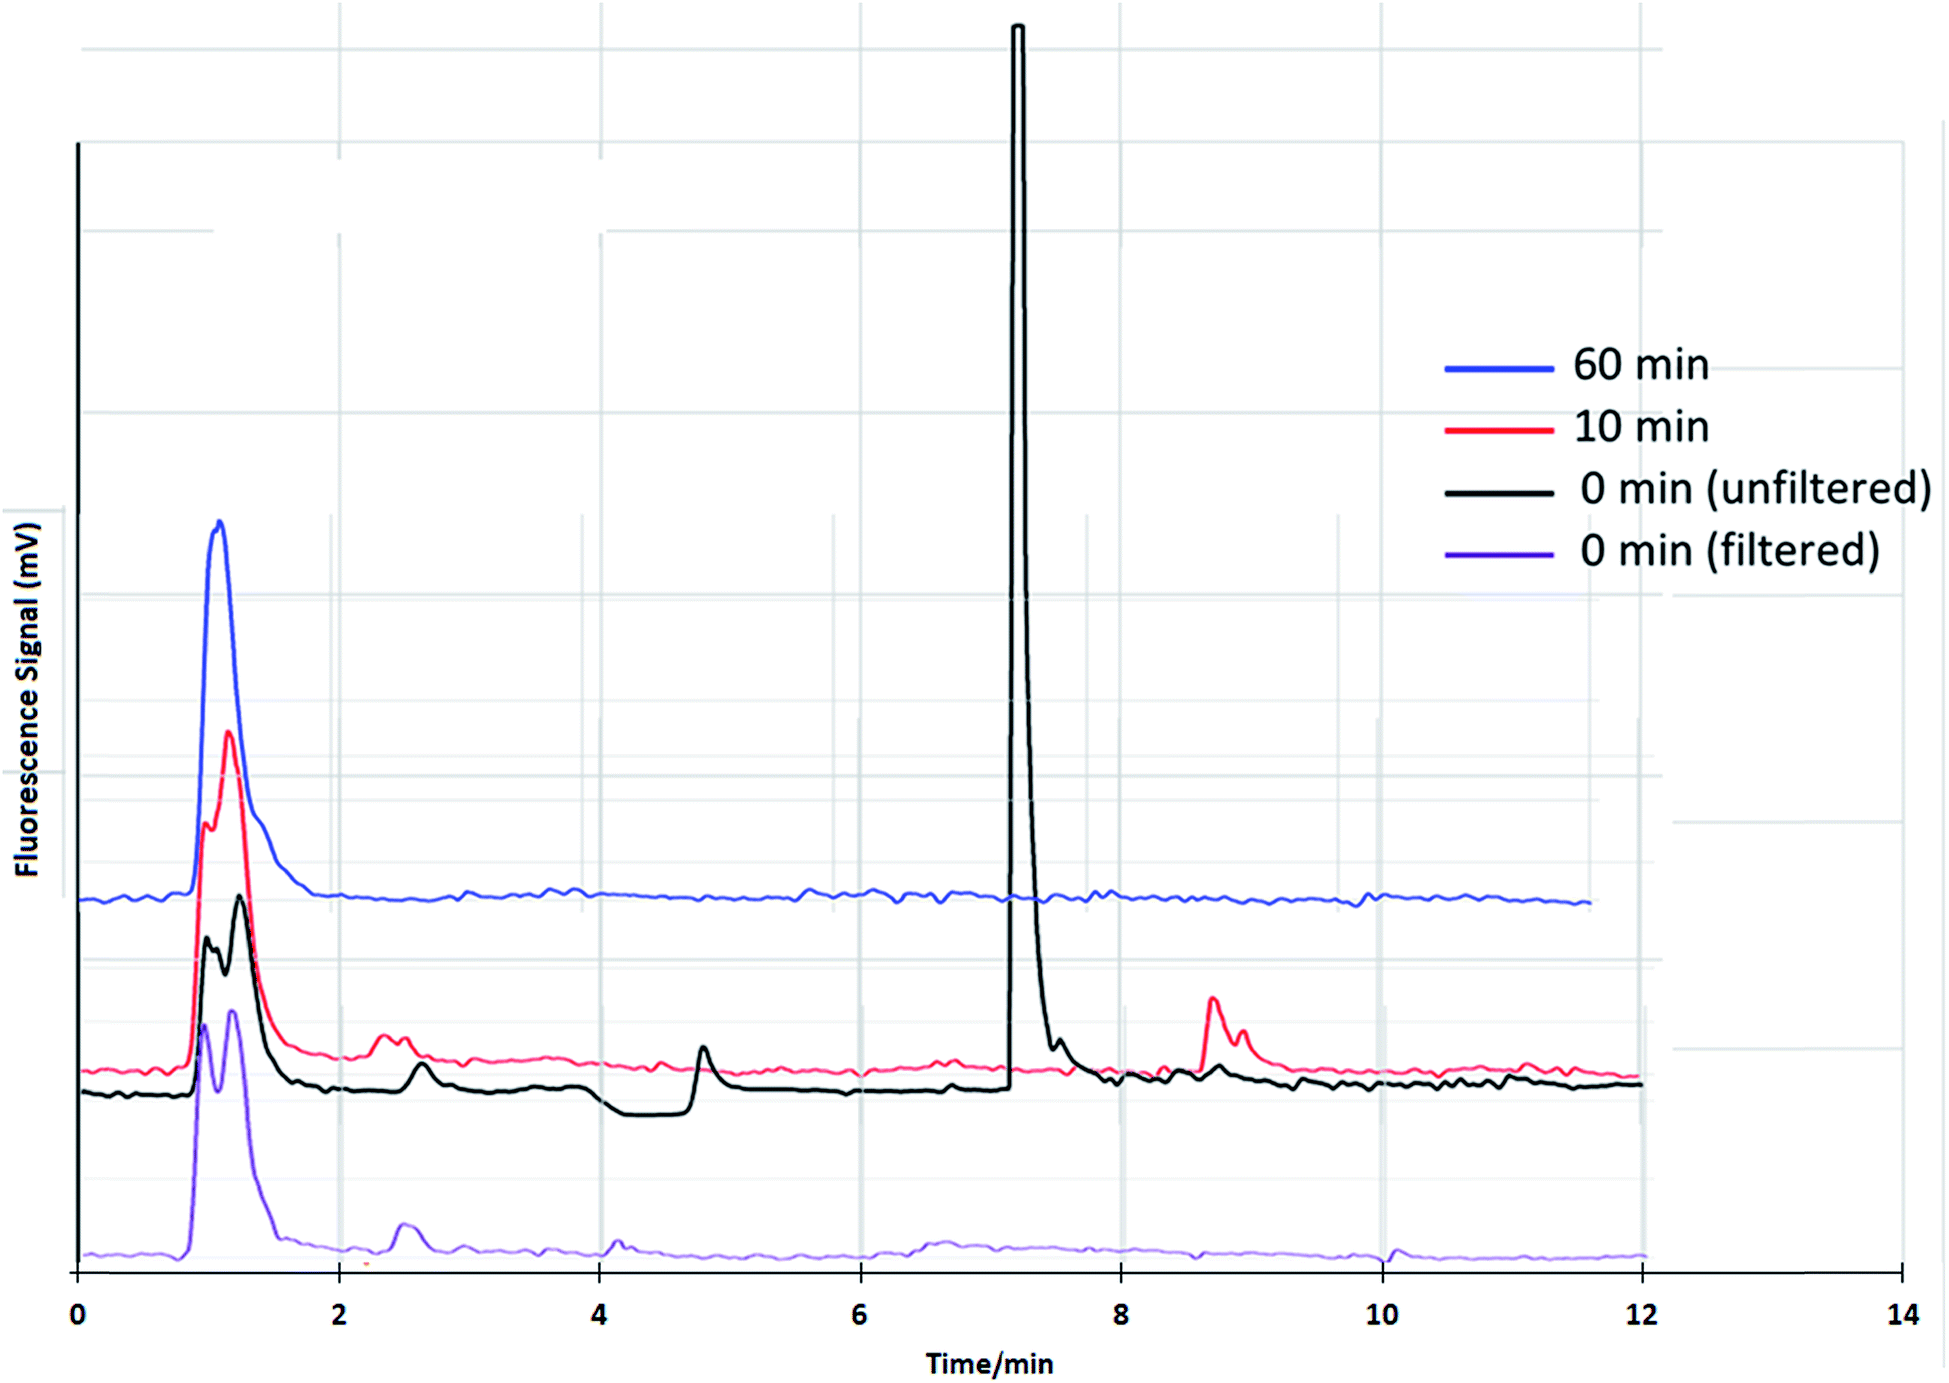 | ||
| Fig. 7 Chromatograms of Glucantime® by HPLC-HG-AFS prepared by dilution with water at pH 9, filtered and unfiltered at different storage times. | ||
The Sb(III) stability in Glucantime® was evaluated from the spike and dilution until analysis, as shown in Fig. 7. The peak of iSb(III) decreases considerably 10 minutes after dilution, which suggests that the sample should not be filtered and that it should be analyzed as soon as it is ready for injection within a period of less than 10 minutes. It is important to note that the NMG-Sb(V) signal in Fig. 7 shows two peaks. This is not surprising, considering that it is currently not known exactly what chemical form this compound has in solution. As mentioned in the theoretical framework, the existence of several species is proposed, including both neutral and anionic species, and the stoichiometry is undetermined.4
Figures of merit
Since there was no reference material, the recovery percentage should be used as one of the tools for validating the method (Table 4). Considering that the blank does not generate a chromatographic peak for the determination of LOD and LOQ, the standard deviation of the blank (SDb) was obtained from the standard deviation of the intercept. The values of LOD and LOQ were obtained from the 3 × SDb/slope and 10 × SDb/slope by applying the general definition of IUPAC.29 Precision (repeatability) was determined as the relative standard deviation (% RSD) of 5 independent injections. The matrix generated a shift in the retention times without affecting the order of elution or the sensitivity of the signal. Hence, we recommend that the use of standard addition is not necessary for the application of the method. The concentration of native Sb species in Glucantime® was quantified as 1541 ± 10, 491 ± 4, and 407 ± 5 μg L−1 for NMG-Sb(V), iSb(V) and iSb(III), respectively (mean ± SD).| Retention time (min) | r 2 | LOD μg L−1 | LOQ μg L−1 | Concentrations determined μg L−1 | % RSD n = 5 50 μg L−1 | |
|---|---|---|---|---|---|---|
| MA | 1.20 ± 0.03 | 0.992 | 22 | 67 | 99 ± 3 | 4 |
| iSb(V) | 2.6 ± 0.1 | 0.997 | 18 | 61 | 132 ± 4 | 2 |
| iSb(III) | 6.9 ± 0.1 | 0.990 | 33 | 111 | 137 ± 6 | 6 |
Application of the new speciation method in biological samples
Three rats received a daily intraperitoneal injection of NMG-Sb(V) at a dose equivalent to 20 mg kg-1 body weight of total Sb for 5 days. Urine samples were collected once a day from a metabolic cage and cover device where the biological fluid is transferred and accumulated for 24 hours in a falcon tube. Urine samples were filtered with a 0.22 μm membrane filter, diluted and injected in triplicate into the HPLC-ICP-MS with a pre-column system (PRP-X100 Analytical Guard Cartridge Replacement Cartridges (5/pk), stainless steel), and the PRP-X100 column had the same conditions used for the separation of NMG-Sb(V), iSb(V), and iSb(III). The retention times to determine the identity of each species were obtained by standard addition.No species stabilization method was used on the urine, which means that the analysis was qualitative. This demonstrates the applicability of the method with different detectors. As can be seen in Fig. 8A, the urine samples from rats 1 and 2 show the presence of the NMG-Sb(V) species, iSb(V), and smaller traces of iSb(III). In addition, the urine of rat 3 (Fig. 8B) shows the presence of NMG-Sb(V) along with 2 additional chromatographic signals, which could be assigned, in the order of elution, to iSb(V) and iSb(III). However, the retention times of these species do not coincide with those of the standards, and this shift is not explained by the precision of the injection. Thus, they could be associated with unknown species, and further studies would be required to discover their identity.
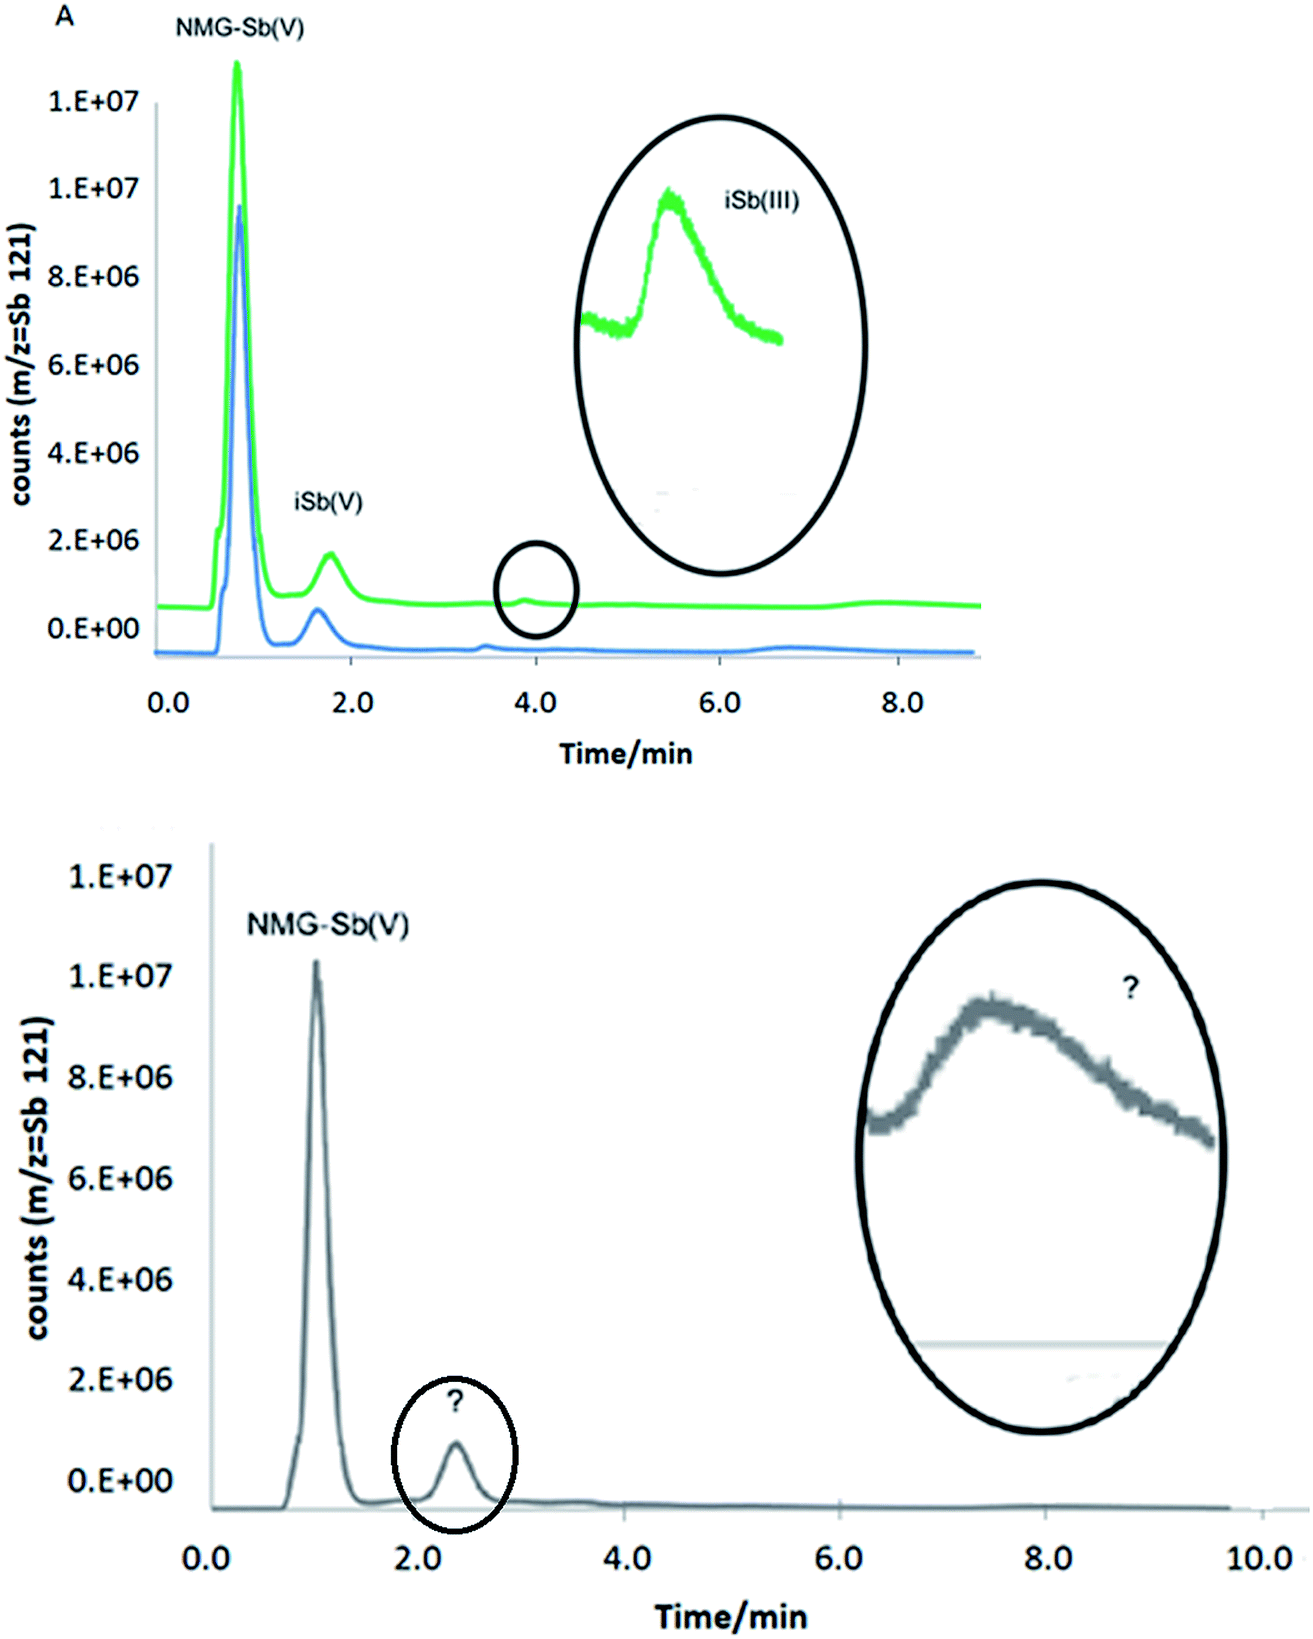 | ||
| Fig. 8 Chromatograms of rat urine by HPLC-ICP-MS under optimized conditions: (A) rats 1 and 2. (B) Rat 3. | ||
Under the optimized chromatographic conditions, the mobile phase of Na2H2EDTA is not recommended for an ICP-MS detector. However, given the low initial Na2H2EDTA concentration of 0.473 mM, this did not present a major problem in terms of detector corrosion. The concentration of the second mobile phase of Na2H2EDTA is 20 mM, and between each injection, the column was reconditioned with 0.473 mM Na2H2EDTA, which serves as a cleaning agent. In any case, if applied to ICP-MS detectors, we recommend that this chromatographic method be conducted by performing hydride generation prior to detection using HPLC-HG-ICP-MS, as we have published in previous studies. This avoids ion overload and sodium in the cones.
Although the administered dose of NMG-Sb(V) was the same, the areas of the signals were different, as shown in Fig. 8. The rats had free access to drinking water, and therefore, the amount of urine generated and its dilution would necessarily be different. Finally, in the case of the 3 rats, the injected NMG-Sb(V) was partially transformed into iSb(V) and iSb(III). Therefore, a possible metabolic route of NMG-Sb(V) should be studied in the future.
Conclusion
The outcomes of our investigation show that NMG-Sb(V), iSb(V), and iSb(III) species can be separated and detected with an Na2H2EDTA gradient using anion exchange chromatography. The method showed good resolution and a short analysis time. Regarding sample treatment, our results demonstrate that Glucantime® samples must be diluted without filtering and analyzed immediately to avoid the oxidation and loss of iSb(III). The problem of iSb(III) stability must be considered in future investigations.Conflicts of interest
The authors declare no potential conflicts of interest with respect to the research, authorship, or publication of this article.Acronyms
| MA | Meglumine antimoniate |
| NMG | N-Methylglucamine |
| NMR-H | Proton nuclear magnetic resonance |
| HG-AFS | Hydride generation atomic fluorescence spectroscopy |
| ESI-MS(+) | Electrospray mass spectrometry in positive mode |
Acknowledgements
The authors gratefully acknowledge the financial support of FONDECYT (Project 1150528), the scholarship from the Research Vice-Rectory of Advanced Studies (VRIEA), and the CONICYT scholarship (Folio number: 21180083) for the fellowships granted. We are also thankful for the financial support from JSPS KAKENHI (Grant numbers 16H05812 and 18H03380).References
- R. Cooper and A. Harrison, Indian J. Occup. Health, 2009, 13, 3 Search PubMed.
- WHO, W. H. O. Tech. Rep. Ser., 1990, 9–131 Search PubMed.
- J. Berman, Curr. Opin. Infect. Dis., 2003, 16, 397–401 CrossRef CAS PubMed.
- F. Frézard, P. S. Martins, M. C. M. Barbosa, A. M. C. Pimenta, W. A. Ferreira, J. E. de Melo, J. B. Mangrum and C. Demicheli, J. Inorg. Biochem., 2008, 102, 656–665 CrossRef PubMed.
- S. Sundar and J. Chakravarty, Int. J. Environ. Res. Public Health, 2010, 7, 4267–4277 CrossRef CAS PubMed.
- C. Brochu, J. Wang, G. Roy, N. Messier, X. Y. Wang, N. G. Saravia and M. Ouellette, Antimicrob. Agents Chemother., 2003, 47, 3073–3079 CrossRef CAS PubMed.
- C. A. S. No, A. Group, A. Alcoholic, A. Areca and B. Benzidine, 2012, pp. 1–34.
- J. L. Burguera, M. Burguera, Y. Petit De Pena, A. Lugo and R. Anez, J. Trace Elem. Med. Biol., 1993, 10, 66–70 Search PubMed.
- D. R. Coelho, E. S. Miranda, T. D. Saint'Pierre and F. J. Roma Paumgartten, Mem. Inst. Oswaldo Cruz, 2014, 109, 420–427 CrossRef PubMed.
- M. Filella, N. Belzile and Y. W. Chen, Earth-Sci. Rev., 2002, 59, 265–285 CrossRef CAS.
- F. Q. Schafer and G. R. Buettner, Free Radical Biol. Med., 2001, 30, 1191–1212 CrossRef CAS PubMed.
- S. López, L. Aguilar, L. Mercado, M. Bravo and W. Quiroz, PLoS One, 2015, 10, e0114796 CrossRef PubMed.
- W. Quiroz, I. De Gregori, P. Basilio, M. Bravo, M. Pinto and M. G. Lobos, J. Environ. Monit., 2009, 11, 1051–1055 RSC.
- A. Kobayashi and Y. Ogra, J. Toxicol. Sci., 2009, 34, 295–303 CrossRef CAS PubMed.
- H. R. Hansen, C. Hansen, K. P. Jensen, S. H. Hansen, S. Stürup and B. Gammelgaard, Anal. Chem., 2008, 80, 5993–6000 CrossRef CAS PubMed.
- M. Potin-Gautier, F. Pannier, W. Quiroz, H. Pinochet and I. De Gregori, Anal. Chim. Acta, 2005, 553, 214–222 CrossRef CAS.
- I. De Gregori, W. Quiroz, H. Pinochet, F. Pannier and M. Potin-Gautier, Talanta, 2007, 73, 458–465 CrossRef CAS PubMed.
- I. De Gregori, W. Quiroz, H. Pinochet, F. Pannier and M. Potin-gautier, J. Chromatogr. A, 2005, 1091, 94–101 CrossRef CAS PubMed.
- K. Friedrich, F. a. Vieira, R. Porrozzi, R. S. Marchevsky, N. Miekeley, G. Grimaldi and F. J. R. Paumgartten, J. Toxicol. Environ. Health, Part A, 2012, 75, 63–75 CrossRef CAS PubMed.
- N. Miekeley, S. R. Mortari and A. O. Schubach, Anal. Bioanal. Chem., 2002, 372, 495–502 CrossRef CAS PubMed.
- F. Séby, C. Gleyzes, O. Grosso, B. Plau and O. F. X. Donard, Anal. Bioanal. Chem., 2012, 404, 2939–2948 CrossRef PubMed.
- D. B. Da Justa Neves, E. D. Caldas and R. N. R. Sampaio, Trop. Med. Int. Health, 2009, 14, 1515–1522 CrossRef PubMed.
- L. Łukaszczyk and W. Zyrnicki, J. Pharm. Biomed. Anal., 2010, 52, 747–751 CrossRef PubMed.
- S. Rath, W. F. Jardim and J. G. Dórea, Fresenius. J. Anal. Chem., 1997, 358, 548–550 CrossRef CAS.
- V. S. Santos, W. de J. R. Santos, L. T. Kubota and C. R. T. Tarley, J. Pharm. Biomed. Anal., 2009, 50, 151–157 CrossRef CAS PubMed.
- C. Demicheli, R. Ochoa, I. S. Lula, F. C. Gozzo, M. N. Eberlin and F. Frézard, Appl. Organomet. Chem., 2003, 17, 226–231 CrossRef CAS.
- D. R. Gómez, M. Fernanda Giné, A. Claudia Sánchez Bellato and P. Smichowski, J. Environ. Monit., 2005, 7, 1162 RSC.
- F. Frézard, C. Demicheli and R. R. Ribeiro, Molecules, 2009, 14, 2317–2336 CrossRef PubMed.
- M. Thompson, S. L. R. Ellison and R. Wood, Pure Appl. Chem., 2002, 74, 835–855 CAS.
Footnote |
| † Electronic supplementary information (ESI) available. See DOI: 10.1039/c8ja00273h |
| This journal is © The Royal Society of Chemistry 2019 |