
Effects of ultrasound combined with ozone on the degradation of organophosphorus pesticide residues on lettuce
Xiao-Dan Fan,
Wen-Li Zhang,
Hai-Yan Xiao,
Tai-Qiu Qiu* and
Jian-Guo Jiang*
College of Food and Bioengineering, South China University of Technology, Guangzhou, 510640, China. E-mail: tqqiu@scut.edu.cn; jgjiang@scut.edu.cn; Fax: +86-20-87113843; Tel: +86-20-87113849
First published on 15th May 2015
Abstract
Methamidophos (MDP) and dichlorvos (DDVP) are organophosphorous pesticides which are commonly used for pest control in agriculture to obtain better yields. The occurrence of OPP residues in vegetables is known to cause serious health problems to consumers. In the present research, a laboratory-scale experiment was performed to investigate the effects of ultrasound (US)/ozone (O3) combination on the degradation of the two pesticides on lettuce. Various parameters including ozone flow rate, water temperature, treatment time and initial concentration of OPPs were chosen to identify their effects on the degradation rate of MDP under US/O3 treatment. The degradation rate could reach up to 82.16% under the optimal conditions of ozone flow rate 75 mg min−1, time 60 min, initial concentration 0.1–0.2 mg kg−1, and water temperature 8 °C. It was observed that the treatments with O3, US and US/O3 had no obvious impact on the quality of the lettuce. Subsequently, the reaction kinetics of DDVP degradation in water were studied, and the dynamical equation of US/O3 treatment was obtained as:  , which confirmed the practicability and applicability of the US/O3 degradation process.
1. Introduction
Fresh vegetables are sources of nutrients and minerals and constitute an important part of a healthy diet.1 Along with the rapid increase in population, the demand for vegetables is also growing quickly, and the use of pesticides is increasing as well.2 Pesticides are a group of artificially synthesized substances used to fight pests and improve the agricultural production,3 among which organophosphorus pesticides (OPPs) are the most widely used.4 The use of OPPs has facilitated the mass production of high quality vegetables. However, trace amounts of OPPs residing in the human body for a long period can pose adverse risks to non-target tissues and organs.5–8 Recently, the increasing demand for food safety has stimulated research regarding the risks associated with consumption of foodstuffs contaminated by OPPs.9,10 Therefore, except for the control of OPPs application, there is a tendency to develop highly sensitive, simple and low cost techniques for the removal and degradation of OPPs residuals.11Due to the powerful, effective and nonselective oxidizing agent of ozone, ozone oxidation has increasingly developed into an attractive technique for the sterilization, virus inactivation, deodorization, decoloration and wastewater treatment for sanitation purposes, as well as for the decomposition of common pollutants including OPPs.12,13 Ozone exerts oxidation roles mainly via two pathways: direct oxidation by ozone molecules or indirect oxidation by its decomposition products such as hydroxyl free radicals (˙OH).14 The low diffusivity and high cost of ozone, however, impede it from wider applications. In order to improve the utilization rate of ozone, several groups have made some advances in combing ozonolysis technique with other methods such as UV/O3,15 H2O2/O3,16 UV/H2O2/O3,17 US/O3 18 to improve the advanced oxidization processes, among which US/O3 has been proved to be a more effective technology with the advantages of using less energy,19,20 being non-selective and leading to no secondary pollution.21,22 Moreover, studies have shown US/O3 combination to be more effective than US or O3 alone treatment for the degradation of OPPs residuals,23,24 it produces better utilization of the oxidant through promoting the dissociation of ozone. The mass transfer resistance, a major limiting factor for the application of ozone alone, is also eliminated due to the enhanced turbulence generated by ultrasound.25 However, US/O3 technique for the degradation of contaminants still remain in the laboratory stage so far, its application should be paid more attention and needs further explored.
The present study selects methamidophos (MDP) and dichlorvos (DDVP), two model OPPs, to investigate the degradation of OPPs residuals on lettuce by US/O3 combination treatment. The degradation of MDP on lettuce was examined in order to get the optimization conditions, under which the reaction kinetics of DDVP degradation in water using US/O3 treatment was investigated, aiming to provide theory and experimental data for the wider application of US/O3 in the degradation of pesticide residues on lettuce. Furthermore, to ensure the practical significance and application value of the experiment, effects of the treatments on the lettuce quality was also evaluated and compared.
2. Materials and methods
2.1. Materials and apparatus
Uncontaminated lettuces were purchased from the academy of agricultural sciences. Standards of MDP (purity: 99.9%) and DDVP (purity: 99.9%) were supplied from Environmental Protection Institute of the Agriculture Ministry (Guangzhou, China). 50% MDP emulsifiable concentrates (EC) and 80% DDVP EC were obtained from the harvest of agricultural production materials Co., Ltd. (Guangzhou, China). All chemicals were of analytical grade, acetonitrile, acetone and methylene chloride were redistilled before use. The water used throughout was distilled water. The US/O3 cleaning device for lettuce (Fig. 1) was designed to be suitable for our current experiment study.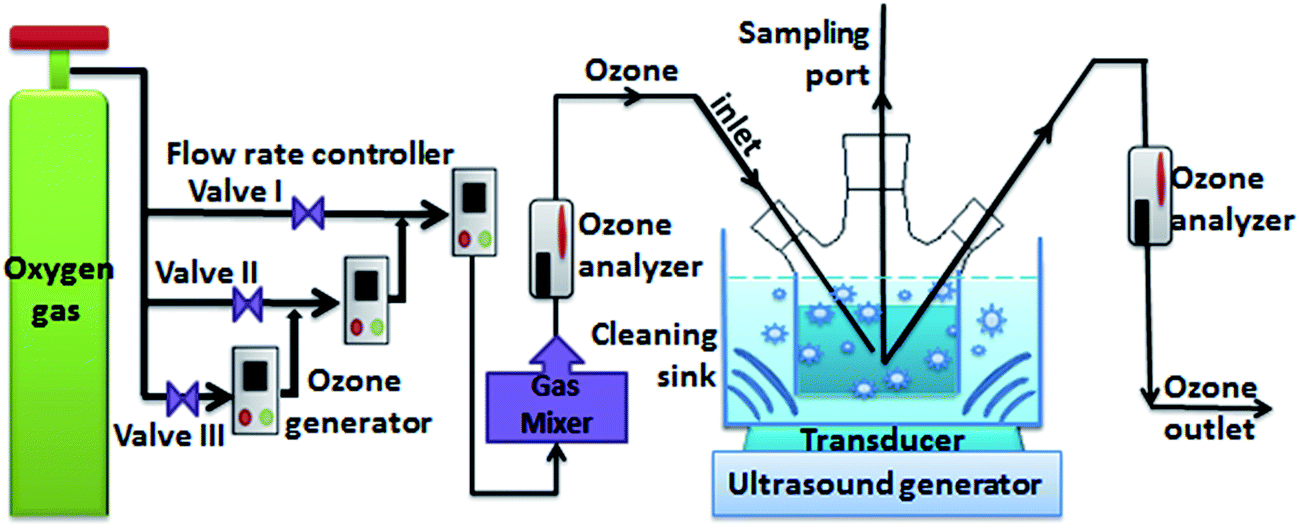 | ||
| Fig. 1 Schematic of experimental US/O3 combination cleaning apparatus (JY-92-II ultrasonic generator, frequency rate 25 kHz, ultrasound power 0–1000 W; DHX-SS-1G ozone generator). | ||
2.2. Sample pre-treatment
First, 50% MDP EC and 80% DDVP EC were respectively diluted to the required concentration in distilled water. Then the uncontaminated lettuces were completely immersed into the two OPPs solutions for 30 min to allow the pesticide to be absorbed in the lettuces. Subsequently, the lettuces spiked with OPPs were then air-dried for about 24 h under room conditions in basket.2.3. Gas chromatographic (GC) analysis
According to guideline on organophosphorus pesticide residue detection in vegetables and fruits (NY/T 761.1-2004) at the Ministry of Agriculture standard,26 the OPPs residues analysis on lettuce was carried out on a GC-FPD (flame photometric detector) (Shimadzu, Japan) equipped with an capillary column (Model GC2000 & Model DB-1701, 30 m × 0.25 mm. i.d, Shimadzu, Japan). The GC column was operated at a temperature of 120 °C for 2 min and then increased to 240 °C at 30 °C min−1 and held for 5 min at 240 °C. The vaporizing chamber temperature was 260 °C and the detector was 270 °C with nitrogen as carrier gas at a flow rate of 120 mL min−1, air of 120 mL min−1, and hydrogen of 80 mL min−1. The sample (1.0 μL) was injected in the split mode with narrow diameter at the diversion ratio of 1![[thin space (1/6-em)]](https://www.rsc.org/images/entities/char_2009.gif) :1.
:1.
2.4. Effect of input time in water on ozone concentration
Ozone gas produced by ozone generator was bubbled into distilled water. The dissolved ozone levels were conducted via adjusting the bubbling duration and the flow rate, which were controlled via switching the ozone generator to valve I, valve II or valve III (Fig. 1, open one, two or three ozone generators, respectively). First, turned on the valve I, II or III (ozone flow rate of 25 mg min−1, 50 mg min−1 or 75 mg min−1, respectively), and then kept bubbling duration for 10 min, 20 min, 30 min, 40 min, 50 min or 60 min, respectively. Finally, determined the dissolved ozone concentration in water on the basis of iodometry.272.5. Degradation of OPPs residuals on lettuce
Degradation of OPPs on lettuce was studied from four single factors. Firstly, prepared four different initial concentration of MDP (13.243 mg kg−1, 3.556 mg kg−1, 1.083 mg kg−1, 0.295 mg kg−1, 0.082 mg kg−1) and DDVP (20.698 mg kg−1, 5.361 mg kg−1, 1.402 mg kg−1, 0.386 mg kg−1, 0.103 mg kg−1) on the entire leaves of lettuces, respectively. Turned on both ozone and ultrasound generator, bubbled into three different gas flow rate (25 mg min−1, 50 mg min−1, 75 mg min−1) at four different initial water temperature (32 °C, 24 °C, 16 °C, 8 °C), and kept the duration of cleaning lettuce samples spiked with OPPs for desired time. Then, lettuce samples were taken out at regular time intervals (10 min, 20 min, 30 min, 40 min, 50 min, 60 min, 70 min or 80 min) and finally the OPPs residues on lettuce were determined using GC analysis. A control treatment was also conducted where the vegetables lettuce samples were immersed and rinsed in distilled water. Using this method, the definition of OPPs degradation ratio (K0) is as follows:where C0 and C are the initial concentration and concentration at a given time of MDP or DDVP.

Based on the above results, Since the ozone flow rate, treatment time, initial concentration of OPPs and water temperature could impact the efficiency in OPPs removal, the better degradation efficiency could be obtained through optimizing these parameters, thus L9 (34) orthogonal experimental design was applied to determine their influence on the degradation of MDP on lettuce. The four independent variables were ozone flow rate (A), treatment time (B), initial concentration of MDP (C) and water temperature (D), respectively. Furthermore, in order to further prove that US/O3 has significant effect on the degradation of OPPs on lettuce, under the optimization of experimental conditions, degradation effects of the four different processing methods of US, O3, continuous (Con) US/O3 and intermittent (Int) US/O3 were compared. All the experiments were performed in twice.
2.6. The influence of different processing methods on the quality of lettuce
The present study aimed to investigate whether using different processing methods could effectively remove OPPs residues on lettuces while there had as smaller influences on lettuce quality as possible, to this end, with reference to some relevant parameters as described by Lin et al.28 We explored and compared the influence of US, O3 and US/O3 treatment on the lettuce quality from the aspects of titratable acidity, soluble sugar, ascorbic acid (VC), chlorophyll (Chl), carotenoid (Car) and nitrate.
where SS = soluble sugar, C = sugar content obtained from the standard curve, μg; V0 = total volume of sample solution, mL; V1 = volume of sample solution for determination of access, mL; D = dilution multiples; W = weight of sample, g.

where C = sample solution concentration obtained from the standard curve, μg mL−1; m = weight of sample, g; F = diluted multiples, V = sample volume consumed in fluorescence reaction, mL.
| Chl (mg L−1) = 20.29 × OD645 + 8.02 × OD663 |
:methanol = 2:1 (v/v)), and collected the organic phase of the bottom after vibration. All the extract liquor were merged, and then diluted to 100 mL, of which the maximum absorbance of determination (A) was determined at the wavelength of 445 nm.| TC (mg L−1) = A × 20 |
where C = NO3− − N content obtained from the standard curve, mg kg−1; V = total weight of sample solution, g; W = fresh weight of sample, g.

2.7. Degradation kinetic of DDVP in water
Due to the practical applications, the degradation kinetics of DDVP in water was investigated under the mild optimum conditions. The experiment procedure similar to OPPs degradation on lettuce (reference to above 2.5) was carried out to investigate the effects of initial concentration of DDVP (10, 20, 30, or 40 mg L−1), ozone flow rate (25 mg min−1, 50 mg min−1, 75 mg min−1), and initial water temperature (32 °C, 24 °C, 16 °C, 8 °C). Fit the above data using the origin software to establish the appropriate degradation dynamics equation.3. Results and discussion
3.1. Degradation of OPPs on lettuce in the combined US/O3 system
 | ||
| Fig. 2 (A) Effect of input time on ozone concentration, (B) effect of ozone flow rate on degradation rate of MDP, (C) effect of ozone flow rate on degradation rate of DDVP, (D) effect of water temperature on degradation rate of MDP, (E) effect of water temperature on degradation rate of DDVP, (F) effect of treatment time on degradation rate of MDP and DDVP, (G) effect of initial concentration on degradation rate of MDP, (H) effect of initial concentration on degradation rate of DDVP, (I) effect of different processing methods on degradation rate of OPPs. | ||
3.2. Optimization of degradation
| Number | A (valve) | B (min) | C (mg kg−1) | D (°C) | K0 (%) |
|---|---|---|---|---|---|
| 1 | I | 20 | 0.354 | 8 | 54.12 |
| 2 | I | 40 | 1.396 | 16 | 43.46 |
| 3 | I | 60 | 5.513 | 24 | 36.17 |
| 4 | II | 20 | 1.396 | 24 | 45.91 |
| 5 | II | 40 | 5.513 | 8 | 38.95 |
| 6 | II | 60 | 0.354 | 16 | 60.76 |
| 7 | III | 20 | 5.513 | 16 | 56.19 |
| 8 | III | 40 | 0.354 | 24 | 70.18 |
| 9 | III | 60 | 1.396 | 8 | 68.89 |
| K1 | 133.75 | 156.22 | 185.06 | 161.96 | |
| K2 | 145.62 | 152.59 | 158.26 | 160.41 | |
| K3 | 231.43 | 165.82 | 131.31 | 152.26 | |
| k1 | 44.58 | 52.07 | 61.69 | 53.99 | |
| k2 | 48.54 | 50.86 | 52.75 | 53.47 | |
| K3 | 77.14 | 55.27 | 43.77 | 50.75 | |
| R | 32.56 | 4.41 | 17.92 | 3.24 | A3B3C1D1 |
The poor degradation effect of US treatment which was mainly resulted from acoustic cavitation might be attributed to the usual long contact time and the fact that low-frequency ultrasound could not promote the production of ˙OH.42 In the US/O3 synergism system, the reaction pathways might be affected each other. On the one hand, myriad of tiny bubbles were produced due to the cavitation effect and mechanical action of ultrasound, enhancing the production of additional ˙OH for further oxidation of OPPs. The increase of mass transfer and decomposition processes of O3 coupled with transient local ultra-high pressure and high-temperature upon the collapsing of cavities enabled more O3 to enter the liquid phase or react on the gas–liquid interface.43,44 On the other hand, aeration of O3 might increase the turbulence of the aqueous solution, which would increase the migration of more related substances from the collapsing cavities into the bulk of the solution. In addition, the degradation effect of intermittent US/O3 was significant as continuous US/O3 processing mode; while intermittent US/O3 could reduce ozone consumption and ultrasound function loss. Thus the intermittent US/O3 should be taken serious attentions and applied to practice in future.
3.3. Influence of different processing methods on the quality of lettuce
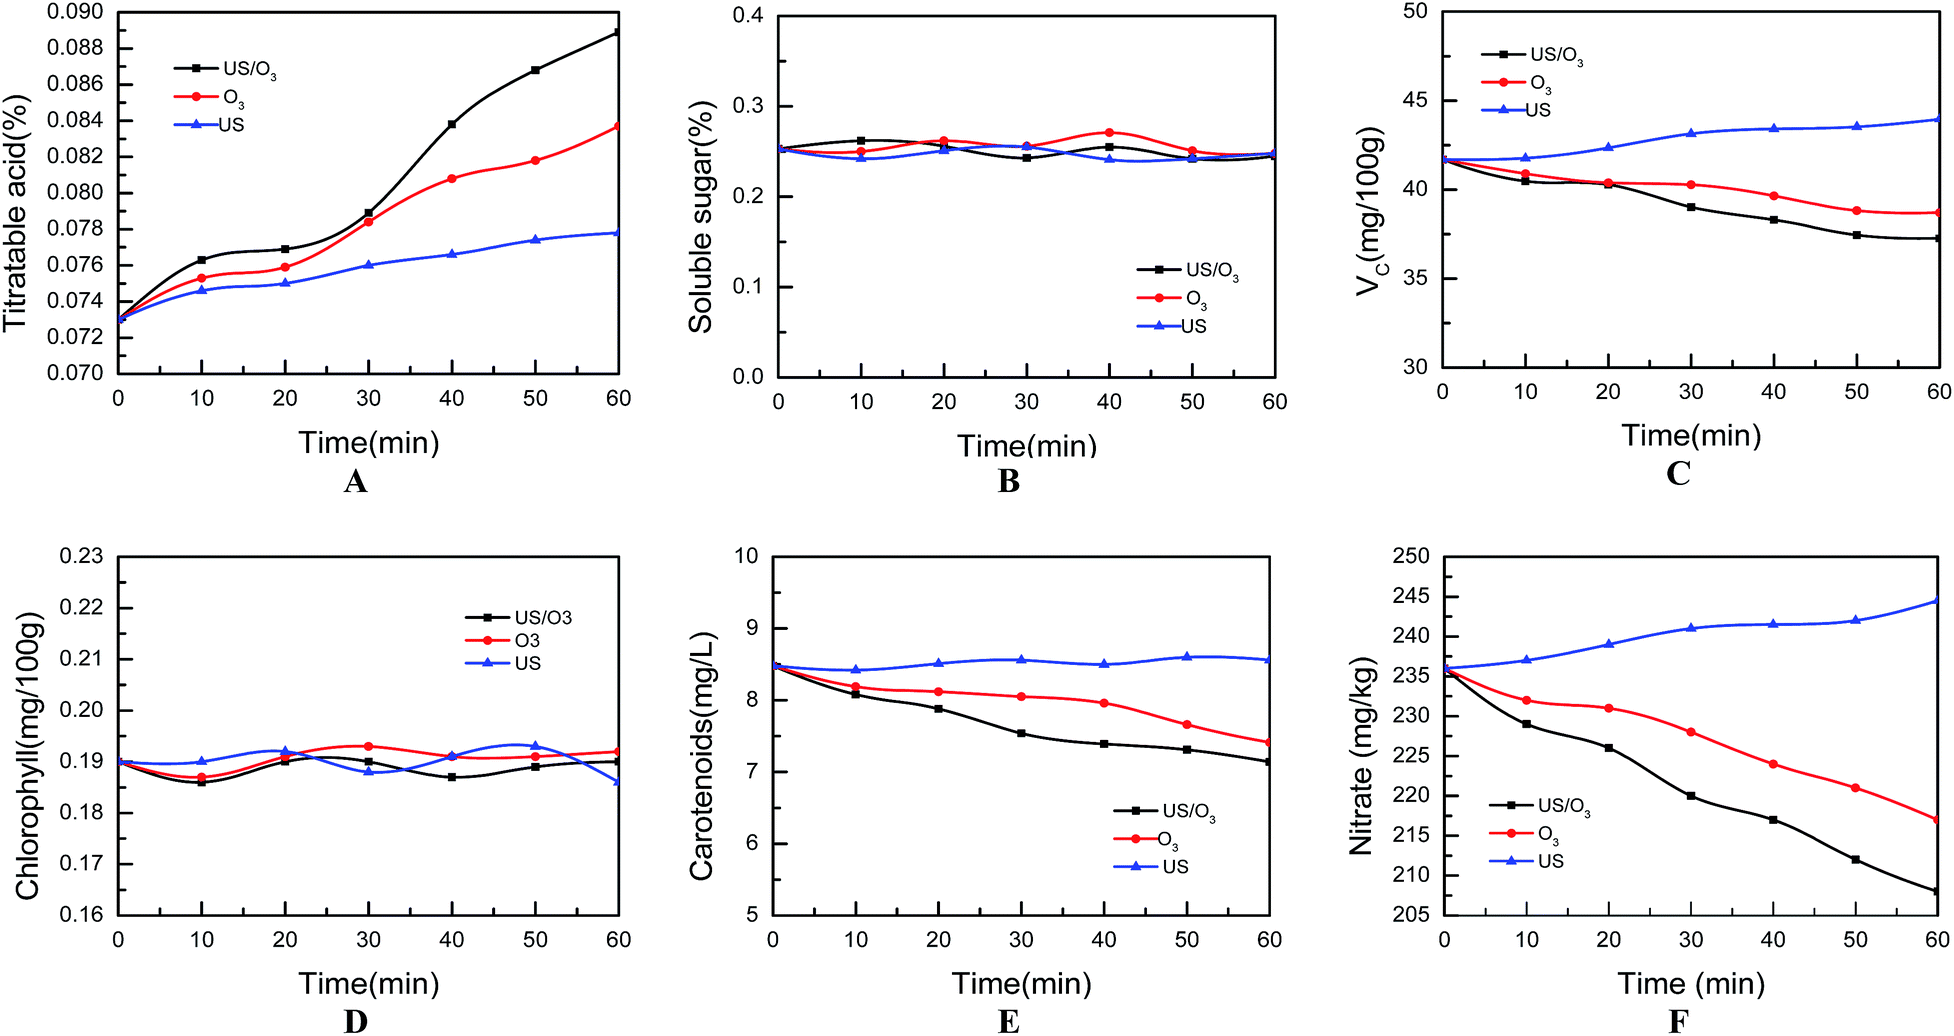 | ||
| Fig. 3 (A) Effects of different processing methods on titratable acidity, (B) effects of different processing methods on soluble sugar, (C) effects of different processing methods on ascorbic acid, (D) effects of different processing methods on chlorophyll, (E) effects of different processing methods on carotenoid, (F) effects of different processing methods on nitrate. | ||
3.4. Degradation kinetics
The trends of degradation effect on DDVP in water in different factors were generally consistent with those OPPs on lettuce. First, keeping other conditions constant, with the increase of DDVP concentration from the 10 mg L−1 up to 40 mg L−1, the degradation rate of DDVP in water was decreased from 86% to 58% after processing 60 min (Fig. 4A). Second, after 60 min of US/O3 treatment at 8 °C, along with the ozone flow rate was raised from 25 mg min−1 to 75 mg min−1, the degradation rate of DDVP in water was increased from 55% to 86% (Fig. 4B). Third, as was shown in Fig. 4C. Degradation rate of DDVP varied in response to the different initial water temperature in the range of 8 °C to 32 °C, which was decreased with the increase of temperature. | ||
| Fig. 4 (A) Effect of initial concentration on degradation rate of DDVP, (B) effect of ozone flow rate on degradation rate of DDVP, (C) effect of water temperature on degradation rate of DDVP, (D) lnKobs − T−1 fitted curve, (E) lnKobs − lnC0 fitted curve, (F) lnKobs − lnQO3 fitted curve. | ||
The above data indicated that the degradation of DDVP fitted in the following pseudo-first-order reaction kinetic:49,50
| −ln(C/C0) = kC |
| Number | C0 | QO3 | T (K) | Kobs (min−1) | r |
|---|---|---|---|---|---|
| 1 | 10 | 25 | 281 | 0.0139 | 0.9845 |
| 2 | 10 | 50 | 281 | 0.0231 | 0.9923 |
| 3 | 10 | 75 | 281 | 0.0337 | 0.9938 |
| 4 | 10 | 75 | 289 | 0.0257 | 0.9887 |
| 5 | 10 | 75 | 297 | 0.0173 | 0.9876 |
| 6 | 10 | 75 | 305 | 0.0130 | 0.9750 |
| 7 | 20 | 75 | 281 | 0.0258 | 0.9896 |
| 8 | 30 | 75 | 281 | 0.0181 | 0.9924 |
| 9 | 40 | 75 | 281 | 0.0151 | 0.9918 |
The previous results indicated that the reaction involved not only the thermal decomposition of ultrasound and the direct reaction of ozone molecules, but also the ˙OH reaction, so the Kobs was related to initial concentration of DDVP, ozone flow rate and water temperature, the degradation kinetic was adequately modeled on the Arrhenius equation:51,52
| Kobs = A × exp(−Ea,obs/RT)C0αQO3β |
| lnKobs = lnA(−Ea,obs/RT) + αlnC0 + βlnQO3 |
The multiple function regression analysis of lnKobs − T−1, lnKobs − lnC0 and lnKobs − lnQO3 were conducted, the fitted curve of which were shown in Fig. 4D–F. The straight slopes of them were −Ea,obs/R = 3.4829, α = 0.5876, β = 0.7982, respectively. Thus, dynamics equation could be expressed as follows:
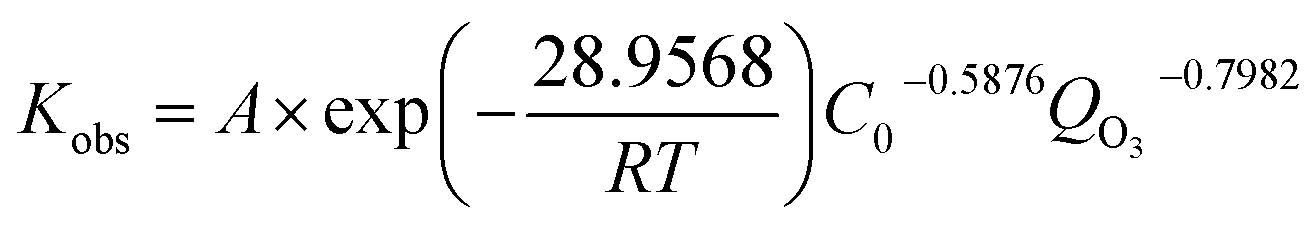
Furthermore, A = 0.0041 could be obtained after applying all experiment results to the above equation. As the result, the degradation dynamics equation was:


To verify the accuracy of dynamics equation, we compared the theoretical data with actual data. Under the condition of the water temperature at the range of 8–32 °C, initial concentration of DDVP at 10–40 mg L−1 and the ozone flow rate at 25–75 mg min−1, the scope of the deviations between the experimental data and theoretical data was kept within 18%, indicating a good applicability of the dynamics experience equation.
4. Conclusion
The US/O3 combination was an effective way to degrade OPPs. The synergetic process showed a higher removal efficiency on both MDP and DDVP than that of using only distilled water, single US or O3 treatment. Intermittent US/O3 treatment would be a more potential candidate for the degradation of the lettuce pesticides residuals. At the high ozone flow rate of 75 mg min−1, water temperature 8 °C, and 60 min US/O3 treatment with the initial concentration of 0.1–0.2 mg kg−1, the MDP degradation rate could reach 82.16%. Treatments of US, O3, or US/O3 combination all had no obvious influence on the quality of lettuce. The degradation efficiency of DDVP in water fitted the first-order reaction rate kinetic model for the US/O3 and presented a potential applicability.Funding sources
This project was supported by the National Natural Foundation of China (grant 21406074), Guangdong Province Science and technology plan project (2013B020311006), and Guangdong Provincial Bureau of ocean and fishery science and technology to promote a special (A201301B04).Abbreviations
| Car | Carotenoid |
| Chl | Chlorophyll |
| Con US/O3 | Continuous US/O3 |
| DDVP | Dichlorvos |
| EC | Emulsifiable concentrates |
| FPD | Flame photometric detector |
| GC | Gas chromatographic |
| ˙OH | Hydroxyl free radicals |
| Int US/O3 | Intermittent US/O3 |
| MDP | Methamidophos |
| O3 | Ozone |
| OPPs | Organophosphorus pesticides |
| US | Ultrasound |
| VC | Ascorbic acid |
References
- D. Sharma, A. Nagpal, Y. B. Pakade and J. K. Katnoria, Talanta, 2010, 82, 1077–1089 CrossRef CAS PubMed.
- J. Y. Chen, Y. J. Lin and W. C. Kuo, J. Food Eng., 2013, 114, 404–411 CrossRef CAS PubMed.
- M. P. Ormad, N. Miguel, M. Lanao, R. Mosteo and J. L. Ovelleiro, Ozone: Sci. Eng., 2010, 32, 25–32 CrossRef CAS PubMed.
- L. G. Wang, Y. C. Liang and X. Jiang, Bull. Environ. Contam. Toxicol., 2008, 81, 377–382 CrossRef CAS PubMed.
- H. Ikeura, S. Hamasaki and M. Tamaki, Food Chem., 2013, 138, 366–371 CrossRef CAS PubMed.
- H. Ikeura, F. Kobayashi and M. Tamaki, J. Hazard. Mater., 2011, 186, 956–959 CrossRef CAS PubMed.
- J. Wu, C. Lan and G. Y. Chan, Chemosphere, 2009, 76, 1308–1314 CrossRef CAS PubMed.
- M. P. Mahadevaswami and B. B. Kaliwal, Environ. Toxicol. Pharmacol., 2005, 20, 251–257 CrossRef CAS PubMed.
- G. Gambacorta, M. Faccia, C. Lamacchia, A. Di Luccia and E. La Notte, Food Control, 2005, 16, 629–632 CrossRef CAS PubMed.
- A. S. Toshiaki Iizuka, Innovative Food Sci. Emerging Technol., 2014, 26, 34–39 CrossRef PubMed.
- Y. Fu, L. X. Zhao, J. Ma and F. Ye, International Conference on Computer Distributed Control and Intelligent Environmental Monitoring, 2011 Search PubMed.
- J. G. Wu, T. G. Luan, C. Y. Lan, T. W. Hung Lo and G. Y. S. Chan, Food Control, 2007, 18, 466–472 CrossRef CAS PubMed.
- U. Von Gunten, Water Sci. Technol., 2007, 55, 25–29 CrossRef CAS.
- S. J. Masten and S. H. R. Davies, Environ. Sci. Technol., 1994, 28, 180A–185A CrossRef CAS PubMed.
- G. Ruppert, R. Bauer and G. Heisler, Chemosphere, 1994, 28, 1447–1454 CrossRef CAS.
- I. Arslan, I. A. Balcioglu and T. Tuhkanen, Environ. Sci. Technol., 1999, 20, 921–931 CrossRef CAS PubMed.
- Y. Lester, D. Avisar, I. Gozlan and H. Mamane, Water Sci. Technol., 2011, 64, 2230 CrossRef CAS PubMed.
- W. J. Guo, G. M. Zhang and J. Ma, J. Harbin Univ. Commer., Nat. Sci. Ed., 2010, 2, 5 Search PubMed.
- K. Ikehata and M. Gamal El Din, Ozone: Sci. Eng., 2005, 27, 173–202 CrossRef CAS PubMed.
- A. Matilainen and M. Sillanpää, Chemosphere, 2010, 80, 351–365 CrossRef CAS PubMed.
- A. Mizrach, Postharvest Biol. Technol., 2007, 46, 271–274 CrossRef PubMed.
- S. Song, M. Xia, Z. He, H. Ying, B. Lü and J. Chen, J. Hazard. Mater., 2007, 144, 532–537 CrossRef CAS PubMed.
- S. Song, Z. Q. He and J. M. Chen, Ultrason. Sonochem., 2007, 14, 84–88 CrossRef CAS PubMed.
- T. M. Olson and P. F. Barbier, Water Res., 1994, 28, 1383–1391 CrossRef CAS.
- P. R. Gogate, Ultrason. Sonochem., 2008, 15, 1–15 CrossRef CAS PubMed.
- Part 1: Guideline on organophosphorus pesticide residue detection in vegetables and fruits (NY/T 761.1-2004), 2004, 1–4.
- P. Lobit, P. Soing, M. Génard and R. Habib, J. Plant Nutr., 2002, 25, 2775–2792 CrossRef CAS.
- K. H. Lin, M. Y. Huang, W. D. Huang, M. H. Hsu, Z. W. Yang and C. M. Yang, Sci. Hortic., 2013, 150, 86–91 CrossRef PubMed.
- B. L. Somani, J. Khanade and R. Sinha, Anal. Biochem., 1987, 167, 327–330 CrossRef CAS.
- H. H. Shieh and T. R. Sweet, Anal. Biochem., 1979, 96, 1–5 CrossRef CAS.
- R. J. Porra, W. A. Thompson and P. E. Kriedemann, Biochim. Biophys. Acta, Bioenerg., 1989, 975, 384–394 CrossRef CAS.
- K. J. Scott, in Current Protocols in Food Analytical Chemistry, ed. V. Chanda, 2001, p. F:F2:F2.2 Search PubMed.
- D. A. Cataldo, M. Maroon, L. E. Schrader and V. L. Youngs, Commun. Soil Sci. Plant Anal., 1975, 6, 71–80 CrossRef CAS PubMed.
- A. K. Biń, Exp. Therm. Fluid Sci., 2004, 28, 395–405 CrossRef PubMed.
- L. P. Yang, W. Y. Hu, H. M. Huang and B. Yan, Desalin. Water Treat., 2010, 21, 87–95 CrossRef CAS.
- G. H. Xu, S. H. Chen, J. W. Shi, S. M. Wang and G. F. Zhu, J. Hazard. Mater., 2010, 180, 340–346 CrossRef CAS PubMed.
- R. Munter, Proc. Est. Acad. Sci., Chem., 2001, 50, 59–80 CAS.
- W. K. Yeoh, A. Ali and C. F. Forney, Postharvest Biol. Technol., 2014, 89, 56–58 CrossRef CAS PubMed.
- Y. Y. Zhang, W. J. Zhang, X. J. Liao, J. N. Zhang, Y. X. Hou, Z. Y. Xiao, F. Chen and X. S. Hu, Ultrason. Sonochem., 2010, 17, 662–668 CrossRef CAS PubMed.
- X. W. Xu, X. H. Xu, H. X. Shi and D. H. Wang, J. Zhejiang Univ., Sci., B, 2005, 6, 553 CrossRef PubMed.
- S. Song, H. Ying, Z. He and J. Chen, Chemosphere, 2007, 66, 1782–1788 CrossRef CAS PubMed.
- J. D. Schramm and I. Hua, Water Res., 2001, 35, 665–674 CrossRef CAS.
- H. Destaillats, A. J. Colussi, J. M. Joseph and M. R. Hoffmann, J. Phys. Chem. A, 2000, 104, 8930–8935 CrossRef CAS.
- N. H. Ince and G. Tezcanlí, Dyes Pigm., 2001, 49, 145–153 CrossRef CAS.
- H. Tomiyasu, H. Fukutomi and G. Gordon, Inorg. Chem., 1985, 24, 2962–2966 CrossRef CAS.
- L. K. Zhang, Z. X. Lu, Z. F. Yu and X. Gao, Food Control, 2005, 16, 279–283 CrossRef CAS PubMed.
- B. K. Tiwari, K. Muthukumarappan, C. P. O'Donnell and P. J. Cullen, J. Agric. Food Chem., 2008, 56, 6416–6422 CrossRef CAS PubMed.
- C. García Viguera and P. Bridle, Food Chem., 1999, 64, 21–26 CrossRef.
- W. R. Zhao, H. Sui and D. C. Wang, Chin. J. Chem. Eng., 2003, 11, 388–394 CAS.
- J. Saien and S. Khezrianjoo, J. Hazard. Mater., 2008, 157, 269–276 CrossRef CAS PubMed.
- K. J. Laidler, J. Chem. Educ., 1984, 61, 494 CrossRef CAS.
- C. M. Birdsall, A. C. Jenkins and E. Spadinger, Anal. Biochem., 1952, 24, 662–664 CAS.
| This journal is © The Royal Society of Chemistry 2015 |