
 Open Access Article
 This Open Access Article is licensed under a Creative Commons Attribution-Non Commercial 3.0 Unported Licence
Characterisation, coverage, and orientation of functionalised graphene using sum-frequency generation spectroscopy
Huda S.
AlSalem
abc,
Chloe
Holroyd
a,
Melissa
Danial Iswan
a,
Andrew B.
Horn
ab,
Melissa A.
Denecke
 ab and
Sven P. K.
Koehler
*bd
ab and
Sven P. K.
Koehler
*bd
aSchool of Chemistry, The University of Manchester, Oxford Road, Manchester, M13 9PL, UK
bPhoton Science Institute, The University of Manchester, Oxford Road, Manchester, M13 9PL, UK
cSchool of Chemistry, Princess Nourah bint Abdulrahman University, Riyadh, Saudi Arabia
dSchool of Science and the Environment, Manchester Metropolitan University, Chester Street, Manchester, M1 5GD, UK. E-mail: s.koehler@mmu.ac.uk
First published on 13th March 2018
Abstract
We report the unambiguous detection of phenyl groups covalently attached to functionalised graphene using non-linear spectroscopy. Sum-frequency generation was employed to probe graphene on a gold surface after chemical functionalisation using a benzene diazonium salt. We observe a distinct resonance at 3064 cm−1 which can clearly be assigned to an aromatic C–H stretch by comparison with a self-assembled monolayer on a gold substrate formed from benzenethiol. Not only does sum-frequency generation spectroscopy allow one to characterise functionalised graphene with higher sensitivity and much better specificity than many other spectroscopic techniques, but it also opens up the possibility to assess the coverage of graphene with functional groups, and to determine their orientation relative to the graphene surface.
Introduction
Graphene, a monolayer of sp2-hybridised carbon atoms arranged in a two-dimensional hexagonal lattice, has received much attention due to its remarkable electronic, physical, and chemical properties.1 Graphene is a semimetal owing to the band crossing at the Dirac points of the Brillouin zone which gives it unique conducting properties. Various processes are employed to obtain graphene including chemical exfoliation and mechanical cleavage of graphite.2,3 In addition, as some applications require graphene to be bound to a surface, chemical vapor deposition (CVD) on transition metals is the most common method used for that purpose.4 The gapless feature of graphene, however, limits its implementation in many proposed applications, especially for graphene-based field effect transistors. Thus, more attention has been recently paid to modified graphene and graphene derivatives which allow one to tune graphene's intrinsic properties such as its band gap and opto-electronic properties.5–7Chemical functionalisation of graphene is among the methods used to modify graphene as it can effectively open the band gap by changing the hybridisation of the carbon atoms from sp2 to sp3.8 Successful chemical functionalisation was achieved by chemisorption of e.g. halogen,9 oxygen10 and nitrogen.11 Graphene grown by chemical vapour deposition (CVD) on transition metals substrates has also been intentionally modified by hydrogenation in a plasma12–14 and wet chemical methods.15,16
Graphene is most commonly characterised by Raman spectroscopy,17 but this has a number of drawbacks when it comes to the investigation of functionalised graphene: (1) the D peak in a Raman spectrum only shows that the normally perfect lattice of graphene now has defects, but it does not provide any information regarding the type of defect, i.e. one cannot distinguish between e.g. carbon atom vacancies in the 2D lattice as compared to sp3 carbon atoms on functionalised graphene; (2) while it has been attempted to correlate the ratio of D/G peak intensities to the number density of defects, this calculation is ambiguous for certain coverage regimes,18 and furthermore requires a scaling factor in some cases.19 Alternatively, a number of groups have recently employed sum-frequency generation (SFG) spectroscopy as a means to characterise modified graphene.20–22 In SFG, a resonant infrared (IR) and visible (VIS) laser beam are spatially and temporally overlapped at a surface where in a second-order non-linear process, mixing of the two waves occurs to produce a photon with a frequency which is the sum of the two incoming photons’ frequencies.23 SFG is a powerful surface analysis technique owing to its surface sensitive and interface selective properties and has a major advantage over Raman spectroscopy for the characterisation of functionalised graphene: SFG allows one to identify the functional groups directly based on their vibrational signatures. In addition, it is more sensitive compared to e.g. reflection absorption infrared-red spectroscopy (RAIRS),8,15 and sensitive to hydrogen atoms (e.g. in C–H bonds), unlike X-ray photoelectron spectroscopy.18 Scanning probe microscopies such as atomic force microscopy are very time-consuming,24 while techniques such as secondary ion mass spectrometry (SIMS) are destructive.25
SFG can overcome all these shortcomings and has in fact already been employed to characterise both contaminated and chemically functionalised graphene. Hasselbrink and co-workers used SFG to detect the stretching vibration of hydrogen chemically bound to a graphene sheet on an Ir(111) single crystal surface.22,26,27 Probing contaminations and/or residues on graphene has also been reported using SFG. Tian et al. observed C–H stretches of CH2 moieties which they assigned to polyethylene-like molecules adsorbed on the graphene during the transfer process.21 In contrast, Holroyd et al. observed aliphatic C–H vibrations associated with PMMA which is typically used as a material to transfer CVD graphene from its copper substrate to a substrate of choice,20 in agreement with a SIMS study by Wang et al.25
In the work reported here, we have chemically functionalised CVD graphene on a gold substrate using a benzene diazonium salt to chemisorb phenyl rings to graphene. The C–H vibration of the para-hydrogen atoms on the benzene rings (now attached to graphene) were unambiguously detected by SFG vibrational spectroscopy, taking advantage of their blue-shift compared to aliphatic C–H stretches. Furthermore, we evaluated the surface coverage by relative comparison with a self-assembled monolayer of phenyl rings, and – by exploiting the polarisation-dependent signal intensities in SFG – even determined the orientation of the functional groups relative to the graphene surface. Orientational information for a similar system, namely toluene physisorbed on highly oriented pyrolytic graphite (HOPG), has been previously studied by Geiger and co-workers using SFG; they were able to detect aliphatic C–H stretches with a tilt angle of toluene in the range of 37° to 42° from the surface normal.28
Experimental
Optical setup
Fig. 1 shows the SFG setup which consists of a broadband Mai-Tai Ti:sapphire mode-locked laser (Spectra-Physics) which produces ∼100 fs pulses at 803 nm at a repetition rate of 78.9 MHz. This laser seeds a Ti:Sapphire Legend Elite F-HE (Coherent) amplifier which produces ∼120 fs pulses with a 1 kHz repetition rate. The amplifier is externally pumped by an Evolution 3.0 Q-switched Nd:YLF laser (Spectra-Physics) which produces 100 to 250 ns pulses with a wavelength of 527 nm at a repetition rate of 1 kHz. Half of the output from the amplifier was used as the VIS beam, while the other half was steered to an OPerA Solo Optical Parametric Amplifier (OPA, Coherent) to produce a tuneable IR beam. The bandwidths of the VIS and IR beams were ∼12 cm−1 and ∼200 cm−1, respectively, and the beams were p-polarised during the measurements. An etalon and delay stage were employed to suppress the non-resonant background typically generated from metal surfaces by delaying the narrowband VIS beam by 1 ps.29 The generated SF beam was steered into a spectrograph (Shamrock 750, Andor Technology) coupled to an intensified charge-coupled device (ICCD) camera (iStar ICCD DH 374, Andor Technology).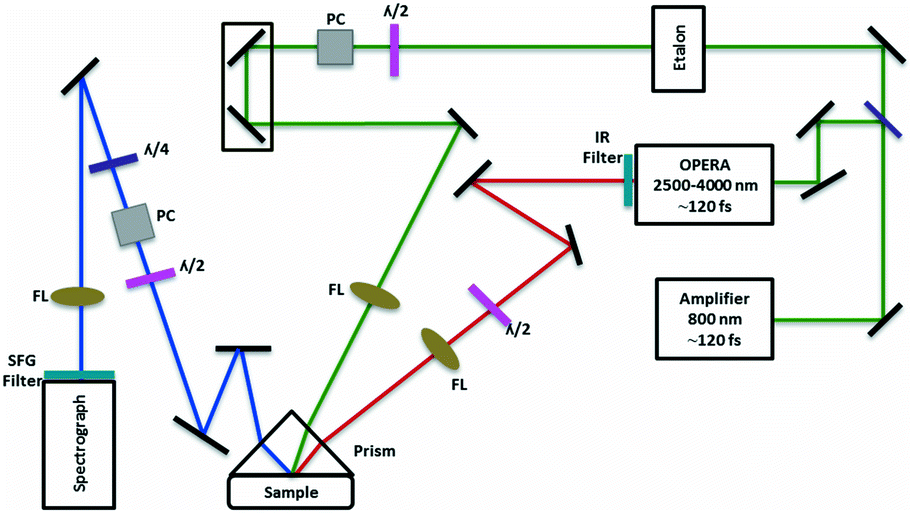 | ||
| Fig. 1 Schematic of the sum-frequency generation spectrometer; the sample is located ∼1 mm below the prism, i.e. total internal reflection conditions are not employed; FL: focussing lens; PC: polarisation cube; λ/2: half-wave plate; λ/4: quarter-wave plate. | ||
Sample preparation
Commercially available CVD graphene, which was grown on copper substrates and transferred onto gold-coated silicon wafers (from Sigma-Aldrich), was purchased from 2-DTech. The diazonium salt was synthesised from aniline and sodium nitrite following the procedure used by Lackner and Fürstner.30 The benzene diazonium salt (0.80 g, 7.61 mmol) was added to a stirred solution of sodium dodecyl sulphate (1 wt%, 10 mL, Alfa Aesar), and the solution was heated (35 °C) to allow the salt to dissolve. The graphene sample was submersed in the solution and left to react for 24 hours. We also prepared control samples by immersing CVD graphene in pure aniline solution (i.e. without the addition of nitrite such that no diazonium salt was formed) for 24 hours. After the reaction, the substrates were washed (ultra-filtrated water) and dried in nitrogen gas.8Results and discussion
Graphene samples were investigated using our SFG spectrometer to deliver vibrational spectra such as those shown in Fig. 2, which display SFG spectra of CVD graphene (a) before and (b) after functionalisation together with the best fits to a Lorentzian lineshape. SFG spectra are typically fitted to eqn (1) which describes the response of a vibrational transition in a typical SFG experiment:31 | (1) |
 | ||
| Fig. 2 Sum-frequency generation spectra (a) before and (b) after functionalisation of CVD graphene with a phenyl group, and (c) of benzenethiol self-assembled monolayers on a gold substrate. Black dashed lines are raw spectra, solid red lines are fits to a Lorentzian lineshape as described in eqn (1). Raw spectra are offset for clarity. All spectra recorded with ppp polarisation (SFG, VIS, IR). | ||
Both spectra (before and after functionalisation) show two peaks at wavenumbers below 3000 cm−1; aliphatic C–H stretches typically appear at those wavelengths,20 and are due to PMMA residue originating from the transfer of CVD graphene from the copper substrate to the gold-coated silicon wafers. The spectrum after functionalisation, however, also shows a clear peak at ∼3064 cm−1 emerging from the non-resonant background; since aromatic C–H stretches typically appear at wavenumbers above 3000 cm−1, we are confident that the peak at 3064 cm−1 can be assigned to the aromatic C–H stretch of the phenyl ring, and is not due to impurities, e.g. PMMA. We are also confident that the observed stretch is due to chemical functionalisation, i.e. the formation of a covalent bond between the graphene and the phenyl ring, as experiments with our control samples (i.e. graphene treated with aniline, but no nitrite) did not show any aromatic C–H stretches which may have been due to physisorbed benzene moieties. We have hence unambiguously identified functionalised graphene using SFG spectroscopy.
The FTIR spectra of the CVD graphene samples before and after functionalisation in Fig. 3 also support the successful phenyl functionalisation of graphene, as two aromatic C–H stretches around 3050 cm−1, although weak, are only observed after functionalisation. Only one of these stretches is also Raman active, hence only one peak appears in the SFG spectrum. In addition, the same two peaks below 3000 cm−1 already observed in the SFG spectra corresponding to C–H stretches of PMMA used in the graphene transfer process are visible again.20,32 We note that the signal-to-noise (S/N) ratio of the aromatic C–H signature is around 60![[thin space (1/6-em)]](https://www.rsc.org/images/entities/char_2009.gif) :1 in the SFG spectrum whereas it is less clear (∼5:1) in the FTIR spectrum.
:1 in the SFG spectrum whereas it is less clear (∼5:1) in the FTIR spectrum.
 | ||
| Fig. 3 Reflection absorption IR spectra of CVD graphene before (dotted black line) and after (solid red line) functionalisation with phenyl moieties. | ||
Raman spectra were also recorded before and after functionalisation using a Renishaw System 1000 Raman spectrometer with a 514 nm excitation laser and ×50 objective lens. The laser power was kept below 1 mW to avoid damaging the graphene sheet.
Fig. 4(a) clearly shows the two main features of pristine graphene, the so-called G and 2D peaks. The G-band around 1560 cm−1 results from the E2g in-plane stretching mode of the C–C bond and is common to all sp2 carbon systems. The 2D-band around 2600 cm−1 is a second-order two-photon process between non-equivalent K points in graphene's first Brillouin zone.4 In the case of the functionalised graphene sample in Fig. 4(b), a prominent D peak is observed which arises due to a breathing mode of A1g symmetry involving phonons near the K zone boundary. This mode is forbidden in perfect graphite and only becomes active in the presence of disorder. Another peak is also observed in the functionalised spectrum labelled as D + D′ peak and accounts for two phonon defect-assisted processes, but its activation mechanism is not fully understood.4 At these coverages, we do not observe a noticeable red-shift of the centre of the G peak in the functionalised samples as has been reported for higher coverages.33,34 Although the aromatic C–H stretch is Raman active and is detected in Raman spectra of neat benzenethiol, we do not observe such a peak above 3000 cm−1 in our Raman spectra (Fig. 4(b)). While such peaks have been observed for benzenethiol adsorbed on gold using surface enhanced Raman spectroscopy (SERS),35–38 the signals in the SER spectra are weak, and given our low surface coverage (see below), the intensities are below our Raman detection limit.
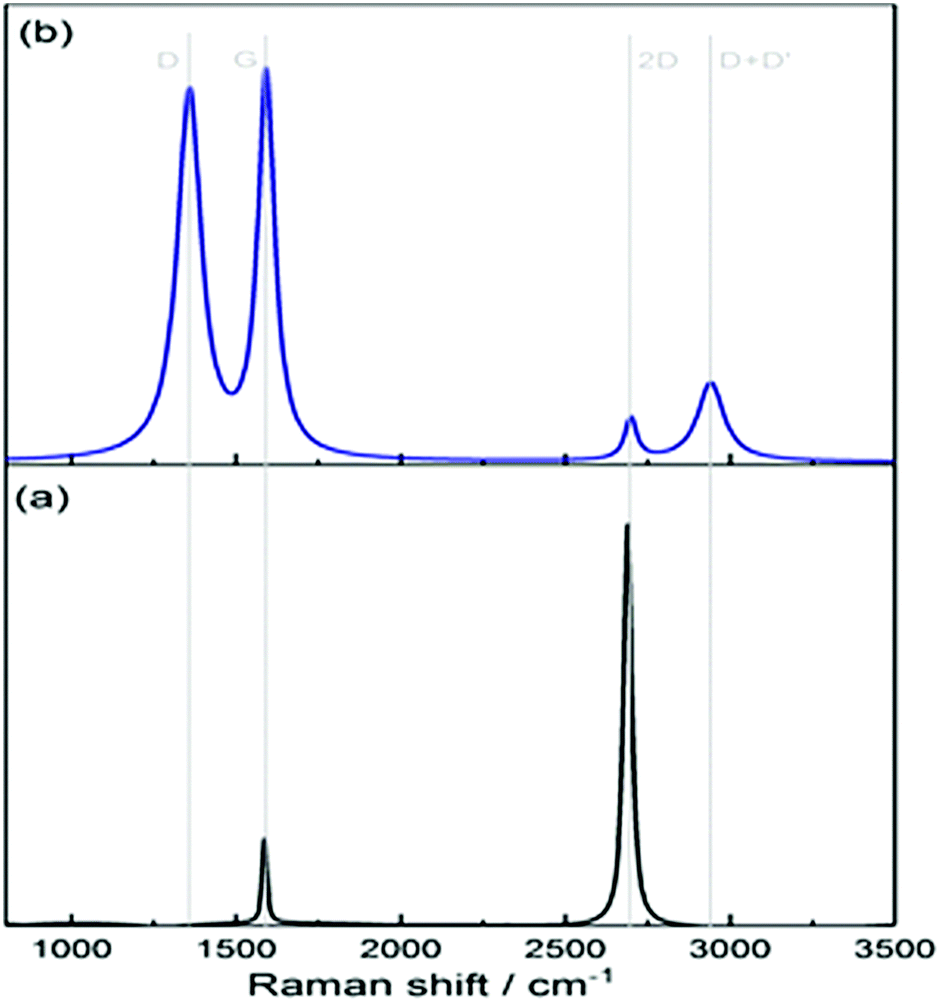 | ||
| Fig. 4 Raman spectra of (a) pristine graphene in black and (b) functionalised graphene in blue. | ||
Returning to the SFG spectra, we note that the observed aromatic stretch is due to vibrations of the bond between the carbon atom and hydrogen atom in the para-position of the phenyl ring. The C–H bonds in the ortho and meta positions of the phenyl group on graphene are pairwise nearly centrosymmetric and hence SFG inactive.
We have also recorded SFG spectra for a structurally similar phenyl compound, namely a self-assembled monolayer (SAM) made of benzenethiol grown on a gold substrate; its SFG spectrum is shown in Fig. 2(c). The distinct peak of the aromatic C–H stretch is observed at a similar wavelength, 3066 cm−1, and likewise can be assigned to the C–H stretch on the para-C atom of the benzene ring, as the other C–H units at the 2,3,5,6 positions are SFG inactive. The recorded spectra of benzenethiol SAMs are also in a good agreement with those recorded by other groups who observed the aromatic C–H stretch at similar frequencies.29,39
The SFG spectrum of the benzenethiol self-assembled monolayer does not only serve to establish the successful chemical functionalisation of graphene with phenyl groups, but can even be used to evaluate the coverage of graphene with phenyl groups. Even though SFG is a non-linear process, we can nonetheless compare the intensities of the aromatic peaks of the benzenethiol SAM with the functionalised graphene. In both cases, only one vibration (C–H in para position) per phenyl ring is responsible for the signal, and both samples are grown on otherwise identical gold-coated silicon wafers. We have kept the conditions in experiments involving the SAMs and the graphene derivatives as close as possible, and the absorption of light as it propagates twice through a single layer of graphene in the reflective SFG experiments can be neglected due to the weak absorption of a single graphene layer.40 If we assume that the transition dipole moment and Raman polarisability of the aromatic C–H stretches in the para position are not too different for the benzenethiol and the phenyl group attached to graphene, then we can draw conclusions about the relative coverages with phenyl groups. We have furthermore assumed that the Fresnel factors (which are notoriously difficult to measure for monolayers), the hyperpolarisability and the orientation of the C–H stretch (close to the surface normal, as discussed later) are the same for the phenyl SAM and the phenyl-decorated graphene sample.
A typical thioalkane SAM consists of around 5 × 10¹⁴ alkane chains per cm2 on a gold substrate.41 Due to the bulky nature of the benzenethiol moiety, the density is reduced to around 4 × 1014 cm−2 for the SAM recorded here.42 If we define the integrated signal intensity of the C–H stretch in the SFG spectra of our SAM in arbitrary units as 1.00 ± 0.26 (standard deviation over four measurements), then the signal intensity of the phenyl group on graphene is 0.51 ± 0.28 on the same normalised scale. Given the quadratic dependence of the signal intensity on the coverage, this means that the coverage of graphene with phenyl groups is ∼(2.8 ± 1.1) × 1014 cm−2, corresponding to functionalisation of ∼7% of all carbon atoms of graphene, and roughly half of the highest coverage theoretically predicted by Jiang et al.43 From Fig. 4, the ratio of intensities I(D)/I(G) in the Raman spectrum of the functionalised graphene yields a coverage of (1.3 ± 0.2) × 1014 cm−2, or 3.5%, i.e. roughly half the coverage of our SFG measurements, but reasonably close given the experimental errors; however, the coverage obtained from the Raman intensities is only derived after making the assumption that one works in the low coverage regime. One might have expected coverages derived from Raman spectroscopy to be larger than those derived from SFG spectroscopy, as Raman also detects defects, while SFG is only sensitive to the actual functional group. However, it seems that almost all defects detected in the Raman spectrum are due to the intended functionalisation, and the results from the Raman and the SFG spectra are not too dissimilar given their respective uncertainty. Despite the drawback of SFG spectroscopy due to its non-linear nature, it has the major advantage that no assumptions are required to extract coverages, i.e. it is less ambiguous compared to Raman spectroscopy, if a well-studied sample surface is available for comparison. More importantly, SFG is also more specific as only the actual functional group (rather than any modification to the 2D lattice that causes defects) contributes to the signal. This work hence presents the first demonstration of SFG spectroscopy to directly derive coverages on functionalised graphene surfaces.
The reason for the lower coverage with phenyl groups compared to the number of available C atoms in graphene as well as compared to the number of benzenethiol groups on gold can be rationalised as follows: during the functionalisation of graphene, the reacting C atoms change from sp2- to sp3-hybridisation.43 The ensuing puckering of the graphene plane puts strain on immediately neighbouring C atoms, which are then more likely to react – in particular in the para position43 – than those atoms further away which remain in the graphene plane. This frequently leads to island formation around the initially-reacting C atoms with relatively high coverages within these islands.15,19 Phenyl rings, however, are fairly bulky, and hence are likely to partially block immediately adjacent reaction sites, thus hindering the formation of islands of high surface concentration. In this case, this limits the number of functionalised groups per area to only ∼7% of the total number of C atoms (∼3.8 × 1015 cm−2). While the size of benzenethiol molecules is comparable, there is no preference for them to attach to gold atoms close to the first gold atom that reacted during SAM formation; also, the planes of the phenyl rings in SAMs are well-known to assemble such that the phenyl rings are parallel to each other, and coverage is maximised, which may not hold true for the functionalised graphene.
A coverage of 50% would correspond to three functional groups being attached to every hexagon in graphene, which in turn means that for our ∼7% coverage, on average every second or third hexagon has one phenyl group covalently attached.
One would intuitively assume that these more isolated phenyl groups stand upright on graphene, i.e. with the para-C–H bond being along the normal of graphene. In order to directly probe the orientation of the phenyl group, we conducted experiments in which we systematically changed the polarisation of the VIS and the resulting SFG beam from p- to s-polarised while keeping the IR beam p-polarised. Following the analysis of Benderskii et al.,44 we find polar (or tilt) angles of the C–H bond in the para-position (and hence of the entire phenyl moiety) relative to the surface normal of (1 ± 3)°, i.e. very close to the surface normal; this is expected, as an isolated sp3-hybridised C atom puckering out of the plane in a tetrahedral configuration will form its forth bond along the normal of the graphene plane. This differs from the theoretical calculation by Dai and co-workers; however, their coverages were higher than ours such that two phenyl groups bind to every hexagon, and the forth bond of a sp3 hybridised C atom from a hexagon in graphene in which at least two C atoms pucker out will no longer be along the surface normal.43
Conclusions
In summary, we reported SFG vibrational spectra of aromatic C–H stretches of CVD graphene functionalised with phenyl groups. We established the concentration of phenyl groups chemisorbed to graphene to be ∼(2.8 ± 1.1) × 1014 cm−2 after our synthetic preparation, i.e. around 7% of all carbon atoms in the graphene lattice have a phenyl group covalently attached to them. Being able to spectroscopically and hence non-invasively quantify the coverage with functional groups can prove exceedingly useful in the production of functionalised graphene as the coverage can be correlated with properties such as e.g. the band gap.Conflicts of interest
There are no conflicts to declare.Acknowledgements
The authors thank the Photon Science Institute for access to the SFG spectrometer and in particular Alisdair Macpherson for technical help; 2-DTech Ltd for the CVD graphene samples; the Organic Materials Innovation Centre (OMIC) at The University of Manchester for access to the FTIR spectrometer. HAS thanks the Saudi Arabian government for funding. This work was supported by the Engineering and Physical Sciences Research Council (EPSRC) in the framework of a DTA studentship (CH).Notes and references
- K. S. Novoselov, V. I. Fal′ko, L. Colombo, P. R. Gellert, M. G. Schwab and K. Kim, Nature, 2012, 490, 192–200 CrossRef CAS PubMed.
- B. Dehghanzad, M. K. Razavi Aghjeh, O. Rafeie, A. Tavakoli, A. Jameie Oskooie, S. Li, C. Jiang, F. Li, H. M. Cheng and R. Menéndez, RSC Adv., 2016, 6, 3578–3585 RSC.
- W. Choi, I. Lahiri, R. Seelaboyina and Y. S. Kang, Crit. Rev. Solid State Mater. Sci., 2010, 35, 52–71 CrossRef CAS.
- J. H. Warner, F. Schaffel, M. Rummeli and A. Bachmatiuk, Graphene: fundamentals and emergent applications, Elsevier, 2013 Search PubMed.
- V. Georgakilas, M. Otyepka, A. B. Bourlinos, V. Chandra, N. Kim, K. C. Kemp, P. Hobza, R. Zboril and K. S. Kim, Chem. Rev., 2012, 112, 6156–6214 CrossRef CAS PubMed.
- T. Kuila, S. Bose, A. K. Mishra, P. Khanra, N. H. Kim and J. H. Lee, Prog. Mater. Sci., 2012, 57, 1061–1105 CrossRef CAS.
- E. Bekyarova, M. E. Itkis, P. Ramesh, C. Berger, M. Sprinkle, W. A. de Heer and R. C. Haddon, J. Am. Chem. Soc., 2009, 131, 1336–1337 CrossRef CAS PubMed.
- Q. H. Wang, Z. Jin, K. K. Kim, A. J. Hilmer, G. L. C. Paulus, C.-J. Shih, M.-H. Ham, J. D. Sanchez-Yamagishi, K. Watanabe, T. Taniguchi, J. Kong, P. Jarillo-Herrero and M. S. Strano, Nat. Chem., 2012, 4, 724–732 CrossRef CAS PubMed.
- H. Lee, M. L. Cohen and S. G. Louie, Appl. Phys. Lett., 2010, 97, 233101 CrossRef.
- V. Schwartz, W. Fu, Y.-T. Tsai, H. M. Meyer, A. J. Rondinone, J. Chen, Z. Wu, S. H. Overbury and C. Liang, ChemSusChem, 2013, 6, 840–846 CrossRef CAS PubMed.
- F. H. Baldovino, A. T. Quitain, N. P. Dugos, S. A. Roces, M. Koinuma, M. Yuasa and T. Kida, RSC Adv., 2016, 6, 113924 RSC.
- Z. Luo, T. Yu, Z. Ni, S. Lim, H. Hu, J. Shang, L. Liu, Z. Shen and J. Lin, J. Phys. Chem. C, 2011, 115, 1422–1427 CAS.
- D. C. Elias, R. R. Nair, T. M. G. Mohiuddin, S. V. Morozov, P. Blake, M. P. Halsall, A. C. Ferrari, D. W. Boukhvalov, M. I. Katsnelson, A. K. Geim and K. S. Novoselov, Science, 2009, 323, 610–613 CrossRef CAS PubMed.
- H. Gao, L. Wang, J. Zhao, F. Ding and J. Lu, J. Phys. Chem. C, 2011, 115, 3236–3242 CAS.
- J. Greenwood, T. H. Phan, Y. Fujita, Z. Li, O. Ivasenko, W. Vanderlinden, H. Van Gorp, W. Frederickx, G. Lu, K. Tahara, Y. Tobe, H. Uji-i, S. F. L. Mertens and S. De Feyter, ACS Nano, 2015, 9, 5520–5535 CrossRef CAS PubMed.
- H. Zhang, E. Bekyarova, J.-W. Huang, Z. Zhao, W. Bao, F. Wang, R. C. Haddon and C. N. Lau, Nano Lett., 2011, 11, 4047–4051 CrossRef CAS PubMed.
- C. Casiraghi, Spectroscopic Properties of Inorganic and Organometallic Compounds, 2012, pp. 29–56 Search PubMed.
- M. M. Lucchese, F. Stavale, E. H. M. Ferreira, C. Vilani, M. V. O. Moutinho, R. B. Capaz, C. A. Achete and A. Jorio, Carbon, 2010, 48, 1592–1597 CrossRef CAS.
- V. G. Kravets, R. Jalil, Y.-J. Kim, D. Ansell, D. E. Aznakayeva, B. Thackray, L. Britnell, B. D. Belle, F. Withers, I. P. Radko, Z. Han, S. I. Bozhevolnyi, K. S. Novoselov, A. K. Geim and A. N. Grigorenko, Sci. Rep., 2015, 4, 5517 CrossRef PubMed.
- C. Holroyd, A. B. Horn, C. Casiraghi and S. P. K. Koehler, Carbon, 2017, 117, 473–475 CrossRef CAS.
- Y. Su, H.-L. Han, Q. Cai, Q. Wu, M. Xie, D. Chen, B. Geng, Y. Zhang, F. Wang, Y. R. Shen and C. Tian, Nano Lett., 2015, 15, 6501–6505 CrossRef CAS PubMed.
- H. Kim, T. Balgar and E. Hasselbrink, Chem. Phys. Lett., 2011, 508, 1–5 CrossRef CAS.
- H. Arnolds, Prog. Surf. Sci., 2011, 86, 1–40 CrossRef CAS.
- S. Son, C. Holroyd, J. Clough, A. Horn, S. P. K. Koehler and C. Casiraghi, Appl. Phys. Lett., 2016, 109, 243103 CrossRef.
- X. Wang, A. Dolocan, H. Chou, L. Tao, A. Dick, D. Akinwande and C. G. Willson, Chem. Mater., 2017, 29, 2033–2039 CrossRef CAS.
- T. Balgar, H. Kim and E. Hasselbrink, J. Phys. Chem. Lett., 2013, 4, 2094–2098 CrossRef CAS PubMed.
- H. Kim, T. Balgar and E. Hasselbrink, Chem. Phys. Lett., 2012, 546, 12–17 CrossRef CAS.
- J. L. Achtyl, A. M. Buchbinder and F. M. Geiger, J. Phys. Chem. Lett., 2012, 3, 280–282 CrossRef CAS PubMed.
- A. Lagutchev, S. A. Hambir and D. D. Dlott, J. Phys. Chem. C, 2007, 111, 13645–13647 CAS.
- A. D. Lackner and A. Fürstner, Angew. Chem., Int. Ed., 2015, 54, 12814–12818 CrossRef CAS PubMed.
- A. D. Curtis, S. B. Reynolds, A. R. Calchera and J. E. Patterson, J. Phys. Chem. Lett., 2010, 1, 2435–2439 CrossRef CAS.
- J. Wang, C. Chen, S. M. Buck and Z. Chen, J. Phys. Chem. B, 2001, 105, 12118–12125 CrossRef CAS.
- A. Eckmann, A. Felten, I. Verzhbitskiy, R. Davey and C. Casiraghi, Phys. Rev. B: Condens. Matter Mater. Phys., 2013, 88, 35426 CrossRef.
- L. G. Cançado, A. Jorio, E. H. M. Ferreira, F. Stavale, C. A. Achete, R. B. Capaz, M. V. O. Moutinho, A. Lombardo, T. S. Kulmala and A. C. Ferrari, Nano Lett., 2011, 11, 3190–3196 CrossRef PubMed.
- M. E. Abdelsalam, P. N. Bartlett, J. J. Baumberg, S. Cintra, T. A. Kelf and A. E. Russell, Electrochem. Commun., 2005, 7, 740–744 CrossRef CAS.
- S. Cintra, M. E. Abdelsalam, P. N. Bartlett, J. J. Baumberg, T. A. Kelf, Y. Sugawara and A. E. Russell, Faraday Discuss., 2006, 132, 191–199 RSC.
- Sang Woo Han, A. Seung Joon Lee and K. Kim, Langmuir, 2001, 17, 6981–6987 CrossRef CAS.
- S. K. Saikin, R. Olivares-Amaya, D. Rappoport, M. Stopa and A. Aspuru-Guzik, Phys. Chem. Chem. Phys., 2009, 11, 9401 RSC.
- S. Li, D. Wu, X. Xu and R. Gu, J. Raman Spectrosc., 2007, 38, 1436–1443 CrossRef CAS.
- A. B. Kuzmenko, E. van Heumen, F. Carbone and D. van der Marel, Phys. Rev. Lett., 2008, 100, 117401 CrossRef CAS PubMed.
- F. Schreiber, Prog. Surf. Sci., 2000, 65, 151–257 CrossRef CAS.
- L.-J. Wan, M. Terashima, H. Noda and M. Osawa, J. Phys. Chem. B, 2000, 104, 3563–3569 CrossRef CAS.
- D. Jiang, B. G. Sumpter and S. Dai, J. Phys. Chem. B, 2006, 110, 23628–23632 CrossRef CAS PubMed.
- D. T. Valley, M. Onstott, S. Malyk and A. V. Benderskii, Langmuir, 2013, 29, 11623–11631 CrossRef CAS PubMed.
| This journal is © the Owner Societies 2018 |