 Open Access Article
Creative Commons Attribution 3.0 Unported Licence
Development of fluorescent sensors based on a combination of PET (photo-induced electron transfer) and FRET (Förster resonance energy transfer) for detection of water†
Daisuke
Jinbo
,
Kazuki
Ohira
,
Keiichi
Imato
 and
Yousuke
Ooyama
 *
*
Department of Applied Chemistry, Graduate School of Engineering, Hiroshima University, 1-4-1 Kagamiyama, Higashi-Hiroshima 739-8527, Japan. E-mail: yooyama@hiroshima-u.ac.jp; Fax: +81 82-424-5494
First published on 12th May 2020
Abstract
Fluorescent sensors DJ-1 and DJ-2 with a large Stokes shift (SS) based on a combination of PET (photo-induced electron transfer) and FRET (Förster resonance energy transfer) have been developed for the detection of water in organic solvents. DJ-1 is composed of anthracene-(aminomethyl)phenylboronic acid ester as the PET-type donor fluorophore and a BODIPY skeleton as the acceptor fluorophore in the FRET process. In contrast, DJ-2 is composed of an anthracene skeleton as the donor fluorophore and a BODIPY-(aminomethyl)phenylboronic acid ester skeleton as the PET-type acceptor fluorophore in the FRET process. In fact, the addition of water to organic solvents containing DJ-1 or DJ-2 caused both PET suppression and energy transfer from the donor fluorophore to the acceptor fluorophore through the FRET process, thus resulting in an enhancement of the fluorescence band originating from the BODIPY skeleton. In addition, the pseudo-SS values of DJ-1 and DJ-2 between the photoabsorption maximum of the anthracene fluorophore and the fluorescence maximum of the BODIPY fluorophore are 7563 cm−1 (141 nm) and 8017 cm−1 (153 nm), respectively, which are significantly higher than those of a typical PET-based fluorescent sensor. It was found that the FRET efficiency for DJ-1 is quantitative, but that for DJ-2 was estimated to be ca. 50% based on time-resolved fluorescence lifetime measurements. Moreover, the detection limit of DJ-1 for water is superior to that of DJ-2. Based on the fluorescence sensing mechanism of DJ-1 and DJ-2 for water, we propose that a combination of a PET-type donor fluorophore and an acceptor fluorophore in the FRET process is one of the most promising molecular designs to create an efficient fluorescent sensor for the detection of water in organic solvents.
Introduction
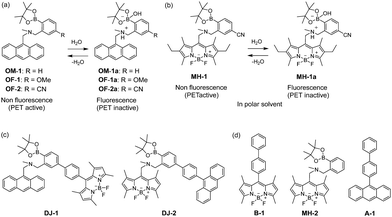
The visualization as well as detection and quantification of water in samples and products, such as solutions, solids, and gas or water on the surface of a substrate, are doubtless significant in not only fundamental study in photochemistry, photophysics and analytical chemistry, but also their potential applications to environmental and quality control monitoring systems and industry.1,2 As a common and classical method for the determination of water content, the Karl Fischer titration method, which utilizes coulometric or volumetric titration to determine the amount of water (0.001–100 wt%) in a sample such as a solution or solid, is widely used in the laboratory and industry. Coulometric titration is suitable for the determination of a low amount of water below 0.1 wt% and it is based on the Karl Fischer reaction (eqn (1) I2 + SO2 + 3Base + ROH + H2O → 2Base·HI + Base·HSO4R and eqn (2) 2I− − 2e− → I2), that is, 1 mole of water will react with 1 mole of iodine generated electrolytically by eqn (2), so that the electricity for 1 milligram of water is equivalent to 10.71 coulombs. Therefore, the Karl Fischer titration method has sufficient accuracy, but it is a batch (ex situ) analysis process, which leads to time-consuming measurements as well as the inability of real-time monitoring and flow (in situ) analysis of the water content. On the other hand, the optical method utilizing colorimetric and fluorescent sensors for the determination of water content has become of considerable scientific and practical concern in recent years, because it allows the visualization, detection and quantification of water content in samples and products using a highly sensitive and quick flow analysis based on the changes in wavelength, intensity and lifetime of photoabsorption and photoluminescence depending on the water content. In fact, to date, some kinds of organic fluorescent sensors and polymers for the determination of water content based on ICT (intramolecular charge transfer),3,4 PET (photo-induced electron transfer),5,6 ESIP (excited state intramolecular proton transfer),7 or solvatochromic properties8 have been designed and synthesized. The optical sensing properties of these fluorescent sensors for the detection and quantification of water content were investigated from the viewpoints of the relationship between ICT, PET, or ESIP characteristics and the intermolecular interaction of the sensor with water molecules. As a result, it was found that most of the previous fluorescent sensors for water content determination, including conjugated polymers and organic fluorescent dyes with ICT and ESIP characteristics, are based on a fluorescence quenching (turn-off) system, that is, the fluorescence intensity of the sensor decreases as a function of water content in organic solvents. However, this fluorescence quenching system makes it difficult to detect a trace amount of water. In contrast, a fluorescence enhancement (turn-on) system exhibiting a fluorescence response with an increase in water content in organic solvents is useful for the visualization, detection and quantification of a trace amount of water in organic solvents. For example, chemodosimeters9 based on water-triggered reactions such as Schiff base hydrolysis and spiro-ring opening reactions, and PET-type fluorescent sensors5,6 based on the suppression of PET from the electron donor part to the photo-excited fluorophore due to the intermolecular interactions between the fluorescent sensor and water molecules belong to the fluorescence enhancement systems for determination of low water content. On the other hand, AIEE (aggregation-induced emission enhancement) of organic fluorophores in the aggregation state has been reported as a fluorescence enhancement system for high water content, that is, an AIEE dye such as tetraphenylethene (TPE) and its derivatives exhibits emission enhancement due to the restricted intramolecular rotation (RIR) in the molecular structures induced by aggregate formation upon addition of large amounts of water (over 40 wt% in almost every case) into the solution.10 In particular, the fluorescence enhancement system based on the PET-type fluorescent sensor for water can detect a reversible change in its immediate environment due to the reversible intermolecular interactions between the sensor and water molecules. Actually, in our previous work, anthracene-(aminomethyl)phenylboronic acid pinacol esters (OM-1, OF-1 and OF-2)6d and BODIPY-(aminomethyl)phenylboronic acid ester (MH-1)6f were designed and synthesized as PET-based fluorescent sensors for the determination of a trace amount of water (Fig. 1a and b). The PET takes place from the nitrogen atom of the amino moiety to the photoexcited fluorophore skeleton in the absence of water, leading to fluorescence quenching. The addition of water to organic solvents containing the PET-based fluorescent sensor causes a drastic and linear enhancement of fluorescence emission as a function of water content, which is attributed to the suppression of PET. The nitrogen atom of the amino moiety is protonated or strongly interacts with water molecules, leading to the formation of the PET inactive species such as OM-1a. Thus, the PET method makes it possible to visualize, detect and determine a trace amount of water in organic solvents. However, the PET-based fluorescent sensor usually has the disadvantage of a very small Stokes shift (SS), causing serious self-quenching and fluorescence detection errors due to photoexcitation and scattering light from the excitation source; SS is the difference in wavelength or frequency units between the maxima of the first photoabsorption band and the fluorescence band. On the other hand, the Förster resonance energy transfer (FRET)-based sensor is useful for applications in biochemistry and environmental research such as nucleic acid and ion analysis, signal transduction, and light harvesting, as well as for designing ratiometric fluorescent sensors.11,12 FRET is well described as an energy transfer process between an excited-state donor fluorophore and a ground-state acceptor fluorophore linked together by a non-conjugated spacer, and, as a result, a fluorescence spectrum from the acceptor fluorophore is observed. In order to achieve an effective FRET, a strong spectral overlap between the donor fluorescence and the acceptor photoabsorption is required. Consequently, the pseudo-SS between the maxima of the donor photoabsorption band and acceptor fluorescence band of the FRET-based sensor is larger than the SS of either the donor or acceptor fluorophore, leading to an effective avoidance of self-quenching and fluorescence detection errors. Thus, in our previous work, in order to develop a fluorescent sensor possessing a large SS for the detection of water in solvents, we have designed and synthesized a PET/FRET-based fluorescent sensor DJ-1 composed of anthracene-(aminomethyl)phenylboronic acid ester as the donor fluorophore with PET characteristics and a BODIPY skeleton as the acceptor fluorophore in the FRET process (Fig. 1c).13 In fact, the enhancement of the fluorescence band originating from the BODIPY skeleton was observed upon addition of water to an acetonitrile solution of DJ-1 due to both the suppression of PET in the donor fluorophore (anthracene-(aminomethyl)phenylboronic acid ester) and the occurrence of FRET from the excited-state donor fluorophore to the ground-state acceptor fluorophore (BODIPY skeleton) (Fig. 2a). It was found that the PET/FRET-based fluorescent dye composed of the PET-type donor fluorophore and the acceptor fluorophore in the FRET process can act as a fluorescent sensor with a large SS for the detection of a trace amount of water in solvents. Thus, it is expected that the development of a PET/FRET-based fluorescent sensor will allow the creation of a fluorescent sensor system with a large SS for the detection of water in solvents, that is, the PET/FRET-based fluorescent sensor has the advantage over a PET-based fluorescent sensor4,5 with a very small SS.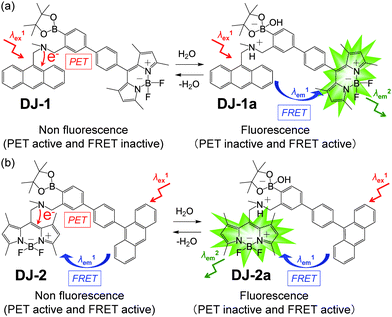 | ||
| Fig. 2 Proposed mechanisms of PET/FRET-type fluorescent sensors (a) DJ-1 and (b) DJ-2 for the detection of water in a solvent. | ||
In this work, in order to provide a direction in molecular design toward creating a highly efficient PET/FRET-based fluorescent sensor for water content determination in organic solvents, we have newly designed and synthesized a PET/FRET-based fluorescent sensor DJ-2, where the anthracene skeleton and BODIPY-(aminomethyl)phenylboronic acid ester skeleton are the donor fluorophore and the PET-type acceptor fluorophore in the FRET process, respectively (Fig. 1c). It is expected that for DJ-2 in absolute solvents, FRET takes place from the excited-state donor fluorophore (anthracene skeleton) to the ground-state acceptor fluorophore (BODIPY skeleton), but fluorescence emission originating from the acceptor fluorophore is not observed due to the occurrence of PET in the BODIPY-(aminomethyl)phenylboronic acid ester skeleton (Fig. 2b). On the other hand, as with the case of DJ-1, the addition of water to organic solvents containing DJ-2 causes both PET suppression and energy transfer from the anthracene to the BODIPY skeleton through the FRET process, thus resulting in the enhancement of the fluorescence band originating from the BODIPY skeleton. Based on the obtained results and the fluorescence sensing mechanism of DJ-1 and DJ-2 for water, we propose a molecular design to create an efficient PET/FRET-based fluorescent sensor for water content determination in organic solvents.
Results and discussion
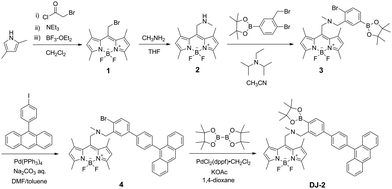
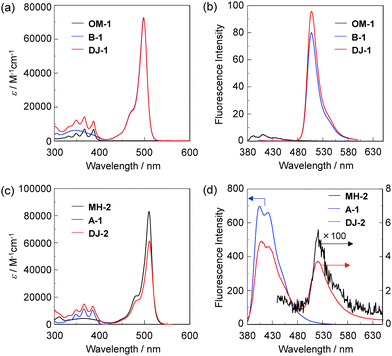
The PET/FRET-based fluorescent sensors DJ-1 and DJ-2 were synthesized according to a stepwise synthetic protocol. The synthesis of DJ-1, which is composed of anthracene-(aminomethyl)phenylboronic acid ester as the PET-type donor fluorophore and BODIPY skeleton as the acceptor fluorophore in the FRET process, as well as the PET-based fluorescent sensor OM-1 and B-1 as a reference to DJ-1 (Fig. 1d), has been reported elsewhere.13 The synthetic pathway of DJ-2, which is composed of an anthracene skeleton as the donor fluorophore and BODIPY-(aminomethyl)phenylboronic acid ester skeleton as the PET-type acceptor fluorophore in the FRET process, is shown in Scheme 1. We first prepared BODIPY 1 by the reaction of 2,4-dimethylpyrrole with bromoacetyl chloride followed by treatment with BF3·OEt2. The BODIPY 1 was reacted with methyl amine to give BODIPY 2. The reaction of 2 with 2-(4-bromo-3-(bromomethyl)phenyl)-4,4,5,5-tetramethyl-1,3,2-dioxaborolane in the presence of N,N-diisopropylethylamine yielded compound 3. A PET/FRET-based derivative 4 was prepared by Suzuki coupling of 9-(4-iodophenyl)anthracene (see Scheme S1 for the synthesis, ESI†) with the compound 3. Finally, we obtained DJ-2 from compound 4 with bis(pinacolato)diboron via the Miyaura borylation reaction. As a reference for DJ-2, the anthracene derivative A-1 was prepared by Suzuki coupling of 9-(4-iodophenyl)anthracene with phenylboronic acid (Fig. 1d, see Scheme S2 for the synthesis, ESI†). Also, we prepared a PET-based fluorescent sensor MH-2 by the reaction of 2 with 2-(2-(bromomethyl)phenyl)-4,4,5,5-tetramethyl-1,3,2-dioxaborolane (Fig. 1d, see Scheme S3 for the synthesis, ESI†).The photoabsorption and fluorescence spectra of OM-1, MH-2, A-1, B-1, DJ-1 and DJ-2 in acetonitrile are shown in Fig. 3. OM-1 and B-1, which are structural components for DJ-1, show photoabsorption bands in the ranges of 300 nm to 400 nm and 420 nm to 520 nm originating from the anthracene skeleton and the BODIPY skeleton, respectively (Fig. 3a). In addition, for B-1, a feeble and broad photoabsorption band was observed in the range of 300 nm to 400 nm. The molar extinction coefficient (εmax) for the photoabsorption maximum (λabsmax = 498 nm) of B-1 is 72![[thin space (1/6-em)]](https://www.rsc.org/images/entities/char_2009.gif) 600 M−1 cm−1, which is significantly higher than that (λabsmax = 366 nm, εmax = 6800 M−1 cm−1) of OM-1. On the other hand, DJ-1 shows two photoabsorption bands in the ranges of 300 nm to 400 nm (λabsmax = 367 nm, εmax = 14
600 M−1 cm−1, which is significantly higher than that (λabsmax = 366 nm, εmax = 6800 M−1 cm−1) of OM-1. On the other hand, DJ-1 shows two photoabsorption bands in the ranges of 300 nm to 400 nm (λabsmax = 367 nm, εmax = 14![[thin space (1/6-em)]](https://www.rsc.org/images/entities/char_2009.gif) 200 M−1 cm−1) and 420 nm to 520 nm (λabsmax = 498 nm, εmax = 72
200 M−1 cm−1) and 420 nm to 520 nm (λabsmax = 498 nm, εmax = 72![[thin space (1/6-em)]](https://www.rsc.org/images/entities/char_2009.gif) 200 M−1 cm−1), which are assigned to the anthracene skeleton and the BODIPY skeleton, respectively. MH-2 and A-1, which are structural components for DJ-2, show photoabsorption bands in the ranges of 430 nm to 540 nm and 300 nm to 400 nm originating from the BODIPY skeleton and the anthracene skeleton, respectively (Fig. 3c). As with the case of B1, for MH-2, a feeble and broad photoabsorption band was observed in the range of 300 nm to 400 nm. The εmax value for λabsmax at 510 nm of MH-2 is 82 900 M−1 cm−1, which is significantly higher than that (λabsmax = 367 nm, εmax = 11 100 M−1 cm−1) of A-1. In addition, as with the case of DJ-1, DJ-2 shows two photoabsorption bands in the ranges of 300 nm to 400 nm (λabsmax = 367 nm, εmax = 14 800 M−1 cm−1) and 430 nm to 540 nm (λabsmax = 511 nm, εmax = 61 300 M−1 cm−1) originating from the anthracene skeleton and the BODIPY skeleton, respectively. In the corresponding fluorescence spectra, OM-1 and B-1 exhibit a fluorescence maximum (λflmax) at 412 nm and 507 nm upon photoexcitation (λex) at 366 nm and 367 nm, respectively (Fig. 3b). It is worth mentioning here that the edge for the fluorescence band of OM-1 reached 500 nm, that is, the photoabsorption spectrum originating from the BODIPY skeleton of B-1 has a spectral overlap with the fluorescence spectrum originating from the anthracene skeleton of OM-1. This result suggests that for DJ-1, the FRET from the anthracene skeleton as the donor fluorophore to the BODIPY skeleton as the acceptor fluorophore occurs upon photoexcitation of the anthracene skeleton. In fact, DJ-1 exhibits only one fluorescence band with the λflmax at 508 nm in the range of 480 nm to 600 nm originating from the BODIPY skeleton upon photoexcitation (λex = 367 nm) of the anthracene skeleton, as well as photoexcitation (λex = 472 nm) of the BODIPY skeleton (Fig. S10, ESI†). On the other hand, upon photoexcitation (λex) at 367 nm, MH-2 exhibits a feeble fluorescence band with the λflmax at 520 nm, whereas A-1 exhibits an intense fluorescence band (fluorescence quantum yield (Φfl) = 57%) with the λflmax at 404 nm, and the edge of the fluorescence band reached 530 nm (Fig. 3d). Therefore, the photoabsorption spectrum originating from the BODIPY skeleton of MH-2 has a spectral overlap with the fluorescence spectrum originating from the anthracene skeleton of A-1, indicating the occurrence of FRET in DJ-2 from the anthracene skeleton to the BODIPY skeleton upon photoexcitation of the anthracene skeleton. However, in contrast to the case of DJ-1, DJ-2 exhibits two fluorescence bands with the λflmax at 407 nm and the λflmax at 520 nm originating from the anthracene skeleton and the BODIPY skeleton, respectively, upon photoexcitation (λex = 367 nm) of the anthracene skeleton, although DJ-2 shows only one fluorescence band with the λflmax at 520 nm originating from the BODIPY skeleton upon photoexcitation (λex = 486 nm) of the BODIPY skeleton (Fig. S12, ESI†). Thus, we considered the differences in the fluorescence properties between DJ-1 and DJ-2 based on the FRET efficiency. Obviously, in absolute acetonitrile, the FRET efficiency for DJ-1 is quantitative due to the fact that no fluorescence band originating from the anthracene skeleton is observed. In contrast, the FRET efficiency for DJ-2 is estimated to be 53% from the equation EFRET = 1 − (τDA/τD) based on time-resolved fluorescence lifetime measurements, where τDA and τD are the donor fluorescence lifetimes in the presence and absence of an acceptor, that is, τDA and τD are the fluorescence lifetimes of DJ-2 (2.0 ns) and A-1 (4.2 ns), respectively. Indeed, this result indicates that the FRET efficiency for DJ-1 is higher than that for DJ-2. The reason for the inferior EFRET value of DJ-2 might be not only the intense fluorescence emission originating from the anthracene skeleton (actually, the Φfl value of A-1 is 57%) that is too strong for the BODIPY skeleton to absorb sufficiently, but also the poor overlap integral of the donor fluorescence spectrum with the acceptor photoabsorption spectrum, compared to the overlap integral in DJ-1, although DJ-1 and DJ-2 have the same spatial distance between the donor and the acceptor fluorophores. Nevertheless, based on the photoabsorption and fluorescence properties of OM-1, MH-2, A-1, B-1, DJ-1 and DJ-2, it is expected that the addition of water to organic solvents containing DJ-1 or DJ-2 causes both PET suppression in the anthracene- or BODIPY-(aminomethyl)phenylboronic acid ester and energy transfer from anthracene skeleton to BODIPY skeleton through the FRET process, thus resulting in the enhancement of the
fluorescence band originating from the BODIPY skeleton. In addition, it was found that the pseudo-SS value of DJ-1 and DJ-2 between the λabsmax of the anthracene skeleton and the λflmax of the BODIPY skeleton is 7563 cm−1 (141 nm) and 8017 cm−1 (153 nm), respectively, which are significantly higher than those of OM-1 (395 cm−1) and B-1 (356 cm−1), and those of MH-2 (377 cm−1) and A-1 (1222 cm−1), respectively.
200 M−1 cm−1), which are assigned to the anthracene skeleton and the BODIPY skeleton, respectively. MH-2 and A-1, which are structural components for DJ-2, show photoabsorption bands in the ranges of 430 nm to 540 nm and 300 nm to 400 nm originating from the BODIPY skeleton and the anthracene skeleton, respectively (Fig. 3c). As with the case of B1, for MH-2, a feeble and broad photoabsorption band was observed in the range of 300 nm to 400 nm. The εmax value for λabsmax at 510 nm of MH-2 is 82 900 M−1 cm−1, which is significantly higher than that (λabsmax = 367 nm, εmax = 11 100 M−1 cm−1) of A-1. In addition, as with the case of DJ-1, DJ-2 shows two photoabsorption bands in the ranges of 300 nm to 400 nm (λabsmax = 367 nm, εmax = 14 800 M−1 cm−1) and 430 nm to 540 nm (λabsmax = 511 nm, εmax = 61 300 M−1 cm−1) originating from the anthracene skeleton and the BODIPY skeleton, respectively. In the corresponding fluorescence spectra, OM-1 and B-1 exhibit a fluorescence maximum (λflmax) at 412 nm and 507 nm upon photoexcitation (λex) at 366 nm and 367 nm, respectively (Fig. 3b). It is worth mentioning here that the edge for the fluorescence band of OM-1 reached 500 nm, that is, the photoabsorption spectrum originating from the BODIPY skeleton of B-1 has a spectral overlap with the fluorescence spectrum originating from the anthracene skeleton of OM-1. This result suggests that for DJ-1, the FRET from the anthracene skeleton as the donor fluorophore to the BODIPY skeleton as the acceptor fluorophore occurs upon photoexcitation of the anthracene skeleton. In fact, DJ-1 exhibits only one fluorescence band with the λflmax at 508 nm in the range of 480 nm to 600 nm originating from the BODIPY skeleton upon photoexcitation (λex = 367 nm) of the anthracene skeleton, as well as photoexcitation (λex = 472 nm) of the BODIPY skeleton (Fig. S10, ESI†). On the other hand, upon photoexcitation (λex) at 367 nm, MH-2 exhibits a feeble fluorescence band with the λflmax at 520 nm, whereas A-1 exhibits an intense fluorescence band (fluorescence quantum yield (Φfl) = 57%) with the λflmax at 404 nm, and the edge of the fluorescence band reached 530 nm (Fig. 3d). Therefore, the photoabsorption spectrum originating from the BODIPY skeleton of MH-2 has a spectral overlap with the fluorescence spectrum originating from the anthracene skeleton of A-1, indicating the occurrence of FRET in DJ-2 from the anthracene skeleton to the BODIPY skeleton upon photoexcitation of the anthracene skeleton. However, in contrast to the case of DJ-1, DJ-2 exhibits two fluorescence bands with the λflmax at 407 nm and the λflmax at 520 nm originating from the anthracene skeleton and the BODIPY skeleton, respectively, upon photoexcitation (λex = 367 nm) of the anthracene skeleton, although DJ-2 shows only one fluorescence band with the λflmax at 520 nm originating from the BODIPY skeleton upon photoexcitation (λex = 486 nm) of the BODIPY skeleton (Fig. S12, ESI†). Thus, we considered the differences in the fluorescence properties between DJ-1 and DJ-2 based on the FRET efficiency. Obviously, in absolute acetonitrile, the FRET efficiency for DJ-1 is quantitative due to the fact that no fluorescence band originating from the anthracene skeleton is observed. In contrast, the FRET efficiency for DJ-2 is estimated to be 53% from the equation EFRET = 1 − (τDA/τD) based on time-resolved fluorescence lifetime measurements, where τDA and τD are the donor fluorescence lifetimes in the presence and absence of an acceptor, that is, τDA and τD are the fluorescence lifetimes of DJ-2 (2.0 ns) and A-1 (4.2 ns), respectively. Indeed, this result indicates that the FRET efficiency for DJ-1 is higher than that for DJ-2. The reason for the inferior EFRET value of DJ-2 might be not only the intense fluorescence emission originating from the anthracene skeleton (actually, the Φfl value of A-1 is 57%) that is too strong for the BODIPY skeleton to absorb sufficiently, but also the poor overlap integral of the donor fluorescence spectrum with the acceptor photoabsorption spectrum, compared to the overlap integral in DJ-1, although DJ-1 and DJ-2 have the same spatial distance between the donor and the acceptor fluorophores. Nevertheless, based on the photoabsorption and fluorescence properties of OM-1, MH-2, A-1, B-1, DJ-1 and DJ-2, it is expected that the addition of water to organic solvents containing DJ-1 or DJ-2 causes both PET suppression in the anthracene- or BODIPY-(aminomethyl)phenylboronic acid ester and energy transfer from anthracene skeleton to BODIPY skeleton through the FRET process, thus resulting in the enhancement of the
fluorescence band originating from the BODIPY skeleton. In addition, it was found that the pseudo-SS value of DJ-1 and DJ-2 between the λabsmax of the anthracene skeleton and the λflmax of the BODIPY skeleton is 7563 cm−1 (141 nm) and 8017 cm−1 (153 nm), respectively, which are significantly higher than those of OM-1 (395 cm−1) and B-1 (356 cm−1), and those of MH-2 (377 cm−1) and A-1 (1222 cm−1), respectively.
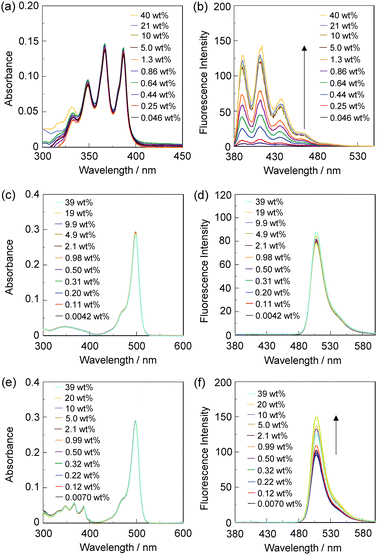
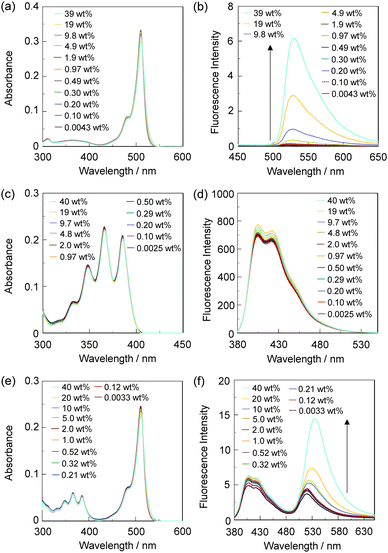
In order to investigate the optical sensing ability of DJ-1 for water in acetonitrile, the photoabsorption and fluorescence spectra of OM-1 and B-1 were measured in acetonitrile that contained various concentrations of water, as a reference to DJ-1 (Fig. 4). The photoabsorption spectra of OM-1 did not undergo appreciable changes upon the addition of water to the acetonitrile solution (Fig. 4a), but the fluorescence spectra of OM-1 underwent an increase in fluorescence intensity at around 415 nm with the increase in the water content, which is attributed to the fluorescence emission originating from the anthracene skeleton due to the suppression of PET (Fig. 4b). On the other hand, the photoabsorption and fluorescence spectra of B-1 did not undergo appreciable changes upon the addition of water to the acetonitrile solution (Fig. 4c, d and Fig. S11, ESI†). As with the case of OM-1, the photoabsorption spectra of DJ-1 show unnoticeable changes upon the addition of water to the acetonitrile solution (Fig. 4e). However, for the corresponding fluorescence spectra, it is worth mentioning here that DJ-1 exhibits an enhancement of fluorescence band at 508 nm originating from the BODIPY skeleton due to the photoexcitation (λex = 367 nm) of the anthracene skeleton upon the addition of water to the acetonitrile solution (Fig. 4f). The enhancement of the fluorescence band levels off when the water content becomes 5.0 wt% as with the case of OM-1. This result indicates that the enhancement of fluorescence band originating from the BODIPY skeleton is attributed to both the suppression of PET in the anthracene-(aminomethyl)phenylboronic acid ester and the occurrence of FRET from the excited-state anthracene fluorophore to the ground-state BODIPY fluorophore upon addition of water to the acetonitrile solution. Moreover, the fluorescence spectra of DJ-1 by the photoexcitation (λex = 472 nm) of the BODIPY skeleton did not undergo appreciable changes in intensity and shape of the fluorescence band originating from the BODIPY skeleton upon addition of water to the acetonitrile solution, which is additional evidence for the FRET process in DJ-1, (Fig. S10, ESI†). Consequently, as shown in Fig. 2a, these facts strongly propose that for DJ-1, the enhancement of the fluorescence band upon addition of water to the solution is due to both the suppression of PET and the occurrence of FRET in the PET/FRET-based fluorophore skeleton. As with the case of DJ-1, the optical sensing ability of DJ-2 for water as well as MH-2 and A-1 in acetonitrile that contained various concentrations of water was investigated by photoabsorption and fluorescence spectral measurements (Fig. 5). The photoabsorption spectra of MH-2 did not undergo appreciable changes upon addition of water to the acetonitrile solution (Fig. 5a). On the other hand, the fluorescence spectra of MH-2 upon photoexcitation (λex = 367 nm) showed an increase in intensity with a red-shift (ca. 15 nm) of the fluorescence peak wavelength at 520 nm in the water content region greater than 5.0 wt%, which is attributed to the fluorescence emission originating from the BODIPY skeleton due to the suppression of PET (Fig. 5b). A similar result was also obtained in the fluorescence spectra of MH-2 upon photoexcitation (λex = 485 nm) of the BODIPY skeleton (Fig. S12, ESI†). On the other hand, the photoabsorption and fluorescence spectra of A-1 did not undergo appreciable changes upon the addition of water to the acetonitrile solution (Fig. 5c, d, and Fig. S13, ESI†). As with the case of MH-2, the photoabsorption spectra of DJ-2 showed unnoticeable changes upon the addition of water to the acetonitrile solution (Fig. 5e). In addition, DJ-2 exhibits an enhancement and red-shift (ca. 15 nm) of the fluorescence band at 520 nm originating from the BODIPY skeleton upon the photoexcitation (λex = 367 nm) of the anthracene skeleton in the water content region greater than 5.0 wt% (Fig. 5f), but the fluorescence band at around 410 nm originating from the anthracene skeleton does not undergo appreciable changes upon the addition of water to the acetonitrile solution, which might be attributed to the low FRET efficiency. This result indicates that the enhancement of fluorescence band originating from the BODIPY skeleton is attributed to both the PET suppression in the BODIPY-(aminomethyl)phenylboronic acid ester and the FRET process from the excited-state anthracene fluorophore to the ground-state BODIPY fluorophore upon addition of water to the acetonitrile solution. As additional evidence for the suppression of PET in DJ-2 upon the addition of water to the acetonitrile solution, the fluorescence spectra of DJ-2 upon photoexcitation (λex = 486 nm) of the BODIPY skeleton showed similar changes to the case of the photoexcitation (λex = 367 nm) of the anthracene skeleton (Fig. S14, ESI†), as well as the case of MH-2. As shown in Fig. 2b, these facts strongly indicate that for DJ-2 in absolute solvent, FRET takes place from the excited-state donor fluorophore (anthracene skeleton) to the ground-state acceptor fluorophore (BODIPY skeleton), although the fluorescence emission originating from the acceptor fluorophore is not observed due to the PET in the BODIPY-(aminomethyl)phenylboronic acid ester skeleton. On the other hand, the addition of water to the acetonitrile solution containing DJ-2 causes both PET suppression and energy transfer from anthracene to BODIPY skeleton through the FRET process, thus resulting in the enhancement of the fluorescence band originating from the BODIPY skeleton. For both DJ-1 and DJ-2, similar results were obtained in the case of THF.
On the basis of the above results, we considered the optical sensing ability of DJ-1 and DJ-2 for water in a solvent. Evidently, as with the case of DJ-1 in absolute acetonitrile, the FRET efficiency of DJ-1 in acetonitrile solution containing water is quantitative due to the fact that no fluorescence band originating from the anthracene skeleton is observed. On the other hand, based on the equation EFRET = 1 − (τDA/τD) and the time-resolved fluorescence lifetime measurements, the FRET efficiency of DJ-2 in an acetonitrile solution containing a water content of 40 wt% is estimated to be 49%, which is a similar value to the case of absolute acetonitrile solution (EFRET = 53%). Therefore, this fact doubtlessly indicates that DJ-1 is composed of a PET-type donor fluorophore and an acceptor fluorophore in the FRET process that can act as an efficient PET/FRET-based fluorescent sensor for water, compared with DJ-2 composed of a donor fluorophore and a PET-type acceptor fluorophore in the FRET process.
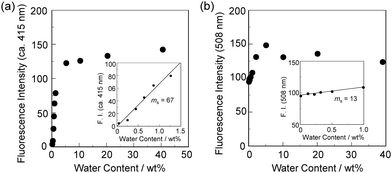
In order to estimate the sensitivity and accuracy of DJ-1 and DJ-2 as a PET/FRET-based fluorescent sensor for the detection of water in solvent, the changes in fluorescence intensity were plotted against the water fraction in acetonitrile (Fig. 6 and 7). As with the case of OM-1 (Fig. 6a), the plot of DJ-1 in the low water content region below 1.0 wt% demonstrated that the fluorescence peak intensity at 508 nm increased linearly as a function of the water content (Fig. 6b inset). Indeed, the correlation coefficient (R2) value for the calibration curve is 0.96, which indicates good linearity. The enhancement of the fluorescence peak intensity levels off in the water content region greater than 5.0 wt%. However, the plots of MH-2 and DJ-2 in the low water content region below 1.0 wt% did not show good linearity for the changes in fluorescence peak intensity at 520–535 nm as a function of the water content. On the other hand, the plots of MH-2 and DJ-2 in the water content region below 40 wt% showed good linearity with the R2 values of 0.99 for MH-2 and 0.96 for DJ-2, that is, the fluorescence peak intensity at 520–535 nm increased linearly as a function of the water content (Fig. 7). In addition, we performed the measurement of Φfl for DJ-1 in the acetonitrile solution with various water contents. Indeed, these Φfl values are in good agreement with the intensity of the fluorescence spectra (Fig. 8). Such a relationship between the Φfl value and the fluorescence intensity was also observed in the case of DJ-2, although the Φfl value was estimated from the fluorescence bands originating from both the anthracene skeleton and the BODIPY skeleton. (Fig. S15, ESI†). These facts also indicate that the fluorescence sensing mechanism of the PET/FRET-based fluorescent sensors for water is based on the suppression of PET and occurrence of FRET by water molecules for DJ-1 and the suppression of PET and the utilization of FRET by water molecules for DJ-2, respectively (Fig. 2). Thus, the detection limit (DL) of DJ-1 was determined from the plot of the fluorescence intensity at 508 nm versus the water fraction in the low water content region below 1.0 wt% (DL = 3.3σ/ms, where σ is the standard deviation of the blank sample and ms is the slope of the calibration curve). The ms and DL values of DJ-1 are 13 and 0.25 wt%, which are inferior to those of the PET-based fluorescent sensor OM-1 (ms = 67, DL = 0.04 wt%) (Fig. 6).6a The ms and DL values of the PET/FRET-based fluorescent sensor may depend on the non-conjugated spacer between the donor fluorophore and the acceptor fluorophore, that is, the substituent on the phenylboronic acid pinacol ester. In fact, the ms value (55) and DL value (0.06 wt%) of OF-1 having a methoxy group as an electron-donating substituent are inferior to those of OM-1, but the ms value (382) and DL value (0.009 wt%) of OF-2 having a cyano group as an electron-withdrawing substituent are superior to those of OM-1 and OF-1.6d On the other hand, the DL values of MH-2 (ms = 0.16) and DJ-2 (ms = 0.24) determined from the plots of the fluorescence intensity at 520–535 nm versus the water fraction below 40 wt% are over 10 wt% (Fig. 7), which are much inferior to those of OM-1 and DJ-1. The inferior DL values of MH-2 and DJ-2 might be attributed to the highly active PET characteristics of the BODIPY-(aminomethyl)phenylboronic acid ester skeleton, compared to the anthracene-(aminomethyl)phenylboronic acid ester skeleton in OM-1 and DJ-1. These results suggest that the ms and DL values of a PET/FRET-based fluorescent sensor for the detection of water can be improved not only by modifying the non-conjugated spacer between the donor fluorophore and the acceptor fluorophore, but also by selecting a PET-type fluorophore. Consequently, this work reveals that DJ-1 composed of a PET-type donor fluorophore and an acceptor fluorophore in the FRET process can act as an efficient PET/FRET-based fluorescent sensor for water, compared with DJ-2 composed of a donor fluorophore and a PET-type acceptor fluorophore in the FRET process.
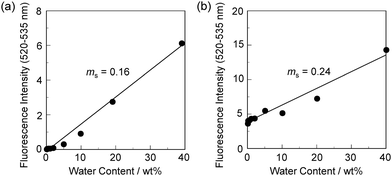 | ||
| Fig. 7 Fluorescence peak intensity at 520–535 nm of (a) MH-2 (λex = 367 nm) and (b) DJ-2 (λex = 367 nm) as a function of water content below 40 wt% in acetonitrile. | ||
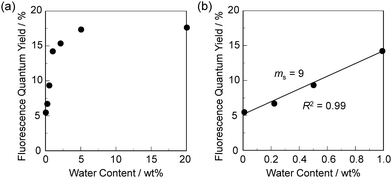 | ||
| Fig. 8 Fluorescence quantum yield of DJ-1 upon photoexcitation at 367 nm as a function of water content (a) below 20 wt% and (b) at 1.0 wt% in acetonitrile. | ||
Conclusions
We have designed and developed two different-types of PET/FRET-based fluorescent sensors (DJ-1 and DJ-2) possessing a large SS for visualization, detection and quantification of water in solvents. DJ-1 is composed of a PET-type donor fluorophore (anthracene-(aminomethyl)phenylboronic acid ester) and an acceptor fluorophore (BODIPY skeleton) in the FRET process, but DJ-2 is composed of a donor fluorophore (anthracene skeleton) and a PET-type acceptor fluorophore (BODIPY-(aminomethyl)phenylboronic acid ester) in the FRET process. This work demonstrated that the FRET efficiency of DJ-1 is quantitative, but that of DJ-2 was estimated to be ca. 50% based on time-resolved fluorescence lifetime measurements. Moreover, it was found that the detection limit of DJ-1 for water is superior to that of DJ-2. Based on the fluorescence sensing mechanisms of DJ-1 and DJ-2 for water, we propose that a combination of a PET-type donor fluorophore and an acceptor fluorophore in the FRET process is one of the most promising molecular designs to create an efficient fluorescent sensor for the detection of water in organic solvents.Experimental
General
Melting points were measured using a Yanaco micro melting point apparatus MP model. IR spectra were recorded using a PerkinElmer Spectrum One FT-IR spectrometer using the ATR method. 1H and 13C NMR spectra were recorded using a Varian-500 (500 MHz) FT NMR spectrometer. High-resolution mass spectral data by ESI and GC-FI were acquired using a Thermo Fisher Scientific LTQ Orbitrap XL and JEOL JMS-T100 GCV 4G, respectively. Photoabsorption spectra were recorded using a SHIMADZU UV-3150 spectrophotometer. Fluorescence spectra were measured using a Hitachi F-4500 spectrophotometer. The fluorescence quantum yields were determined using a HORIBA FluoroMax-4 spectrofluorometer with a calibrated integrating sphere system. Fluorescence decay measurements were performed using a HORIBA DeltaFlex modular fluorescence lifetime system, using a Nano LED pulsed diode excitation source (370 nm). The addition of water to the acetonitrile solutions containing OM-1, B-1, A-1, MH-2, DJ-1 and DJ-2 was made by weight percent (wt%) until 40 wt% because the sensors DJ-1 and DJ-2 precipitated in the water content region greater than 40 wt%. The determination of water content in acetonitrile was done with a MKC-610 and MKA-610 Karl Fischer moisture titrator (Kyoto Electronics manufacturing Co., Ltd) based on Karl Fischer coulometric titration for below 1.0 wt% and volumetric titration for 1.0–40 wt%, respectively.Synthesis
![[thin space (1/6-em)]](https://www.rsc.org/images/entities/char_2009.gif) :
:![[thin space (1/6-em)]](https://www.rsc.org/images/entities/char_2009.gif) hexane = 1
hexane = 1![[thin space (1/6-em)]](https://www.rsc.org/images/entities/char_2009.gif) :
:![[thin space (1/6-em)]](https://www.rsc.org/images/entities/char_2009.gif) 2 as eluent) to give 1 (0.46 g, 14% yield) as a red solid; FT-IR (ATR):
2 as eluent) to give 1 (0.46 g, 14% yield) as a red solid; FT-IR (ATR): ![[small upsilon, Greek, tilde]](https://www.rsc.org/images/entities/i_char_e131.gif) = 2960, 1556, 1504, 1195, 1159, 1066, 1022, 989 cm−1; 1H NMR (500 MHz, CDCl3): δ = 2.54 (s, 12H), 4.79 (s, 2H), 6.10 (s, 2H) ppm; 13C NMR (125 MHz, CDCl3) δ = 14.84, 15.68, 37.30, 122.42, 131.50, 136.07, 141.26, 156.79 ppm; HRMS (ESI): m/z (%): [M + Na+] calcd for C14H16N2BBrF2Na, 363.04502; found 363.04507.
= 2960, 1556, 1504, 1195, 1159, 1066, 1022, 989 cm−1; 1H NMR (500 MHz, CDCl3): δ = 2.54 (s, 12H), 4.79 (s, 2H), 6.10 (s, 2H) ppm; 13C NMR (125 MHz, CDCl3) δ = 14.84, 15.68, 37.30, 122.42, 131.50, 136.07, 141.26, 156.79 ppm; HRMS (ESI): m/z (%): [M + Na+] calcd for C14H16N2BBrF2Na, 363.04502; found 363.04507.
![[thin space (1/6-em)]](https://www.rsc.org/images/entities/char_2009.gif) :
:![[thin space (1/6-em)]](https://www.rsc.org/images/entities/char_2009.gif) hexane = 1
hexane = 1![[thin space (1/6-em)]](https://www.rsc.org/images/entities/char_2009.gif) :
:![[thin space (1/6-em)]](https://www.rsc.org/images/entities/char_2009.gif) 3 as eluent) to give 2 (0.048 g, 72% yield) as an orange solid; m.p. 188–189 °C; FT-IR (ATR):
3 as eluent) to give 2 (0.048 g, 72% yield) as an orange solid; m.p. 188–189 °C; FT-IR (ATR): ![[small upsilon, Greek, tilde]](https://www.rsc.org/images/entities/i_char_e131.gif) = 2951, 1548, 1506, 1193, 1157, 1058, 1024, 968 cm−1; 1H NMR (500 MHz, CDCl3): δ = 2.47 (s, 6H), 2.51 (s, 6H), 2.56 (s, 3H), 3.89 (s, 2H), 6.06 (s, 2H) ppm; 13C NMR (125 MHz, CDCl3): δ = 14.68, 15.58, 36.80, 46.80, 121.89, 132.38, 140.40, 141.28, 155.22 ppm; HRMS (ESI): m/z (%): [M + H]+ calcd for C15H21N3BF2, 292.17911; found 292.17905.
= 2951, 1548, 1506, 1193, 1157, 1058, 1024, 968 cm−1; 1H NMR (500 MHz, CDCl3): δ = 2.47 (s, 6H), 2.51 (s, 6H), 2.56 (s, 3H), 3.89 (s, 2H), 6.06 (s, 2H) ppm; 13C NMR (125 MHz, CDCl3): δ = 14.68, 15.58, 36.80, 46.80, 121.89, 132.38, 140.40, 141.28, 155.22 ppm; HRMS (ESI): m/z (%): [M + H]+ calcd for C15H21N3BF2, 292.17911; found 292.17905.
![[thin space (1/6-em)]](https://www.rsc.org/images/entities/char_2009.gif) :
:![[thin space (1/6-em)]](https://www.rsc.org/images/entities/char_2009.gif) 3 as eluent) to give 3 (0.064 g, 68%yield) as an orange solid; m.p. 202–203 °C; FT-IR (ATR):
3 as eluent) to give 3 (0.064 g, 68%yield) as an orange solid; m.p. 202–203 °C; FT-IR (ATR): ![[small upsilon, Greek, tilde]](https://www.rsc.org/images/entities/i_char_e131.gif) = 2974, 1546, 1508, 1344, 1195, 1159, 1141, 1060, 1016, 964 cm−1; 1H NMR (500 MHz, CDCl3): δ = 1.33 (s, 12H), 2.29 (s, 3H), 2.49 (s, 6H), 2.52 (s, 6H), 3.78 (s, 2H), 3.93 (s, 2H), 6.06 (s, 2H), 7.49 (m, 2H), 7.67 (s, 1H) ppm; 13C NMR (125 MHz, CDCl3): δ = 14.73, 17.52, 25.02, 41.63, 51.83, 59.78, 84.10, 122.28, 128.81, 132.51, 133.47, 134.95, 136.71, 138.02, 140.45, 142.42, 154.96 ppm (one aromatic carbon signal was not observed owing to overlapping resonances); HRMS (ESI): m/z (%): [M + H]+ calcd for C28H37O2N3B2BrF2, 586.22178; found 586.22198.
= 2974, 1546, 1508, 1344, 1195, 1159, 1141, 1060, 1016, 964 cm−1; 1H NMR (500 MHz, CDCl3): δ = 1.33 (s, 12H), 2.29 (s, 3H), 2.49 (s, 6H), 2.52 (s, 6H), 3.78 (s, 2H), 3.93 (s, 2H), 6.06 (s, 2H), 7.49 (m, 2H), 7.67 (s, 1H) ppm; 13C NMR (125 MHz, CDCl3): δ = 14.73, 17.52, 25.02, 41.63, 51.83, 59.78, 84.10, 122.28, 128.81, 132.51, 133.47, 134.95, 136.71, 138.02, 140.45, 142.42, 154.96 ppm (one aromatic carbon signal was not observed owing to overlapping resonances); HRMS (ESI): m/z (%): [M + H]+ calcd for C28H37O2N3B2BrF2, 586.22178; found 586.22198.
![[thin space (1/6-em)]](https://www.rsc.org/images/entities/char_2009.gif) :
:![[thin space (1/6-em)]](https://www.rsc.org/images/entities/char_2009.gif) hexane = 2
hexane = 2![[thin space (1/6-em)]](https://www.rsc.org/images/entities/char_2009.gif) :
:![[thin space (1/6-em)]](https://www.rsc.org/images/entities/char_2009.gif) 1 as eluent) to give 4 (0.25 g, 68% yield) as a red solid; m.p. 222–224 °C; FT-IR (ATR):
1 as eluent) to give 4 (0.25 g, 68% yield) as a red solid; m.p. 222–224 °C; FT-IR (ATR): ![[small upsilon, Greek, tilde]](https://www.rsc.org/images/entities/i_char_e131.gif) = 2951, 1544, 1508, 1305, 1193, 1157, 1076, 1022, 974 cm−1; 1H NMR (500 MHz, CDCl3): δ = 2.41 (s, 3H), 2.51 (s, 6H), 2.59 (s, 6H), 3.86 (s, 2H), 4.03 (s, 2H), 6.09 (s, 2H), 7.36–7.40 (m, 2H), 7.47–7.50 (m, 5H), 7.61 (d, J = 8.2 Hz, 1H), 7.65 (d, J = 2.4 Hz, 1H), 7.70 (d, J = 8.2 Hz, 2H), 7.74 (d, J = 8.8 Hz, 2H), 8.07 (d, J = 8.4 Hz, 2H), 8.53 (s, 1H) ppm; 13C NMR (125 MHz, CDCl3): δ = 14.75, 17.58, 42.26, 52.20, 59.18, 122.39, 125.29, 125.59, 126.86, 127.11, 127.88, 128.13, 128.54, 129.63, 130.33, 131.50, 131.89, 133.16, 133.41, 136.58, 138.27, 139.01, 139.93, 140.13, 140.46, 142.22, 155.18 ppm (one aromatic carbon signal was not observed owing to overlapping resonances); HRMS (ESI): m/z (%): [M + H]+ calcd for C42H38N3BBrF2, 712.23047; found 712.23069.
= 2951, 1544, 1508, 1305, 1193, 1157, 1076, 1022, 974 cm−1; 1H NMR (500 MHz, CDCl3): δ = 2.41 (s, 3H), 2.51 (s, 6H), 2.59 (s, 6H), 3.86 (s, 2H), 4.03 (s, 2H), 6.09 (s, 2H), 7.36–7.40 (m, 2H), 7.47–7.50 (m, 5H), 7.61 (d, J = 8.2 Hz, 1H), 7.65 (d, J = 2.4 Hz, 1H), 7.70 (d, J = 8.2 Hz, 2H), 7.74 (d, J = 8.8 Hz, 2H), 8.07 (d, J = 8.4 Hz, 2H), 8.53 (s, 1H) ppm; 13C NMR (125 MHz, CDCl3): δ = 14.75, 17.58, 42.26, 52.20, 59.18, 122.39, 125.29, 125.59, 126.86, 127.11, 127.88, 128.13, 128.54, 129.63, 130.33, 131.50, 131.89, 133.16, 133.41, 136.58, 138.27, 139.01, 139.93, 140.13, 140.46, 142.22, 155.18 ppm (one aromatic carbon signal was not observed owing to overlapping resonances); HRMS (ESI): m/z (%): [M + H]+ calcd for C42H38N3BBrF2, 712.23047; found 712.23069.
![[small upsilon, Greek, tilde]](https://www.rsc.org/images/entities/i_char_e131.gif) = 2972, 1544, 1508, 1344, 1305, 1193, 1157, 1072, 975 cm−1; 1H NMR (500 MHz, CDCl3): δ = 1.37 (s, 12H), 2.35 (s, 3H), 2.51 (s, 6H), 2.58 (s, 6H), 3.98 (s, 2H), 4.14 (s, 2H), 6.07 (s, 2H), 7.17–7.19 (m, 1H), 7.37–7.40 (m, 2H), 7.47–7.51 (m, 4H), 7.63 (d, J = 7.8 Hz, 1H), 7.73–7.78 (m, 4H), 7.91 (d, J = 7.7 Hz, 1H), 8.07 (d, J = 8.4 Hz, 2H), 8.52 (s, 1H) ppm; 13C NMR (125 MHz, CDCl3): δ = 14.73, 17.49, 24.73, 25.12, 41.51, 51.86, 58.47, 83.79, 122.23, 124.70, 125.28, 125.54, 126.78, 126.99, 127.10, 127.85, 128.51, 130.36, 131.51, 131.80, 133.44, 136.59, 136.80, 138.18, 139.96, 141.28, 142.36, 142.93, 145.91, 154.91 ppm (one aromatic carbon signal was not observed owing to overlapping resonances); HRMS (ESI): m/z (%): [M + H]+ calcd for C48H50O2N3B2F2, 760.40517; found 760.40619.
= 2972, 1544, 1508, 1344, 1305, 1193, 1157, 1072, 975 cm−1; 1H NMR (500 MHz, CDCl3): δ = 1.37 (s, 12H), 2.35 (s, 3H), 2.51 (s, 6H), 2.58 (s, 6H), 3.98 (s, 2H), 4.14 (s, 2H), 6.07 (s, 2H), 7.17–7.19 (m, 1H), 7.37–7.40 (m, 2H), 7.47–7.51 (m, 4H), 7.63 (d, J = 7.8 Hz, 1H), 7.73–7.78 (m, 4H), 7.91 (d, J = 7.7 Hz, 1H), 8.07 (d, J = 8.4 Hz, 2H), 8.52 (s, 1H) ppm; 13C NMR (125 MHz, CDCl3): δ = 14.73, 17.49, 24.73, 25.12, 41.51, 51.86, 58.47, 83.79, 122.23, 124.70, 125.28, 125.54, 126.78, 126.99, 127.10, 127.85, 128.51, 130.36, 131.51, 131.80, 133.44, 136.59, 136.80, 138.18, 139.96, 141.28, 142.36, 142.93, 145.91, 154.91 ppm (one aromatic carbon signal was not observed owing to overlapping resonances); HRMS (ESI): m/z (%): [M + H]+ calcd for C48H50O2N3B2F2, 760.40517; found 760.40619.
Conflicts of interest
There are no conflicts to declare.Acknowledgements
This work was supported by a Grant-in-Aid for Scientific Research on Innovative Areas “Soft Crystals” (No. 2903) (JSPS KAKENHI Grant No. 18H04520) and for Scientific Research (B) (JSPS KAKENHI Grant No. 19H02754), and by Nakanishi Scholarship Foundation.Notes and references
- (a) J. Lee, M. Pyo, S. Lee, J. Kim, M. Ra, W.-Y. Kim, B. J. Park, C. W. Lee and J.-M. Kim, Nat. Commun., 2014, 5, 3736 CrossRef CAS PubMed; (b) T. Maeda and F. Würthner, Chem. Commun., 2015, 51, 7661 RSC; (c) H. S. Jung, P. Verwilst, W. Y. Kim and J. S. Kim, Chem. Soc. Rev., 2016, 45, 1242 RSC; (d) A. Wang, R. Fan, Y. Dong, Y. Song, Y. Zhou, J. Zheng, X. Du, K. Xing and Y. Yang, ACS Appl. Mater. Interfaces, 2017, 9, 15744 CrossRef CAS PubMed; (e) M. Tanioka, S. Kamino, A. Muranaka, Y. Shirasaki, Y. Ooyama, M. Ueda, M. Uchiyama, S. Enomoto and D. Sawada, Phys. Chem. Chem. Phys., 2017, 19, 1209 RSC; (f) S. Song, Y. Zhang, Y. Yang, C. Wang, Y. Zhou, C. Zhang, Y. Zhao, M. Yang and Q. Lin, Analyst, 2018, 143, 3068 RSC; (g) H. Yan, S. Guo, F. Wu, P. Yu, H. Liu, Y. Li and L. Mao, Angew. Chem., Int. Ed., 2018, 57, 3922 CrossRef CAS PubMed.
- (a) Y. Zhou, G. Baryshnikov, X. Li, M. Zhu, H. Ågren and L. Zhu, Chem. Mater., 2018, 30, 8008 CrossRef CAS; (b) P. Kumar, R. Sakla, A. Ghosh and D. A. Jose, ACS Appl. Mater. Interfaces, 2017, 9, 25600 CrossRef CAS PubMed; (c) S. Pawar, U. K. Togiti, A. Bhattacharya and A. Nag, ACS Omega, 2019, 4, 11301 CrossRef CAS PubMed; (d) F. Wu, L. Wang, H. Tang and D. Cao, Anal. Chem., 2019, 91, 5261 CrossRef CAS PubMed; (e) W. Cheng, Y. Xie, Z. Yang, Y. Sun, M.-Z. Zhang, Y. Ding and W. Zhang, Anal. Chem., 2019, 91, 5817 CrossRef CAS PubMed.
- (a) D. Citterio, K. Minamihashi, Y. Kuniyoshi, H. Hisamoto, S. Sasaki and K. Suzuki, Anal. Chem., 2001, 73, 5339 CrossRef CAS PubMed; (b) C.-G. Niu, A.-L. Guan, G.-M. Zeng, Y.-G. Liu and Z.-W. Li, Anal. Chim. Acta, 2006, 577, 264 CrossRef CAS PubMed; (c) C.-G. Niu, P.-Z. Qin, G.-M. Zeng, X.-Q. Gui and A.-L. Guan, Anal. Bioanal. Chem., 2007, 387, 1067 CrossRef CAS PubMed; (d) Z.-Z. Li, C.-G. Niu, G.-M. Zeng and P.-Z. Qin, Chem. Lett., 2009, 38, 698 CrossRef CAS; (e) Z. Li, Q. Yang, R. Chang, G. Ma, M. Chen and W. Zhang, Dyes Pigm., 2011, 88, 307 CrossRef CAS; (f) Y. Zhang, D. Li, Y. Li and J. Yu, Chem. Sci., 2014, 5, 2710 RSC; (g) W. Chen, Z. Zhang, X. Li, H. Ågren and J. Su, RSC Adv., 2015, 5, 12191 RSC.
- (a) S. Tsumura, T. Enoki and Y. Ooyama, Chem. Commun., 2018, 54, 10144 RSC; (b) T. Enoki and Y. Ooyama, Dalton Trans., 2019, 48, 2086 RSC; (c) K. Imato, T. Enoki and Y. Ooyama, RSC Adv., 2019, 9, 31466 RSC.
- (a) Y. Ooyama, M. Sumomogi, T. Nagano, K. Kushimoto, K. Komaguchi, I. Imae and Y. Harima, Org. Biomol. Chem., 2011, 9, 1314 RSC; (b) Y. Ooyama, A. Matsugasako, T. Nagano, K. Oka, K. Kushimoto, K. Komaguchi, I. Imae and Y. Harima, J. Photochem. Photobiol., A, 2011, 222, 52 CrossRef CAS.
- (a) Y. Ooyama, A. Matsugasako, K. Oka, T. Nagano, M. Sumomogi, K. Komaguchi, I. Imae and Y. Harima, Chem. Commun., 2011, 47, 4448 RSC; (b) Y. Ooyama, A. Matsugasako, Y. Hagiwara, J. Ohshita and Y. Harima, RSC Adv., 2012, 2, 7666 RSC; (c) Y. Ooyama, K. Uenaka, A. Matsugasako, Y. Harima and J. Ohshita, RSC Adv., 2013, 3, 23255 RSC; (d) Y. Ooyama, K. Furue, K. Uenaka and J. Ohshita, RSC Adv., 2014, 4, 25330 RSC; (e) Y. Ooyama, S. Aoyama, K. Furue, K. Uenaka and J. Ohshita, Dyes Pigm., 2015, 123, 248 CrossRef; (f) Y. Ooyama, M. Hato, T. Enoki, S. Aoyama, K. Furue, N. Tsunoji and J. Ohshita, New J. Chem., 2016, 40, 7278 RSC; (g) Y. Ooyama, R. Nomura, T. Enoki, R. Sagisaka, N. Tsunoji and J. Ohshita, ChemistrySelect, 2017, 2, 7765 CrossRef CAS; (h) Y. Ooyama, R. Sagisaka, T. Enoki, N. Tsunoji and J. Ohshita, New J. Chem., 2018, 42, 13339 RSC.
- (a) W. Liu, Y. Wang, W. Jin, G. Shen and R. Yu, Anal. Chim. Acta, 1999, 383, 299 CrossRef CAS; (b) H. Mishra, V. Misra, M. S. Mehata, T. C. Pant and H. B. Tripathi, J. Phys. Chem. A, 2004, 108, 2346 CrossRef CAS; (c) A. C. Kumar and A. K. Mishra, Talanta, 2007, 71, 2003 CrossRef CAS PubMed.
- L. Ding, Z. Zhang, X. Li and J. Su, Chem. Commun., 2013, 49, 7319 RSC.
- (a) G. Men, G. Zhang, G. Liang, H. Liu, B. Yang, Y. Pan, Z. Wang and S. Jiang, Analyst, 2013, 138, 2847 RSC; (b) G. Men, C. Chen, C. Liang, W. Han and S. Jiang, Analyst, 2015, 140, 5454 RSC.
- (a) Y. Hong, J. W. Y. Lama and B. Z. Tang, Chem. Commun., 2009, 4332 RSC; (b) Y. Zhang, D. Li, Y. Li and J. Yu, Chem. Sci., 2014, 5, 2710 RSC; (c) J. Mei, N. L. C. Leung, R. T. K. Kwok, J. W. Y. Lam and B. Z. Tang, Chem. Rev., 2015, 115, 11718 CrossRef CAS PubMed; (d) Y.-X. Li, X.-F. Yang, J.-L. Miao and G.-X. Sun, J. Phys. Chem. C, 2016, 120, 21722 CrossRef CAS; (e) F. Wu, Li. Wang, H. Tang and D. Cao, Anal. Chem., 2019, 91, 5261 CrossRef CAS PubMed.
- (a) J. Shao, H. Sun, H. Guo, S. Ji, J. Zhao, W. Wu, X. Yuan, C. Zhang and T. D. James, Chem. Sci., 2012, 3, 1049 RSC; (b) Z. Ma, Y. Ji, Z. Wang, G. Kuang and X. Jia, J. Mater. Chem. C, 2016, 4, 10914 RSC; (c) M. A. Ustimova, A. Yu. Lebedeva, Yu. V. Fedorov, D. V. Berdnikova and O. A. Fedorova, New J. Chem., 2018, 42, 7908 RSC; (d) L. Wang, M. Ren, Z. Li, L. Dai and W. Lin, New J. Chem., 2019, 43, 552 RSC; (e) G. Zhang, R. Ji, X. Kong, F. Ning, A. Liu, J. Cui and Y. Ge, RSC Adv., 2019, 9, 1147 RSC.
- S. Pal, M. Mukherjee, B. Sen, S. Lohar and P. Chattopadhyay, RSC Adv., 2014, 4, 21608 RSC.
- D. Jinbo, K. Imato and Y. Ooyama, RSC Adv., 2019, 9, 15335 RSC.
Footnote |
| † Electronic supplementary information (ESI) available. See DOI: 10.1039/d0ma00139b |
| This journal is © The Royal Society of Chemistry 2020 |

