 Open Access Article
Organized macro-scale membrane size reduction in vanadium redox flow batteries: part 2. Flow-field-informed membrane coverage distribution†
Bronston P.
Benetho
 ,
Abdulmonem
Fetyan
and
Musbaudeen O.
Bamgbopa
 *
*
Research & Development Centre, Dubai Electricity and Water Authority (DEWA), P.O. Box 564, Dubai, United Arab Emirates. E-mail: Musbaudeen.bamgbopa@dewa.gov.ae
First published on 7th May 2024
Abstract
Membranes are a critical component in flowing-electrolyte electrochemical systems like redox flow batteries (RFB), and as such, they contribute significantly to overall RFB stack cost which affects technology adoption. We explore flow-field-informed membrane coverage distribution in this part of the series. Where membrane coverage distribution is specifically informed by the relative positions of the ‘channel’ and ‘land’ in the adopted flow-field design – towards cell/stack cost reduction with minimal compromise in power and efficiency. Simulated performance comparison of a Vanadium RFB cell in 3D with membrane-electrode assemblies (MEA) having full membrane coverage and channel/land-adjacent membrane coverage reductions showed the promise of channel-adjacent membrane coverage reduction across all evaluated flow-field designs. We found that the membrane coverage can be reduced by up to 20% (adjacent to the flow-field channel), with simulations showing less than 1% compromise in power compared to full membrane coverage MEA. We also observed that the prevalent flow-field-informed membrane coverage distribution further influences the spatial variation of electrochemical activity within the cell, consequently being a potential tool to inform cell thermal management.
1. Introduction
Redox Flow Batteries (RFBs) are attractive grid-scale electrochemical energy storage options well-suited for long-duration applications integrating renewable energy sources. Their main advantage is their capability to scale with decoupled power and energy, in addition to long cycle life.1,2 However, some RFB technology challenges requiring continuous attention are low power density and high costs.3,4 Among the RFB components, the membrane is one of the key drivers of both cost5,6 and system performance.7,8 Improvement of RFB membrane design has been the subject of many previous studies. The studies include: using membranes with improved properties (such as high ion selectivity, low electrical resistance, good chemical stability, high mechanical strength, high thermal stability, and high proton conductivity), optimization of membrane thickness and porosity,9–11 and even fully membrane-less systems.12 While most of these previous works tend towards improving performance, they have also often resulted in increased cost through complex membrane preparation/modification steps. These strategies to improve membrane design generally involve the following.i. Enhance mass transport and selective ion transport – leading to improved energy efficiency.
ii. Reduction of membrane degradation and failure to improve the battery cycle life.
iii. Reduction/replacement of expensive membrane material amount to lower cell/stack cost.
As a cost reduction measure (primarily), we recently presented the general concept of organized membrane lateral size reduction in RFB cell architectures.4 The goal of the organized macro-scale-sized membrane coverage reduction within the membrane-electrode assembly (MEA) – as seen in Fig. 1, is to reduce cost while not compromising long-term electrochemical performance.
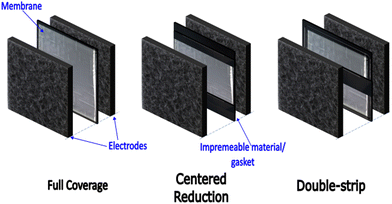 | ||
| Fig. 1 Conventional cell architecture with full membrane coverage in the electrode overlap. Cell architectures presented in Part 1 of this work series,4 with centred and double-strip membrane coverage. | ||
The literature shows that introducing flow fields/patterns in RFBs can significantly improve battery power and energy efficiency.13–15
The flow fields/patterns dictate the flow regime and electrolyte distribution within the MEA, influencing the battery performance by reducing concentration overpotentials.13 Therefore, the apparent advantage of membrane coverage reduction within the MEA is worth investigating from the perspective of the prevalent flow regime induced by different flow fields/patterns.
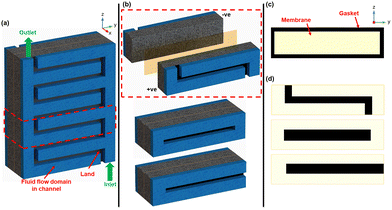
This study investigates flow-field-informed membrane coverage distribution for RFBs using vanadium RFB as a model chemistry/system. Here, the membrane coverage distribution is specifically informed by the relative positions of the ‘channel’ and ‘land’ in the flow-field. In the proposed, membrane coverage will be reduced in the MEA (at different percentages) in areas adjacent to the land or channel. The non-membrane-covered areas in the MEA are replaced with an impermeable medium, like a gasket as seen in Fig. 2.
2. Methodology
Modelling and simulation with interdigitated, parallel, and serpentine flow-fields was adopted to demonstrate the flow-field-informed membrane coverage distribution designs herein. The validated 2D VRFB cell model previously presented in Part 1 of this series4 was upgraded to 3D and applied with the domains of the respective flow-fields incorporated. The 3D model uses a representative unit of the respective flow-fields, including the MEA (see Fig. 2a and b), which helps us perform the simulations with computational efficiency.We avoid re-stating the mathematical formulations governing the Multiphysics model herein, as previously presented in Part 1 of this series.4 However, specific details and peculiarities of the 3D transform of the model cell herein are presented in Table S1 of (ESI†). Table 1 summarizes the nominal values of the main system characteristics of the simulated VRFB cell model. The performance of the various designs presented herein is firstly characterized by steady-state galvanostatic (dis)charge polarization tests at 50% cell state of charge (SOC). The respective concentrations of all active and supporting electrolyte species at analyzed SOCs (see Tables S1 and S2 in ESI†) were obtained from prior transient galvanostatic (dis)charge simulation with full-coverage MEA.
| Operating Condition | Value |
|---|---|
| Cell cross-sectional area | 10 cm2 |
| Flow channel width | 3.2 mm |
| Flow channel depth | 1.6 mm |
| Land width | 1.3 mm |
| Flow-field land-to-channel ratio | |
| Interdigitated | 0.20 |
| Parallel | 0.15 |
| Serpentine | 0.17 |
| Electrolyte formulation | 1.04 M vanadium in 5 M sulphate |
| Polarization SOC | 50% |
| Electrolyte inflow rate | 20 mL min−1 |
Fig. 2c and d show the simulated membrane coverage profiles with gaskets for the interdigitated, parallel, and serpentine flow-field designs tested with full membrane coverage, land-adjacent, and channel-adjacent membrane coverage reductions. For each flow-field design, full membrane (100%) coverage MEA architecture was compared to other MEA architectures having 95%, 90%, 80%, and 70% membrane coverage – corresponding to total membrane size reductions of 5%, 10%, 20%, and 30%, respectively in the MEA. These tested membrane size reductions were adjacent to either the flow channel or land (see Fig. 2). In addition to the discharge polarization tests, steady-state voltage responses at varying SOCs under high current were also adopted to investigate the promising designs presented.
3. Results & discussion
The presented MEA architectures in this work result in some areas (with)out membrane presence in the MEA, where an electrical and ionic insulator like a gasket replaces areas without the membrane. Admittedly, reducing the membrane's overall size is expected to increase ohmic resistance and negatively impact the cell's overall efficiency and power. However, we postulate that an optimal membrane coverage reduction amount and location can minimize cost and performance degradation compared to full membrane coverage.The expectation of an optimal membrane coverage distribution is backed by the fact that, in many electrochemical systems, there is a spatial variation of electrochemical activity in the MEA due to variations in reaction kinetics and mass transport.16,17 In electrochemical systems with flowing electrolytes like RFBs, the established flow regime also strongly influences the electrochemical activity in the electrodes.
3.1. Flow-field-informed membrane coverage distribution
Here we compare the simulated electrochemical tests of cell architectures employing the different flow-fields, with full membrane coverage and reduced membrane coverage adjacent to either flow channel or land. The respective membrane coverage reductions totaled 5%, 10%, 20%, and 30%. This comparison/investigation primarily addresses the following research questions:• Which membrane reduction location (adjacent to flow-field channel or land) gives better cell performance?
• Are the performance trends consistent across the different flow-fields for reasonable membrane coverage reduction percentages?
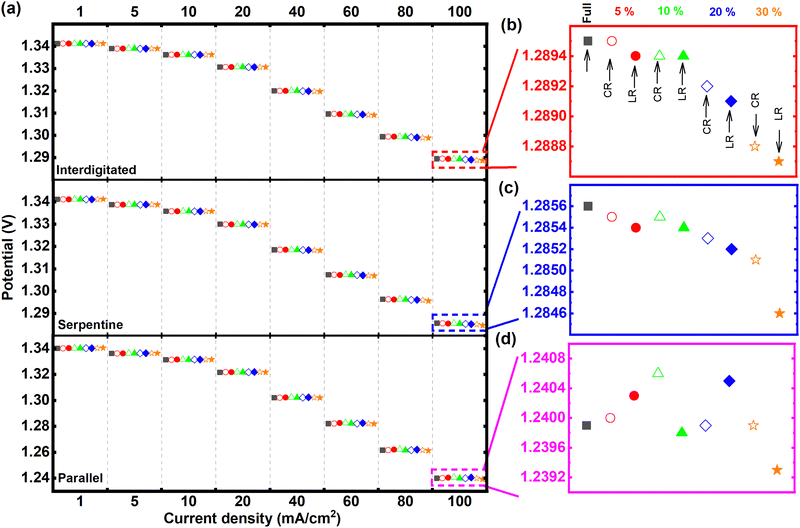
Fig. 3 presents the discharge polarization results (at 50% SOC) for all tested MEA architectures – using the respective quasi-steady-state voltammetric responses while discharging. Among the three tested flow-fields, the interdigitated flow-field-based MEA architectures in Fig. 3a generally recorded the highest power (highest cell potentials at the constant discharge currents) compared to the same MEA architectures with either serpentine or parallel flow-fields. Fig. S1 in (ESI†) summarizes the obtained power densities at 100 mA cm−2 from the tests in Fig. 3. The recorded potentials from interdigitated flow-field were closely followed by the serpentine at all current densities tested. In contrast, the parallel flow-field shows more significant overpotentials with increasing current density. The MEA architectures applying both interdigitated and serpentine flow-fields recorded similar potentials up to 20 mA cm−2, beyond which the interdigitated flow-field shows higher cell potentials. The average cell potential for all MEA architectures was about 3.9% and 0.3% lower for parallel and serpentine, respectively, compared to interdigitated (Fig. 3). These observations from a general comparison of flow-fields are expected – given the dominant flow regimes enforced in the electrodes by the respective flow-fields. With reference to the flow within the electrodes as modeled by the Brinkman equation, the momentum transport enforced within the electrodes is solely diffusive with parallel flow-field, combined diffusive and convective/advective with serpentine flow-field, while solely convective/advective for interdigitated flow-field.13 Therefore, the order of increasing electrolyte flow velocity within the electrodes goes from parallel to serpentine to interdigitated (see Fig. S2 in ESI†).
The discharge polarization results at 100 mA cm−2 are particularly highlighted for performance comparison of the different MEA architectures, given that analyzed effects are most magnified at this highest test current density (see Fig. 3b–d). For the MEA architectures with interdigitated flow-field, as shown in Fig. 3b, the cell potential of 5% channel-adjacent membrane reduction (CR) MEA matches that of full membrane coverage MEA. As expected, cell potential gradually decreases with increasing membrane reduction by up to 30%.
There is also a clear indication of channel-adjacent membrane reduction (CR) outperforming land-adjacent membrane reduction (LR) at all total membrane reduction percentages – for both interdigitated and serpentine flow-fields (also shown in Fig. 3c). We surmise that critical ionic-electronic conduction pathways are more prolonged with LR compared to CR – resulting in higher ohmic overpotentials for LR compared to CR. Although the superiority of CR to LR is reversed for 5% and 20% total membrane reduction with parallel flow-field (Fig. 3d), 30% land-adjacent membrane reduction MEA consistently reported the lowest cell potential for all flow-fields. The recorded cell potentials at 5% and 20% total membrane reduction with parallel flow-field suggests that, even though there is generally a strong influence of ohmic overpotential with increasing membrane reduction (comparing CR and LR), the membrane reduction itself (either CR or LR) can modify the prevalent flow regime in the MEA, thereby influencing the concentration overpotential. These summations from results in Fig. 3 directly address the vital research questions posed earlier.
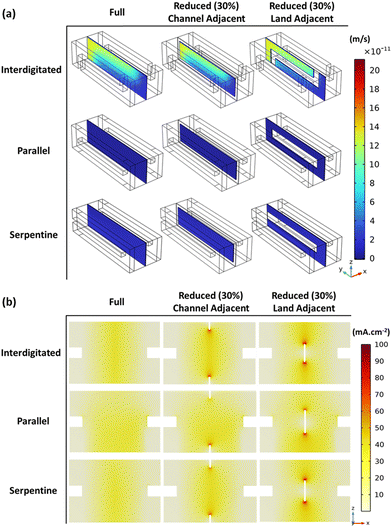
To further explore the observations of results in Fig. 3, Fig. 4 helps visualize momentum transport across the membrane and electrolyte current density – for full membrane coverage and 30% total membrane coverage reduction (channel and land-adjacent).
Active species cross-over across the membrane is induced by both pressure and concentration gradients between the positive and negative sides of the cell. Therefore, Fig. 4a reflects cross-over due to bulk electrolyte transfer (pressure gradient induced) across the membrane. The figure shows higher bulk electrolyte transfer across the membrane near the inflows, as expected (given the higher velocities).
As a result of the velocity magnitudes and prevalent flow distribution, both reduced membrane coverage MEA variants (CR and LR) record lower cross-over compared to the full membrane coverage MEA. The maximum x-component of velocity was at least 0.73% lower – as parts of the membrane have been replaced by the impermeable gasket. The channel-adjacent membrane reduction MEA shows the least cross-over from ∼1.01% lower maximum x-component of velocity for all flow-fields tested. Within channel-adjacent membrane reduction MEA, the membrane is replaced with the impermeable medium at a location of higher-velocity flow. This replacement contributes to the general performance improvement for CR compared to LR which is highlighted in Fig. 3.
Convective flux dominates the total species flux, which is directly proportional to the obtained electrolyte current densities shown for all MEAs in Fig. 4b. The electrolyte current density spikes seen in Fig. 4b where the membrane disconnects for both reduced membrane coverage MEAs confirm the observations regarding prevalent flow regimes with the respective flow-fields. Modification of these flow regimes by the selected membrane reduction MEA architecture (CR or LR) is indicated. Fig. 4b also reflects the earlier mentioned difference in ionic conduction pathways with CR and LR – for the same high total membrane coverage reduction at 30%. Interestingly, even though we explore membrane reduction in this series primarily as a cell/stack cost reduction measure, these discussed spatial variations with membrane reduction at specific regions can help control the spatial variation of electrochemical activity for thermal management. Therefore, meticulous membrane coverage reduction/distribution design not only potentially reduces cost – while minimizing electrochemical performance compromise (compared to full coverage), but it can also aid long-term stack performance to mitigate electrode or cell component degradation. The potential for cell component degradation mitigation is motivated by the fact that the known locations of the membrane reductions can better inform thermal management design – since the locations might be potential hot spots. Conversely, membrane reduction can also be applied to redistribute hot spots which other cell architectures with full membrane coverage may have.
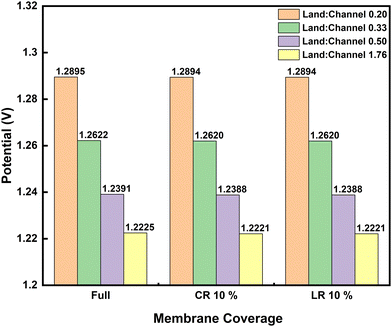
Investigations so far have been based on the nominal cell design to simplify the influences discussed. The applied channel and land widths are similar to widely applied lab-scale 10 cm2 test-cells. It is noteworthy that the land-to-channel coverage ratio affects performance in RFB cells with flow-fields. Fig. 5 compares the discharge polarization at 100 mA cm−2 for interdigitated flow-field cells with varying land-to-channel ratios, where membrane coverage is full or CR/LR at 10%. Land:channel of 0.20 corresponds to the nominal cell with channel width double the land width (see Table 1).
The convective species flux is significantly modified with increasing land-to-channel ratio which results in lower cell potentials seen in Fig. 5. As land-to-channel ratio increases, the flow channels become narrower and shorter – worsening the electrolyte flow distribution in the electrodes.
Increasing land:channel between 0.33 and 0.50 also lead to a peak in pressure drop across the unit cell which subsequently decreases towards land:channel of 1.76, where electrolyte flow simply seeks the shortest path through the electrode towards the outflow (see Fig. S3 in ESI†). There is no significant difference in electrochemical performance between LR and CR at 10% anyway as previously shown – even when land-to-channel coverage ratios change.
Considering the results and discussions thus far, the interdigitated flow-field with 20% channel-adjacent membrane reduction MEA can be considered optimal, especially when operated at higher current densities since its performance is more comparable to full-membrane coverage than when the membrane coverage is reduced by 30%. A comparison of galvanostatic charge–discharge simulation at 100 mA cm−2 is presented in Fig. 6a between this design and its full membrane coverage counterpart. The CR 20% MEA architecture reports around 0.03% higher cell potential during charging, and ∼0.02% lower cell potential during discharge, compared to full membrane coverage MEA. This result indicates slightly lower battery capacity is expected in a sample dynamic galvanostatic charge–discharge cycling with set voltage limits - due to the higher cell potentials at specified SOCs while charging. The capacity per cycle for CR 20% MEA will significantly improve with long-term continuous cycling, given cross-over reduction – when compared to full membrane coverage MEA.
 | ||
Fig. 6 Comparison of interdigitated flow-field with full membrane coverage MEA and 20% channel-adjacent membrane reduction MEA (CR 20%). (a) Simulated single charge–discharge response at 100 mA cm−2. (b) Net power-based efficiency  , at 50% SOC for discharge current densities of 10 mA cm−2 to 150 mA cm−2, where , at 50% SOC for discharge current densities of 10 mA cm−2 to 150 mA cm−2, where  . (c) Percentage reduction in η applying CR 20% MEA compared to full membrane coverage MEA. These steady-state simulations are based on species concentrations in Table S2 of ESI.† . (c) Percentage reduction in η applying CR 20% MEA compared to full membrane coverage MEA. These steady-state simulations are based on species concentrations in Table S2 of ESI.† | ||
Furthermore Fig. 6b presents the net power-based efficiency (η) taking into account both cell power and discounted pumping power, while Fig. 6c magnifies the comparison in η at the varying discharge current densities for both CR 20% and full membrane coverage MEA. The pumping power is the product of electrolyte flow rate and combined pressure drop across both sides of the cell. Net power is used in order to account for gains in crossover reduction from adopting membrane reduction. Fig. 6c shows efficiency compromise (from adopting CR 20% MEA) increases towards 1% as current density increases – compared to full membrane coverage MEA.
3.2. Fabricating MEA architectures with flow-field-informed membrane coverage distribution
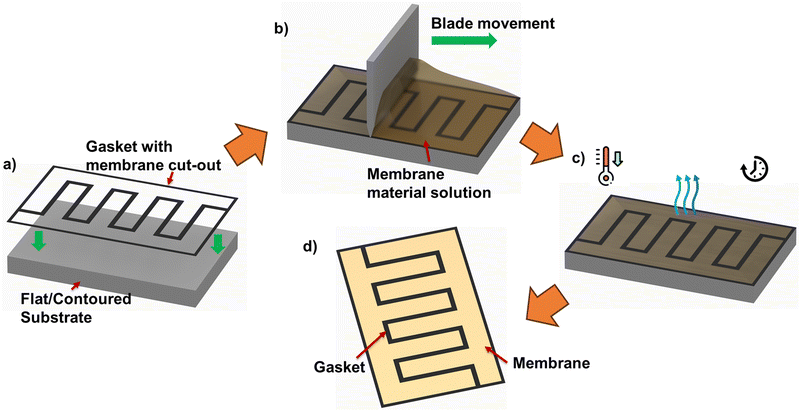
The use of membrane patterning techniques, for instance, thermal imprint lithography, imprinting with patterned silicon molds under high pressure/temperature, electron beam, and plasma etching, have been reported previously for different applications such as fuel cells and solar cells. Nevertheless, such processes are complex, associated with high cost, and therefore not favored for mass production.18–22 Such significantly increased fabrication costs defeat any material cost reduction from using up to 20% less membrane area/coverage.To achieve MEA with membrane (non)presence informed by relative positions of ‘land’ and ‘channel’ in flow-field pattern, other approaches, such as Meyer bar coating, doctor blade coating, and slot die coating, could be promising fabrication techniques for mass production. Meyer bar coating has a lower cost than the other two techniques; however, the scalability of this method is limited and, therefore, less recommended for such applications. Doctor blade and slot die coating is considered to have better scalability than Meyer bar coating. However, despite slot die coating's capability to provide simple 2D patterns and controlled thickness, this technique's complexity is higher than doctor blade coating. To achieve the proposed MEAs, the pre-defined flow-field-informed membrane coverage pattern can be cut out of insulating gasket sheets. Following this, in situ membrane casting using doctor blade coating can be applied to obtain the flow-field-informed membrane coverage distribution – as summarized in the process diagram of Fig. 7.
Specific challenges and ongoing considerations for the fabrication are worthy of note. Even when a cost-effective method appears promising – the method should be able to produce uniform coating due to the edge effects from the membrane cut-out as seen in Fig. 7. Admittedly, the practically applied method should not involve extensive or complicated processes which could defeat the purpose of cost reduction by membrane coverage reduction.
4. Conclusions
This study continues our investigations into organized membrane size/coverage reduction in RFBs by considering flow-field-informed membrane (non)presence in the MEA. Here, the performance of a 3D VRFB cell model was simulated for MEAs having full membrane coverage and compared to both flow-field channel and land-adjacent membrane reduction. The membrane coverage reductions totaled 5%, 10%, 20%, and 30% for MEAs evaluated with interdigitated, parallel, and serpentine flow-fields. Our simulation results indicated that although the reduced membrane coverage MEAs generally reported lower power (compared to full membrane coverage), channel-adjacent membrane reduction is promising.The MEA architecture with channel-adjacent membrane reduction mostly outperformed the land-adjacent counterpart at most membrane coverage percentages with the different considered flow-fields. Channel-adjacent membrane reduction is shown to have higher cross-over prevention in regions of higher velocity within the MEA, in addition to having shorter critical ionic-electronic conduction pathways compared to the land-adjacent counterpart. It is also observed that although there is generally a strong influence of ohmic overpotential with increasing membrane coverage reduction, the membrane reduction choice (either channel or land adjacent) equally influences concentration overpotentials. Overall, the MEA architecture with 20% channel-adjacent membrane reduction in interdigitated flow-field maximizes membrane coverage reduction percentage with the least power compromise - when compared to full membrane coverage MEA with the same flow-field.
From a brief analysis of membrane fabrication state-of art, we also considered the most applicable fabrication techniques towards mass manufacturing the promising MEA with membrane (non)presence informed by relative positions of ‘land’ and ‘channel’ in applied flow-fields. A combination of patterned gasket cutting, and doctor blade coating is promising to avoid significantly increased fabrication costs which can outweigh any material cost reduction from using up to 20% less membrane area/coverage. Furthermore, the flow-field-informed membrane coverage reduction introduced here demonstrates impacts on the spatial variation of electrochemical activity, which can be advantageous in informing cell thermal management to prevent electrode degradation and improve overall stack performance and longevity.
Author contributions
B. P. Benetho: investigation, software, writing (original draft preparation), visualization. A. Fetyan, conceptualization, writing (original draft preparation), writing (review & editing). M. O. Bamgbopa: conceptualization, methodology, investigation, writing (original draft preparation), writing (review & editing).Conflicts of interest
There are no conflicts to declare.Acknowledgements
This research was sponsored by Dubai Electricity and Water Authority (DEWA) R&D centre, Dubai, United Arab Emirates.References
- S. Bukola, Z. Li, J. Zack, C. Antunes, C. Korzeniewski, G. Teeter, J. Blackburn and B. Pivovar, J. Energy Chem., 2021, 59, 419–430 CrossRef CAS.
- A. Fetyan, J. Schneider, M. Schnucklake, G. A. El-Nagar, R. Banerjee, N. Bevilacqua, R. Zeis and C. Roth, ChemElectroChem, 2019, 6, 130–135 CrossRef CAS.
- D. Reynard, C. R. Dennison, A. Battistel and H. H. Girault, J. Power Sources, 2018, 390, 30–37 CrossRef CAS.
- A. Fetyan, M. O. Bamgbopa and B. P. Benetho, J. Energy Chem., 2023, 81, 64–70 CrossRef CAS.
- G. Kear, A. A. Shah and F. C. Walsh, Int. J. Energy Res., 2012, 36, 1105–1120 CrossRef CAS.
- J. Noack, L. Wietschel, N. Roznyatovskaya, K. Pinkwart and J. Tübke, Energies, 2016, 9(8), 627 CrossRef.
- C. H. L. Tempelman, J. F. Jacobs, R. M. Balzer and V. Degirmenci, J. Energy Storage, 2020, 32, 101754 CrossRef.
- P. N. Pintauro, Polym. Rev., 2015, 55, 201–207 CrossRef CAS.
- K. H. Hendriks, S. G. Robinson, M. N. Braten, C. S. Sevov, B. A. Helms, M. S. Sigman, S. D. Minteer and M. S. Sanford, ACS Cent. Sci., 2018, 4, 189–196 CrossRef CAS PubMed.
- Y. Y. Lai, X. Li and Y. Zhu, ACS Appl. Polym. Mater., 2020, 2, 113–128 CrossRef CAS.
- E. C. Montoto, G. Nagarjuna, J. S. Moore and J. Rodríguez-López, J. Electrochem. Soc., 2017, 164, A1688 CrossRef CAS.
- M. O. Bamgbopa, S. Almheiri and H. Sun, Renewable Sustainable Energy Rev., 2017, 70, 506–518 CrossRef CAS.
- S. Kumar and S. Jayanti, J. Power Sources, 2016, 307, 782–787 CrossRef CAS.
- K. Oh and H. Ju, ECS Trans., 2016, 75, 443–453 CrossRef CAS.
- Y. K. Zeng, X. L. Zhou, L. An, L. Wei and T. S. Zhao, J. Power Sources, 2016, 324, 738–744 CrossRef CAS.
- R. Cervantes-Alcalá and M. Miranda-Hernández, J. Appl. Electrochem., 2018, 48, 1243–1254 CrossRef.
- Y.-H. Jiao, M.-Y. Lu, W.-W. Yang, X.-Y. Tang, M. Ye and Q. Xu, Electrochim. Acta, 2022, 403, 139657 CrossRef CAS.
- M. Aizawa and H. Gyoten, J. Electrochem. Soc., 2013, 160, F417 CrossRef CAS.
- A. B. Deshmukh, V. S. Kale, V. M. Dhavale, K. Sreekumar, K. Vijayamohanan and M. V. Shelke, Electrochem. Commun., 2010, 12, 1638–1641 CrossRef CAS.
- J. Kim, J. K. Koh, B. Kim, J. H. Kim and E. Kim, Angew. Chem., Int. Ed., 2012, 51, 6864–6869 CrossRef CAS PubMed.
- J. W. Leem, S. Kim, S. H. Lee, J. A. Rogers, E. Kim and J. S. Yu, Adv. Energy Mater., 2014, 4, 1301315 CrossRef.
- Y. Jeon, D. Jun Kim, J. Kwan Koh, Y. Ji, J. Hak Kim and Y.-G. Shul, Sci. Rep., 2015, 5, 16394 CrossRef CAS PubMed.
Footnote |
| † Electronic supplementary information (ESI) available. See DOI: https://doi.org/10.1039/d4ya00118d |
| This journal is © The Royal Society of Chemistry 2024 |

