DOI:
10.1039/D4YA00007B
(Paper)
Energy Adv., 2024, Advance Article
Evaluation of binderless LTA and SAPO-34 beads as CO2 adsorbents for biogas upgrading in a vacuum pressure swing adsorption setup†
Received
4th January 2024
, Accepted 31st May 2024
First published on 31st May 2024
Abstract
Biogas upgrading by selective adsorption of CO2 using vacuum pressure swing adsorption (VPSA) is a technology that can enable the utilization of the isolated biomethane as a direct replacement for natural gas. In this work, we report for the first time the investigation of LTA and SAPO-34 macroscopic beads with hierarchical porosity as CO2 adsorbents in a VPSA setup. While a binder is generally required to shape zeolites and zeotypes into the macroscopic format (e.g. beads, pellets) needed for application in a VPSA column, in this work binderless LTA and SAPO-34 beads were studied and compared with commercial binder-containing zeolite 4A beads. Binary breakthrough experiments were conducted with a gas mixture mimicking biogas (i.e. 40 vol% CO2 and 60 vol% CH4) in a single adsorption column up to 4 bar. The SAPO-34 beads displayed a slightly steeper breakthrough with less significant tailing compared to the LTA beads, which was ascribed to faster intra-crystalline diffusion due to the different framework structure and the lower adsorption strength of CO2 on SAPO-34 compared to LTA. Notably, both the binderless LTA and SAPO-34 beads displayed a slightly sharper breakthrough and less significant tailing compared to commercial 4A beads. This was attributed to the open and accessible hierarchical pore structure of the binderless beads. The CO2 adsorption capacity for the SAPO-34 beads was relatively stable over 5 cycles, while the LTA and commercial 4A beads displayed a significant decrease in adsorption capacity from the first to the second cycle. For the SAPO-34 beads, a cyclic adsorption capacity at breakthrough around 2 mmol g−1 and a CO2 productivity > 3 mol kg−1 h−1 were achieved. These values are significantly higher than those of the LTA and commercial 4A beads, making the SAPO-34 beads a promising candidate for industrial application in VPSA.
Introduction
Replacement of natural gas by utilizing biogas is an effective strategy to decrease anthropogenic greenhouse gases,1 as this would lead to: (i) a decrease in utilization of fossil fuels, and (ii) the prevention of methane emissions into the atmosphere from agricultural waste (e.g. manure) or landfills.1,2 In order to be usable as a renewable fuel, biogas should first be upgraded to a methane content of at least 95%, by selective separation of CO2.3 CO2 separation using vacuum pressure swing adsorption (VPSA) with solid adsorbents is a straightforward process that has the additional advantage of not generating liquid waste.4,5 In a VPSA process, CO2 is selectively adsorbed from a slightly pressurized gas mixture (e.g. at 4 bar), and then desorbed below atmospheric pressure (< 1 bar).
Zeolites are of interest for application as adsorbents in VPSA processes because they display good CO2 adsorption capacities (1–7 mmol g−1) at low pressure (1 bar), and their physicochemical properties can be tuned to optimize their adsorption behaviour.6 Among the many types of zeolite frameworks, LTA zeolites are commonly the choice for CO2 adsorption due to their high selectivity towards CO2 over CH4 and N2.7–9 LTA zeolites all display the [LTA] framework, consisting of a supercage that can be accessed through 8-membered rings (8MRs), but can differ in their Si/Al ratio (1 for zeolite A, > 1 for zeolite ZK-4). The apertures of the 8MRs through which the framework can be accessed can be adjusted by ion-exchange of the extra-framework cations.10 LTA zeolites in Na-form display 8MRs with apertures of about 0.4 nm, which is close to the kinetic diameter of CO2 (0.33 nm) and CH4 (0.38 nm). Due to the larger kinetic diameter of CH4 compared to CO2, CH4 will experience more severe diffusion limitations through the narrow pore aperture, leading to a high CO2/CH4 selectivity.
Microporous, crystalline silicoaluminophosphates (SAPOs) are zeotypes that display zeolitic structures, but additionally contain phosphorus.11 An important difference between SAPOs and zeolites with low Si/Al ratios (which are typically used for CO2 adsorption) is that SAPOs display a lower electrical field gradient (i.e. the difference in electronegativity between P and O is lower than that between Si or Al and O), leading to a less ionic character of the SAPO-frameworks compared to that of the zeolite analogues. This leads to a less steep adsorption isotherm for SAPOs in the low pressure regime, which is a favourable property for VPSA applications as it implies that milder regeneration conditions (i.e. milder vacuum) are required and higher working capacity (i.e. a higher amount of CO2 is adsorbed in the pressure range between regeneration and adsorption) can be achieved. SAPO-34 is often used for CO2 adsorption due to its straightforward synthesis and the small size of its micropores. It displays the [CHA] framework, which consists of stacked double 6-rings (D6R) producing an elongated supercage.12 Access to the supercage is provided by narrow 8MRs with a window size of 0.38 nm. As the kinetic diameter of CO2 is smaller than that of CH4, diffusion of CO2 through the narrow window will be faster than that of CH4, leading to a high CO2/CH4 selectivity.11
In order to use zeolites or SAPOs in a VPSA process, the materials must be macroscopically shaped into pellets or beads as the application of powders in such process would lead to a significant pressure drop over the adsorption column.13,14 Commonly, about 20 wt% of inert binder is added to the adsorbent powder to achieve the desired macroscopic format (e.g. bead, pellet). However, the binder is inactive for CO2 adsorption and can partially block access to the micropores of the adsorbent, leading to a significant decrease in CO2 adsorption capacity per gram. An alternative that has been investigated recently by our group is the use of binderless zeolite or SAPO beads for CO2 adsorption.15–17 These binderless beads were synthesized using Amberlite IRA-900, an anionic resin, as a hard template. Upon removal of this template, a network of meso- and macropores is obtained, which provide access to the micropores of the adsorbent, thus generating a material with hierarchical porosity. It is expected that the binderless macroscopic beads exhibiting such hierarchical porosity will display favourable kinetics over conventionally shaped, binder-containing macroscopic zeolitic adsorbents. These binderless adsorbents displayed high CO2 adsorption capacities and tuneable CO2/CH4 and CO2/N2 selectivities based on their single component adsorption isotherms,15–17 but their behaviour in a dynamic adsorption process with a mixture of CO2 and CH4 and the adsorption kinetics have not been investigated so far. In this work, we carry out for the first time breakthrough experiments with these binderless zeolitic beads as CO2 adsorbents. It is worth noting that these binderless zeolitic beads are substantially different from other reported binderless zeolite 4A beads, which are prepared using metakaolin as a temporary binder and subsequent granulation and conversion into zeolite 4A18 and have a much larger diameter (1.6–2.5 mm) than our beads (< 1 mm).19 In this study, we selected LTA beads and SAPO-34 beads, which were identified as the most promising binderless zeolitic bead adsorbents in previous work by our group15–17 and compared them with commercial binder-containing zeolite A beads for their applicability in a VPSA system to upgrade biogas. Remarkably, the binderless SAPO-34 beads outperformed both the binderless and commercial LTA beads in terms of cyclic CO2 adsorption capacities and are thus identified as the most promising adsorbent for industrial application in a VPSA system.
Experimental
Materials
Binderless Na-LTA beads and binderless H-SAPO-34 beads were synthesized using methods developed by our group.15,16 Commercial zeolite 4A beads (zeolite composition > 70%, mineral binder < 30%) were obtained from Luoyang Jalon Micro-Nano New Materials Co. Ltd.
Carbon dioxide (CO2, 99.7%) and nitrogen (N2, 99.999%) compressed gas bottles were purchased from SOL Nederland B.V. Methane (CH4, 99.5%) compressed gas bottle was purchased from Linde plc.
Characterization
All beads were ground into a powder to perform powder X-ray diffraction (PXRD) measurements on a Bruker D8 Advance instrument in the range 5–60° with Cu Kα1 radiation (λ = 1.5418 Å) under 40 kV and 40 mA. The slit-width was 2 mm. X-ray fluorescence (XRF) of the beads placed in plastic cups with 6 μm mylar film supporting the sample was measured using an Epsilon 3XLE spectrometer from PANalytical. The fundamental parameters method was used for quantification. All elements were assumed to be in their oxide form and the sum of the obtained concentrations was normalized to 100%. A Micromeritics ASAP 2420 instrument was used for N2 and Ar physisorption experiments at −196 °C. The Brunauer–Emmett–Teller (BET) method was utilized to calculate the specific surface area. The Barrett–Joyner–Halenda (BJH) approach was used to calculate the pore size distribution (from the desorption branch). The T-plot method was used to calculate the micropore volume. For detailed information about the characterization of the LTA and SAPO-34 beads with other techniques, the reader is referred to our previous work.15,16
Pure CO2 and pure CH4 adsorption isotherms
CO2 and CH4 adsorption isotherms were measured at room temperature (25 °C) on a Micromeritics ASAP 2020 instrument. Prior to the tests, the samples were degassed under vacuum at 350 °C for 10 h to eliminate H2O and other possible adsorbates (the binderless zeolites were previously calcined at 600 °C and are thus expected to be stable at the degassing temperature).
Breakthrough experiments
For the theoretical background of breakthrough tests, see ESI† (pages 3–4). The breakthrough experiments to separate mixtures of CO2 and CH4 were conducted on an in-house developed setup. A schematic overview of the setup is given in Fig. 1 (and a picture is shown in Fig. S1, ESI†). Approximately 1.0 g of the adsorbent beads were placed in a stainless steel adsorption column with a length of 9.1 cm and inner diameter of 6.6 mm. The bed height was measured with a caliper for each adsorbent and was ca. 6.1 cm for the LTA beads, 3.9 cm for the 4A-comm beads and 5.7 cm for the SAPO-34 beads. An in-line particulate filter (7 μm) was fixed at the bottom of the adsorption column to support the adsorbent bed. The top of the adsorbent bed was covered with quartz wool, and on top of it a wire gauze with a metal spring were placed. The metal spring was compressed into this position by closing the top of the column with a screw metal fitting. This construction ensured that the adsorbent bed was kept in its place during the adsorption cycles. An electrical trace heating wire (74 W) was coiled around the adsorption column, and a vacuum pump was connected to the top of the column. The reduced pressure achieved with the vacuum pump was controlled using a bleeding valve. Before each experiment, the adsorbent bed was degassed at 20 mbar for 2 h at 200 °C to remove possible adsorbates, such as H2O. After the evacuation, the bed was allowed to cool down to room temperature (23 °C) and the adsorbent bed was pressurized to 4 bar with N2. An adsorption pressure of 4 bar was chosen as zeolites typically display significant CO2 adsorption capacity at relatively low pressures (up to 1 bar) and show only limited additional CO2 adsorption capacity at higher pressures. In order to generate a CO2/CH4 feed with the desired composition (40![[thin space (1/6-em)]](https://www.rsc.org/images/entities/char_2009.gif) :60 vol%), we used a flow of 7.3 mL min−1 CO2 and 10.9 mL min−1 CH4 from the pure gas bottles (achieved with two mass flow controllers operating in the range 2–100 mL min−1). This gas mixture was initially allowed to go through the bypass (Fig. 1) so that the composition of the CO2/CH4 mixture was directly measured by an infrared (IR) sensor (SGX sensortech, Fig. S4, ESI†). Once a stable flow of the desired CO2/CH4 mixture was obtained, the IR sensor was flushed with N2 to bring the initial CO2 concentration to ≤ 0.1%. For this purpose, the CO2/CH4 feed was temporarily vented through a back pressure regulator (BPR2). After the CO2 concentration in the IR sensor reached ≤ 0.1%, the CO2/CH4 mixture flow was switched from the bypass to the adsorption column at a pressure of 4 bar (regulated by BPR1). At this stage, the column started to adsorb (mainly) CO2, which means that the gas flow that reached the IR sensor was essentially pure CH4. After the breakthrough time, as the maximum adsorption capacity of the column was gradually approached, the mixture that reached the IR sensor became gradually richer in CO2, until the gas mixture that reached the sensor had the same 40:60 vol% composition as the feed. At such point, the column was considered saturated and the CO2/CH4 feed was switched to the bypass. It should be noted that the fact that C/C0 = 1 is reached does not necessarily imply that the bed is in equilibrium. Determining whether equilibrium has been reached can be achieved by monitoring the bed temperature (i.e. whether the bed temperature after adsorption has returned to the bed temperature before adsorption).20 However, this is not expected to significantly affect the breakthrough experiments due to the small size of the adsorbent bed used in this work. The adsorbent bed was then regenerated by evacuation at 20 mbar at room temperature. The desorption pressure was chosen to be 20 mbar in order to remove the majority of CO2 from the adsorbent bed. The next cycle started again with pressurization of the bed by N2 and flushing until the IR sensor reached a CO2 concentration (C) of ≤ 0.15%. After the chosen number of cycles, the experiment was terminated.
:60 vol%), we used a flow of 7.3 mL min−1 CO2 and 10.9 mL min−1 CH4 from the pure gas bottles (achieved with two mass flow controllers operating in the range 2–100 mL min−1). This gas mixture was initially allowed to go through the bypass (Fig. 1) so that the composition of the CO2/CH4 mixture was directly measured by an infrared (IR) sensor (SGX sensortech, Fig. S4, ESI†). Once a stable flow of the desired CO2/CH4 mixture was obtained, the IR sensor was flushed with N2 to bring the initial CO2 concentration to ≤ 0.1%. For this purpose, the CO2/CH4 feed was temporarily vented through a back pressure regulator (BPR2). After the CO2 concentration in the IR sensor reached ≤ 0.1%, the CO2/CH4 mixture flow was switched from the bypass to the adsorption column at a pressure of 4 bar (regulated by BPR1). At this stage, the column started to adsorb (mainly) CO2, which means that the gas flow that reached the IR sensor was essentially pure CH4. After the breakthrough time, as the maximum adsorption capacity of the column was gradually approached, the mixture that reached the IR sensor became gradually richer in CO2, until the gas mixture that reached the sensor had the same 40:60 vol% composition as the feed. At such point, the column was considered saturated and the CO2/CH4 feed was switched to the bypass. It should be noted that the fact that C/C0 = 1 is reached does not necessarily imply that the bed is in equilibrium. Determining whether equilibrium has been reached can be achieved by monitoring the bed temperature (i.e. whether the bed temperature after adsorption has returned to the bed temperature before adsorption).20 However, this is not expected to significantly affect the breakthrough experiments due to the small size of the adsorbent bed used in this work. The adsorbent bed was then regenerated by evacuation at 20 mbar at room temperature. The desorption pressure was chosen to be 20 mbar in order to remove the majority of CO2 from the adsorbent bed. The next cycle started again with pressurization of the bed by N2 and flushing until the IR sensor reached a CO2 concentration (C) of ≤ 0.15%. After the chosen number of cycles, the experiment was terminated.
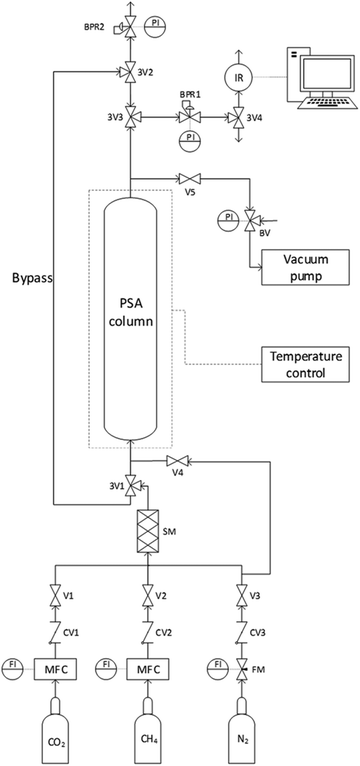 |
| | Fig. 1 Schematic overview of the experimental setup for conducting VPSA breakthrough experiments. V = valve; 3V = three-way valve; BV = bleeding valve (regulating the reduced pressure); CV = check valve (preventing back-flow); FI = flow indicator; FM = variable area flowmeter; MFC = mass flow controller; SM = static mixer; BPR = back pressure regulator; PI = pressure indicator; IR = infrared CO2 sensor. | |
Calculations from breakthrough curves
From the breakthrough curves of the adsorbents, the CO2 adsorption capacity can be calculated. First, the adsorption cycle was performed with glass beads of approximately the same diameter as the adsorbents (0.5 mm to compare with LTA beads with an average diameter of ca. 0.7 mm; 1 mm to compare with SAPO-34 beads with an average diameter of ca. 0.9 mm; and 3 mm to compare with 4A-comm beads with an average diameter of ca. 2 mm), and employing the same volume as the adsorbent bed, in order to determine the time necessary for the CO2/CH4 gas feed to reach the IR sensor when no CO2 is adsorbed (Fig. S5–S10, ESI†). The CO2 adsorption capacity can be calculated using eqn (1):| |
 | (1) |
in which qtot = CO2 adsorption capacity at full utilization (mmol g−1), F = flow rate of CO2 at the inlet (mmol s−1), M = mass of the adsorbent in the column (g), C = concentration of CO2 in the column (%), C0 = CO2 concentration at the inlet of the column (40 vol% CO2). The integral corresponds to the area between the breakthrough curve of the glass beads and that of the adsorbent (Fig. 2A). The CO2 adsorption capacity at breakthrough, qb, is a more practical value because the adsorbent bed in a VPSA is typically regenerated shortly after breakthrough to obtain high CH4 purity, and can be calculated by using eqn (2) (Fig. 2B). In this work, we determined the breakthrough concentration as C/C0 = 0.05, and the time at which this concentration is observed is defined as the breakthrough time tb.| |
 | (2) |
Note: though these equations are commonly employed, it has been proposed that a more reliable estimate of the CO2 adsorption capacity could be obtained by taking into account the change of the gas velocity through the bed caused by CO2 adsorption.21
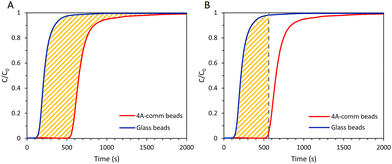 |
| | Fig. 2 (A) Area between the breakthrough curve of the glass beads and that of the adsorbent (yellow) for CO2 adsorption capacity at full utilization; (B) area between the vertical line from the breakthrough time, tb, and the breakthrough curve of the glass beads (yellow) for CO2 adsorption capacity at breakthrough. | |
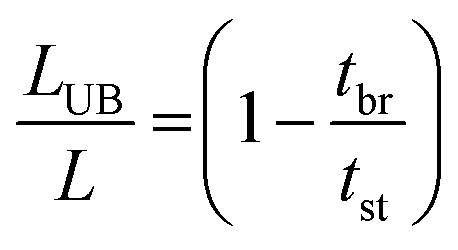
The fraction of the bed being unused during an adsorption cycle can be calculated using eqn (3), and can be used to quantify the mass transfer resistance in the adsorbent bed.22,23
| |
 | (3) |
in which
LUB = length of unused bed (cm),
L = length of bed (cm),
tbr = real breakthrough time (s),
i.e. time of first detection of CO
2, taken as
C/
C0 = 0.003,
tst = stoichiometric time (s), which is at the midpoint of the breakthrough curve (
i.e. at
C/
C0 = 0.5).
Results and discussion
Vacuum pressure swing adsorption (VPSA) is considered one of the most viable techniques for biogas upgrading through selective separation of CO2. The efficiency of VPSA strongly depends on the performance of the adsorbent used in the column. In this context, besides the adsorption capacity and the CO2/CH4 selectivity of the adsorbent, it is important to investigate the dynamic adsorption process with a mixture of CO2 and CH4 mimicking the composition of biogas by means of breakthrough experiments. In this work, we report for the first time such breakthrough tests for two binderless LTA and SAPO-34 beads that were recently found to display promising adsorption capacity and CO2/CH4 selectivity.15,16 First, the binderless LTA beads were compared with commercial binder-containing zeolite A beads (4A-comm) to investigate the differences in CO2 adsorption kinetics between the two bead morphologies. Subsequently, the performance of binderless LTA beads was compared with SAPO-34 beads to study the effect of the type of zeolitic microporous framework on the breakthrough tests with a 40:60 vol% mixture of CO2 and CH4.
LTA beads compared to 4A-comm beads
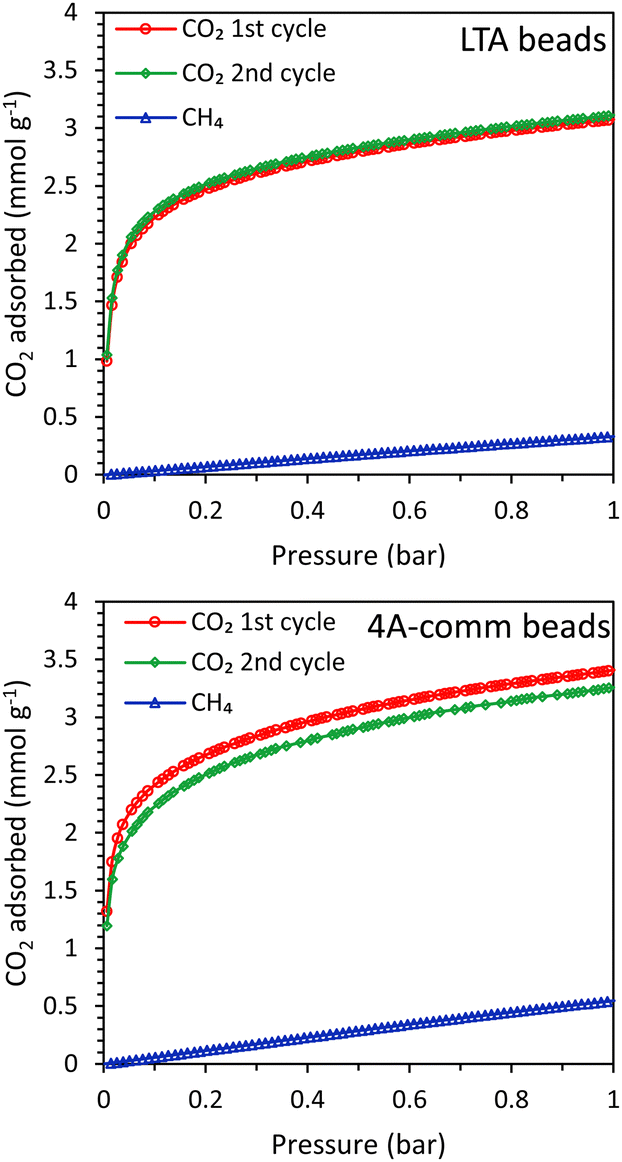
The main difference between the LTA beads developed by our group and the commercial 4A beads, is that the latter were prepared in a conventional method with the use of a binder while our LTA beads are binder-free (for an extensive characterization of the beads, the reader is referred to ref. 15). Though both materials contain crystalline zeolite LTA domains and have a similar degree of crystallinity (based on XRD analysis), their physicochemical properties in terms of surface area, pore volume, Si/Al ratio and Na content differ (Table S1 and Fig. S11–S17, ESI†). Such differences between the two materials led to the observed differences in the single component adsorption isotherms of CO2 and CH4 over LTA and 4A-comm beads (measured in the range 0–1 bar at room temperature, Fig. 3 and Table 1). The CO2 adsorption capacity can be rationalized based on the amount of cations in the zeolite framework acting as adsorption sites, which is related to the amount of Na+-sites, the degree of crystallinity and the accessible surface area and micropore volume of the beads.15 Though the accessible surface area and micropore volume of the LTA beads were higher than those of the 4A-comm beads, the CO2 adsorption capacity of the 4A-comm beads was higher than that of the LTA beads (Table S1 and Table 1, Fig. 3, ESI†). This is attributed to the higher amount of Na+-sites and slightly higher degree of crystallinity of the 4A-comm beads (Table S1, see also ESI,† page 12 for the deconvolution method used). For the LTA beads, the CO2 adsorption capacity for the first and second cycle was almost identical, indicating that no significant amount of chemisorbed CO2 was present after evacuation. Though the initial CO2 adsorption capacity of the 4A-comm beads was higher than that of the LTA beads, the second CO2 adsorption cycle was slightly lower than the first cycle. This was attributed to the presence of a small amount of carbonate-like complexes (i.e. chemisorbed CO2) that could not be removed by evacuation.24 We suggest that these are only observed for the 4A-comm beads and not for the LTA beads due to the slightly higher density of Na+ cations for the 4A-comm beads, as the density of extra-framework cations has been correlated to a higher amount of carbonate-like complexes in zeolite A.25 Additionally, the presence of the binder in the 4A-comm beads can partially block the entrance of the micropores.17,26 Furthermore, the larger amount of Na+ cations in the 4A-comm beads reduces the available pore volume (Table S1, ESI†), which could hamper the diffusion of CO2 through the micropores of the beads. The last two hypotheses are supported by the very low micropore volume that was found for the 4A-comm beads (Table S1, ESI†). Lastly, the diffusion in the 4A-comm beads is expected to be lower due to the lower amount of mesopores compared to the LTA beads, which present an open and hierarchical pore structure (Fig. S17, ESI†). The CO2/CH4 selectivity of the LTA beads was higher than that of the 4A-comm beads (20 compared to 13 at the partial pressures mimicking biogas, i.e. 0.4 bar CO2 and 0.6 bar CH4), which is a beneficial feature as it is expected to reduce the methane slip (loss of methane in the upgrading process) in the VPSA system. The CO2 adsorption capacity of other binderless 4A beads reported in literature19,27 is higher (4.1 mmol g−1 at 1 bar and 303 K) than that of both our binderless LTA beads and 4A-comm beads, while their CO2/CH4 selectivity (around 10 at 0.4 bar CO2 and 0.6 bar CH4) is significantly lower than that of our LTA beads.
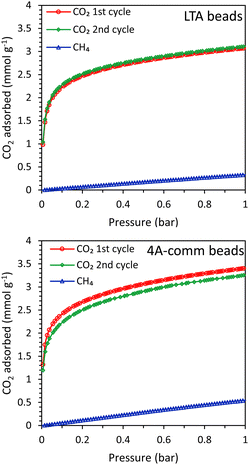 |
| | Fig. 3 CO2 (2 cycles) and CH4 adsorption isotherms of the LTA beads (top) and 4A-comm beads (bottom). | |
Table 1 CO2 adsorption capacity of the LTA and 4A-comm beads as calculated from their single component isotherm and their breakthrough curve
| |
CO2 adsorption capacity from single component testa (mmol g−1) |
CH4 adsorption capacity from single component testb (mmol g−1) |
CO2 adsorption capacity from a CO2–CH4 mixturec (mmol g−1) at full utilization – qtot |
CO2 adsorption capacity from a CO2–CH4 mixturec (mmol g−1) at breakthrough – qb |
| At 1 bar, obtained from the CO2 adsorption isotherm. At 1 bar, obtained from the CH4 adsorption isotherm. Calculated from the CO2 breakthrough curve. Note: the CO2 adsorption capacity from the single component isotherms is given at 1 bar as this is the highest value that can be measured and is the closest to the pressure used in the breakthrough tests (4 bar of CO2:CH4 = 40:60 vol%). |
| LTA |
3.07 |
0.33 |
1.82 |
1.20 |
| 4A-comm |
3.52 |
0.55 |
2.51 |
1.74 |
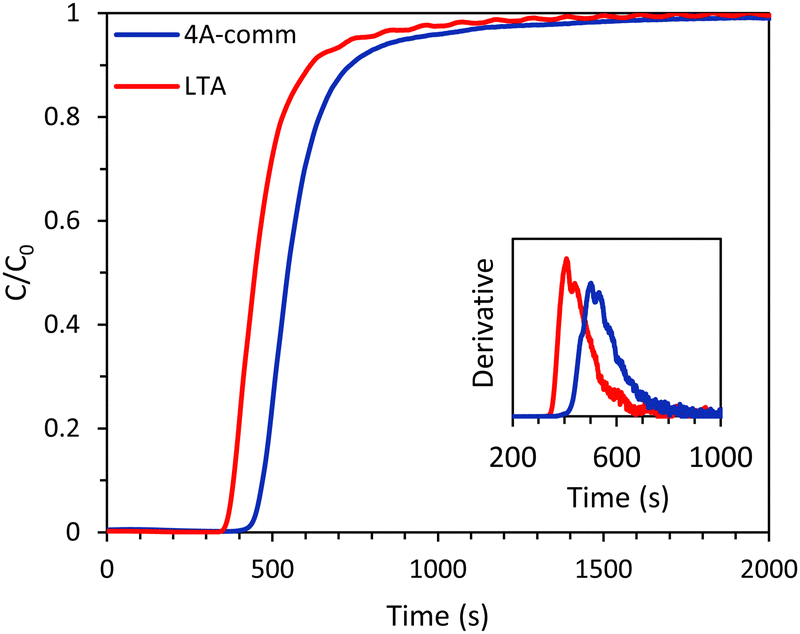
Whilst both the LTA and 4A-comm beads displayed good CO2 adsorption capacity and CO2/CH4 selectivity based on their single component adsorption isotherms, breakthrough experiments with the binary CO2/CH4 mixture mimicking biogas are necessary to investigate the adsorption kinetics and evaluate the applicability of these beads for VPSA. Breakthrough experiments were carried out for both the LTA and 4A-comm beads using a binary gas mixture consisting of CO2/CH4 (40:60 vol%) at 4 bar. The breakthrough curves showed that for both beads essentially all CO2 was initially adsorbed (C/C0 ≈ 0, see Fig. 4) and thus nearly pure CH4 was obtained. The LTA beads showed an earlier breakthrough compared to the 4A-comm beads, as was expected from their lower CO2 adsorption capacity (Fig. 3 and Table 1). However, the breakthrough curve of the LTA beads was slightly steeper compared to that of the 4A-comm beads as can be seen from the derivative of the breakthrough curve, which is higher for the LTA beads compared to the 4A-comm beads (inset of Fig. 4). This indicates that the mass transfer rate for the LTA beads is slightly higher and, consequently, the mass transfer zone for CO2 is slightly smaller, which leads to a more efficient use of the adsorbent bed, i.e. a larger fraction of the adsorbent bed is used during an adsorption cycle.23 The fraction of the bed being unused during an adsorption cycle (eqn (3)) can be utilized to quantify the mass transfer resistance in the adsorbent bed,22 and is related to the shape of the breakthrough curve. The fraction of the adsorbent bed that is unused during dynamic adsorption is higher for the 4A-comm beads (0.27) compared to that of the LTA beads (0.22), which indicates that the 4A-comm beads experience more significant diffusion limitations compared to the LTA beads. It is worth noting that the fraction of the adsorbent that is unused was most likely overestimated with the data obtained by applying eqn (3). This can be inferred from the fact that the glass beads used as a reference should in principle display a very steep breakthrough curve with minimal tailing as no adsorption takes place. However, the glass beads displayed an S-shaped curve (Fig. S5–S10, ESI†). This tailing is attributed to the dead volume in the experimental setup28 and to the employed IR detection method, as discussed in more detail in the ESI.† The slope of the breakthrough curves of the LTA and 4A-comm beads is quite similar to that of the glass beads, which indicates that the actual diffusion limitations inherent to the zeolitic beads are quite small. These observations imply that the obtained values for the fraction of bed that was unused can be utilized for comparison purposes between the adsorbents, though not as absolute values. Additionally, it is worth noting that the ratio between the diameter of the beads and that of the column (dbead/dcolumn) is relatively low for the 4A-comm beads, and this might cause channeling of the adsorbate through the empty space between the particles and the column wall. If channeling occurred, this would lead to a steeper breakthrough curve of the 4A-comm beads. Since the LTA beads have a significantly larger dbead/dcolumn, channeling is less likely to occur than with the 4A-comm beads. This means that our conclusion that the LTA beads display a higher mass transfer rate compared to the commercial 4A beads based on the steeper breakthrough curve is correct though not quantitative, and the difference might actually be underestimated. As both the LTA and 4A-comm beads mostly consist of the LTA zeolitic framework (and a minor amorphous silica/silicoaluminate phase for the LTA beads and an inorganic binder for the 4A-comm beads), we propose that the higher mass transfer rate of the LTA beads can be attributed to faster inter-crystalline diffusion due to the hierarchical porosity of the LTA beads, as the large meso- and macropores facilitate diffusion into the micropores in which the adsorption takes place. Another factor that can explain the more relevant diffusion limitations for the 4A-comm beads compared to the LTA beads is the higher amount of Na+ cations per unit mass in the former (Table S1, ESI†). Na+-sites have been reported to partially block the window regions of LTA zeolites and, therefore, limit intra-crystalline diffusion (i.e. diffusion within the zeolite micropores).29
 |
| | Fig. 4 CO2 breakthrough curves of the LTA and 4A-comm beads. In the inset, the derivative of the breakthrough curves is displayed. Feed: 40 vol% CO2 and 60 vol% CH4 (mimicking biogas). | |
The CO2 adsorption capacity calculated from the binary breakthrough curves was significantly lower for the LTA and the 4A-comm beads compared to the CO2 adsorption capacity calculated from the single component isotherms (Table 1). This discrepancy is attributed to a combination of several factors. A first, major factor is that for the binary gas mixture, both CO2 and CH4 compete for the adsorption sites. Although the adsorption capacity of CO2 is much higher than that of CH4 based on the single component isotherms, the total adsorption capacity of CO2 in a binary gas mixture is expected to be lower than that of the single component isotherm due to the competition with CH4 for the adsorption sites. A second factor that has been proposed to lead to an underestimate of the adsorption capacity if this is calculated from the breakthrough curve, is the change of the gas velocity through the bed as a consequence of CO2 adsorption, with this effect being more significant if the feed has a high molar fraction of CO2 (as in the case of biogas).21 Additionally, experimental and instrumental factors can play a role. For the single-component CO2 adsorption isotherms, the mass of the sample after degassing was used to calculate the adsorption capacity (in mmol g−1). During the degassing step, H2O and other possible adsorbates were removed from the adsorbent and this typically yields a mass that is about 18% lower compared to the mass before degassing. For the breakthrough curves, the sample mass before degassing was used as the degassing step was performed in the adsorption column and the sample cannot be removed and weighed again before the breakthrough test (as this would lead to new adsorption of H2O or other adventitious adsorbates). Additionally, the column degassing (200 °C, 20 mbar, 2 h) may not achieve complete removal of adsorbed H2O. Finally, when measuring the single-component CO2 adsorption isotherm, the equipment waits until equilibrium is achieved at each pressure and thus more time is allowed for CO2 to diffuse into the zeolitic micropores. It is also worth noting that for both beads the CO2 adsorption capacity at breakthrough was significantly lower compared to that at full utilization (Table 1), due to the S-shape of their breakthrough curves (Fig. 2, eqn (2)). For application in VPSA, the CO2 adsorption capacity at breakthrough is a more practical value, as the adsorption cycle in a VPSA system is generally terminated shortly after the breakthrough in order to achieve high purity of the methane-rich outlet gas stream.
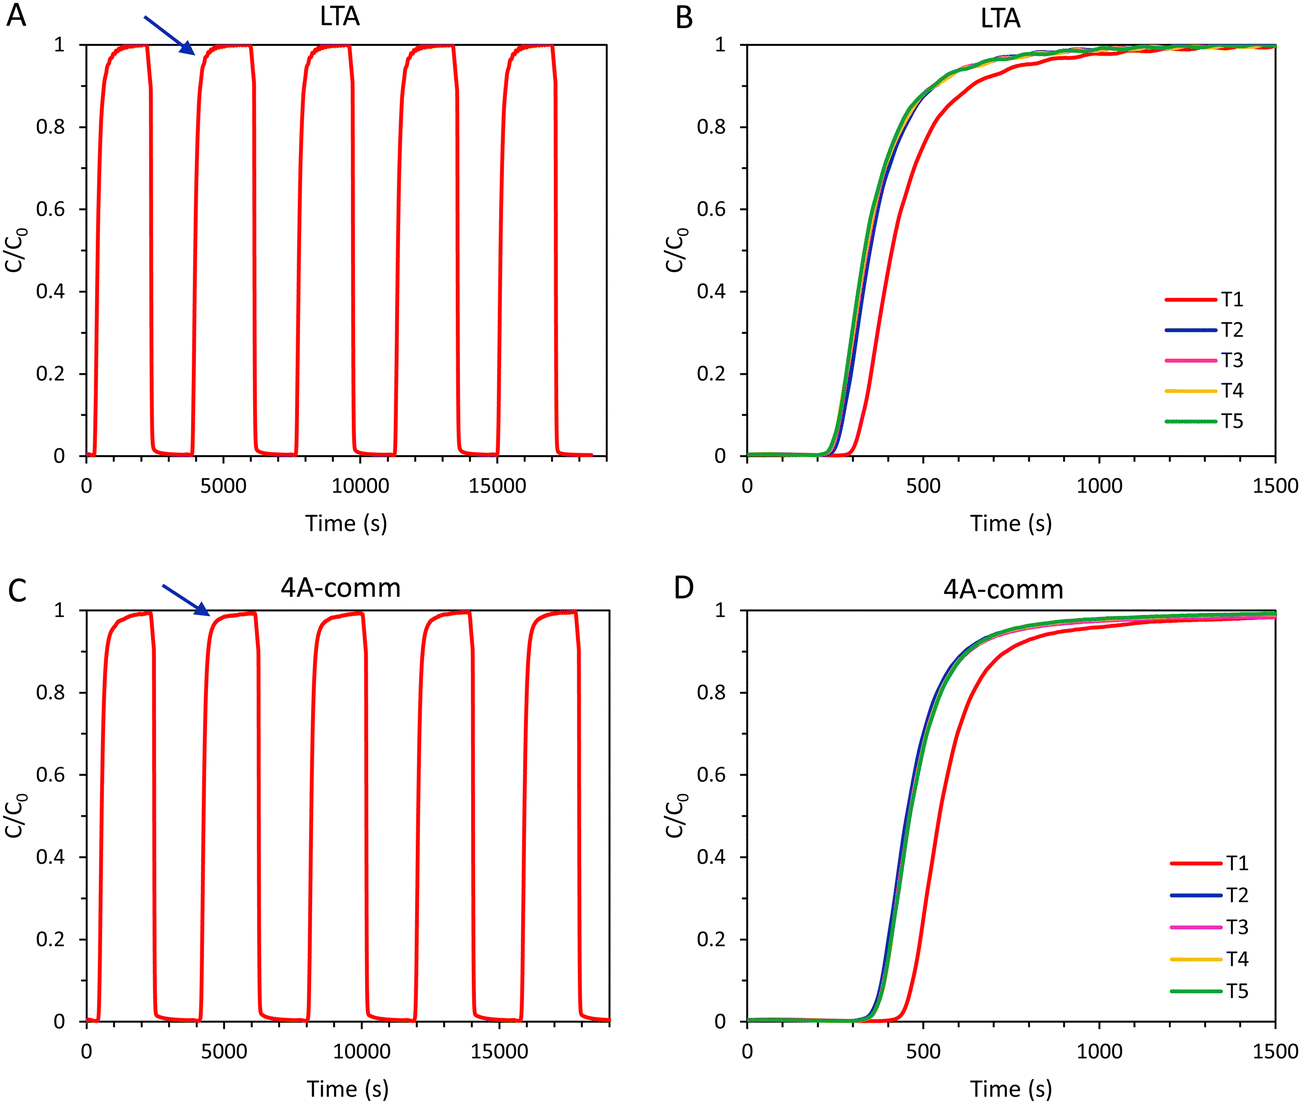
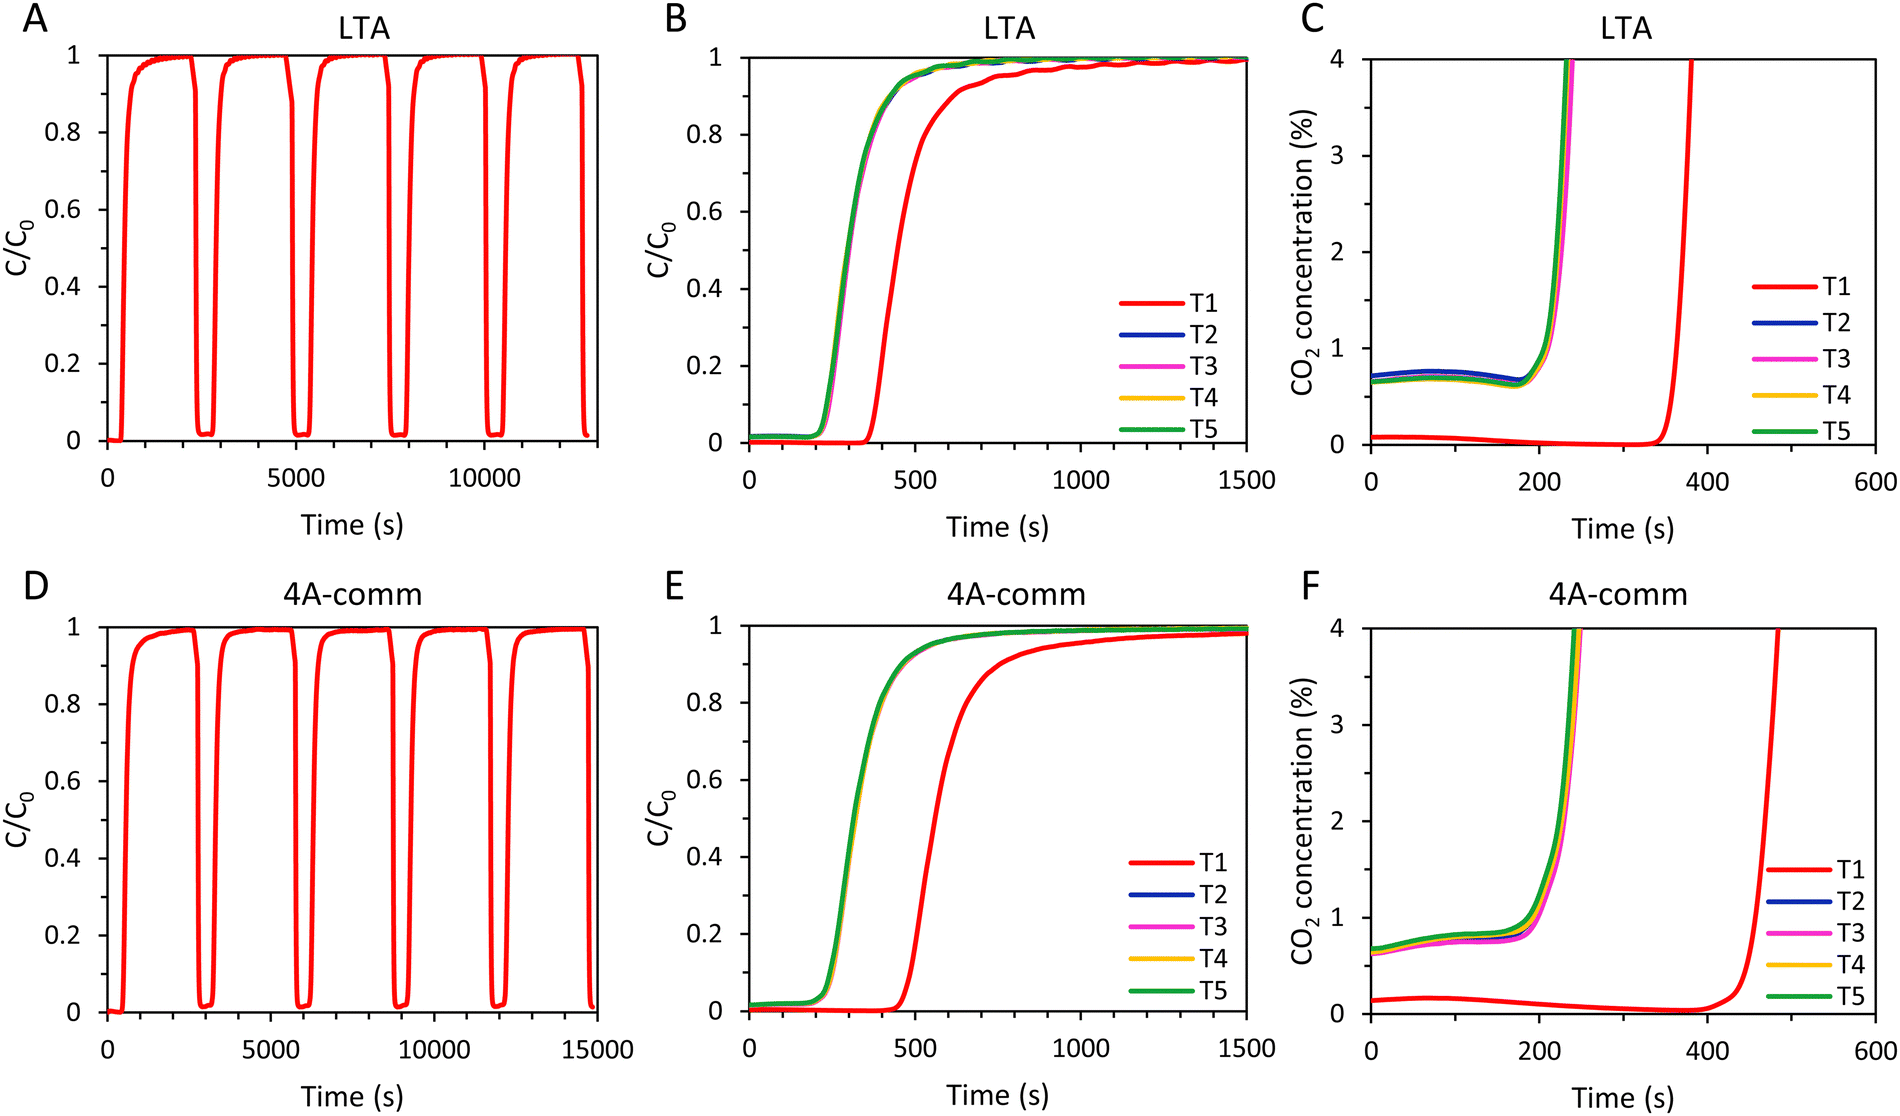
In order to investigate the regeneration of the adsorbents in an adsorption column and to determine the cyclic adsorption capacity, five consecutive CO2 adsorption cycles were performed for the LTA and the 4A-comm beads. After each adsorption cycle, the adsorbent was evacuated for 2 min, and subsequently the column was flushed with N2 until the CO2 concentration at the outlet was ≤ 0.15% (Fig. 5 and Table 2). For the 4A-comm beads, slightly more significant tailing was observed for each adsorption cycle (indicated by the blue arrows in Fig. 5A and C) compared to the LTA beads, indicating that the 4A-comm beads experience a slightly higher degree of mass transfer limitations in the adsorption–desorption cycles compared to the LTA beads (Fig. 5A and C).30 For both adsorbents, the time until breakthrough for the first cycle is significantly larger compared to that of the other cycles (Fig. 5B and D). This can be explained considering that before the first cycle the sample was evacuated at elevated temperature (200 °C) for 2 h, while the regeneration in between cycles is much shorter and is carried out at room temperature. Furthermore, at the desorption pressure (20 mbar), the CO2 adsorption capacity of the beads is already substantial (1.6 mmol g−1 and 2.1 mmol g−1 for the LTA and 4A-comm beads, respectively, see Fig. S19, ESI†) and thus the adsorbent cannot be fully regenerated. Consequently, the amount of CO2 that is adsorbed decreases significantly after the first cycle, and reaches a cyclic steady state after about 3 cycles (Fig. 5B, D and Table 2), at a cyclic adsorption capacity (i.e. the adsorption capacity per cycle) at breakthrough of ca. 1.3 mmol g−1 for the 4A-comm beads and of ca. 0.6 mmol g−1 for the LTA beads (Table 2). The adsorption capacity at breakthrough, qb, is significantly lower for both the LTA and 4A-comm beads compared to the adsorption capacity at full utilization, qtot. The average CO2 adsorption capacity (i.e. the average adsorption capacity over all 5 cycles) at breakthrough of the LTA beads (0.7 mmol g−1) was lower than that of the 4A-comm beads (1.3 mmol g−1) and both are in the range of values of previously reported pellets of zeolite NaA containing a clay binder (0.6–1.3 mmol g−1).24 The relatively low average CO2 adsorption capacity of the LTA beads compared to the 4A-comm beads is due to the lower single component adsorption isotherm (vide supra).
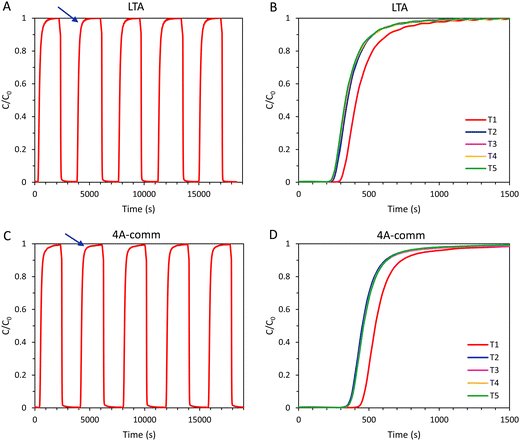 |
| | Fig. 5 (A) 5 consecutive adsorption–desorption cycles for the LTA beads in a VPSA setup (the blue arrow indicates what we define as tailing); (B) cyclic breakthrough curves of the LTA beads (5 cycles); (C) 5 consecutive adsorption–desorption cycles for the 4A-comm beads in a VPSA setup (the blue arrow indicates what we define as tailing); (D) cyclic breakthrough curves of the 4A-comm beads (5 cycles). The adsorbents were regenerated in between cycles by evacuation at 20 mbar for 2 min, followed by flushing with N2 until the CO2 concentration was ≤ 0.15% in the outlet gas stream. | |
Table 2 CO2 adsorption capacities (mmol g−1) from a CO2–CH4 mixture (40:60 vol%) for the LTA and 4A-comm beads in 5 subsequent cycles
| |
Regeneration step |
Cycle 1 |
Cycle 2 |
Cycle 3 |
Cycle 4 |
Cycle 5 |
CO2 productivitya (mol kg−1 h−1) |
| The CO2 productivity is calculated as the sum of the CO2 adsorption capacity of all 5 cycles divided by the total time of the cycles. The adsorbents were regenerated in between cycles by evacuation at 20 mbar for 2 min, followed by flushing with N2 until the CO2 concentration in the outlet gas stream was ≤ 0.15%. The adsorbents were regenerated in between cycles by evacuation at 20 mbar for 2 min, followed by flushing with N2 for 139 s. |
| LTA at full utilization |
Longb |
1.65 |
1.24 |
1.21 |
1.21 |
1.18 |
1.27 |
| LTA at breakthrough |
Longb |
0.90 |
0.64 |
0.60 |
0.58 |
0.58 |
0.65 |
| LTA at full utilization |
Shortc |
1.82 |
0.89 |
0.88 |
0.84 |
0.85 |
1.49 |
| LTA at breakthrough |
Shortc |
1.20 |
0.45 |
0.46 |
0.44 |
0.44 |
0.85 |
| 4A-comm at full utilization |
Longb |
2.51 |
1.97 |
2.01 |
1.99 |
1.98 |
1.96 |
| 4A-comm at breakthrough |
Longb |
1.74 |
1.28 |
1.31 |
1.32 |
1.31 |
1.30 |
| 4A-comm at full utilization |
Shortc |
2.62 |
1.18 |
1.19 |
1.17 |
1.15 |
1.76 |
| 4A-comm at breakthrough |
Shortc |
1.82 |
0.56 |
0.57 |
0.56 |
0.54 |
0.98 |
After the first cycle, reaching a CO2 concentration C ≤ 0.15% in the outlet gas stream (as measured by the IR sensor) by evacuation and flushing with N2 required about 20 min for the LTA and 4A-comm beads, which is undesired in an actual VPSA system as such long regeneration times significantly decrease the CO2 productivity (i.e. the amount of CO2 in moles captured per hour per kg of adsorbent, Table 2). To study the effect of shortening the regeneration to a time range that would be suitable for practical application in VPSA, 5 cycles for each adsorbent were measured in which the adsorbents were regenerated by evacuation for 2 min and subsequently flushing with N2 for 139 s (Fig. 6), which is the time required for a column filled with glass beads to reach a CO2 concentration C ≤ 0.1% in the outlet gas stream. After regeneration of the adsorbent bed, a small amount of CO2 was still present in the outlet gas stream before each new cycle commenced (about 0.6–0.7%, Fig. 6C and F), which is expected to decrease the CO2 adsorption capacity compared to the experiments with long regeneration time. As for the experiments with long regeneration times, for both adsorbents the time until breakthrough was significantly decreased after the first cycle and, as anticipated, the breakthrough time was shorter compared to that obtained with the longer regeneration time (Fig. 5 and 6). The total amount of CO2 that was adsorbed by both adsorbents in the 2nd–5th cycle was therefore lower compared to the cycles with longer regeneration time (Table 2).
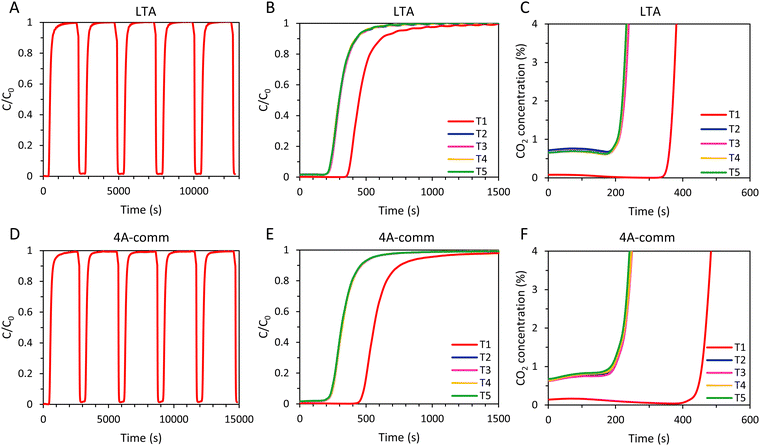 |
| | Fig. 6 (A) 5 consecutive adsorption–desorption cycles for LTA beads in a VPSA setup; (B) cyclic breakthrough curves of LTA beads (5 cycles); (C) cyclic breakthrough curves of LTA beads up to CO2 concentration of 4% (5 cycles); (D) 5 consecutive adsorption–desorption cycles for 4A-comm beads in a VPSA setup; (E) cyclic breakthrough curves of 4A-comm beads (5 cycles); (F) cyclic breakthrough curves of 4A-comm beads up to CO2 concentration of 4% (5 cycles). The adsorbents were regenerated in between cycles by evacuation at 20 mbar for 2 min, followed by flushing with N2 for 139 s. | |
Interestingly, while the breakthrough of the 4A-comm beads (469 s) for the first cycle was significantly later than that of the LTA beads (371 s), the breakthrough for the second cycle is at roughly the same time (224 and 227 s for LTA and 4A-comm beads, respectively). Consequently, the decrease in CO2 adsorption capacity compared to the test with longer regeneration was more significant for the 4A-comm beads than for the LTA beads (42% compared to 28%, respectively, when comparing the qtot in the fifth cycle for both regeneration methods). This implies that a larger amount of CO2 was still adsorbed within the micropores of the 4A-comm beads after regeneration. This is in agreement with the results obtained from the single-component adsorption isotherms (Fig. 3) in which the 4A-comm beads could not be fully regenerated after the first cycle whilst the LTA beads could. This can be attributed to: (i) the presence of a small amount of chemisorption on the 4A-comm beads due to the higher amount of Na+ cations per unit mass, (ii) a reduced available pore volume for 4A-comm due the higher amount of Na+ cations per unit mass, which may lead to hindered diffusion of CO2 through the micropores, (iii) partial blocking of the micropores of 4A-comm by the inert binder, (iv) less-efficient diffusion due to the lower amount of mesopores in the 4A-comm beads compared to the open and accessible hierarchical pore structure of the LTA beads. The large decrease in desorption of CO2 upon a short regeneration time compared with a long regeneration time suggests that hypothesis (i) is unlikely: if chemisorption were the dominant reason, varying the regeneration time would not affect the amount of CO2 that was desorbed. The cyclic adsorption capacity at breakthrough for the 4A-comm beads (between 0.54 and 0.57 mmol g−1 in cycles 2 to 5) significantly decreased compared to the test with the longer regeneration time (between 1.28 and 1.32 mmol g−1 in cycles 2 to 5). It is thus not surprising that the CO2 productivity of the 4A-comm beads also decreased from 1.30 to 0.98 mol kg−1 h−1. The cyclic adsorption capacity at breakthrough for the LTA beads (between 0.58 and 0.64 mmol g−1 in cycles 2 to 5) also decreased compared to the test with longer regeneration time (between 0.44 and 0.46 mmol g−1 in cycles 2 to 5), though less significantly. Because of this small decrease combined with the shorter cycle time, the CO2 productivity of the LTA beads slightly increased from 0.65 to 0.85 mol kg−1 h−1. However, both materials displayed low cyclic adsorption capacity at breakthrough (ideally the adsorption capacity at breakthrough after multiple cycles should be ≥ 2 mmol g−1). Further decreasing the desorption pressure is expected to increase the cyclic adsorption capacity as the amount of CO2 still adsorbed at the regeneration pressure would decrease. However, the regeneration pressure in this work is already very low and a further decrease would not be ideal for industrial application. Alternatively, regeneration of the adsorbents can be accomplished by increasing the temperature (i.e. temperature swing adsorption, TSA). For example, increasing the temperature from 25 to 127 °C was reported to lead to a decrease of CO2 adsorption capacity on zeolite 4A at 1 bar from 3.3 mmol g−1 to 1.2 mmol g−1.31 To achieve a decrease around 2 mmol g−1 by decreasing the pressure, a regeneration pressure of about 6 mbar would be required for the LTA and the 4A-comm beads (Fig. S19, ESI†), and such deep vacuum would lead to a significant increase in the energy requirements for CO2 separation. Therefore, it can be concluded that the LTA and 4A-comm beads are more suitable for TSA than for VPSA.
SAPO-34 beads
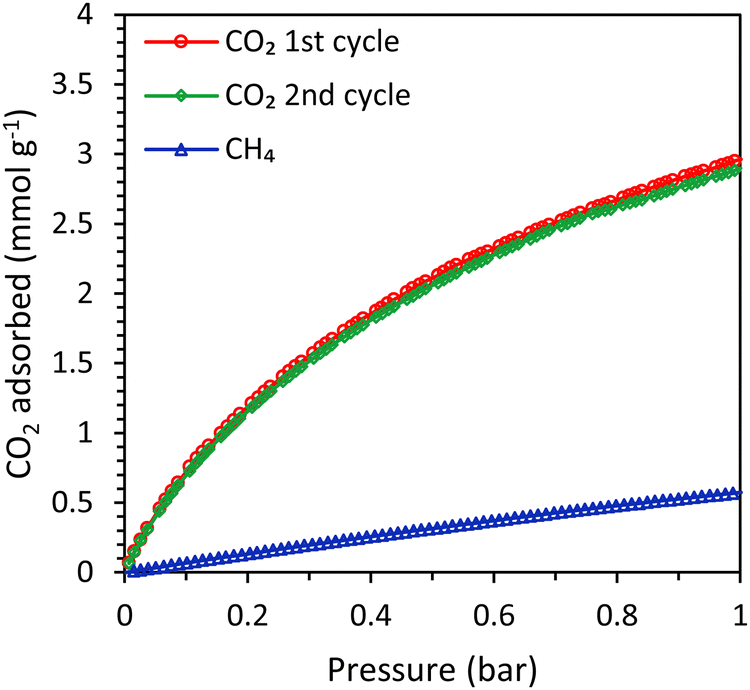
In order to study the effect of the type of zeolitic microporous framework on the CO2 adsorption kinetics of zeolitic beads, SAPO-34 beads (physicochemical properties in Table S2 and Fig. S20–S23, ESI†) were compared with the LTA beads. First, single component adsorption isotherms were measured for the SAPO-34 beads. The CO2 adsorption capacity of the SAPO-34 beads at 1 bar was 3.0 mmol g−1 and the isotherm was similar for the first and the second adsorption cycle, indicating that no significant amount of residual adsorbed CO2 was present after evacuation (Fig. 7). The CO2 adsorption capacity of the SAPO-34 beads was lower than that of the LTA beads (Fig. 7 and Tables 1, 3). However, the CO2 adsorption isotherm of the SAPO-34 beads at 1 bar is still relatively steep and did not approach a plateau, while that of the LTA beads already significantly flattened and approached a plateau before 1 bar (Fig. S19, ESI†). Therefore, it is expected that the CO2 adsorption capacity of the SAPO-34 beads would further increase up to 4 bar (the pressure used in the breakthrough experiments). Another important difference between the SAPO-34 beads and the LTA beads is the shape of the CO2 adsorption isotherm, which is less steep for the SAPO-34 beads at low pressure (< 0.1 bar). This leads to lower CO2 adsorption capacity at the regeneration pressure for the SAPO-34 beads, which is expected to enhance the working capacity. The CO2/CH4 selectivity of the SAPO-34 beads was 8 (at partial pressures representing biogas, i.e. 0.4 bar CO2 and 0.6 bar CH4), which is significantly lower than that of the LTA beads (CO2/CH4 selectivity of 20), and is expected to lead to a lower purity in the CO2-rich gas stream upon desorption in VPSA tests. However, it should be noted that the CO2/CH4 selectivity of the adsorbents was not calculated at the partial pressures used in the breakthrough tests (1.6 bar CO2 and 2.4 bar CH4) because the Micromeritics ASAP 2020 equipment that was used for the single component adsorption isotherms can only measure up to 1 bar. It is likely that the selectivity at the pressure in the binary breakthrough tests is slightly lower since the CO2 adsorption isotherm flattens towards 1 bar for the LTA and 4A-comm beads and to a lesser extent for the SAPO-34 beads, while the CH4 adsorption isotherm linearly increases up to 1 bar. Since the CO2 adsorption isotherm of the SAPO-34 beads flattens less significantly compared to that of the LTA and 4A-comm beads, it is expected that the difference in CO2/CH4 selectivity between LTA and SAPO-34 beads is lower at the higher pressure used in the breakthrough tests.
 |
| | Fig. 7 CO2 (2 cycles) and CH4 adsorption isotherms of the SAPO-34 beads. | |
Table 3 CO2 adsorption capacity for the SAPO-34 beads as calculated from their single component isotherm and their breakthrough curve
| |
CO2 adsorption capacity from single component testa (mmol g−1) |
CH4 adsorption capacity from single component testb (mmol g−1) |
CO2 adsorption capacity from a CO2–CH4 mixturec (mmol g−1) at full utilization – qtot |
CO2 adsorption capacity from a CO2–CH4 mixturec (mmol g−1) at breakthrough – qb |
| At 1 bar, obtained from the CO2 adsorption isotherm. At 1 bar, obtained from the CH4 adsorption isotherm. Calculated from the CO2 breakthrough curve. |
| SAPO-34 |
2.99 |
0.57 |
2.42 |
1.85 |
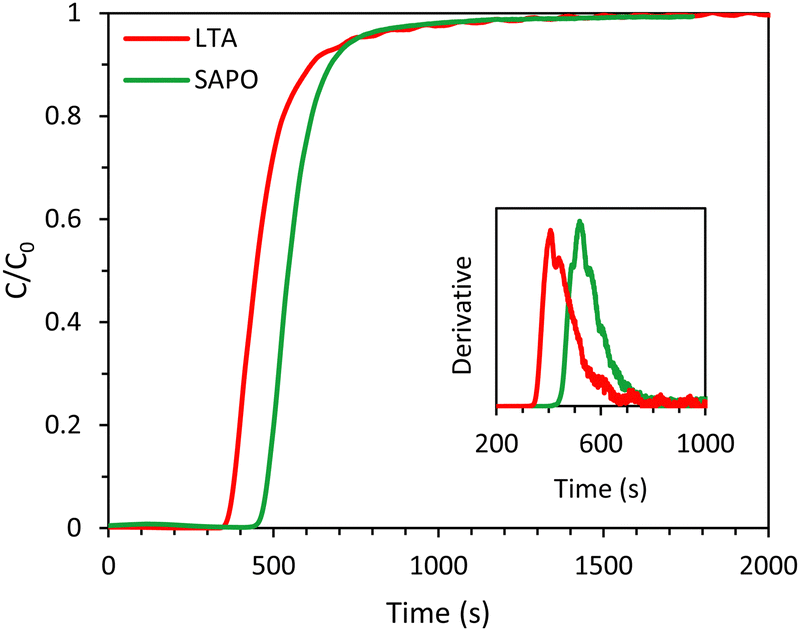
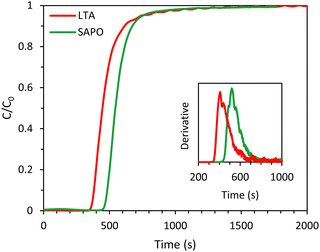
In order to compare the kinetics of CO2 adsorption on SAPO-34 with that on the LTA beads, breakthrough experiments were carried out with SAPO-34 beads as the adsorbent. The SAPO-34 beads were synthesized using a similar method to the LTA beads, and both beads displayed hierarchical porosity in which the meso- and macropores provide access to the micropores within the beads.15,16 Therefore, it is expected that the inter-crystalline diffusion of CO2 within the meso- and macropores of the beads is similar. Indeed, the shape of the breakthrough curve of SAPO-34 was comparable to that of the LTA beads and displayed a similar, yet slightly steeper, breakthrough with slightly less significant tailing (Fig. 8, see also Fig. S24 to compare with the 4A-comm beads, ESI†), indicating that the mass transfer rate for the SAPO-34 beads was slightly higher. This was further supported by the estimated value of the fraction of the SAPO-34 bed being unused during an adsorption cycle (0.19), which was slightly lower than that of the LTA beads (0.22). As both the binderless LTA and SAPO-34 beads were synthesized using the same hard template, they are expected to display similar diffusion behaviour in the macro/mesoporous network that gives access to the microporous LTA or SAPO-34 crystals constituting the beads. Therefore, the observed differences between the two adsorbents were attributed to the difference in intra-crystalline diffusion, which depends among others on the zeolite framework structure and the adsorption strength of CO2 on the cations, with a decrease in diffusivity upon increasing adsorption strength.6,32 Indeed, the enthalpy of adsorption of CO2, which is an indication of the adsorption strength, is significantly lower (in absolute value) for H-SAPO-34 (−25 kJ mol−1)33 compared to zeolite Na-A (−47 kJ mol−1).34 Furthermore, though the pore size of SAPO-34 and LTA are similar (0.38 and 0.4 nm), the micropores of LTA are partially blocked by the large amount of Na+ cations, which leads to a very low available surface area and micropore volume for the LTA beads (Table S1, ESI†). On the other hand, the SAPO-34 beads contain less cation sites per mass unit and are in their H-form, leading to a much larger available surface area and micropore volume (Table S2, ESI†), which are expected to facilitate the diffusion of CO2. The CO2 adsorption capacity obtained from the single component adsorption isotherm of SAPO-34 was slightly lower than that of the LTA beads. However, the time until breakthrough for the SAPO-34 beads was higher than that of the LTA beads (Fig. 8), leading to a CO2 adsorption capacity at full utilization that was significantly higher than the LTA beads (Tables 1 and 3). This was ascribed to the shape of the adsorption isotherms of the beads (Fig. S19, ESI†): while the CO2 adsorption isotherm for the LTA beads significantly flattened and approached a plateau already before 1 bar, the isotherm of the SAPO-34 beads was steeper in that same pressure range and thus adsorption at elevated pressure increases the CO2 adsorption capacity.
 |
| | Fig. 8 CO2 breakthrough curves of the LTA and SAPO-34 beads. The inset displays the derivative of the breakthrough curves. Feed: 40 vol% CO2 and 60 vol% CH4 (mimicking biogas). | |
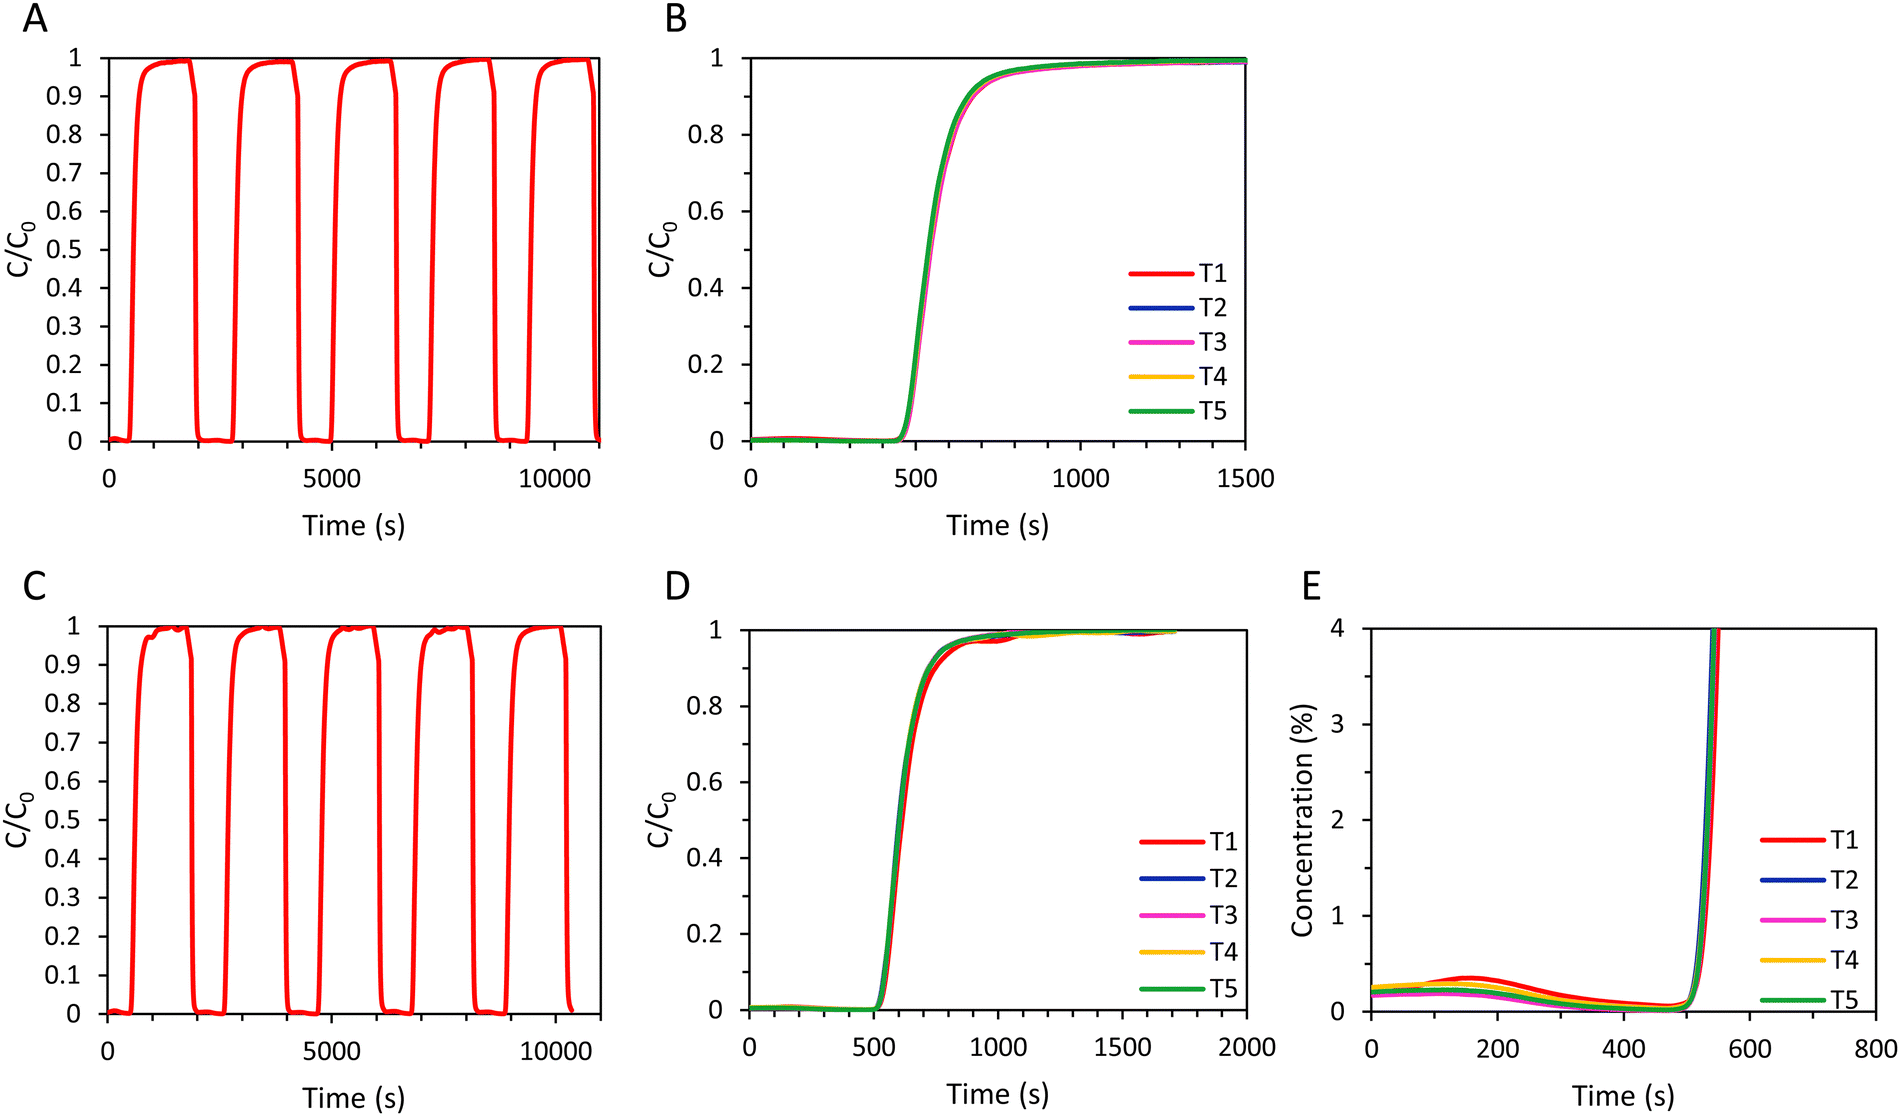
To evaluate the regenerability of the SAPO-34 beads and to determine the cyclic adsorption capacity, five subsequent CO2 adsorption cycles were performed with the SAPO-34 beads with a long desorption step consisting of evacuation for 2 min at 20 mbar and subsequent flushing with N2 until the CO2 concentration at the outlet was ≤ 0.15% (Fig. 9A and B). The time required for a saturated bed of SAPO-34 beads to reach a CO2 concentration ≤ 0.15% upon regeneration was significantly shorter (about 4 min) than for the LTA (about 20 min) beads (Fig. 5 and 9). Additionally, while for the LTA beads the breakthrough of the 2nd–5th cycles occurs much earlier compared to the 1st cycle, for the SAPO-34 beads the breakthrough was similar for all cycles (Fig. 9). Thus, while the LTA beads displayed significantly lower CO2 adsorption capacity after the first cycle, for the SAPO-34 beads the CO2 adsorption capacity was relatively stable over the 5 cycles (Table 4). Another test consisting of 5 subsequent CO2 adsorption cycles was performed with the SAPO-34 beads, but with a short desorption step consisting of evacuation for 2 min and subsequently flushing N2 for 139 s (Fig. 9C–E). A small amount of CO2 (about 0.2%, Fig. 9E) was still present in the outlet gas stream before each new cycle commenced, though this was lower than for the LTA beads (about 0.6–0.7%, Fig. 6C). While for the LTA beads a big decrease in breakthrough time was observed after the first cycle, for the SAPO-34 beads, the breakthrough time was relatively stable over the 5 cycles. For both the long and short regeneration times, more than 97% of the CO2 adsorption capacity was retained after 5 cycles with the SAPO-34 beads. A cyclic adsorption capacity around 2 mmol g−1 and a CO2 productivity > 3 mol kg−1 h−1 were achieved, which are significantly higher than those of the LTA beads. Furthermore, even a short regeneration time was sufficient to almost completely desorb CO2 from the SAPO-34 beads, indicating that this material is the most suitable for industrial VPSA application among the adsorbents tested in this work. The superior behaviour of SAPO-34 in 5 consecutive adsorption cycles compared to the LTA beads was mainly attributed to the shape of the CO2 adsorption isotherm of the SAPO-34 beads compared to that of the LTA beads (Fig. 3, 7 and Fig. S19, ESI†). The enthalpy of adsorption of H-SAPO-34 (−25 kJ mol−1)33 is significantly lower (in absolute value) than that of zeolite Na-A (−47 kJ mol−1)34 and, therefore, a less steep CO2 adsorption isotherm was observed for the SAPO-34 beads. Whereas the LTA beads adsorbed 1.6 mmol g−1 at the desorption pressure (20 mbar), SAPO-34 only adsorbed 0.2 mmol g−1. Therefore, the regeneration of the SAPO-34 beads was much more efficient, and as a consequence the CO2 adsorption capacity was relatively stable over 5 cycles. Additionally, the breakthrough curve for all cycles of the SAPO-34 beads was sharper and had less significant tailing than that of the LTA beads, indicating a higher mass transfer rate of CO2 within the SAPO-34 beads, which was attributed to faster intra-crystalline diffusion of CO2 in the SAPO-34 beads (vide supra). This led to shorter cycle time for the SAPO-34 beads as C = C0 was reached faster and, therefore, also to a higher CO2 productivity. Furthermore, while for the LTA beads the CO2 adsorption capacity at breakthrough was significantly lower compared to the CO2 adsorption capacity at full utilization (qb/qtot = 66% in the first cycle, 50% in the fifth cycle), the CO2 adsorption at breakthrough is relatively high for the SAPO-34 beads (qb/qtot = 78% in the first cycle, 79% in the fifth cycle) due to its sharper breakthrough and shorter tailing in its breakthrough curve.
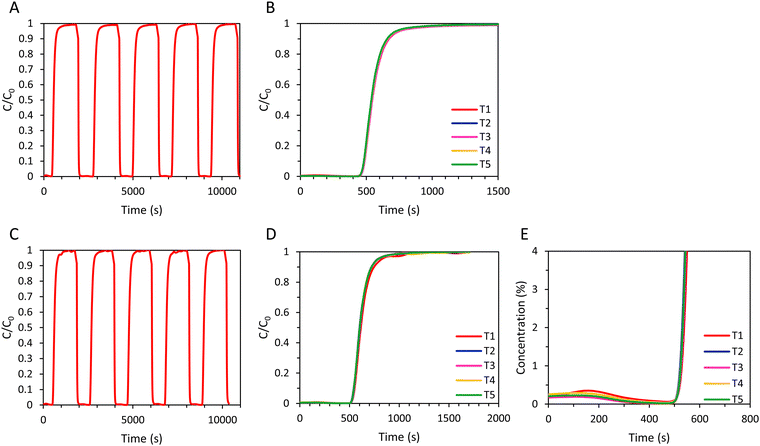 |
| | Fig. 9 (A) 5 consecutive adsorption–desorption cycles for the SAPO-34 beads in a VPSA setup, with a long desorption step;a (B) cyclic breakthrough curves of SAPO-34 beads (5 cycles), with a long desorption step;a (C) 5 consecutive adsorption–desorption cycles for the SAPO-34 beads in a VPSA setup, with a short desorption step;b (D) cyclic breakthrough curves of the SAPO-34 beads (5 cycles), with a short desorption step;b (E) cyclic breakthrough curves of SAPO-34 beads up to CO2 concentration of 4% (5 cycles), with a short desorption step.b a Long desorption step (A) and (B): the adsorbent bed was regenerated in between cycles by evacuation at 20 mbar for 2 min, followed by flushing with N2 until the CO2 concentration was ≤ 0.15%. b Short desorption step (C)–(E): the adsorbent bed was regenerated in between cycles by evacuation at 20 mbar for 2 min, followed by flushing with N2 for 139 s. | |
Table 4 CO2 adsorption capacities (mmol g−1) from a CO2–CH4 mixture (40:60 vol%) for SAPO-34 beads in 5 subsequent cycles
| |
Regeneration step |
Cycle 1 |
Cycle 2 |
Cycle 3 |
Cycle 4 |
Cycle 5 |
CO2 productivitya (mol kg−1 h−1) |
| The CO2 productivity is calculated as the sum of the CO2 adsorption capacity of all 5 cycles divided by the total time of the cycles. The adsorbent bed was regenerated in between cycles by evacuation at 20 mbar for 2 min, followed by flushing with N2 until the CO2 concentration was ≤ 0.15%. The adsorbent bed was regenerated in between cycles by evacuation at 20 mbar for 2 min, followed by flushing with N2 for 139 s. |
| SAPO-34 at full utilization |
Longb |
2.42 |
2.42 |
2.43 |
2.38 |
2.36 |
3.91 |
| SAPO-34 at breakthrough |
Longb |
1.85 |
1.86 |
1.88 |
1.85 |
1.85 |
3.02 |
| SAPO-34 at full utilization |
Shortc |
2.78 |
2.70 |
2.71 |
2.71 |
2.70 |
4.73 |
| SAPO-34 at breakthrough |
Shortc |
2.20 |
2.16 |
2.19 |
2.17 |
2.18 |
3.79 |
Conclusions
In this work, binderless LTA and SAPO-34 beads with hierarchical porosity were evaluated for the first time as CO2 adsorbents in vacuum pressure swing adsorption (VPSA) in the context of biogas upgrading. The two types of adsorbents were selected because LTA zeolites display good CO2 adsorption capacity and can achieve high selectivity in the separation from CH4, whereas silicoaluminophosphate zeotypes (SAPOs) typically display slightly lower CO2 adsorption capacity (in the pressure range 0–1 bar) but higher working capacity compared to zeolites. The binderless LTA beads were first compared with commercial binder-containing zeolite 4A beads (4A-comm), and the LTA beads were subsequently compared with binderless SAPO-34 beads, which were synthesized using a similar hard templating method as the one utilized for the LTA beads. The LTA beads displayed a slightly steeper breakthrough curve with a less significant tailing compared to that of the 4A-comm beads, which indicates that the mass transfer rate of the LTA beads was slightly higher. This was attributed to the open and accessible hierarchical pore structure of the LTA beads. However, the adsorption capacity of the 4A-comm beads was higher than that of the LTA beads, both for the single component adsorption isotherm as for the breakthrough experiments over 5 consecutive cycles, either with a long or a short regeneration method. Both the binderless LTA and the 4A-comm beads displayed very low cyclic adsorption capacities at breakthrough (qb), which was mostly attributed to the steep CO2 adsorption isotherms of the beads, and thus to the high CO2 adsorption capacity at the desorption pressure (1.6 mmol g−1 and 2.1 mmol g−1 for the LTA and 4A-comm beads, respectively). To increase the cyclic adsorption capacity, the desorption pressure should be further decreased, though this would be energy-intensive. Alternatively, these CO2 adsorbents could be regenerated by elevated temperature and thus be employed for temperature swing adsorption (TSA). On the other hand, the SAPO-34 beads displayed high cyclic adsorption capacity at breakthrough, around 2 mmol g−1, and a CO2 productivity > 3 mol kg−1 h−1, which was significantly higher than that of the LTA and 4A-comm beads. This was attributed to the lower enthalpy of adsorption of the SAPO-34 beads compared to the LTA beads leading to a less steep CO2 adsorption isotherm for the SAPO-34 beads and, therefore, significantly lower CO2 adsorption at the desorption pressure (0.2 mmol g−1). Additionally, the SAPO-34 beads displayed a similar, though slightly steeper breakthrough curve with less significant tailing compared to the LTA beads, indicating that a higher mass transfer rate was achieved for the SAPO-34 beads. Thus, the superior cyclic CO2 adsorption capacity, CO2 productivity and mass transfer rate of the SAPO-34 beads indicate that these beads are a promising candidate for industrial separation of CO2 from biogas by using VPSA.
Besides giving a perspective into the applicability of binderless LTA and SAPO-34 beads in a VPSA system, this work also allowed identifying possible technical improvements to the VPSA setup. These are provided in the ESI.† Future work could explore regeneration at milder conditions, and thus at higher pressure (e.g. 0.3 bar), compared to the low regeneration pressure that was used in this work (20 mbar), which was chosen with the purpose of removing the majority of CO2 from the adsorbent bed. The proposed milder conditions would decrease the operating costs and would thus be desirable for industrial application. However, this would decrease the cyclic adsorption capacity, as the CO2 adsorption capacity at the desorption pressure and thus the amount of CO2 that is not desorbed would be higher. In the case of the SAPO-34 beads, increasing the adsorption pressure may mitigate the effect of the decrease in CO2 adsorption capacity, as it has been reported that the CO2 adsorption capacity of these zeotypes increases up to around 6 bar.35,36 Finally, it is worth noting that while breakthrough experiments are an important step towards process evaluation, the obtained results still need to be validated at a larger scale as for example the bed effects at industrial scale may differ from those at the small-scale VPSA setup used in this research.28
Author contributions
The manuscript was written through contributions of all authors. All authors have given approval to the final version of the manuscript.
Conflicts of interest
There are no conflicts to declare.
Acknowledgements
The authors acknowledge funding for the project by DMT Environmental Technology and Samenwerkingsverband Noord-Nederland (SNN, KE18PR003). We acknowledge Erwin Wilbers, Marcel de Vries and Wout Marinus for technical support, and Léon Rohrbach and Jing Chen for helping with the N2 and Ar physisorption analysis.
References
- A. Meyer-Aurich, A. Schattauer, H. J. Hellebrand, H. Klauss, M. Plöchl and W. Berg, Renew. Energy., 2012, 37, 277–284 CrossRef CAS.
- G. Myhre, D. Shindell, F.-M. Bréon, W. Collins, J. Fuglestvedt, J. Huang, D. Koch, J.-F. Lamaruqe, D. Lee, B. Mendoza, T. Nakajima, A. Robock, G. Stephens, T. Takemura and H. Zhang, in Clim. Chang., Phys. Sci. Basis. Contrib. Work. Gr. I to Fifth Assess. Rep. Intergov. Panel Clim. Chang., ed. T. F. Stocker, D. Qin, G.-K. Plattner, M. Tignor, S. K. Allen, J. Boschung, A. Nauels, Y. Xia, V. Bex and P. M. Midgley, Cambridge University Press, Cambridge, UK and New York, USA, 2013 Search PubMed.
- K. Hjuler and N. Aryal, Review of Biogas Upgrading, 2017 Search PubMed.
- D. P. Harrison, Greenh. Gas Control Technol., 2005, 7.11, 1101–1106 Search PubMed.
- M. T. Ho, G. W. Allinson and D. E. Wiley, Ind. Eng. Chem. Res., 2008, 47, 4883–4890 CrossRef CAS.
- D. G. Boer, J. Langerak and P. P. Pescarmona, ACS Appl. Energy Mater., 2023, 6(5), 2634–2656 CrossRef CAS.
- O. Cheung, Z. Bacsik, P. Krokidas, A. Mace, A. Laaksonen and N. Hedin, Langmuir, 2014, 30, 9682–9690 CrossRef CAS PubMed.
- O. Cheung and D. Wardecki, Phys. Chem. Chem. Phys., 2016, 18, 16080–16083 RSC.
- Z. Bacsik, O. Cheung, P. Vasiliev and N. Hedin, Appl. Energy, 2016, 162, 613–621 CrossRef CAS.
- Q. Liu, A. Mace, Z. Bacsik, J. Sun, A. Laaksonen and N. Hedin, Chem. Commun., 2010, 46, 4502–4504 RSC.
- O. Cheung and N. Hedin, RSC Adv., 2014, 4, 14480–14494 RSC.
- L. B. McCusker and C. Baerlocher, Zeolite structures, in Zeolites Ordered Mesoporous Mater. Prog. Prospect, ed. J. Čejka and H. van Bekkum, Elsevier B.V., 2005, pp. 41–64 Search PubMed.
- J. A. C. Silva, K. Schumann and A. E. Rodrigues, Microporous Mesoporous Mater., 2012, 158, 219–228 CrossRef CAS.
- F. Akhtar, L. Andersson, S. Ogunwumi, N. Hedin and L. Bergström, J. Eur. Ceram. Soc., 2014, 34, 1643–1666 CrossRef CAS.
- D. G. Boer, J. Langerak, B. Bakker and P. P. Pescarmona, Microporous Mesoporous Mater., 2022, 344, 112208 CrossRef CAS.
- D. G. Boer, D. Čiliak, J. Langerak, B. Bakker and P. P. Pescarmona, Sust. Chem. Clim. Act, 2023, 2, 100026 Search PubMed.
- D. G. Boer, Z. Asgar Pour, J. Langerak, B. Bakker and P. P. Pescarmona, Molecules, 2023, 28, 2198 CrossRef CAS PubMed.
- D. Mehlhorn, R. Valiullin, J. Kärger, K. Schumann, A. Brandt and B. Unger, Microporous Mesoporous Mater., 2014, 188, 126–132 CrossRef CAS.
- R. Seabra, A. Mafalda Ribeiro, K. Gleichmann, A. F. P. Ferreira and A. E. Rodrigues, Microporous Mesoporous Mater., 2019, 277, 105–114 CrossRef CAS.
- N. S. Wilkins and A. Rajendran, Adsorption, 2019, 25, 115–133 CrossRef CAS.
- N. Al-Janabi, R. Vakili, P. Kalumpasut, P. Gorgojo, F. R. Siperstein and X. Fan, AIChE J., 2018, 64, 2189–2197 CrossRef CAS.
- T. Remy, S. A. Peter, L. Van Tendeloo, S. Van Der Perre, Y. Lorgouilloux, C. E. A. Kirschhock, G. V. Baron and J. F. M. Denayer, Langmuir, 2013, 29, 4998–5012 CrossRef CAS PubMed.
- A. Gabelman, Chem. Eng. Prog., 2017, 48–53 CAS.
- P. Rzepka, A. B. Jasso-Salcedo, A. Janicevs, P. Vasiliev and N. Hedin, Energy Proc., 2019, 158, 6715–6722 CrossRef CAS.
- A. Martin-Calvo, J. B. Parra, C. O. Ania and S. Calero, J. Phys. Chem. C, 2014, 118, 25460–25467 CrossRef CAS.
- Z. Asgar Pour, R. Koelewijn, M. El Hariri El Nokab, P. C. A. van der Wel, K. O. Sebakhy and P. P. Pescarmona, ChemCatChem, 2022, 14, e202200518 CrossRef CAS.
- M. Karimi, A. E. Rodrigues and J. A. C. Silva, Chem. Eng. J., 2021, 425, 130538 CrossRef CAS.
- N. S. Wilkins, A. Fajendran and S. Farooq, Adsorption, 2021, 27, 397–422 CrossRef CAS.
- R. Krishna and J. M. van Baten, Microporous Mesoporous Mater., 2011, 137, 83–91 CrossRef CAS.
- V. M. Georgieva, E. L. Bruce, M. C. Verbraeken, A. R. Scott, W. J. Casteel, S. Brandani and P. A. Wright, J. Am. Chem. Soc., 2019, 141, 12744–12759 CrossRef CAS PubMed.
- D. Bahamon and L. F. Vega, Chem. Eng. J., 2016, 284, 438–447 CrossRef CAS.
- R. Krishna, J. Phys. Chem. C, 2009, 113, 19756–19781 CrossRef CAS.
- M. Hong, S. Li, H. F. Funke, J. L. Falconer and R. D. Noble, Microporous Mesoporous Mater., 2007, 106, 140–146 CrossRef CAS.
- A. Zukal, C. O. Arean, M. R. Delgado, P. Nachtigall, A. Pulido, J. Mayerová and J. Čejka, Microporous Mesoporous Mater., 2011, 146, 97–105 CrossRef CAS.
- A. Golmakani, S. Fatemi and J. Tamnanloo, Ind. Eng. Chem. Res., 2016, 55, 334–350 CrossRef CAS.
- S. S. A. Talesh, S. Fatemi, S. J. Hashemi and M. Ghasemi, Sep. Sci. Technol., 2010, 45, 1295–1301 CrossRef CAS.
Footnote |
| † Electronic supplementary information (ESI) available: Picture of experimental setup, theory of breakthrough experiments, cyclic breakthrough curves, physicochemical properties of LTA, 4A-comm and SAPO-34 beads. See DOI: https://doi.org/10.1039/d4ya00007b |
|
| This journal is © The Royal Society of Chemistry 2024 |

 Open Access Article
 This Open Access Article is licensed under a
  *a
*a