
 Open Access Article
 This Open Access Article is licensed under a
 Creative Commons Attribution 3.0 Unported Licence
Rationally stabilized hierarchical NiCo2O4 hollow nanoballs for high-performance asymmetric supercapacitors and excellent methanol oxidation†
Vikas
Sharma
 *a,
Rahul Vijay
Khose
b and
Kushal
Singh
c
*a,
Rahul Vijay
Khose
b and
Kushal
Singh
c
aCentre for Converging Technologies, University of Rajasthan, Jaipur-302004, Rajasthan, India. E-mail: vikas2008.123@gmail.com
bMettler Toledo India, Mumbai-400072, Maharashtra, India
cDepartment of Materials Science and Engineering, NIT Hamirpur, Hamirpur-177005, Himachal Pradesh, India
First published on 13th November 2023
Abstract
An emergent theme of constructing intriguing morphologies of mono/multivalent materials, exhibiting a low diffusion length and large interfacial electrode–electrode cross section, along with low cost, improved performance and eco-effectiveness is essentially required for the growing energy sector. Hierarchically assembled spherical nanostructures possessing a hollow cavity facilitate ion accommodation over and inside the structure. However, a robust and generic strategy for the scalable synthesis of these hierarchical hollow morphologies is still lacking. Herein, we report an optimized strategy for the synthesis of perfect hollow bi-metallic oxide (NiCo2O4) nanoballs and discuss the involved growth mechanism following a series of chemical reactions/phenomena. Furthermore, the effectiveness of the synthesized hollow nanoballs as a model electrode material in an asymmetric supercapacitor and electro-oxidation of methanol is investigated. The fabricated electrodes exhibit a maximum specific capacitance of ∼721 F g−1 and shows a high energy density of ∼40 W h kg−1 in an asymmetric device configuration with activated carbon. The opening of the cavity evidently explains the high cycling stability and coulombic efficiency shown by the respective electrodes and device. Additionally, the hollow hosts showed a long lasting stable performance (7000 s and 500 cycles) with high currents for detecting 0.5 M methanol in 1 M KOH. The current strategy improves and optimizes the parameters to substantially improve the nano-chemistry at the reaction scale for batch synthesis. Such plausible strategies, which result in stabilizing greener and economically intriguing morphologies exhibiting exceptional interfacial electrochemistry, are actually path-breaking for pilot-scale integrated energy-storage and electro-oxidation systems.
Introduction
A rise in the demand for energy in the last two decades has put forward an alarming situation for the researchers. Researchers have developed various strategies to utilize renewable energy generation sources, including solar, wind, and hydro energies, to quench the raising energy thirst; however, the storage reservoirs for this generated energy are still limited.1–3 Therefore, a large amount of generated energy becomes impracticable and gets exhausted in vain. Rechargeable and long shelf life energy storage devices, such as Li+/K+/Na+/Mg+ batteries and redox supercapacitors, have gained considerable attention.4–6 Supercapacitors have an edge over rechargeable batteries because of their excellent power density and cycling stability. Their low energy density remains a limiting factor in their commercialization on a large scale.7 For this, new devices exhibiting the characteristics of both batteries and supercapacitors have been explored, which are termed “superbats” or “supercapatteries”.8,9 Such devices possess a sufficiently high energy density, which is expected to compensate for the shortcomings of the existing double layer and redox supercapacitors.Designing of electrode materials is actually a state-of-the-art process that involves experimenting with chemical reagents, which results in tunable morphologies. These intriguing morphologies are evidently observed in metal oxide based nanostructures, which are endowed with highly reversible redox reactions.10–13 Recently, hierarchical morphologies have been proposed to increase the effective surface area and active sites with maximum core utilization.14–16 These materials have proven their effectiveness in various energy storage and conversion applications.17,18 The optimization of scalable synthesis approaches for industrial utilization of nanostructures always remains a critical issue. In the energy storage and conversion sectors, it becomes extremely important to design simple and scalable synthesis protocols for stabilizing long range order, i.e., similar size and shape morphologies.19,20 The strategy to discover novel electrode materials has complicated the chemistry of the electrochemical processes. Various recent reports have put forward the utility of core@shell, core@core@shell, etc. like structures with multiple metal ion doping and hosting in oxide/sulfide forms.21,22 Despite their good electrochemical characteristics, their phase, chemical structure stabilization and identification have actually complicated the strategy, due to which obtaining insight into their electrochemistry becomes a challenging task. On the other side, such approaches propose direct growth of materials on a substrate where the mass of the active material grown remains very low.23,24 These limitations make them commercially inviable and the strategies become an imperative alternative. We do not aim to discredit the complex hierarchical materials in composition, while it is directed to provide alternative facile and cost effective strategies/materials.
Alongside, with the depletion of fossil fuels, the demand for novel, cleaner, efficient and ecofriendly energy conversion systems has also increased. Volatile organic compounds (VOCs) like methanol are extremely toxic for humanity, which can lead to permanent blindness with meagre amounts of intake.25 Therefore, it becomes evident to develop novel catalytic systems for the successful and efficient oxidation of methanol in order to minimize its environmental emission. Moreover, catalytic combustion of methanol is considered to be the most effective technology which bears advantages including high efficiency, low temperature functioning, and non-cumbersome instrumental infrastructure and the most important one is no secondary pollution.26 The strategy is also useful for the fabrication of direct methanol fuel cells (DMFCs).27 Generally, metals have been considered as the best agents in these oxidation reactions; however, their existence in nano-size and their utilization on a large scale pose difficulties in terms of cost effectiveness and toxicity.28 Therefore, alternate systems/materials are required to be developed which possess high surface area, porosity and cheap synthesis approaches with broader applicability.
For various energy device related applications, transition-metal oxides (TMOs) with hierarchical morphologies have emerged as novel alternatives.29–31 TMOs are employed in catalytic oxidation of methanol because of their excellent redox capability, and directed ion transportation and their nanostructures with enhanced surface area increase the reaction rate exponentially.32,33 Hierarchical hollow nanospheres provide extensive charge accumulation and surface sites for ion adherence, which is essential for various energy storage and conversion applications including batteries, supercapacitors, catalysis, sensors, electromagnetic shielding, etc.14,34–37 On the nanoscale, it is actually difficult to maintain the size and shape integrity, along with the reproducibility. Various reports focused on the synthesis of hierarchical hollow spheres of metal oxides reported about the low yield per batch and distortion in the structural/morphology integrity beyond the optimized precursor concentrations.38–41 Therefore, the time has now come to design more concentrated and generalized protocols to stabilize materials for large scale utilization. Manthiram et al. have stabilized various synthesis protocols for stabilizing the carbon based structure morphologies.42,43 These kinds of works paved our way to think in this direction to optimize the synthesis protocols taking one common material into consideration at first.
Various TMO based electrode materials for supercapacitors and catalytic conversions, showing intriguing morphologies, have been reported, which include Co3O4, NiCo2O4, SnO2, CuO, MnO2, etc.44,45 Besides these, spinel systems have been proven more effective than simple/single metal based TMOs.46 Herein, we report a facile strategy to stabilize uniform and confined sized NiCo2O4 hierarchical hollow nanoballs (NCO_HHNBs) by utilizing a sacrificial template based cost effective and scalable strategy. The growth mechanism for the synthesized nanoballs has been elaborately discussed explaining the nanochemistry involved on the reaction scale. NiCo2O4 (NCO) has been chosen as a model material because of its excellent redox capability, tunable morphologies, high phase stability, integrity and its imperative usage in various energy related applications. A detailed electrochemistry of the NCO_HHNB electrodes and AC (activated carbon)||NCO_HHNB asymmetric supercapacitor, exhibiting excellent characteristics, is discussed in the paper. Further, the same material was utilized for methanol oxidation, where the material displayed excellent electro-oxidation activity with good stability over longer durations. Both the applications proved the usability of the synthesized NCO_HHNB based electrodes for high performance, ecofriendly, scalable and low cost energy storage and conversion systems.
Experimental section
Materials used
Nickel nitrate hexahydrate (Ni(NO3)2·6H2O, 99%), cobalt nitrate hexahydrate (Co(NO3)2·6H2O, 99%), isopropanol, and glycerol were purchased from Sigma Aldrich. For electrode preparation, pigment carbon black, polyvinylidene fluoride, N-methyl-2 pyrrolidone (NMP) and activated carbon were purchased from Samchun Chemicals and Sigma Aldrich. For the electro-oxidation study, methanol (99%) was procured from Samchun Chemicals and used as purchased.Materials synthesis
The proposed scheme involves a facile two-step process. In the first step, Ni–Co glycerate precursor was synthesized by preparing a homogeneous solution of 90 mL containing Ni(NO3)2·6H2O and Co(NO3)2·6H2O (80 mg and 160 mg) in a solvent of isopropanol and glycerol in a volume ratio of 5![[thin space (1/6-em)]](https://www.rsc.org/images/entities/char_2009.gif) :1. The obtained homogeneous solution was preheated at 80 °C in order to increase the activation energy of the solution, then transferred to a Teflon lined stainless steel container and heated to ∼190 °C. The solution was kept at this temperature for another 6 h, under controlled conditions. Then the obtained solution was cooled to room temperature and centrifuged/washed with de-ionized (DI) water and ethanol three times each to get the Ni–Co glycerate precursor product. The product was dried in a vacuum at 60 °C for 24 h. In the second step, the obtained dried powder was annealed in air for 4 h at 400 °C, with a ramp rate of 1 °C min−1, and the resultant powder was preserved for further use. The appropriate concentration of the solvent was optimized with a series of reactions and the related results are discussed in detail. Similarly, the electrodes for activated carbon were also fabricated.
:1. The obtained homogeneous solution was preheated at 80 °C in order to increase the activation energy of the solution, then transferred to a Teflon lined stainless steel container and heated to ∼190 °C. The solution was kept at this temperature for another 6 h, under controlled conditions. Then the obtained solution was cooled to room temperature and centrifuged/washed with de-ionized (DI) water and ethanol three times each to get the Ni–Co glycerate precursor product. The product was dried in a vacuum at 60 °C for 24 h. In the second step, the obtained dried powder was annealed in air for 4 h at 400 °C, with a ramp rate of 1 °C min−1, and the resultant powder was preserved for further use. The appropriate concentration of the solvent was optimized with a series of reactions and the related results are discussed in detail. Similarly, the electrodes for activated carbon were also fabricated.
Materials characterization
The phase identification of the synthesized materials was performed by analyzing the X-ray diffraction (XRD) profile obtained using a X-ray diffractometer from Rigaku Corporation, Tokyo, Japan. The Fourier transform infrared (FT-IR) spectroscopy measurements were performed using a PerkinElmer spectrophotometer (Spectrum two, UK) following the KBr pellet method. The oxidation states of the respective ions in the material were identified by analyzing the X-ray spectroscopy (XPS, Theta Probe; Thermo Fisher Scientific, UK) profiles. The morphology identification was performed by field emission-scanning electron microscopy (FE–SEM, SUPRA 40 VP; Carl Zeiss, Germany). The intrinsic morphological characteristics were examined by transmission electron microscopy (TEM, H–7650; Hitachi Ltd, Japan) micrographs and the observed diffraction patterns. The elemental compositions of the as-obtained electrode materials were investigated by energy dispersive X-ray analysis (EDAX, SUPRA 40 VP; Carl Zeiss, Germany). The physical properties including the surface area and pore size were determined by examining the N2 adsorption–desorption isotherms (Micromeritics ASAP 2020) for NCO_HHNBs.Electrochemical measurements of supercapacitors
Electrochemical characterization of the synthesized NCO_HHNB was performed initially using a three-electrode configuration equipped with Ag/AgCl and a Pt electrode as the reference and counter electrodes, respectively, in 2 M KOH aqueous electrolyte solution. Slurries for the working electrode were prepared with 80 wt% of the active material (NCO_HHNB), 10 wt% of carbon black, and 10 wt% of polyvinylidenefluoride (binder). All the components were integrated together using NMP as the mixing medium. The obtained slurry was drop cast onto a pretreated Ni foam (with 30 wt% HCl, water and acetone washing) with the dimensions of 1 cm × 1 cm. The fabricated electrodes were characterized with cyclic voltammetry (CV), galvanostatic charge–discharge (CD) and electrochemical impedance spectroscopy (EIS) on a CHI660E potentiostat. EIS measurements were performed in the frequency range from 0.01Hz to 100kHz.
Device fabrication was accomplished by assembling NCO_HHNBs as the positive electrode and commercially available activated carbon as the negative electrode. Cellulose paper was sandwiched between the electrodes as the separator to avoid short-circuiting. The electrodes were square in shape with a size of ∼1.5 cm2. The electrodes were prepared in the same way as done in the case of three electrode measurements by optimizing the mass to charge ratio for both the materials (discussed in the ESI†). The observed results using CV, CD and EIS measurements were carefully analyzed and discussed in the paper. The relations utilized for the calculation of specific capacitance, volumetric charge, energy and power density are discussed in the ESI.†
Methanol oxidation measurements
All the electrochemical tests for analyzing methanol oxidation reactions were conducted using the same CHI 760C electrochemical workstation in a three electrode configuration with Pt foil as the counter electrode, a saturated Ag/AgCl electrode in 3 M KCl as the reference electrode (RE), and NCO-HHNBs on Ni foam as the working electrode. All the measurements were performed in 1 M KOH with different concentrations of MeOH (0–1 M) in it. The potential window chosen for the measurements was 0–0.5 V at room temperature. Chronoamperometry (CA) tests were conducted at a potential of 0.5 V (vs. Ag/AgCl) for consecutive 7000 s under optimized conditions. EIS experiments were carried out at an AC amplitude of 5 mV in the frequency range of 100 kHz–10 mHz.Results and discussion
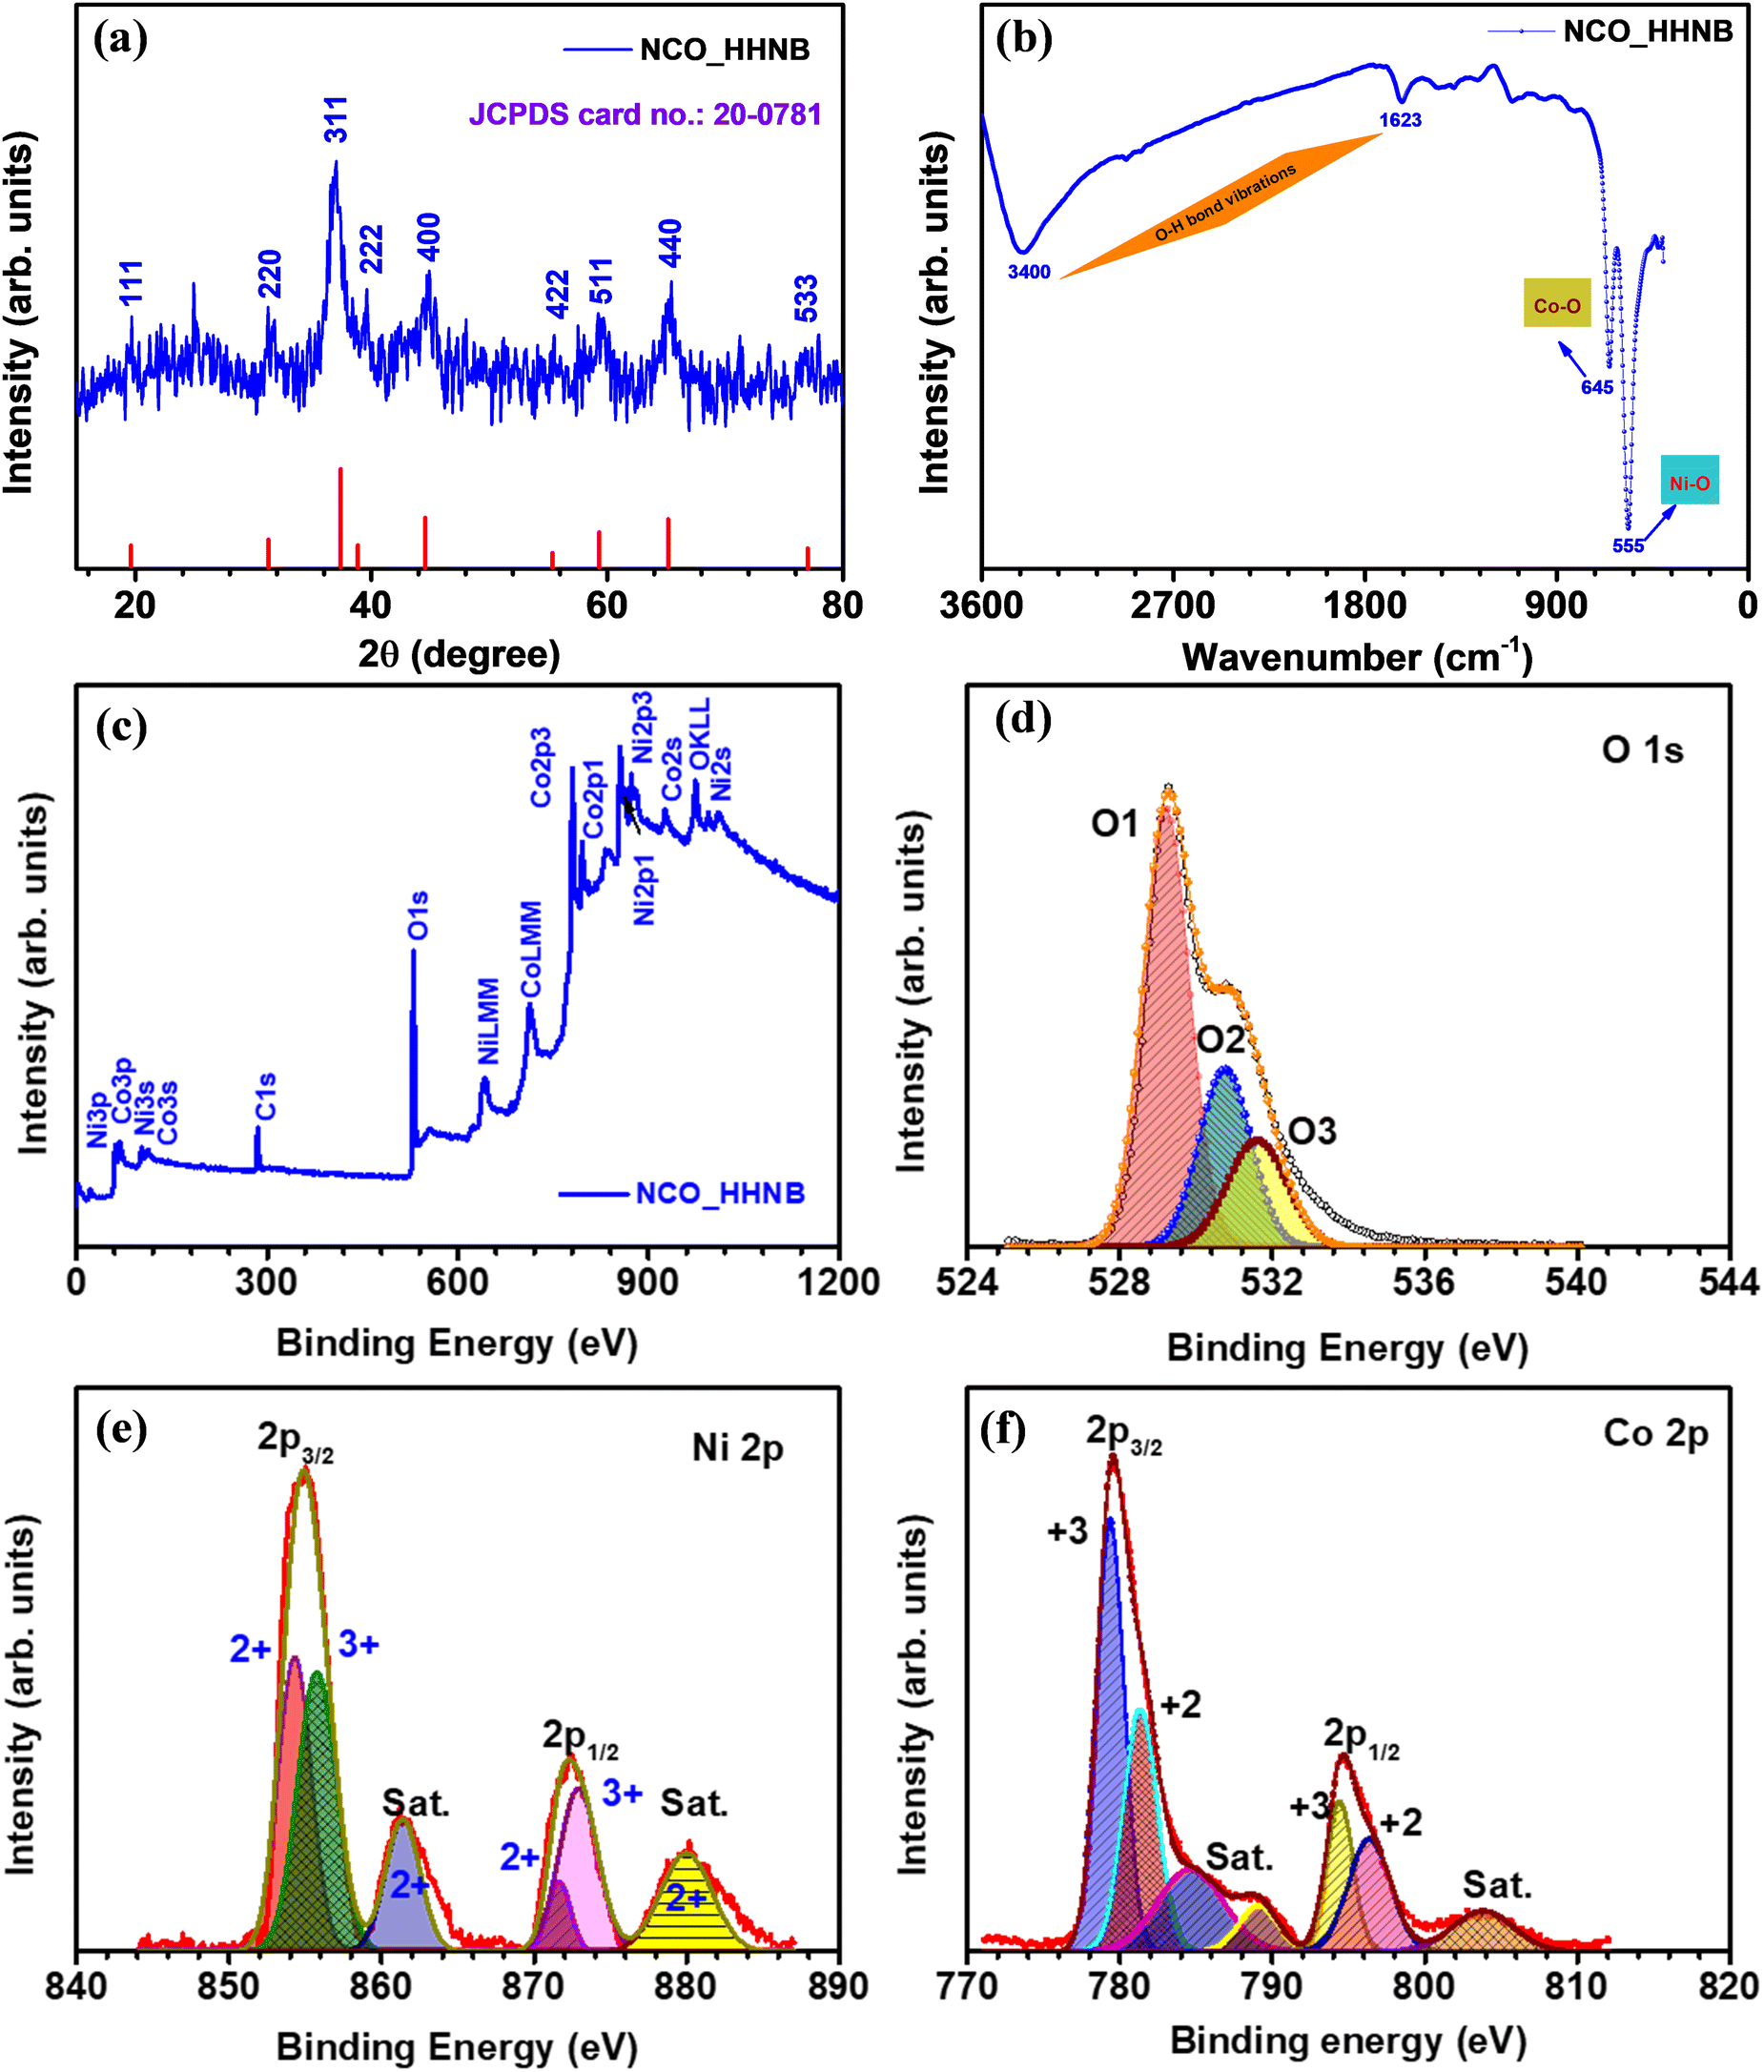
The first step after synthesizing any material is to identify its physical and chemical characteristics such as phase, morphology and effective specific surface area. Therefore, the phase of the synthesized material was identified by analyzing XRD, FTIR and XPS profiles. The XRD profile of the as prepared Ni–Co glycerate precursor material is shown in Fig. S1 (ESI†), where no peak referable to any stable phase was visible. Fig. 1a shows the XRD profile for NCO_HHNBs, depicting a clear demarcation of the respective planer reflections typically visible for the NiCo2O4 phase.47 The observed peaks reflected from (111), (220), (311), (222), (400), (422), (511), (440) and (533) planes were indexed using JCPDS card no. 20-0781. The characteristics of the material indicated a cubic spinel unit cell structure having the Fd![[3 with combining macron]](https://www.rsc.org/images/entities/char_0033_0304.gif) m space group, which is generally shown by spinel structures. The average lattice constant and cell volume were found to be 0.8061 nm and 0.5238 nm3, as calculated using Bragg's equation.48 The crystalline peaks without any indication of any prominent extra/impurity peak confirmed the clear phase formation in the material. The average crystallite size calculated from the (311) peak was ∼16 nm, using Debye–Scherrer's equation.48
m space group, which is generally shown by spinel structures. The average lattice constant and cell volume were found to be 0.8061 nm and 0.5238 nm3, as calculated using Bragg's equation.48 The crystalline peaks without any indication of any prominent extra/impurity peak confirmed the clear phase formation in the material. The average crystallite size calculated from the (311) peak was ∼16 nm, using Debye–Scherrer's equation.48
 | ||
| Fig. 1 (a) XRD, (b) FTIR and (c)–(f) XPS profiles (including survey spectrum and individual deconvoluted spectra of Ni 2p, Co 2p, and O 1s) for NCO_HHNBs. | ||
Fig. 1b displays the FTIR spectrum observed for NCO_HHNBs. Two strong characteristic absorption bands were observed at ∼555 cm−1 and ∼645 cm−1, which could be indexed to the Ni–O and Co–O bond vibration, respectively.49 Two other weak and broad absorption bands were observed at ∼1635 cm−1 and ∼3400 cm−1, which were assigned to the stretching and bending modes of the adsorbed water at the surface of the material or could be referred to as the O–H bond vibration.49 The FT-IR spectrum reaffirmed the results concluded from the XRD profile and confirmed the high purity of the NiCo2O4 phase in the synthesized NCO_HHNB.
The composition and the surface electronic state of the various contributing ions in the NCO_HHNB were confirmed by analyzing the collected XPS spectra. Fig. 1c shows the XPS survey spectrum for NCO_HHNBs representing the marked signals, which depicted the presence of O 1s, Co 2p, and Ni 2p levels. The C 1s core level spectrum generated from the carbon-based support is not shown here because it has no relevance in the analysis of the material. Fig. 1d shows the O1s core level spectrum for NCO_HHNBs, exhibiting clear presence of an overlapping doublet consisting of an O1 peak at 529.7 and an O3 peak at 532.6 eV, respectively. These peaks could be attributed to the oxygen bonds with Ni/Co and respective adsorption of water at the material surface. One prominent O2 peak also came into existence while fitting the O 1s spectra at 531.5 eV. This has been assigned to the surface OH groups exposed as a result of the direct substitution of chemisorbed oxygen at the NCO_HHNB spinel surface, resulting in the formation of oxy-hydroxide species. This phenomenon is referred to as hydroxylation.50
Fig. 1e displays the Ni 2p spectrum clearly depicting the two spin–orbit doublets with intense peaks centred at 853.5 and 871.9 eV, respectively. The corresponding satellite peaks are also visible and marked in the figure (for Ni 2p2/3 and Ni 2p3/2 levels, respectively). Both the characteristic peaks observed in the spectrum showed the coexistence of Ni3+ and Ni2+ oxidation states in the material.51 In Fig. 1f, the profile for Co 2p showed two spin–orbit doublets from the core level at 779.8 and 788 eV (Co 2p3/2), which could be attributed to the existence of the 3+ state. On the other hand, for the Co 2p1/2 level doublets were observed at 795.3 and 803.7 eV, which could be attributed to the presence of the 2+ state. Therefore, the observed results gave a clear indication towards the co-existence of 2+ and 3+ states for both Ni and Co in NCO_HHNBs.
Scanning electron microscopy (SEM) and transmission electron microscopy (TEM) micrographs of the as prepared precursor sample with the Ni–Co glycerate phase are shown in Fig. 2a–e. The XRD profile of Ni–Co glycerate is shown in Fig. S1 (ESI†). The micrographs showed the stabilization of perfect solid ball like spherical structures having dimensions in the range of 250–300 nm, which was also confirmed and well supported by the TEM micrographs. Here, the perfect hollow nanoballs are referred because of the mono-dispersity in the shape of the nanoballs with a near-uniform spherical shape. Various reports in the literature claim perfect nanospheres/nanoballs; however, they are distorted at various places. Here, the utilized method provides excellent stability in spherical nature of the balls due to the base spherical template composed of glycerol–isopropanol interfacial chemistry. This clearly envisaged the fact that perfect and long range of solid spheres can be achieved by the mentioned synthesis protocol. Further, the SEM and TEM micrographs shown in Fig. 2f–j show that the hollow core evolved with the annealing of the precursor sample along with the conversion of Ni–Co glycerate to NiCo2O4 hierarchical hollow nanoballs. The observed nanoballs were hierarchical in nature because small nanoparticles of NiCo2O4 grew over each other to stabilize the spherical morphology around the sacrificial template, i.e., glycerol.
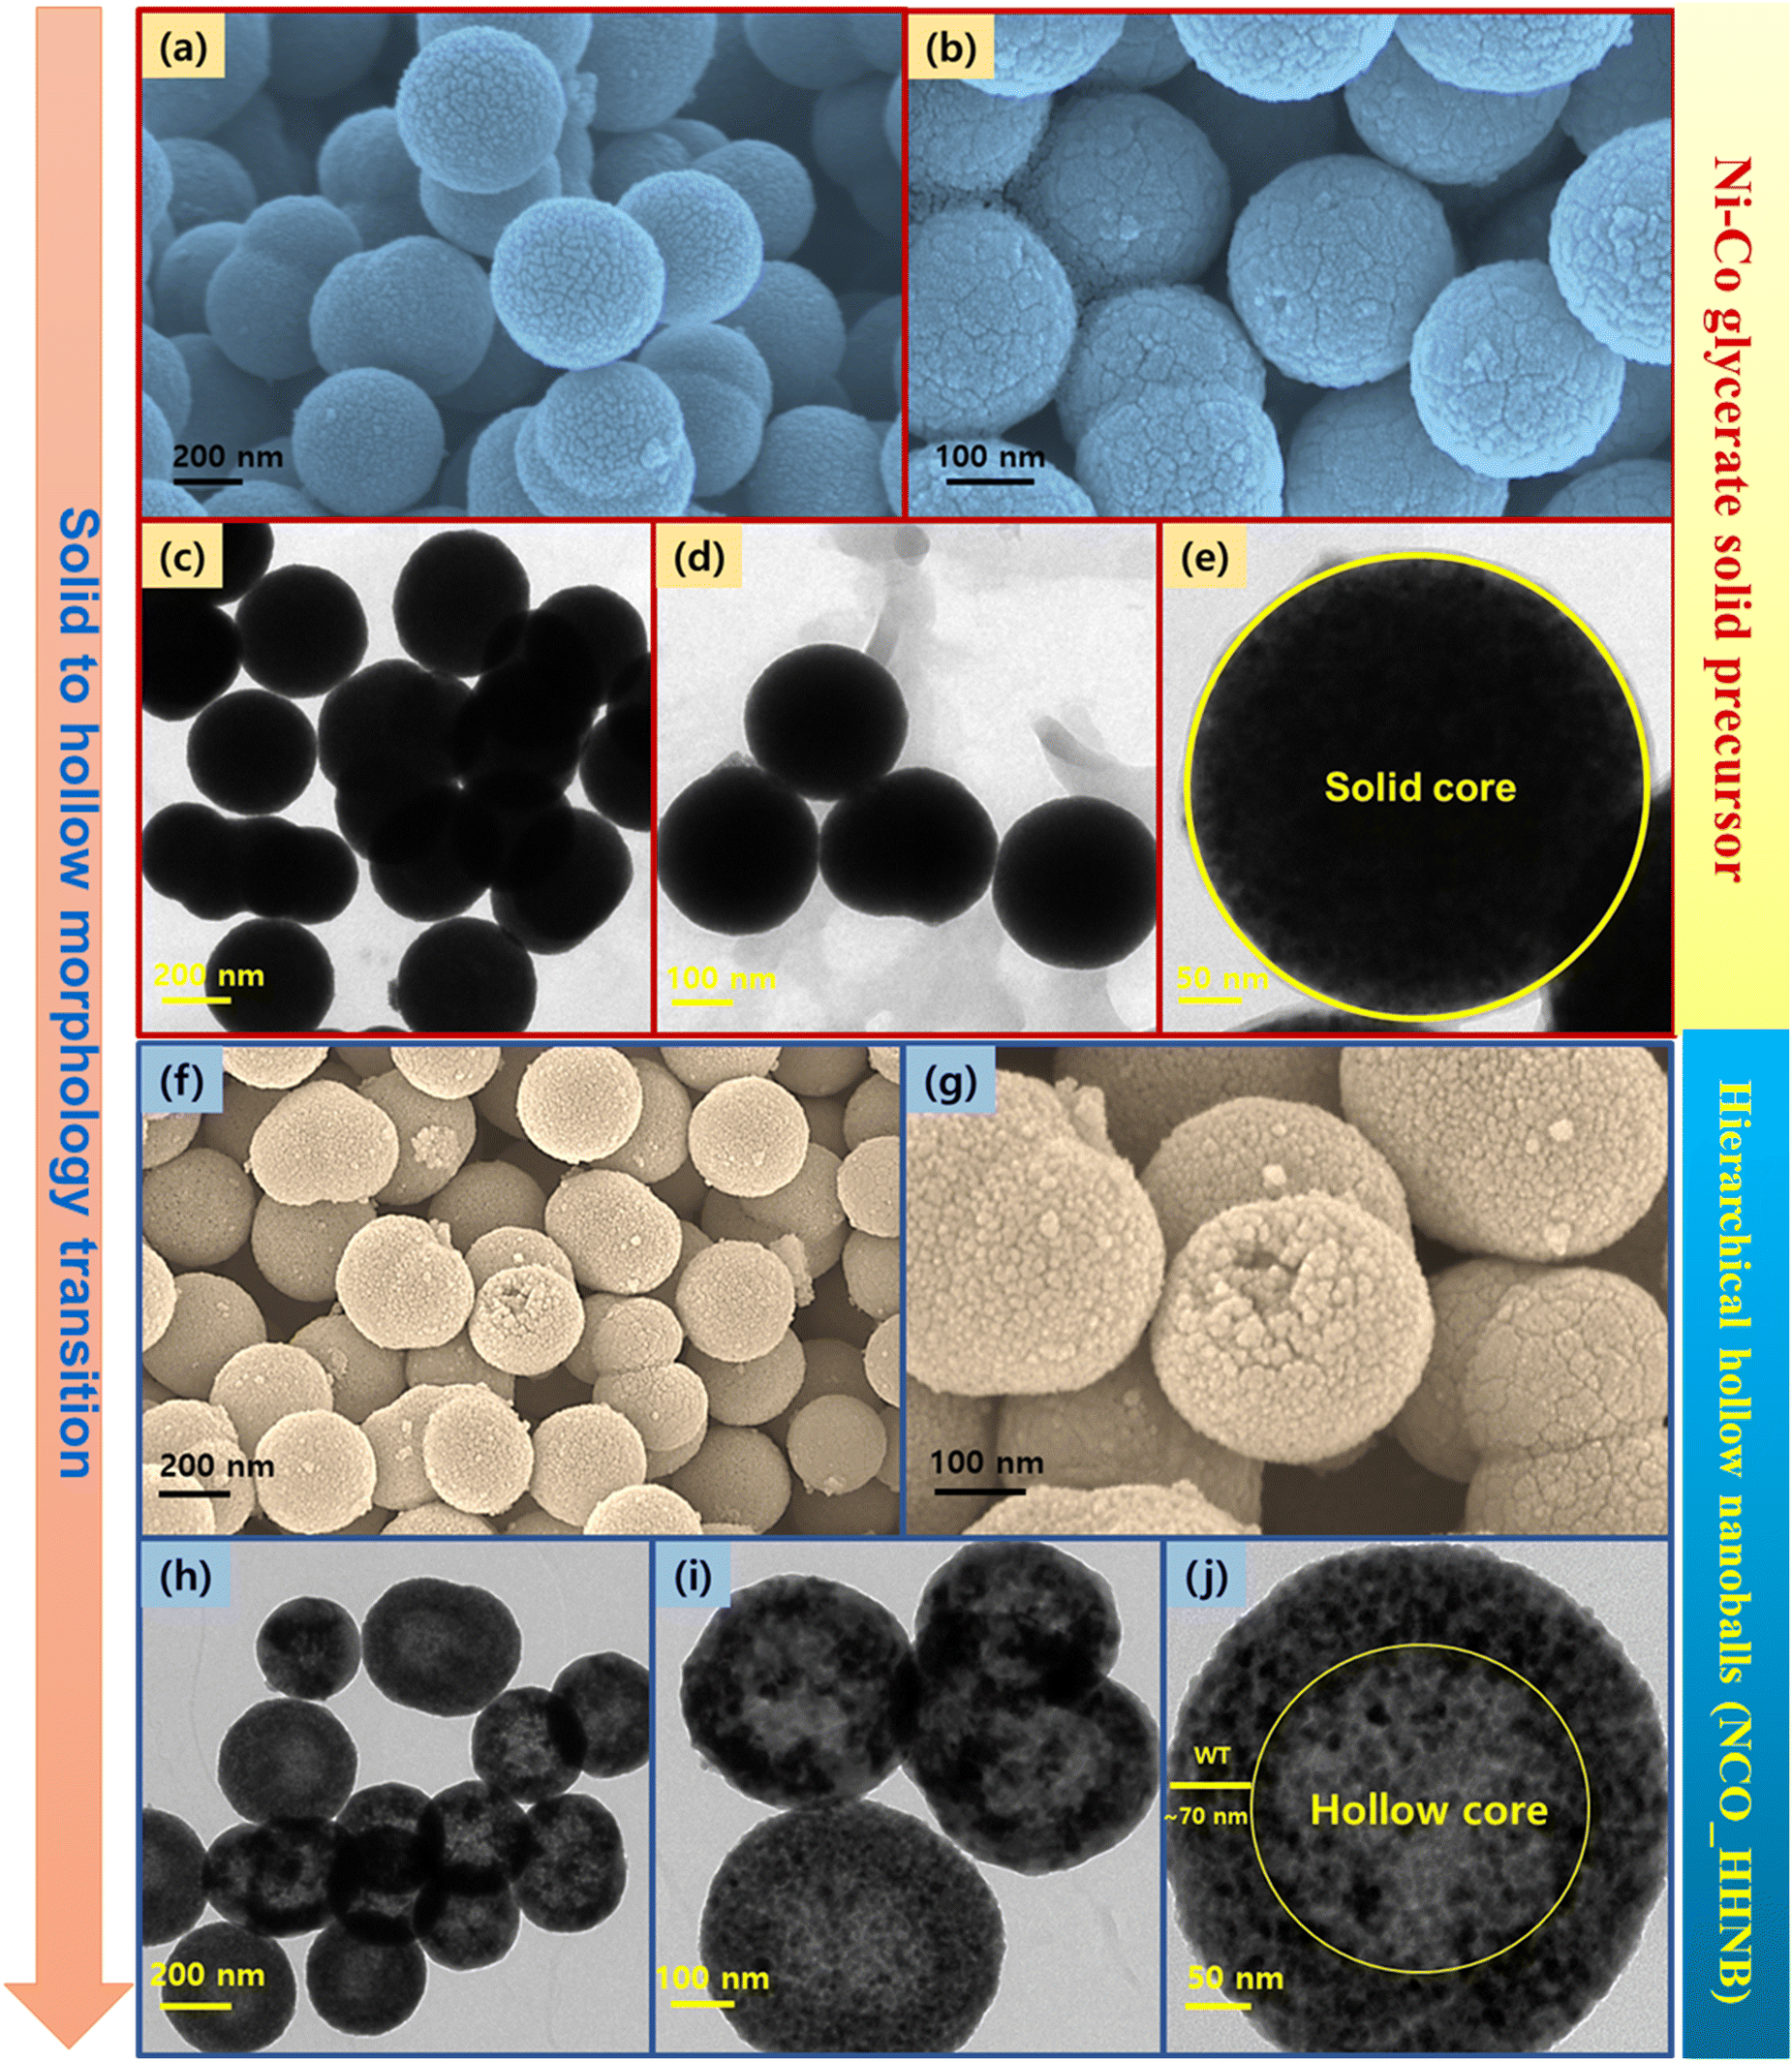 | ||
| Fig. 2 SEM and TEM micrographs (a)–(e) for the Ni–Co glycerate solid precursor and (f)–(j) NCO_HHNBs. | ||
The synthesis mechanism schematic for NCO_HHNBs is shown in Fig. 3a. At 180 °C, the dissociated nitrate anions undergo redox reactions with isopropanol to generate acetone, as follows:52
| 4(CH3)2CHOH + NO3− ↔ 4CH3COCH3 + NH3 + OH− + 2H2O | (1) |
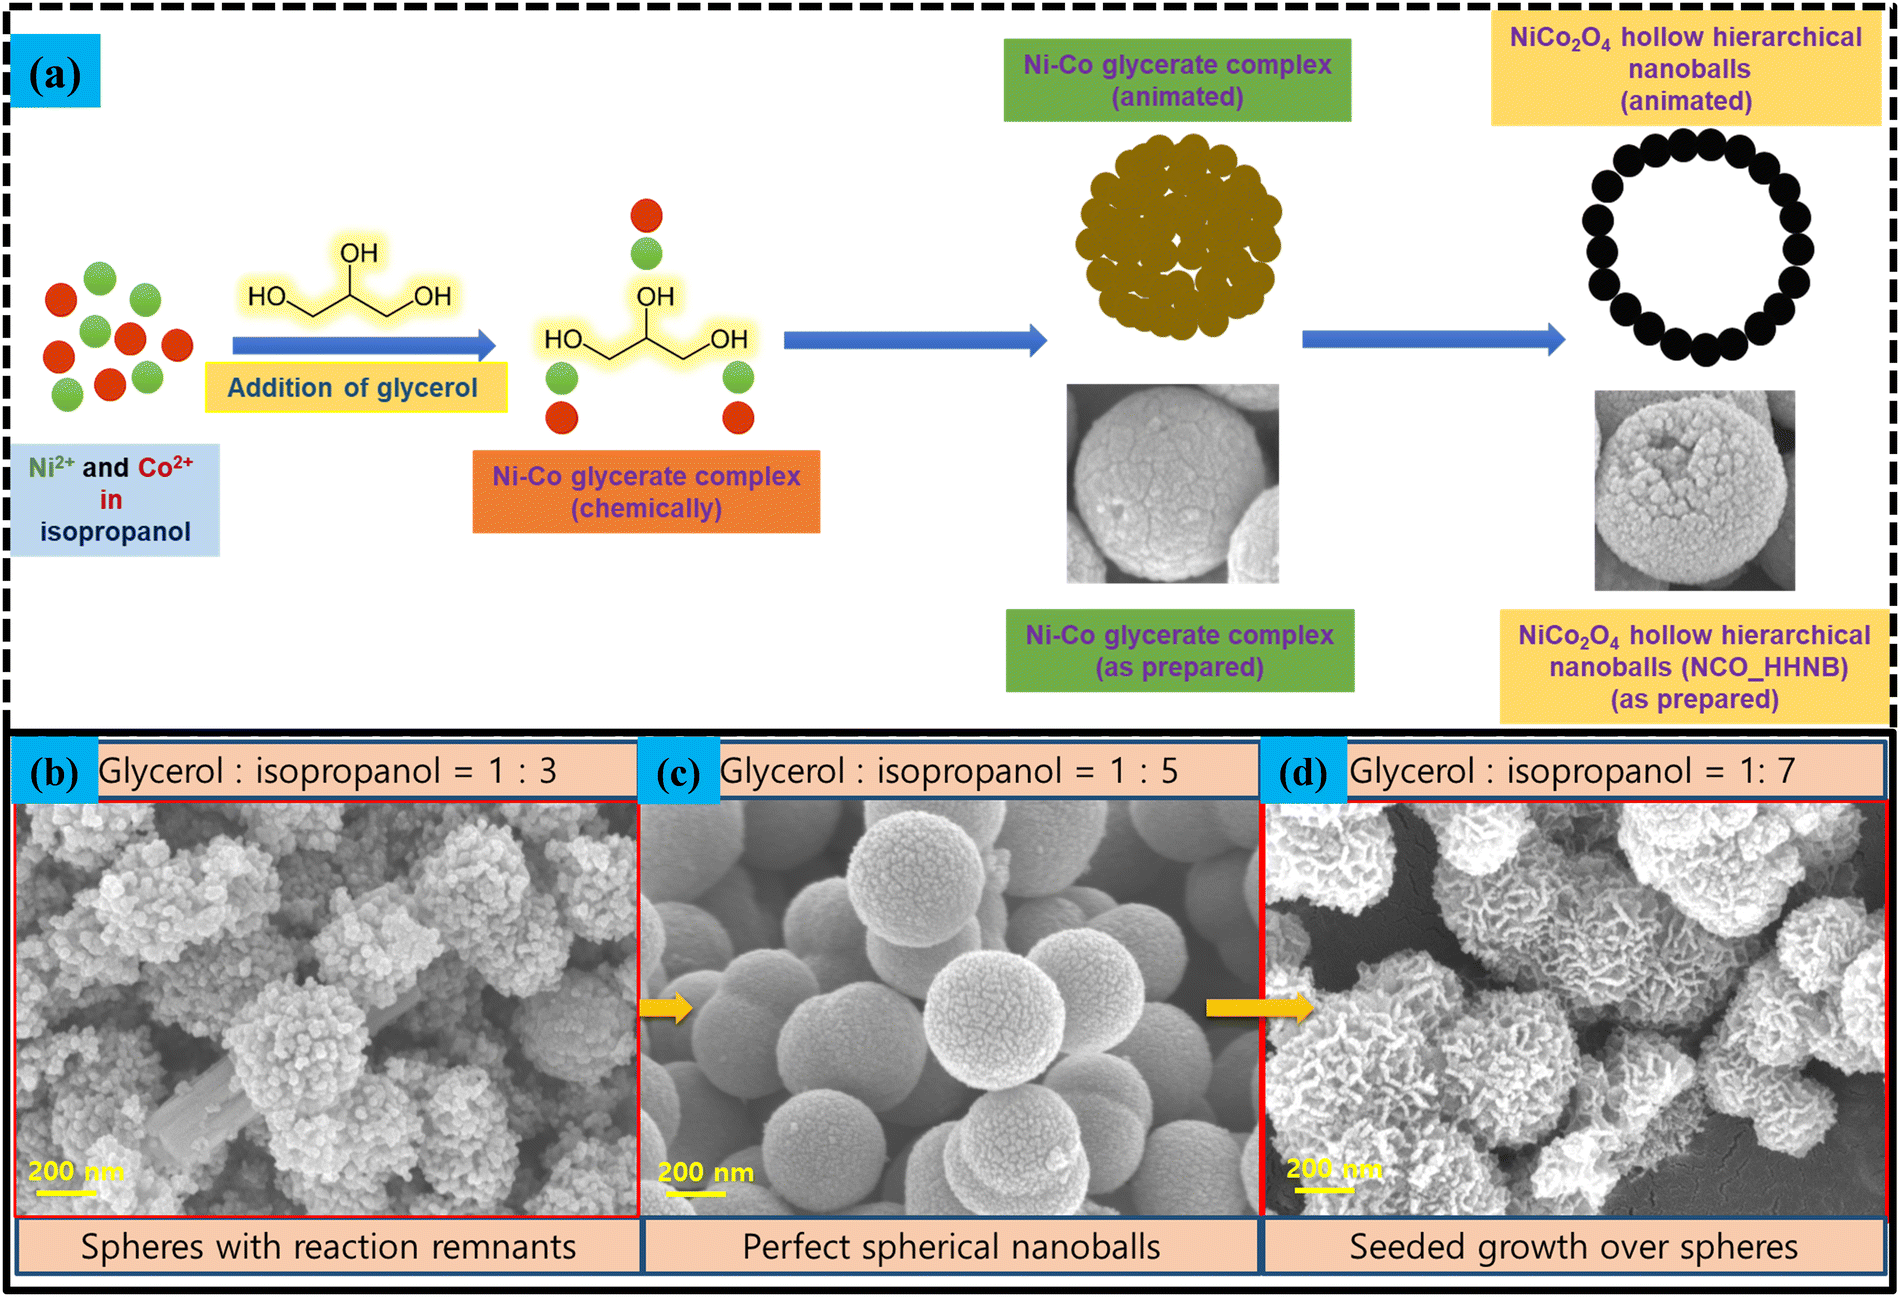 | ||
| Fig. 3 (a) Schematics of the NCO_HHNB stabilization. (b)–(d) SEM micrographs showing the alterations in the morphology of NCO_HHNBs when the solvent ratio was changed from 1:3 to 1:5 to 1:7. | ||
The reaction leads to generation of hydroxyl ions, which stabilized Ni and Co cation based double hydroxide precursors. During the course of reaction, in parallel, glycerol molecules assembled together to form micellar spherical frameworks via inter-molecular hydrogen bonding. The stabilized quasi emulsion structure started to act as a self-template for the self-assembly of Ni and Co ions to form Ni–Co glycerate solid spherical precursors. The ratio of glycerol to isopropanol has been optimized to stabilize perfect solid spheres. Fig. 3b–d shows what happened if the proportion of solvents was altered. This led to stabilization of non-uniform structures. Below the optimized concentration, i.e., at 1:3, particles assemble in the form of an uncompleted spherical structure appearing to be just like aggregation of small particles with no distinguishable morphology (see Fig. 3b). It was found that the solvent required for the stabilization of the spherical or ball like morphology in a ratio of 1:5 was appropriate (see Fig. 3c). Further, when the solvent ratio was changed to 1:7, then the troughs in the morphology started to act like seeds for the further growth and accumulation of nanoparticles (see Fig. 3d). This led to the formation of a groove and trough like morphology over spheres.
The growth mechanism behind the morphology stabilization can be understood by the fundamental thermodynamics and kinetic laws of nucleation and growth. At high pressure, the supersaturation is achieved at lower temperatures and eventually, the evolution of the second phase starts. The nuclei evolved due to supersaturation start to assemble around the sacrificial templates present in the surrounding solution. As in the present case, glycerol–isopropanol are present in the surroundings acting as spherical templates; hence, the nucleated particles start to assemble in the direction of minimization of surface energy. This led to stabilization of bi-metallic uniform sized spheres of Ni–Co glycerate. These Ni–Co glycerate nanoballs on annealing at even higher temperatures got transformed to self-assembled NiCo2O4 nanoballs maintaining their uniform size. As discussed previously, the concentration of glycerol and isopropanol significantly affects the morphology evolution; therefore, the optimized ratio of 1:5 led to stabilization of perfect nanoballs. The reason behind the hollow cavity is the elimination of the template at elevated temperatures; however, the spherical integrity is solely dependent on the solvent proportion used in the reaction because, with the alteration in the solvent proportion a significant change in the surface energy of the exposed surfaces takes place, which affects the growth of the nanoparticles in a particular direction, leading to distorted morphologies from the ideal spheres. Hence, the solvent proportion as well as the reaction temperature determines the morphology evolution in the hollow structures. The phase conversion to oxide took place because of the instability of glycerol at higher temperatures being an organic molecule.
The observed surface area of the material was ∼73 m2 g−1. The N2 adsorption–desorption isotherm and pore size profile are shown in Fig. S2a and b and discussed in the ESI.† The pore size distribution showed that the average pore radius is ∼4 nm, which lies in the mesoporous range. For supercapacitor electrodes, the role of mesoporous structures is quite evident, as they are favourable for high voltage and energy density. As depicted from Fig. 3a, the surface of hollow structures is composed of small nanoparticles adhered to each other to evolve as a big nanostructure. Therefore, the surface roughness along with the porous structure property will contribute to enhanced charge collection in the electrode's vicinity. The total volume and mesopore volume were 0.373 cm3 g−1 and 0.0091 cm3 g−1, respectively. The EDAX spectra showing the related ion contribution (Table S1 and Fig. S3, ESI†) and SAED pattern (Fig. S4a and b) are discussed in the ESI.†
In the previous reports, the method has been reported for CuCo2O4, ZnCo2O4 and Co3O4; however, the precursors taken for the reaction processes were very small in amount, not favorable for scalable synthesis.11,38 The novelty of the present work lies in the optimization of the synthesis process with some changes in the reaction parameters and its simplification for batch synthesis. This also answers the queries raised on the repeatability of the morphology. The detailed discussion of the growth mechanism of the stabilized nanoballs also gives significant insight into the nano-chemistry involved behind the morphology stabilization. The material was also synthesized in a 500 mL reactor and the obtained SEM micrographs are shown in the ESI† as Fig. S5.
Electrochemical investigation
After the necessary understanding and detailed discussion on the phase, morphology, growth mechanism and surface area of NCO_HHNBs, it was anticipated that such properties perfectly match with an excellent energy storage and conversion material. It has been reported that the performance of the hollow nanostructures surpasses that of the corresponding solid structures and their composites involving conducting agents. Therefore, the electrochemical performance of the NCO_HHNB based electrode fabricated on a Ni-foam substrate (as a current collector) was tested in 2 M KOH. Due to the smallest solvation radius of the K+ ion, it was preferred over LiOH and NaOH based aqueous electrolytes.53 The mass of the active material was kept at ∼2 mg for all single electrode measurements. The CV profiles in the scan rate range of 10–200 mV s−1 are shown in Fig. 4a. The results showed a stable potential window ranging from −0.2 to 0.5 V. The observed window was higher than the typical voltage window reported for various compositions of NiCo2O4 based materials and their composites.47,49,51,54 It was anticipated that the existence of a higher voltage window would also contribute to increasing the performance in the negative regime and provide a boost to the negative electrode.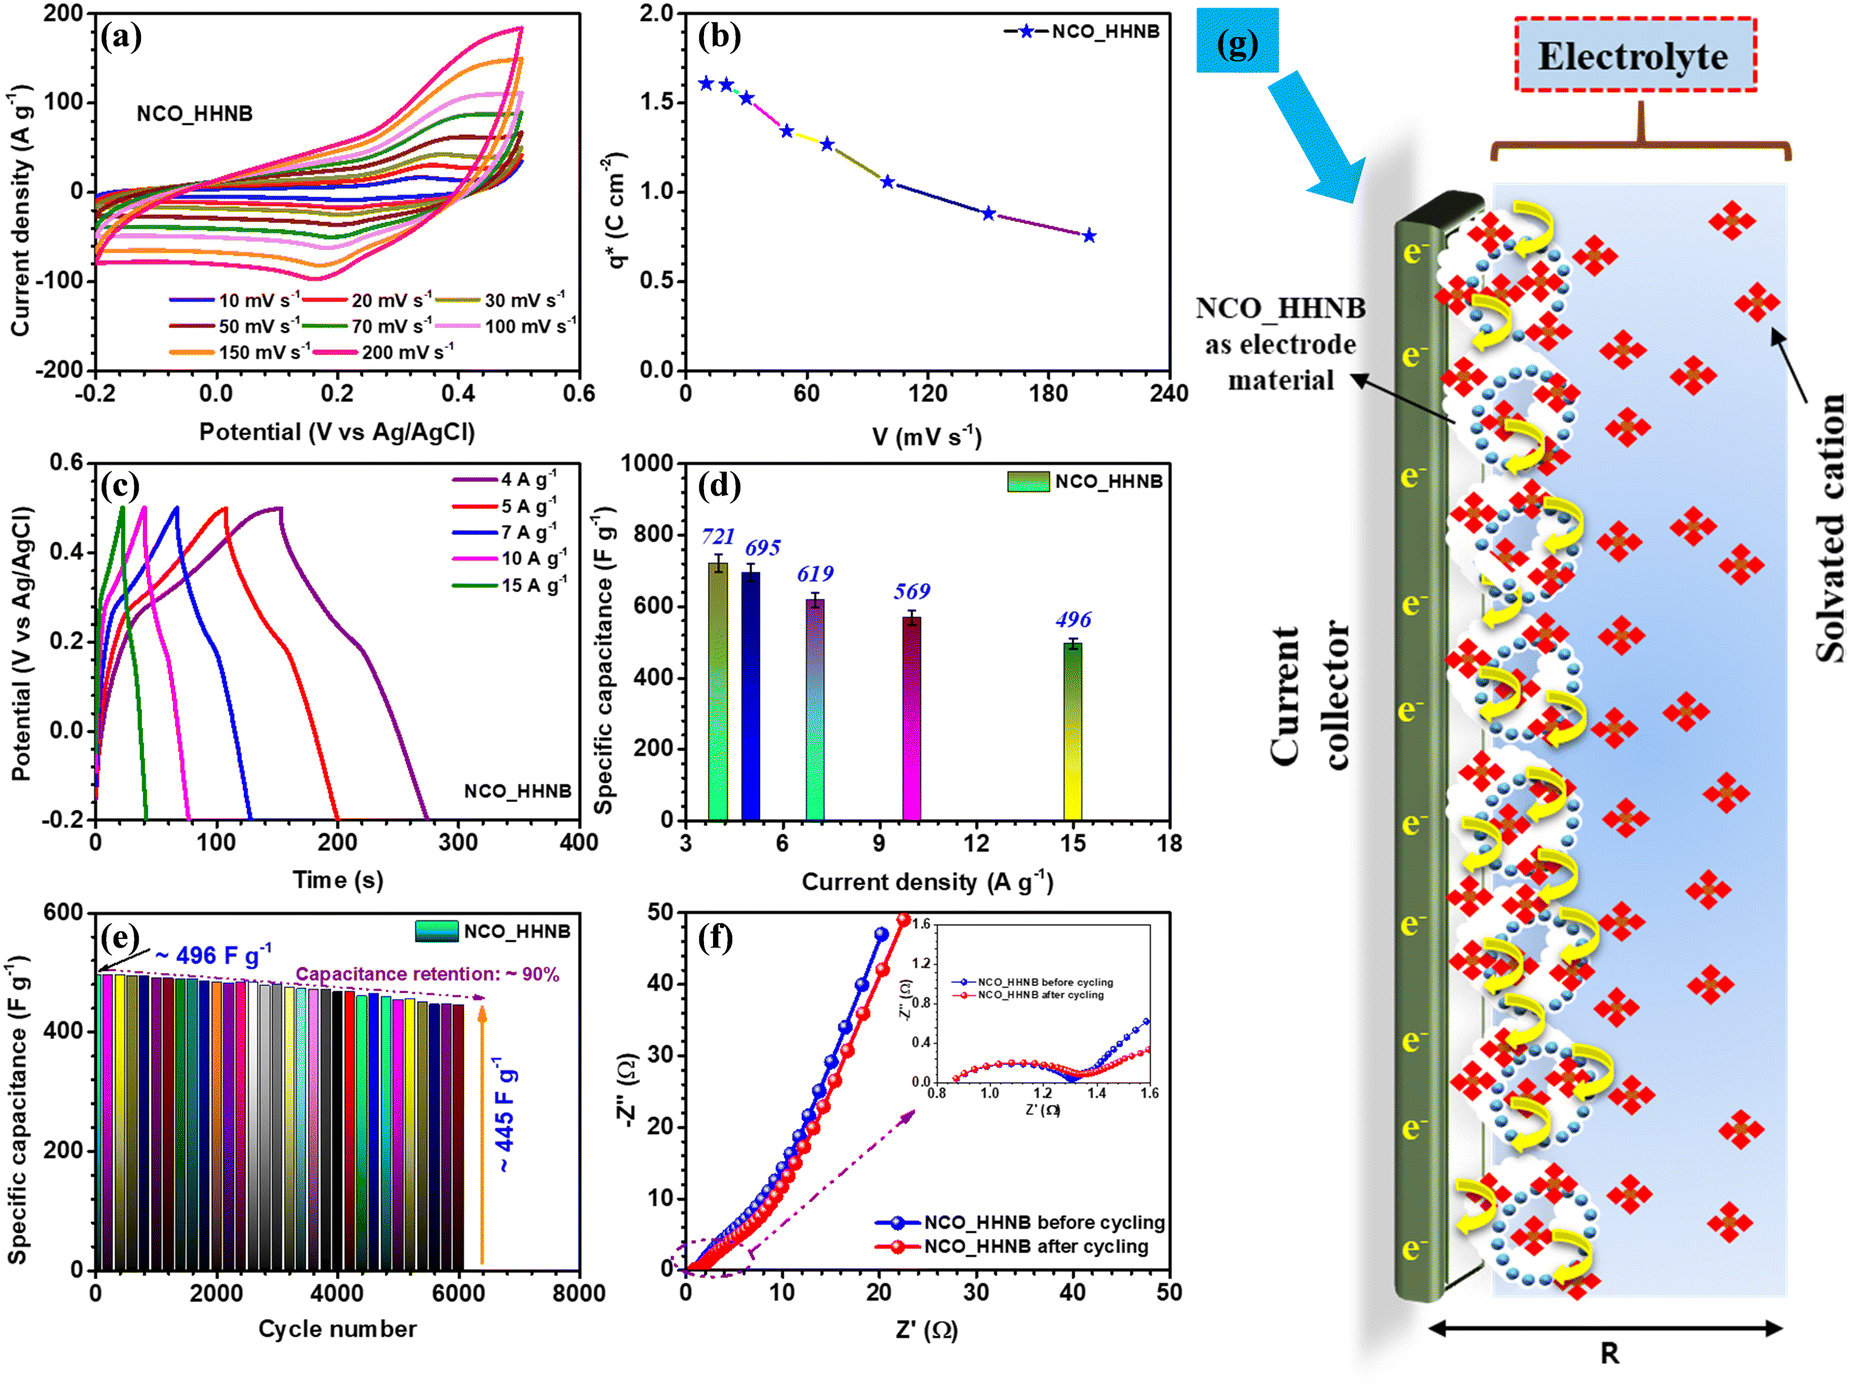 | ||
| Fig. 4 (a) The CV profile at various scan rates, (b) voltammetric charge distribution curve, (c) charge–discharge profiles at various current densities, (d) variation of specific capacitance with current density, (e) variation of specific capacitance with cycle number, (f) Nyquist plots before and after cycling (in the inset, the high frequency region is zoomed), and (g) schematics of the charge storage mechanism taking place at the electrode surface for NCO_HHNBs in a three electrode cell configuration. | ||
For gaining better insight into the charge storage mechanism, the CV profile collected at 10 mV s−1 was investigated (see Fig. S6, ESI†), in which clear redox peaks were discernible. The oxidation and reduction peaks were observed at ∼0.34 and ∼0.22 V, respectively, with ∼0.12 V separation. This proved that the material is perfectly pseudocapacitive because for battery materials, the peak separation generally remains higher.55 The profiles shown in Fig. 4a at various scan rates showed stable nature of the electrode displaying redox reactions initiated as a consequence of inter-conversion of Ni2+/Ni3+ and Co2+/Co3+ redox couples, synergistically.47 For comparison, CV and CD profiles for solid NCO particles are also shown in Fig. S7a and b (ESI†) synthesized using the same synthesis protocol with a mere change in solvent concentration, as discussed earlier. The calculated specific capacitance values obtained at various scan rates are mentioned in Table S2 (ESI†) and plotted in Fig. S8a of the ESI.† The redox reactions can be represented as follows:
| NiCo2O4 + OH− + H2O ↔ 2CoOOH + NiOOH + e− | (2) |
| CoOOH + OH− ↔ CoO + H2O + e− | (3) |
| NiOOH + OH− ↔ NiO + H2O + e− | (4) |
Generally, Co(OH)2/CoOOH and Ni(OH)2/NiOOH are the intermediate steps during the electrochemical reactions in aqueous electrolytic solutions. The successive oxidation and reduction from the bi-metals in NiCo2O4 led to generation of more electrons in the outer circuit, which contributed to higher specific capacitance and charge-storage characteristics of the electrode. The relation used for the calculation of specific capacitance from CV profiles (eqn (S1), ESI†) is mentioned and discussed in the ESI.† The maximum specific capacitance obtained was 586 F g−1 at 10 mV s−1. With the increment in the scan rates a static shift in the redox peaks was observed on both sides; this could be attributed to the increase in the internal resistance for the incoming ions to the electrode surface, at higher scan rates.56 Thus, at higher scan rates the surface directed phenomenon becomes dominant and the effective values of specific capacitance get reduced.
The effective charge collected at the electrode determines the utility of the material in supercapacitors. This method was initially utilized for catalytic activity and later it was also utilized for supercapacitor electrodes to quantify the electrochemical performance of electrodes.14 The charge collected at the respective electrode was calculated by using eqn (S2) and (S3) (ESI†). Fig. 4b shows the change in charge stored at different scan rates, which is represented by q*. The maximum value obtained was ∼1.6 C cm−2 at 10 mV s−1. Fig. S8b (ESI†) shows the curve between q* and V−1/2 and the intercept of the curve gives the value of q0, which is the surface accumulated charge for the electrode. The calculated value of q0 was ∼1 C cm−2. This proves that the surface of the material exposed by hollowing the cavity has significantly enhanced the electrochemical performance.14
Charge–discharge profiles for the NCO_HHNB electrode are shown in Fig. 4c, collected at different current densities (4, 5, 7, 10 and 15 A g−1). The supercapacitors are known to show good repeatability at higher currents, which is actually reflected here in the CD profiles. The specific capacitance values calculated (using eqn (S4), ESI†) are plotted as a bar graph in Fig. 4d. The maximum specific capacitance observed was ∼721 F g−1 at 4 A g−1. The rate capability was ∼68% when the current was increased from 4 to 15 A g−1 (∼496 F g−1). The CD profiles were perfect, in terms of symmetry, exhibiting typical supercapacitor characteristics with a coulombic efficiency of ∼90%, at 4 A g−1, which was nearly maintained even at higher currents. This indicated the excellent repeatability of the electrode and established the material as one stable positive electrode which can provide excellent device characteristics, if clubbed with a suitable negative electrode. The repeatability of the electrode generally refers to maintenance of rate capability at high currents/scan rates as well as to the maintenance of coulombic efficiency at all currents considered. Here, in CV profiles, the shape of the profile remains intact even at higher scan rates with clear visibility of the redox peaks and no sign of water splitting in the considered potential window. Similar to this, in the case of galvanostatic charge discharge profiles, the near-triangular shape with the presence of small plateau regions pointing towards the redox peaks is visible at all currents with high coulombic efficiencies of ∼85%, ∼82%, ∼81%, ∼80%, and ∼78% at currents of 4–15 A g−1, respectively.
The cycling performance of the electrode was tested for 6000 subsequent cycles at 15 A g−1 and a mere small degradation of ∼10% in specific capacitance was observed (see Fig. 4e). This further confirmed that the material was stable after repetitive cycling and kept its performance alive without significant degradation. To see the status of the morphology after cycling, the SEM micrographs of the electrode material after cycling were collected and are shown in Fig. S9a and b (ESI†). Slight distortion in the shape of spheres at a few places was observed; otherwise, the spheres were intact.
The charge transfer kinetics, which describes various parameters of the electrodes, viz., electrode–electrolyte interplay, junctional chemistry, equivalent series resistance (Rs), charge transfer resistance (RCT), etc., was studied by analyzing the results obtained from electrochemical impedance spectroscopy (EIS) measurements.14 Nyquist plots provide such information for the material under consideration and are shown in Fig. 4f. The plot consists of two regions, i.e., high and low frequency. The high frequency region provides information about electrode–electrolyte interfacial kinetics and mechanism, while the low frequency region explains the charge storage behavior of the electrode, popularly known as Warburg characteristics. The Nyquist plot for NCO_HHNBs before cycling clearly shows that the low frequency region slope is <90° and tilted towards 45°, which indicates the contribution of both EDLC and pseudocapacitance in the charge storage process at the electrode.14 In the high frequency regime, the Rs and RCT were found to be ∼0.81 Ω and ∼1.30 Ω, respectively, with a nice semicircle denoting the excellent charge transfer and interfacial kinetics. After cycling, the low frequency regime tilted more towards 45° because of the extent of redox reactions undergone by the material. The charge transfer resistance increased a little to ∼1.35 Ω, which is a general trend observed after cycling. The increment in RCT was not so high with nearly the same RS after cycling, which corroborated the already discussed cycling results, exhibiting small capacitance fading, after 6000 repetitive cycles. The SEM micrographs of the NCO_HHNB after 6000 cycles are also shown in Fig. S8 (ESI†), which proved the morphology intactness after the cycling process and confirmed the observed cycling performance.
Asymmetric device performance
The NCO_HHNB based electrode was clubbed with the activated carbon (AC) based negative electrode to fabricate an asymmetric device. The device performance exhibited the superiority of hollowing the cavity of solid structures for supercapacitors. Proper charge and mass balance was taken into consideration while fabricating the device in order to achieve perfect supercapacitive response (using eqn (S5), ESI†). The typical CV curves of AC and NCO_HHNB at 10 mV s−1 are shown in Fig. 5a, where AC exhibited a maximum specific capacitance of ∼160 F g−1. The CV measurements were considered as a base for balancing the mass and charge for both the electrodes for the realization of a full cell. These profiles indicated a stable voltage window of ∼1.5 V with ∼0.2 V crossover potential for negative and positive electrodes.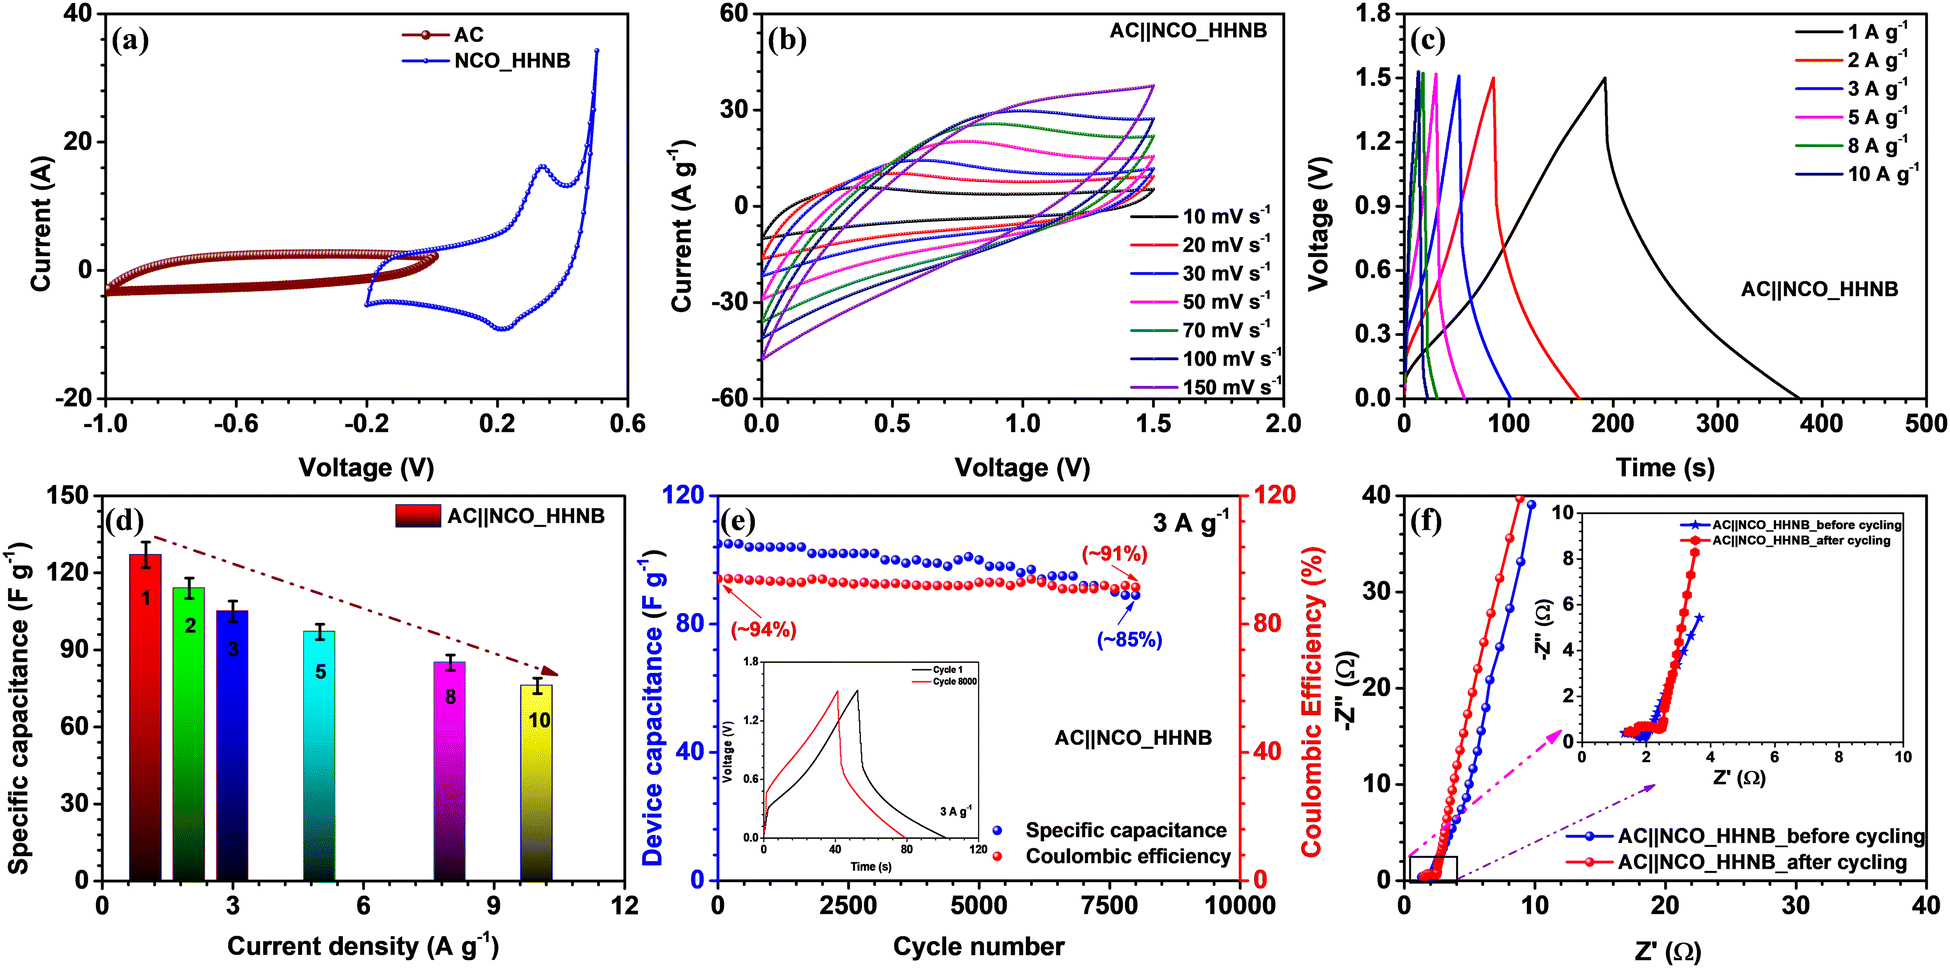 | ||
| Fig. 5 (a) The comparative CV profile of AC and NCO_HHNBs at 10 mV s−1, (b) CV profiles for the AC||NCO_HHNB asymmetric supercapacitor at various scan rates, (c) CD profiles for the AC||NCO_HHNB asymmetric supercapacitor at different current densities, (d) variation of specific capacitance of the device with current density, (e) cycling performance at 3 A g−1 and coulombic efficiency with cycling (the inset shows comparative CD profiles in cycles 1 and 5000), and (f) EIS profiles before and after cycling of the device (the inset shows the high frequency region). | ||
The voltage window for the device was optimized by collecting CV profiles in different voltage ranges from ∼1.2 to 1.5 V, as shown in Fig. S10 (ESI†). The voltage window of 1.5 V as expected from three electrode measurements was found to be fully stable, with no evidence of H2/O2 evolution. The mass of the device was kept at ∼6.1 mg after mass and charge balancing of the individual electrodes. The shape of the CV profile was nearly symmetric, which is expected from typical supercapacitors.
Fig. 5b shows the CV profiles for the AC||NCO_HHNB based asymmetric supercapacitor in the range of 10–150 mV s−1. The profiles were stable, confirming the high charge storage capacity of the device, with good repeatability. The device characteristics were also analyzed by CD measurements, as this is the most quantifiable technique to judge the performance for commercialization. CD profiles showed nearly triangular nature, corroborating the CV profiles, as visible in Fig. 5c. The coulombic efficiency at 1 A g−1 was >95%, which is considered to be excellent for the supercapacitor device and remained nearly consistent even at higher current densities. The maximum specific capacitance exhibited by the device was 127 F g−1 at 1 A g−1. A bar graph representing the variation of specific capacitance versus current for the device is shown in Fig. 5d and the calculated values are listed in Table S3 (ESI†). The capacitance retention was ∼57% when the current density reached 10 A g−1. Hollow interiors of the positive electrode accumulated excess volumetric charge and on the other hand, high conductivity of activated carbon provided balance on the negative electrode side. Thus, the synergistic combination of both the electrodes exhibited impressive device performance.
The cycling performance was tested at 3 A g−1 for the fabricated asymmetric supercapacitor and is shown in Fig. 5e. The device showed a capacitance retention of ∼85% after 8000 consecutive cycles. In the inset of Fig. 5e cycles 1 and 8000 are shown for comparison. The coulombic efficiency was also found to be stable with cycling and remained at ∼91% after 8000 cycles, starting from ∼94% during the first cycle. The outstanding cycling stability could be attributed to the highly porous nature, morphology retention, and large number of active surface sites at the respective electrodes.
The Nyquist profiles for the asymmetric device before and after cycling are shown in Fig. 5f. The lower frequency region with a steep slope proved the exceptional charge storage and collection behavior of the device. In the high frequency regime, a perfect semicircle was observed with RS and RCT values of ∼1.32 Ω and 1.88 Ω, respectively, before cycling. Due to the low charge transfer resistance, the electrode–electrolyte interface becomes fully accessible for the incoming ions and cover the maximum electrode surface area under the applied external potential. This was also reflected in the enhanced values of energy and power density of the device. After 8000 cycles, the nature of the EIS profile remained nearly similar; however, it experienced a little shift in the ‘x’ direction, which indicated a little increase in the interfacial resistance. This actually happened after repetitive cycling as excessive redox reaction and morphology distortion at various sites led to a decrease in the performance of the devices. Even after prolonged cycling, the performance of the device was maintained, which proved the concept of utilizing hierarchical hollow nanoballs as future electrodes for supercapacitors.
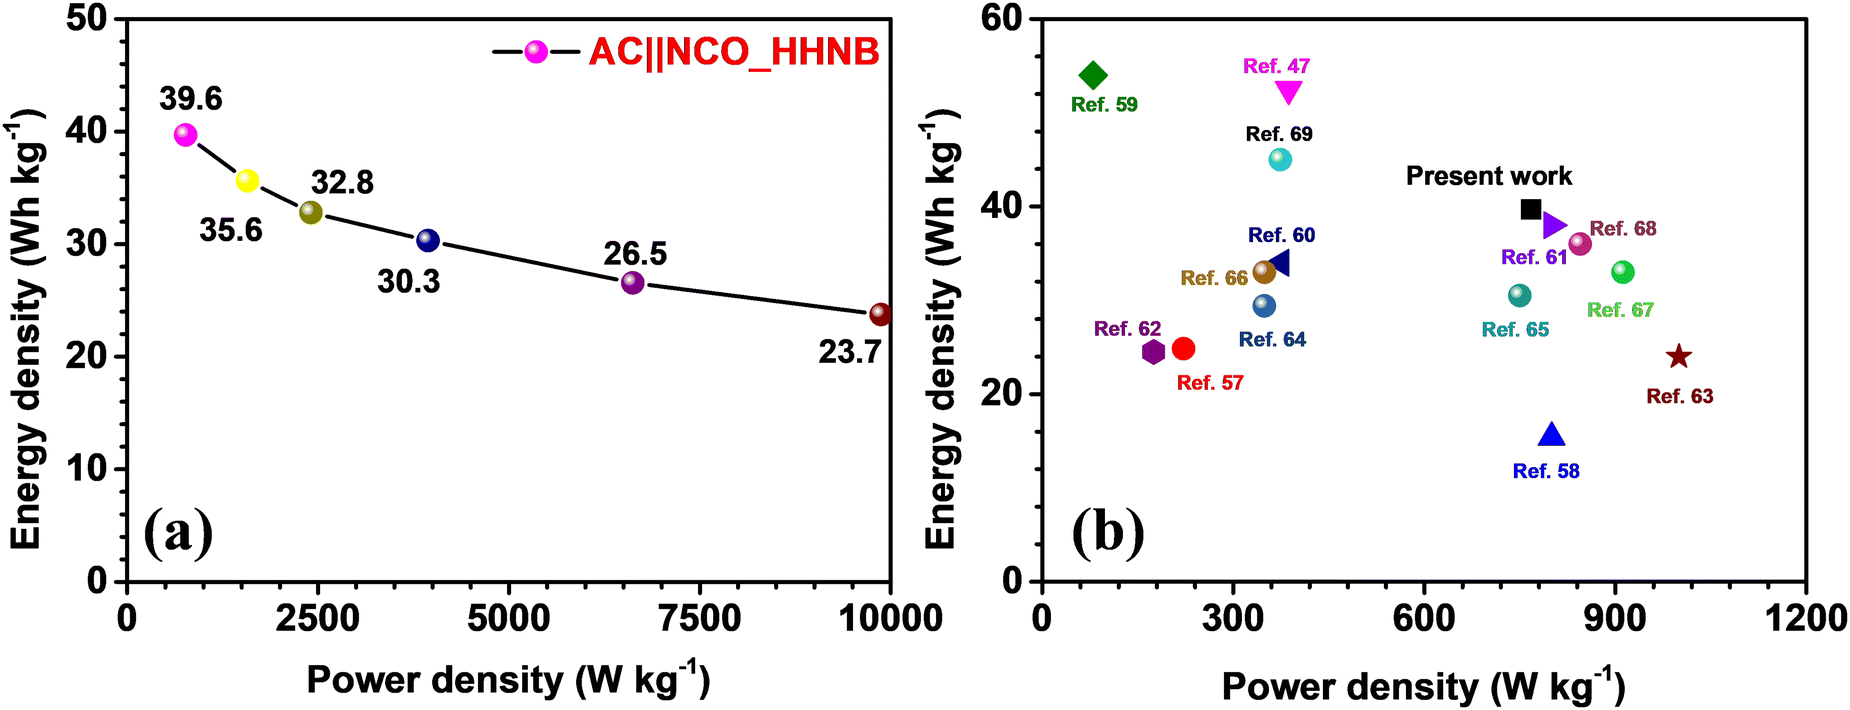
The Ragone plot for the fabricated supercapacitor is shown in Fig. 6a. The energy and power densities were calculated using eqn (S6) and (S7) (ESI†), respectively. The device showed a maximum energy density of ∼40 W h kg−1 and power density of ∼768 W kg−1 at 1 A g−1. The power density reached its maximum value at 10 A g−1, i.e., 9873 W kg−1, maintaining the energy density at ∼24 W h kg−1. Table S4 (ESI†) lists the calculated energy and power density values for the device, at different current densities. A comparison of the present work with some recently reported results for NiCo2O4 and its composites (with fascinating morphologies) is shown in Fig. 6b and the values are listed in Table 1. The comparative study envisaged the usefulness of these NCO based hollow nanoballs in supercapacitors.
 | ||
| Fig. 6 (a) The Ragone plot showing power and energy density at different current densities and (b) comparison of the present work with some of the recent results published on NiCo2O4 (including composites) as the host material. | ||
| S. no. | Host materials for supercapacitor | Maximum “E” (W h kg−1) | “P” at maximum “E” (W kg−1) | Ref. |
|---|---|---|---|---|
| 1. | Hierarchical core–shell Co9S8@NiCo2O4 | ∼25 | ∼222 | 57 |
| 2. | Two-dimensional Co3O4 thin sheets | ∼15 | ∼800 | 58 |
| 3. | Hierarchical NiO@NiCo2O4 Core–shell Nanosheet Arrays | ∼53 | ∼388 | 47 |
| 4. | Hierarchical NiO ultrathin nanosheets anchored to NiCo2O4 | ∼34 | ∼375 | 59 |
| 5. | Graphene quantum dots encapsulated tremella-like NiCo2O4 | ∼38 | ∼800 | 60 |
| 6. | Hexagonal NiCo2O4 nanostructures | ∼25 | ∼175 | 61 |
| 7. | NiCo2O4/Superactivated Carbon | ∼24 | ∼1000 | 62 |
| 8. | Phosphorus-Doped NiCo2O4 Nanowire | ∼53 | ∼780 | 63 |
| 9. | N-Doped Carbon-Coated NiCo2O4 Nanowire Arrays | ∼29 | 349 | 64 |
| 10. | NiCo2O4 nanoneedles | ∼31 | ∼750 | 65 |
| 11. | Hierarchical NiCo2O4@Ni-MOF Hybrid Arrays | ∼33 | ∼349 | 66 |
| 12. | Yolk shell MOF derived core–shells NiCo2O4/NiO | ∼33 | ∼912 | 67 |
| 13. | NiCo2O4/CoMoO4 Nanocomposite | ∼36 | ∼845 | 68 |
| 14. | Micro CuCo2O4/Nano NiMoO4 | ∼45 | ∼374 | 69 |
| 15. | NCO_HHNB based asymmetric supercapacitor | ∼40 | ∼768 | Present work |
Usability in methanol (MeOH) oxidation systems
To check the effectiveness of these NCO_HHNBs for sustainable catalytic systems, the electrochemical oxidation of methanol was studied. For this, CV, EIS and chronoamperometry measurements were performed and their in-depth analysis was done. Fig. 7a shows the cyclic voltammograms observed with x M MeOH (where x = 0, 0.1, 0.2, 0.4, 0.5 and 1) in 1 M KOH, at 50 mV s−1. The stable voltage window in 1 M KOH was found to be in the range 0–0.5 V. The CV curve in 1 M KOH also showed a depressed anodic peak in comparison to the one observed in 2 M KOH and also the range of operation was limited to 0–0.5 V. This also justified the use of 2 M KOH in supercapacitor measurements. However, as various reports in the literature used 1 M KOH as the electrolyte to study the methanol oxidation applicability of materials, it has been utilized for comparative analysis.70–72Fig. 7a shows that with the addition of MeOH in the host electrolyte the anodic current was increased and kept increasing until 0.5 M MeOH concentration, after which a dip was observed. Thus, 0.5 M MeOH is the holding capacity of the present system comprising NCO_HHNBs in 1 M KOH. There have been various morphologies proposed for various materials, including NiCo2O4, where the average concentration is generally limited to 0.5 M MeOH in 1 M KOH; however, the current density of detection remains lower.72,73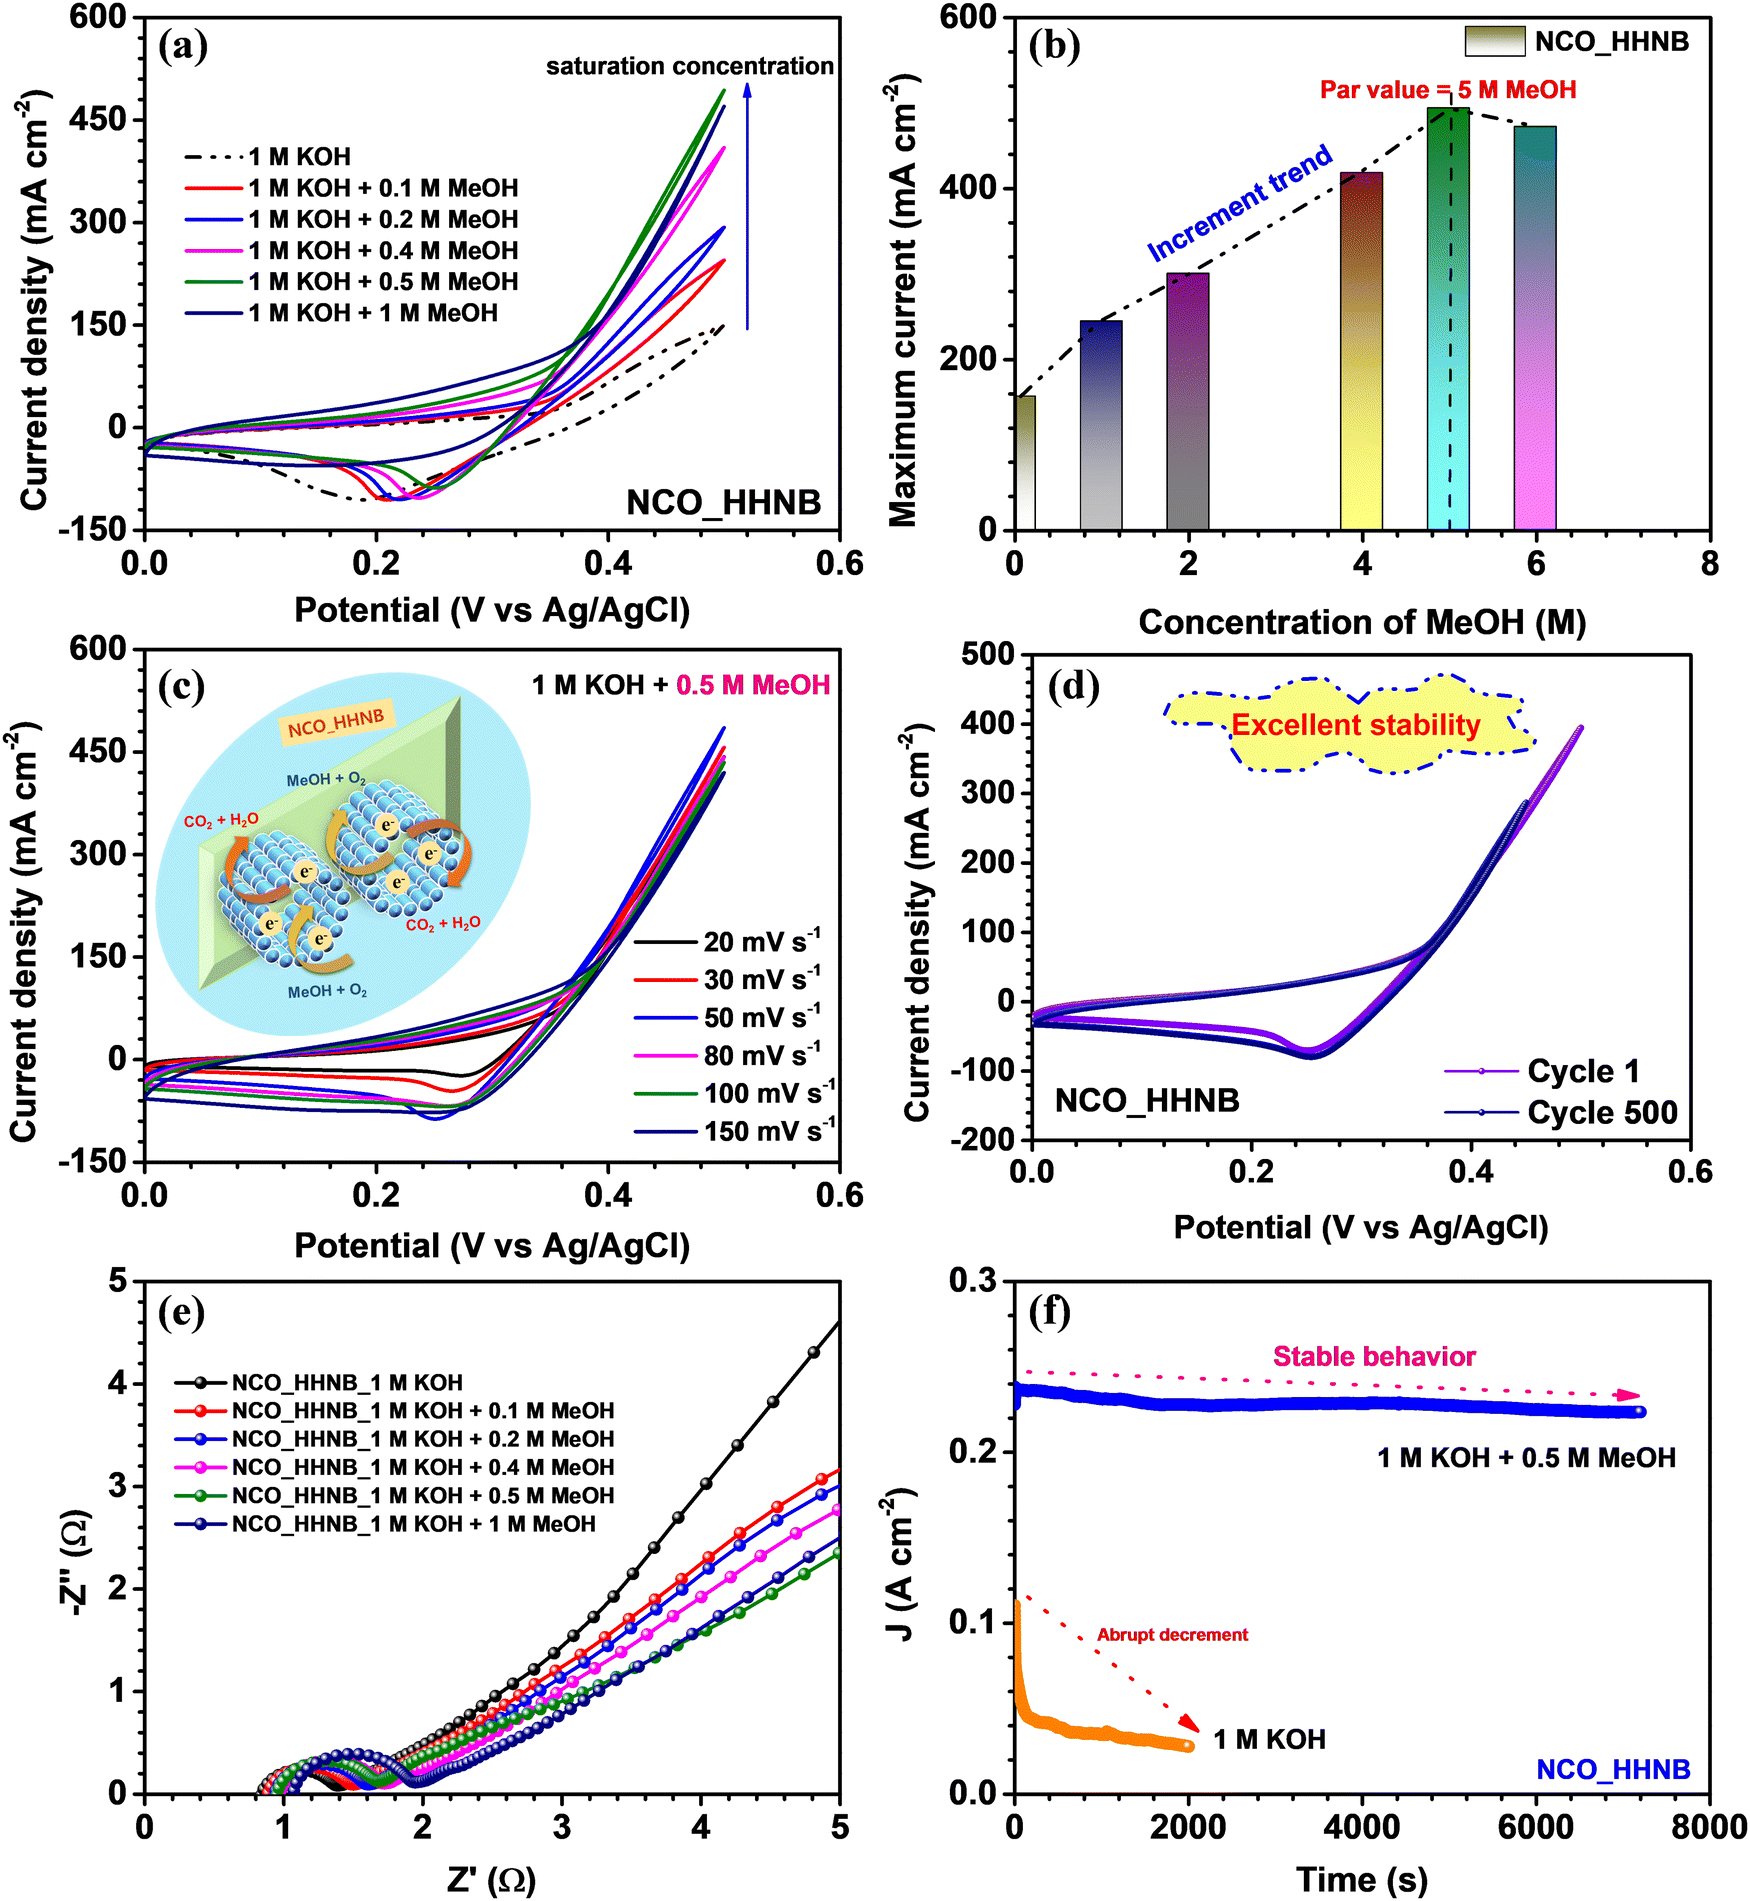 | ||
| Fig. 7 (a) CV profiles at various scan rates, (b) change in the anodic current, (c) EIS profiles at different concentrations of MeOH in KOH, (d) CV profiles at different scan rates in 0.5 M MeOH + 1 M KOH electrolytic system, (e) comparative cyclic voltammograms at 50 mV s−1 of cycles 1 and 500 and (f) chronoamperometric tests to check the stability of the NCO_HHNB electrode in 0.5 M MeOH + 1 M KOH and bare KOH electrolytes. | ||
Fig. 7b shows the increment in current density with the concentration of MeOH in 1 M KOH. The highest current was observed in the case of 0.5 M MeOH and after that a small dip was found at 1 M MeOH. If one carefully looks at the cathodic peaks, it has also become evident that the peak was nearly stable until 0.5 M MeOH and after that the cathodic peak also started to diminish. This proved that the material redox process has been significantly affected and was not able to sustain beyond 0.5 M MeOH. As this is a heterogeneous catalysis process, the mechanism involves the adsorption of the reactant on the catalyst surface. The reaction led to production of intermediate species and then the reaction products. It could be inferred from the anodic peak where a forward sweep was observed in response to the oxidation of MeOH. On the other hand, the reverse sweep peak corresponded to the oxidation of adsorbed intermediate species generated during the forward sweep. The reaction mechanism involved in the present case can be represented as follows:74
| NiCo2O4 + OH− + H2O − 3e− ↔ NiOOH + 2CoOOH | (5) |
| NiOOH + MeOH + xO2 ↔ Ni(OH)2 + CO2 + yH2O | (6) |
| 2CoOOH + mCH3OH + nO2 ↔ 2Co(OH)2 + 2CO2 + zH2O | (7) |
It is very important in the functioning of the fuel cell where the concentration of alcohol determines its performance. In general, DMFCs efficiently workable at higher concentrations of concentrated alcohol solution are preferable because it can decrease the size of the fuel cell and also increases its power density.61 In the literature, it has been shown that conducting agents are required to be inserted to sustain higher concentrations of methanol for DMFCs. This makes the material formation complex and costly and limits accessibility. The present work showed that NCO_HHNBs can directly be utilized to achieve such higher performance without any incorporation of external agents. This proposes a new dimension to develop materials which can work barely for such reactions.
The CV profiles were found to be stable for a range of scan rates in 0.5 M MeOH, as shown in Fig. 7c. This further verified the applicability of the NCO_HHNB based electrodes for methanol oxidation systems. A schematic of the mechanism taking place at the respective electrode is shown in the inset of Fig. 7c. The stability of CV profiles at 50 mV s−1 was tested for 500 continuous cycles. The results are shown in Fig. 7d, where the compared profiles exhibit consistent performance with a ∼75% decrease in the current density after 500 consecutive cycles. The observed results further evidenced the good repeatability of NCO_HHNB based electrodes for the process. The slight decrease in the current with cycling could be attributed to the poisoning of the electrodes with the repeated reaction processes taking place at the electrodes. It is obvious that with the repetitive cycling the active surface sites become reduced in comparison with the first cycle. However, in the present case, due to the high number of active sites, porous surface and accessibility of the incoming ions to both (internal and external) surfaces, the process of conversion remained stable for ∼500 cycles.
The electronic conductivity of the electrocatalyst was investigated by analyzing the EIS profiles collected at various concentrations of MeOH in KOH, as shown in Fig. 7e. The obtained results clearly indicated that NCO_HHNBs possess good conductivity, which could effectively regulate the electron transfer process essentially to oxidize methanol. All the EIS profiles showed full semicircles in the high frequency region, which proved that in all the electrolytes the material was stable. It became noteworthy to see the increment in the Rs and RCT with the increase in the MeOH concentration in the host electrolyte. This could be attributed to the increase in the concentration of the reactants and the generated intermediate species, which at higher concentrations provided intra-system resistance to each other in order to occupy the active adsorption sites. However, this increment was actually very less at even 1 M MeOH concentration when compared with the bare electrolyte. This further proved the better accommodation capability of hollow structure based electrodes and effective volumetric charge accumulation. RS was increased from ∼0.8 to 1 Ω, while RCT shifted from ∼1.4 to 2 Ω, which was actually very less. The low frequency region also tilted with the increase in methanol concentration towards 45°, which is obvious with the increment in the redox activity in the system.75
In the end, the electrochemical stability of the electrocatalyst was demonstrated by chronoamperometric tests performed at 0.5 V. As visible from Fig. 7f, the NCO-HHNB electrode retained nearly stable current for 7000 s in the presence of 0.5 M MeOH + 1 M KOH system, while a fast decrement in the current was observed in the bare KOH electrolyte in ∼2000 s. The catalyst was found to be consistently active with effective wettability and repetitive reactions also kept the oxidation ability maintained ≥7000 s. This was actually reflected in the CV results for 500 cycles, as discussed previously. The present result is compared in Table S5 (ESI†) with some of the recent results based on NiCo2O4 or similar materials. The detailed discussion on the electro-oxidation performance proved that these hollow cavity based nanoballs can become effective agents for high performance DMFCs and can become sustainable systems for methanol oxidation reactions.
Conclusions
The present work established a strategy for synthesizing perfect hollow nanoballs of bi-metallic oxide, taking NiCo2O4 as a model material. The theme of the work was designed to generalize the parameters which can pave the way for scaling up of the existing synthesis approaches. The paper provides an insight into the growth mechanism where the effect of glycerol and isopropanol on the morphological evolution is studied. The ratio of 1:5 for glycerol to isopropanol is found to be appropriate for the evolution of hollow nanoballs. The Ni Co -glycerate nanoballs were converted to hollow nanoballs by the removal of the sacrificial template at elevated temperatures. The presence of a hollow cavity provides enhanced surface area for the ion accommodation as both inner and outer surfaces are available for ion adsorption and desorption. The fabricated electrodes of NCO_HHNBs exhibited an ultrahigh specific capacitance of ∼721 F g−1 at 4 A g−1 with an excellent rate capability of ∼69% at 15 A g−1. The asymmetric device, i.e., AC||NCO_HHNB showed typical perfect supercapacitor like characteristics with high energy and power densities of ∼40 W h kg−1 and ∼767 W kg−1 at 1 A g−1. The current results surpassed various recent results reported in the literature with the host material NiCo2O4. Similarly, in the methanol oxidation, the strategy of employing NCO_HHNBs was found to be effective with long lasting stable performance for electro-oxidation of 0.5 M methanol. The presence of a high number of active surface sites, low interfacial resistance and maximum bulk utilization of the fabricated electrodes justified the observed high-grade results. The present study provides an extensive outlook to the ongoing research in the way how excellent electrochemical properties can be achieved by merely playing with the reaction parameters and achieving high surface area morphologies. Such approach directed morphologies can be multifunctional for various energy storage and conversion applications as discussed in the current work for supercapacitors and methanol oxidation reactions.
Conflicts of interest
The authors declare no competing financial interests.References
- H. Chen, M. Ling, L. Hencz, H. Y. Ling, G. Li, Z. Lin, G. Liu and S. Zhang, Chem. Rev., 2018, 118, 8936–8982 CrossRef CAS.
- T. M. Gür, Energy Environ. Sci., 2018, 11, 2696–2767 RSC.
- N. Kannan and D. Vakeesan, Renew. Sustainable Energy Rev., 2016, 62, 1092–1105 CrossRef.
- C. Costentin, T. R. Porter and J. M. Saveant, ACS Appl. Mater. Interfaces, 2017, 9, 8649–8658 CrossRef CAS PubMed.
- T. Kim, W. Song, D.-Y. Son, L. K. Ono and Y. Qi, J. Mater. Chem. A, 2019, 7, 2942–2964 RSC.
- M. Walter, M. V. Kovalenko and K. V. Kravchyk, New J. Chem., 2020, 44, 1677–1683 RSC.
- A. Muzaffar, M. B. Ahamed, K. Deshmukh and J. Thirumalai, Renew. Sustainable Energy Rev., 2019, 101, 123–145 CrossRef CAS.
- V. Sharma, S. Biswas and A. Chandra, Adv. Energy Mater., 2018, 8, 1800573 CrossRef.
- Q. Wang, Z. H. Wen and J. H. Li, Adv. Funct. Mater., 2006, 16, 2141–2146 CrossRef CAS.
- P. Bandyopadhyay, G. Saeed, N. H. Kim and J. H. Lee, Chem. Eng. J., 2020, 384, 123357 CrossRef CAS.
- V. Sharma, S. Biswas, B. Sundaram, P. Haldar, B. Dubey and A. Chandra, ACS Sustainable Chem. Eng., 2019, 7, 5385–5392 CrossRef CAS.
- N. Tang, W. Wang, H. You, Z. Zhai, J. Hilario, L. Zeng and L. Zhang, Catal. Today, 2019, 330, 240–245 CrossRef CAS.
- J. Li, Y. Wang, W. Xu, Y. Wang, B. Zhang, S. Luo, X. Zhou, C. Zhang, X. Gu and C. Hu, Nano Energy, 2019, 57, 379–387 CrossRef CAS.
- V. Sharma, I. Singh and A. Chandra, Sci. Rep., 2018, 8, 1307 CrossRef.
- J. Jin, L. Wu, S. Huang, M. Yan, H. Wang, L. Chen, T. Hasan, Y. Li and B.-L. Su, Small Methods, 2018, 2, 1800171 CrossRef.
- Y. Tang, H. Shen, J. Cheng, Z. Liang, C. Qu, H. Tabassum and R. Zou, Adv. Funct. Mater., 2020, 30, 1908223 CrossRef CAS.
- A. Chowdhury, R. Shukla, V. Sharma, S. Neogy, A. Chandra, V. Grover and A. K. Tyagi, J. Alloys Compd., 2020, 829 Search PubMed.
- Q. Ren, S. Mo, R. Peng, Z. Feng, M. Zhang, L. Chen, M. Fu, J. Wu and D. Ye, J. Mater. Chem. A, 2018, 6, 498–509 RSC.
- J. H. Pan, Q. Huang, Z. Y. Koh, D. Neo, X. Z. Wang and Q. Wang, ACS Appl. Mater. Interfaces, 2013, 5, 6292–6299 CrossRef CAS.
- L. Zhou, H. Xu, H. Zhang, J. Yang, S. B. Hartono, K. Qian, J. Zou and C. Yu, Chem. Commun., 2013, 49, 8695–8697 RSC.
- D. C. Nguyen, D. T. Tran, T. L. L. Doan, D. H. Kim, N. H. Kim and J. H. Lee, Adv. Energy Mater., 2020, 10, 1903289 CrossRef CAS.
- H. Liang, A. N. Gandi, C. Xia, M. N. Hedhili, D. H. Anjum, U. Schwingenschlögl and H. N. Alshareef, ACS Energy Lett., 2017, 2, 1035–1042 CrossRef CAS.
- X. Zhang, C. Zhang, A. Abas, Y. Zhang, X. Mu, J. Zhou, Q. Su, W. Lan and E. Xie, Electrochim. Acta, 2019, 296, 535–544 CrossRef CAS.
- P. Haldar, S. Biswas, V. Sharma, A. Chowdhury and A. Chandra, Appl. Surf. Sci., 2019, 491, 171–179 CrossRef CAS.
- C. Cursiefen and A. Bergua, Br. J. Ophthalmol., 2002, 86, 1064–1065 CrossRef CAS PubMed.
- J. Chen and L. Li, Int. J. Hydrogen Energy, 2020, 45, 2527–2545 CrossRef CAS.
- X. Li and A. Faghri, J. Power Sources, 2013, 226, 223–240 CrossRef CAS.
- K. Xiang, D. Wu, X. Deng, M. Li, S. Chen, P. Hao, X. Guo, J. L. Luo and X. Z. Fu, Adv. Funct. Mater., 2020, 30, 1909610 CrossRef CAS.
- V. Sharma, I. Singh and A. Chandra, Mater. Lett., 2018, 211, 285–288 CrossRef CAS.
- J. Sanetuntikul, K. Ketpang and S. Shanmugam, ACS Catal., 2015, 5, 7321–7327 CrossRef CAS.
- L. Qian, S. Luo, L. Wu, X. Hu, W. Chen and X. Wang, Appl. Surf. Sci., 2020, 503 Search PubMed.
- B. Kaur, R. Srivastava and B. Satpati, ACS Catal., 2016, 6, 2654–2663 CrossRef CAS.
- Y. Shao, M. F. El-Kady, J. Sun, Y. Li, Q. Zhang, M. Zhu, H. Wang, B. Dunn and R. B. Kaner, Chem. Rev., 2018, 118, 9233–9280 CrossRef CAS PubMed.
- I. Singh, K. Landfester, A. Chandra and R. Munoz-Espi, Nanoscale, 2015, 7, 19250–19258 RSC.
- B. De, J. Balamurugan, N. H. Kim and J. H. Lee, ACS Appl. Mater. Interfaces, 2017, 9, 2459–2468 CrossRef CAS.
- V. Sharma, K. Manna, S. K. Srivastava and A. Chandra, J. Phys. D: Appl. Phys., 2019, 52, 015301 CrossRef.
- F. Liu, X. Cheng, R. Xu, Y. Wu, Y. Jiang and Y. Yu, Adv. Funct. Mater., 2018, 28, 1800394 CrossRef.
- S. Kamari Kaverlavani, S. E. Moosavifard and A. Bakouei, Chem. Commun., 2017, 53, 1052–1055 RSC.
- H. Chen, K. Shen, Y. Tan and Y. Li, ACS Nano, 2019, 13, 7800–7810 CrossRef CAS PubMed.
- Y. Q. Wu, H. X. Yang, Y. Yang, H. Pu, W. J. Meng, R. Z. Gao and D. L. Zhao, Small, 2019, 15, e1903873 CrossRef PubMed.
- Y. Deng, D. Li, X. Ning, D. Zhang, S. Zhang, Z. Zhang, D. Shan, Z. Wang, D. Liu, X. Mao and X. Lu, Small, 2019, 15, e1900627 CrossRef PubMed.
- S. H. Chung, C. H. Chang and A. Manthiram, ACS Nano, 2016, 10, 10462–10470 CrossRef CAS PubMed.
- G. Zhou, Y. Zhao and A. Manthiram, Adv. Energy Mater., 2015, 5, 1402263 CrossRef.
- C. An, Y. Zhang, H. Guo and Y. Wang, Nanoscale Adv., 2019, 1, 4644–4658 RSC.
- S. Yan, K. P. Abhilash, L. Tang, M. Yang, Y. Ma, Q. Xia, Q. Guo and H. Xia, Small, 2019, 15, e1804371 CrossRef.
- M. S. Park, J. Kim, K. J. Kim, J. W. Lee, J. H. Kim and Y. Yamauchi, Phys. Chem. Chem. Phys., 2015, 17, 30963–30977 RSC.
- D. Yao, Y. Ouyang, X. Jiao, H. Ye, W. Lei, X. Xia, L. Lu and Q. Hao, Ind. Eng. Chem., 2018, 57, 6246–6256 CrossRef CAS.
- G. A. Jeffery, J. Chem. Edu., 1957, 34, A178 CrossRef.
- E. Umeshbabu, G. Rajeshkhanna, P. Justin and G. R. Rao, RSC Adv., 2015, 5, 66657–66666 RSC.
- Y. Li, X. Wu, S. Wang, W. Wang, Y. Xiang, C. Dai, Z. Liu, Z. He and X. Wu, RSC Adv., 2017, 7, 36909–36916 RSC.
- J. Cheng, Y. Lu, K. Qiu, H. Yan, J. Xu, L. Han, X. Liu, J. Luo, J. K. Kim and Y. Luo, Sci. Rep., 2015, 5, 12099 CrossRef PubMed.
- X. Zhang, Y. Zhou, B. Luo, H. Zhu, W. Chu and K. Huang, Nanomicro Lett., 2018, 10, 13 Search PubMed.
- C. Zequine, C. K. Ranaweera, Z. Wang, S. Singh, P. Tripathi, O. N. Srivastava, B. K. Gupta, K. Ramasamy, P. K. Kahol, P. R. Dvornic and R. K. Gupta, Sci. Rep., 2016, 6, 31704 CrossRef CAS PubMed.
- Y. Li, X. Han, T. Yi, Y. He and X. Li, J. Energy Chem., 2019, 31, 54–78 CrossRef.
- A. Vlad, N. Singh, J. Rolland, S. Melinte, P. M. Ajayan and J. F. Gohy, Sci. Rep., 2014, 4, 4315 CrossRef CAS PubMed.
- T. T. Nguyen, J. Balamurugan, V. Aravindan, N. H. Kim and J. H. Lee, Chem. Mater., 2019, 31, 4490–4504 CrossRef CAS.
- F. Zhu, W. Liu, Y. Liu and W. Shi, Inorg. Chem. Front., 2019, 6, 982–987 RSC.
- Y. Jiang, L. Chen, H. Zhang, Q. Zhang, W. Chen, J. Zhu and D. Song, Chem. Eng. J., 2016, 292, 1–12 CrossRef CAS.
- C. Guo, J. Li, Y. Chu, H. Li, H. Zhang, L. Hou, Y. Wei, J. Liu and S. Xiong, Dalton Trans., 2019, 48, 7403–7412 RSC.
- Y. Ouyang, R. Huang, X. Xia, H. Ye, X. Jiao, L. Wang, W. Lei and Q. Hao, Chem. Eng. J., 2019, 355, 416–427 CrossRef CAS.
- J. Luo, J. Wang, S. Liu, W. Wu, T. Jia, Z. Yang, S. Mu and Y. Huang, Carbon, 2019, 146, 1–8 CrossRef CAS.
- J. Bhagwan, G. Nagaraju, B. Ramulu, S. C. Sekhar and J. S. Yu, Electrochim. Acta, 2019, 299, 509–517 CrossRef CAS.
- T. Panja, N. Díez, R. Mysyk, D. Bhattacharjya, E. Goikolea and D. Carriazo, ChemElectroChem, 2019, 6, 2536–2545 CrossRef CAS.
- W. Chu, Z. Shi, Y. Hou, D. Ma, X. Bai, Y. Gao and N. Yang, ACS Appl. Mater. Interfaces, 2020, 12, 2763–2772 CrossRef CAS PubMed.
- Z. Xu, J. Ren, Q. Meng, X. Zhang, C. Du and J. Chen, ACS Sustainable Chem. Eng., 2019, 7, 12447–12456 CAS.
- Z. Cao, C. Liu, Y. Huang, Y. Gao, Y. Wang, Z. Li, Y. Yan and M. Zhang, J. Power Sources, 2020, 449 Search PubMed.
- G. Li, H. Cai, X. Li, J. Zhang, D. Zhang, Y. Yang and J. Xiong, ACS Appl. Mater. Interfaces, 2019, 11, 37675–37684 CrossRef CAS PubMed.
- K. Yang, Y. Yan, W. Chen, D. Zeng, C. Ma, Y. Han, W. Zhang, H. Kang, Y. Wen and Y. Yang, J. Electroanal. Chem., 2019, 851 Search PubMed.
- W. Guo, Y. Wu, Y. Tian, X. Lian, J. Li and S. Wang, ChemElectroChem, 2019, 6, 4645–4652 CrossRef CAS.
- G. Li, B. Song, X. Cui, H. Ouyang, K. Wang, Y. Sun and Y. Wang, ACS Sustainable Chem. Eng., 2020, 8, 1687–1694 CrossRef CAS.
- M. M. El-Deeb, W. M. A. El Rouby, A. Abdelwahab and A. A. Farghali, Electrochim. Acta, 2018, 259, 77–85 CrossRef CAS.
- A. Y. Faid and H. Ismail, ChemistrySelect, 2019, 4, 7896–7903 CrossRef CAS.
- X. Y. Yu, X. Z. Yao, T. Luo, Y. Jia, J. H. Liu and X. J. Huang, ACS Appl. Mater. Interfaces, 2014, 6, 3689–3695 CrossRef CAS PubMed.
- W. Wang, Q. Chu, Y. Zhang, W. Zhu, X. Wang and X. Liu, New J. Chem., 2015, 39, 6491–6497 RSC.
- T. H. Ko, K. Devarayan, M. K. Seo, H. Y. Kim and B. S. Kim, Sci. Rep., 2016, 6, 20313 CrossRef CAS.
Footnote |
| † Electronic supplementary information (ESI) available: Additionally, mathematical formulae, XRD, BET, EDAX, SAED, SEM, charge storage profiles and some calculated values in the table format. See DOI: https://doi.org/10.1039/d3ya00290j |
| This journal is © The Royal Society of Chemistry 2024 |