
 Open Access Article
 This Open Access Article is licensed under a Creative Commons Attribution-Non Commercial 3.0 Unported Licence
On-surface magnetocaloric effect for a van der Waals Gd(III) 2D MOF grown on Si†
Subodh
Kumar
ab,
Guillem Gabarró
Riera
 ab,
Ana
Arauzo
c,
Jakub
Hrubý
d,
Stephen
Hill
de,
Lapo
Bogani
f,
Juan
Rubio-Zuazo
gh,
Jesús
Jover
ai,
Elena
Bartolomé
*j and
E. Carolina
Sañudo
*ab
ab,
Ana
Arauzo
c,
Jakub
Hrubý
d,
Stephen
Hill
de,
Lapo
Bogani
f,
Juan
Rubio-Zuazo
gh,
Jesús
Jover
ai,
Elena
Bartolomé
*j and
E. Carolina
Sañudo
*ab
aInstitut de Nanociències i Nanotecnologia, Universitat de Barcelona (IN2UB), 08028 Barcelona, Spain. E-mail: esanudo-at-ub.edu
bDepartament de Química Inorgànica i Orgànica, Secció de Química Inorgànica, C/Martí i Franqués 1-11, 08028, Barcelona, Spain
cInstituto de Nanociencia y Materiales de Aragón (INMA), CSIC-Universidad de Zaragoza, Departamento de Física de la Materia Condensada, 50009 Zaragoza, Spain
dNational High Magnetic Field Laboratory, Tallahassee, FL 32310, USA
eDepartment of Physics, Florida State University, Tallahassee, FL 32306, USA
fDepartment of Materials, University of Oxford, 16 Parks Road, OX1 3PH, Oxford, UK
gBM25-SpLine Beamline at the ESRF, 71 Avenue des Martyrs, 38043, Grenoble, France
hInstituto de Ciencia de Materiales de Madrid-CSIC, Sor Juana Inés de la Cruz, 3, Cantoblanco, 28049 Madrid, Spain
iInstitut de Química Teórica i Computacional (IQTC), Department of Inorganic and Organic Chemistry, Faculty of Chemistry, University of Barcelona, Spain
jInstitut de Ciència de Materials de Barcelona (ICMAB), CSIC, Campus UAB, 08193 Barcelona, Spain. E-mail: ebartolome-at-icmab.es
First published on 20th February 2024
Abstract
Gd complexes have been studied as magnetic coolants due to their large magneto-caloric effect. In this work we present a Gd 2D metal–organic framework (MOF) of formula [Gd(MeCOO)(PhCOO)2] (1). We characterize the magnetic properties of 1, showing that it displays slow relaxation of the magnetization by ac susceptibility, and single-ion magnetic anisotropy using high-field EPR. By heat capacity and magnetization vs. field at various temperatures we determine the magnetic entropy change of compound 1. We then grow 1 on functionalized silicon, and show that the surface-deposited 2D MOF 1Si can be used as an on-surface magnetic cryogenic coolant.
Introduction
Two dimensional (2D) materials are fantastic platforms that can provide exceptional performance in many applications.1 Fabrication of heterostructures or multifunctional devices is a topic that is already being exploited by many research groups, in particular using graphene.2 Molecule-based systems have been proposed as a basis for next-generation technologies, with applications ranging from spintronics and quantum technologies3–5 to magnetic cooling.6 For this purpose, surface deposition and two-dimensional (2D) organization of the systems are key challenges. There are already several examples where molecular systems are combined with graphene.7–12 Most 2D materials are inorganic solids, like chalcogenides, MXenes or graphene. In the last few years, researchers have started to develop ways to obtain 2D coordination polymers or metal organic frameworks, sometimes also called metal–organic nanosheets (MONs).13,14 2D metal–organic frameworks (MOFs) offer the possibility of organizing a molecular entity in 2D, on a topologically defined network: 2D arrays of magnetic molecules can be fundamental for advances in molecular spintronics applications or devices.15For example, 2D arrays of qubits can be designed to control dipolar interactions and to integrate qubits into devices.16,17 If the magnetic molecules are organized in a 2D coordination polymer, intrinsic magnetic dilution becomes possible, as heterometallic complexes can be easily achieved. In this landscape, 2D MOFs afford the possibility of organizing functional units in crystalline 2D arrays. In our previous work we demonstrated that we could prepare homometallic and heterometallic 2D MOFs using lanthanoid ions. The compound [Ln(MeCOO)(PhCOO)2] is one such van der Waals 2D MOF, where the Ln = Dy analogue displays single-molecule magnet (SMM) properties that are enhanced when the system is diluted with Ln![[thin space (1/6-em)]](https://www.rsc.org/images/entities/char_2009.gif) :Dy 9:1.18 The Tb and TbEu analogues display both SMM and luminescent properties.19,20 The fact that the interactions between 2D layers are purely van der Waals forces of the order of those found in graphene allows an easy delamination of the material in flakes and monolayers.
:Dy 9:1.18 The Tb and TbEu analogues display both SMM and luminescent properties.19,20 The fact that the interactions between 2D layers are purely van der Waals forces of the order of those found in graphene allows an easy delamination of the material in flakes and monolayers.
The Gd(III) ion possess a large S = 7/2 spin, which favors large magnetic entropy changes in the magnetization–demagnetization cycles, since maximum entropy can be obtained from Smax = Rln(2S + 1). The magnetocaloric effect (MCE) exploits the entropy changes that result in the heating or cooling of the material by applying an external magnetic field at constant pressure. Complexes with Gd(III) ions isolated (or very weakly coupled) and with low molecular weight ligands are good candidates for low temperature magnetic cooling.6,21,22 The 2D material of formula [Gd(MeCOO)(PhCOO)2] is expected to fulfill these conditions, given the low molecular weight of the ligands, and the large separation between the Gd ions in the structure. The MCE performance of 4f and 3d molecular compounds of various dimensionalities (0D, 1D, 2D and 3D) has been recently reviewed; in particular, several 2D Gd MOFs have large magnetic entropy changes (−ΔSm) of the order of 30–40 J K−1 kg−1 at 7 T.23 2D materials offer advantages over 3D solids, in that they can be used to functionalize a surface to act as on-surface coolants, or they can be dispersed as 2D flakes on a coating, thus providing new possibilities for integrating the MCE into devices. Low temperature cooling applications with low energy consumption, such as the MCE with molecular materials that can be easily integrated into devices,24,25 can be a key technology for the development of quantum computers, which require ultra-low temperatures to function.
Thus, we decided to obtain the Gd(III) analogue of the complex, [Gd(MeCOO)(PhCOO)2] (1), in order to exploit its MCE properties as a bulk material and as crystals grown on a surface. In this work, we report the synthesis and comprehensive study of the magnetic properties of [Gd(MeCOO)(PhCOO)2] (1), including the MCE. We also exploit the surface growth of microcrystals of the 2D MOF 1Si and we show that the MCE properties are retained.
Materials and methods
All reagents are acquired from commercial sources and used as received. [Gd(MeCOO)(PhCOO)2] (1): 2D MOF is prepared following the reported procedure using a microwave assisted reaction and Gd(MeCOO)3·xH2O instead of Dy(MeCOO)3·xH2O.18,19 0.26 mmol of Gd(MeCOO)3·xH2O and 0.52 mmol of PhCOOH were placed in a microwave reactor tube with 4 mL of a MeOH:MeCN mixture in 1:1 proportion. A pulse of 150 W is applied and the reaction kept for 10 minutes at a maximum temperature of 125 °C. The reaction is cooled to room temperature, the microwave tube is removed from the reactor and the colorless solution is left undisturbed. Colorless plate-like crystals suitable for single-crystal X-ray diffraction (SCXRD) grow in 7–15 days. Yield 30–45%. Yield of crystals can be improved by growing the crystals at 40 °C, in a sealed vial in an oven. Elemental analyses for [Gd(MeCOO)(PhCOO)2] (1): experimental (calculated), C 42.01 (41.83); H 2.53 (2.85); N 0 (0)%. Relevant IR data: IR data (cm−1): 3070 (w), 3039 (w), 1590 (s), 1436 (w), 1394 (s), 1331 (m), 1248 (m), 1164 (s), 1068 (w), 1022 (w), 993 (m), 930 (m), 868 (w), 847 (w), 830 (w), 788 (m), 709 (s), 700 (s), 687 (s), 667 (s), 617 (w), 604 (w).
Silanization of p-doped Si (Si-TSP)
We followed the procedure modified from Godoy-Gallardo et al.26 reported by us.27 Resultant layer thickness was measured with ellipsometry, the TSP layers were consistently between 1 and 1.5 nm. Hydrophobicity of the resultant surface was measured with a homemade contact angle meter (48°).On-surface growth of 1 (1Si)
0.26 mmol of Gd(MeCOO)3·xH2O and 0.52 mmol of PhCOOH were placed in a microwave reactor tube with 4 mL of a MeOH:MeCN mixture in 1:1 ratio. A pulse of 150 W is applied and the reaction kept for 10 minutes at a maximum temperature of 125 °C. The reaction is cooled to room temperature, the microwave tube is removed from the reactor and the colorless solution is decanted and diluted to 10 mL of MeCN:MeOH 1:1. The 10 mL of solution are divided into vials. Si-TSP wafers are submerged in the colorless solution and kept there for times between 15 minutes and 2 days. After the indicated time, the wafers are carefully removed from the solution and rinsed with MeCN:MeOH and acetone, and dried. This process results in 1 chemisorbed on silicon wafers, 1Si. Resultant layer thickness was measured with ellipsometry, the MOF layers were consistently between 2 and 7 nm. Hydrophobicity of the resultant surface was measured with a homemade contact angle meter (67°).
Single crystal X-ray diffraction data for 1 were collected at the XALOC beamline 13 of ALBA-CELLS Synchrotron (Spain) (T = 100 K, λ = 0.7239 Å). The structure was solved by intrinsic phasing methods (SHELXT using the XIA package for the data collected on the beamline) and refined on F2. Hydrogen atoms were included at the calculated positions, riding on their carrier atoms. A cif file can be obtained from https://www.ccdc.cam.ac.uk/structures/ with CCDC number 2250164. Infrared spectra were collected on an FT-IR Thermo Scientific Nicolet™ iS5 Spectrometer equipped with an iD7 ATR accessory. Elemental analyses were carried out at the Centres Científics i Tecnològics de la Universitat de Barcelona (CCiTUB).
Alternating current (AC) and direct current (DC) magnetic data were collected using a Quantum Design MPMS SQUID magnetometer equipped with a 5 T magnet at SAI services at the University of Zaragoza. Experiments were conducted on powdered sample 1 embedded in Daphne oil to prevent grain orientation. AC measurements in the range between f = 0.1–1000 Hz, under an alternating field of Hac = 4 Oe, were carried out in the same equipment. Additional AC measurements in the f = 100–10000 Hz range were carried in a Quantum Design PPMS susceptometer at SAI. Magnetization vs. field data in the 2–10 K range were collected for 1 and 1Si at the Unitat de Mesures Magnétiques at CCiTUB on a Quantum Design SQUID magnetometer equipped with a 7 T field.
Heat capacity measurements as a function of temperature were performed between 0.3–30 K at different applied fields between 0–30 kOe on a pressed powder pellet of 1 fixed with Apiezon N grease, using a Quantum Design PPMS equipped with a 3He refrigerator at SAI services.
X-ray absorption spectroscopy (XAS) and X-ray magnetic circular dichroism (XMCD) experiments of 1 flakes spin-coated onto silicon were performed at BOREAS beamline of the ALBA synchrotron. Measurements across the M4,5 edge of Gd were performed at 3.4 K. All spectra were recorded using Total Electron Yield (TEY) detection mode, with 90% circularly polarized light. The XMCD (μ− − μ+) and XAS (μ+ + μ−/2) spectra at 6 T were determined from eight X-ray absorption spectra measured under right-handed (μ+) and left-handed (μ−) circular polarizations. XMCD(H) cycles were performed by following the resonant M5 peak while sweeping the magnetic field between 6 T and −6 T at a rate of 2 T min−1.
Ellipsometry data were collected with a J. A. Woollam Alpha-SE ellipsometer and analyzed with CompleteEase software. Scanning electron microscopy (SEM) images and energy dispersive X-ray spectroscopy (EDS) spectra were collected on a Jeol J-6510 scanning electron microscope (SEM). Contact angles were measured using home-made equipment at GMMF labs. Cleaning of the samples was performed using an ultrasound cleaning bath VWR USC600TH at room temperature. Raman spectra were collected at the CCiTUB.
Raman spectrum of 1 was computed using the Gaussian09 suite of programs. See ESI† for details on the calculation.
High-frequency electron paramagnetic resonance (HF-EPR) spectra were collected using a home-built transmission spectrometer, as described in detail previously, operating in continuous-wave (CW) mode with field modulation producing a derivative spectrum. The sample was measured as a ground polycrystalline powder immobilized in an EPR sample holder. For the purposes of this investigation, all spectra were collected at a frequency of 104 GHz in applied fields up to 6 T and at temperatures in the range 5–300 K. All spectra were simulated using the EasySpin (version 6.0.0-dev.51) toolbox for Matlab.28
Hard X-ray Photoelectron Spectroscopy (HAXPES) data were collected in ultra-high vacuum (P = 1 × 10⁻¹⁰ mbar UHV) conditions using a photon energy of 11 keV at the BM25-SpLine beamline at the European Synchrotron ESRF.29 The HAXPES data was obtained using a specially developed high kinetic energy analyzer HV-CSA300 able to work up to kinetic energies of 15 keV.30
Results and discussion
Synthesis and surface deposition
The 2D MOF reported in this work is a van der Waals 2D material with neutral nanosheets of formula [Gd(MeCOO)(PhCOO)2] (1). The material is prepared in a microwave reactor, as already reported. From the microwave assisted synthesis a colorless solution is obtained from which crystals suitable for single crystal X-ray diffraction can be grown in 5–15 days. The crystal structure obtained is shown in Fig. 1. It is analogous to that of the other reported compounds of the series.19,20 Compound 1 crystallizes in the monoclinic space group P21/c. van der Waals stacks of 2D layers of formula [Gd(MeCOO)(PhCOO)2] form along the a axis of the unit cell. The Gd(III) ion is octacoordinated in a very distorted square antiprism geometry. In fact SHAPE2 analysis reveals that the geometry is best described as an intermediate between square antiprism and biaugmented trigonal prism. See ESI-1† for full SHAPE analysis on the Gd coordination environment. The 2D layers have a complicated topology of distorted triangles and hexagons, and are not planar (see ESI Fig. S1†). There are three distinct Gd–Gd distances in the layer: Gd–Gd at 3.947 Å (two monoatomic O-bridges from acetato ligands and two syn,syn-PhCOO); Gd–Gd at 4.700 Å (one monoatomic O-bridge from acetato and one syn,syn-PhCOO), and Gd–Gd at 6.961 Å (one anti,anti-acetato ligand).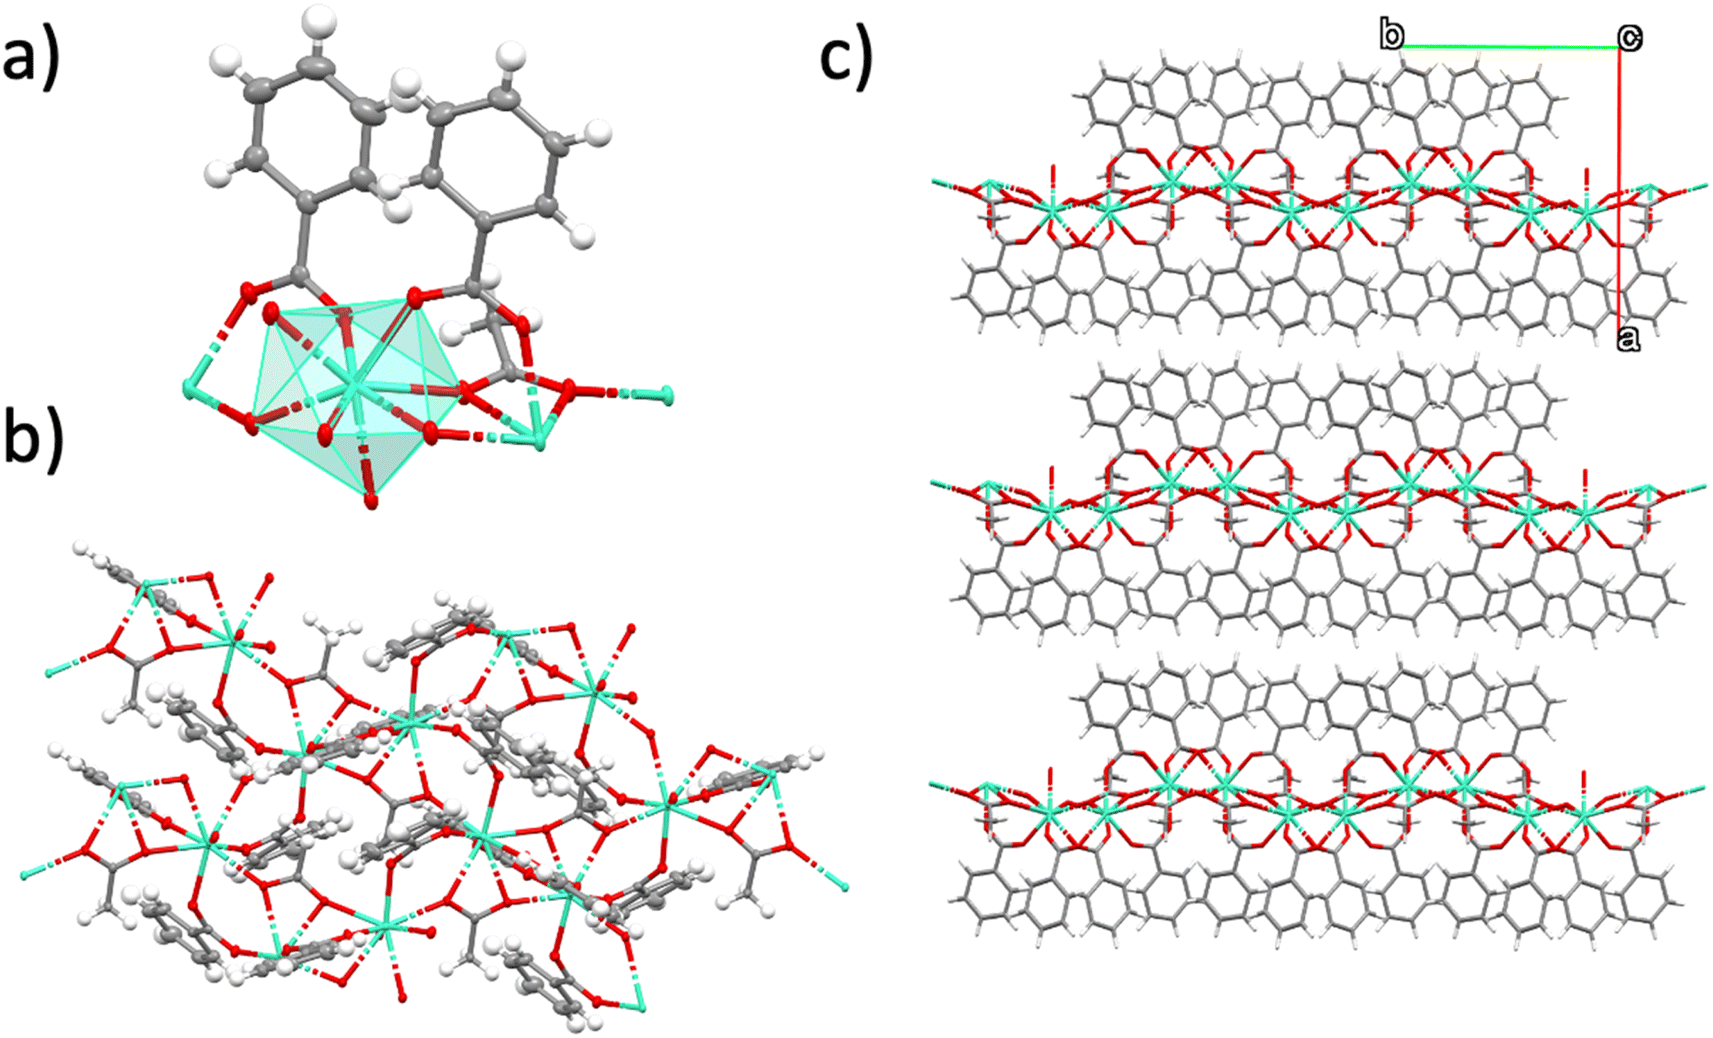 | ||
| Fig. 1 Crystal structure of 1. (a) A fragment of 1 showing thermal ellipsoids (50%) and with a polyhedral representation for Gd1; (b) top view of the 2D layer of 1; (c) crystal packing along the a-axis of the unit cell. The crystal packing shows a stack of three layers of 1 with only van der Waals interactions between them. Gd: green; C: grey; O: red; H: white. | ||
In order to see if the material can be used as an effective on-surface magnetic coolant, we grafted nanocrystals of 1 onto functionalized Si wafers. The colorless solution obtained from the microwave assisted reaction can be used to graft the MOF onto a suitably functionalized substrate. In this work, we follow our use of a silanized silicon wafer with a succinate terminated silane. Hydrolysis of the succinate groups affords a surface of carboxylic acids. A simple ligand exchange reaction with one of the carboxylate ligands of the [Gd(MeCOO)(PhCOO)2] MOF should afford a chemically attached (chemisorbed) layer of [Gd(MeCOO)(PhCOO)2] on Si, 1Si. By varying the time the Si-TSP wafer is submerged into the reaction mixture, one can control the amount of randomly oriented crystallites that grow on the surface of the Si wafer; for long deposition times, e.g., 24 and 48 h, crystallites pile on the Si wafers as shown in the SEM images of Fig. 2. Ellipsometry analysis shows layer thicknesses of 2–6 nm for deposition times below 24 h. The contact angle changes from 48° for Si-TSP to 67° for 1Si, confirming the more hydrophobic nature of the surface after MOF deposition. The image of the highest magnification (1 μm) in Fig. 2 shows a pair of crystals, clearly growing from the functionalized Si wafer. Using EDS analysis coupled to SEM we can ascertain that the thin layers and the crystallites deposited contain Gd(III) and organic ligands. Non-chemically attached crystallites can be removed by ultrasound cleaning of the 1Si wafers. This shows that the first 1–5 nm layer is chemically bonded to the Si-TSP, but some of the larger crystals observed in Fig. 2 (48 h) are either more fragile and easily detached or not chemically attached to the surface and can be removed by sonication and washing. Raman spectra were collected on 1Si. The spectra were compared to the calculated ones. There is a good agreement, as shown in ESI Fig. S2,† confirming the chemical nature of the metal–organic layers grown on 1Si.
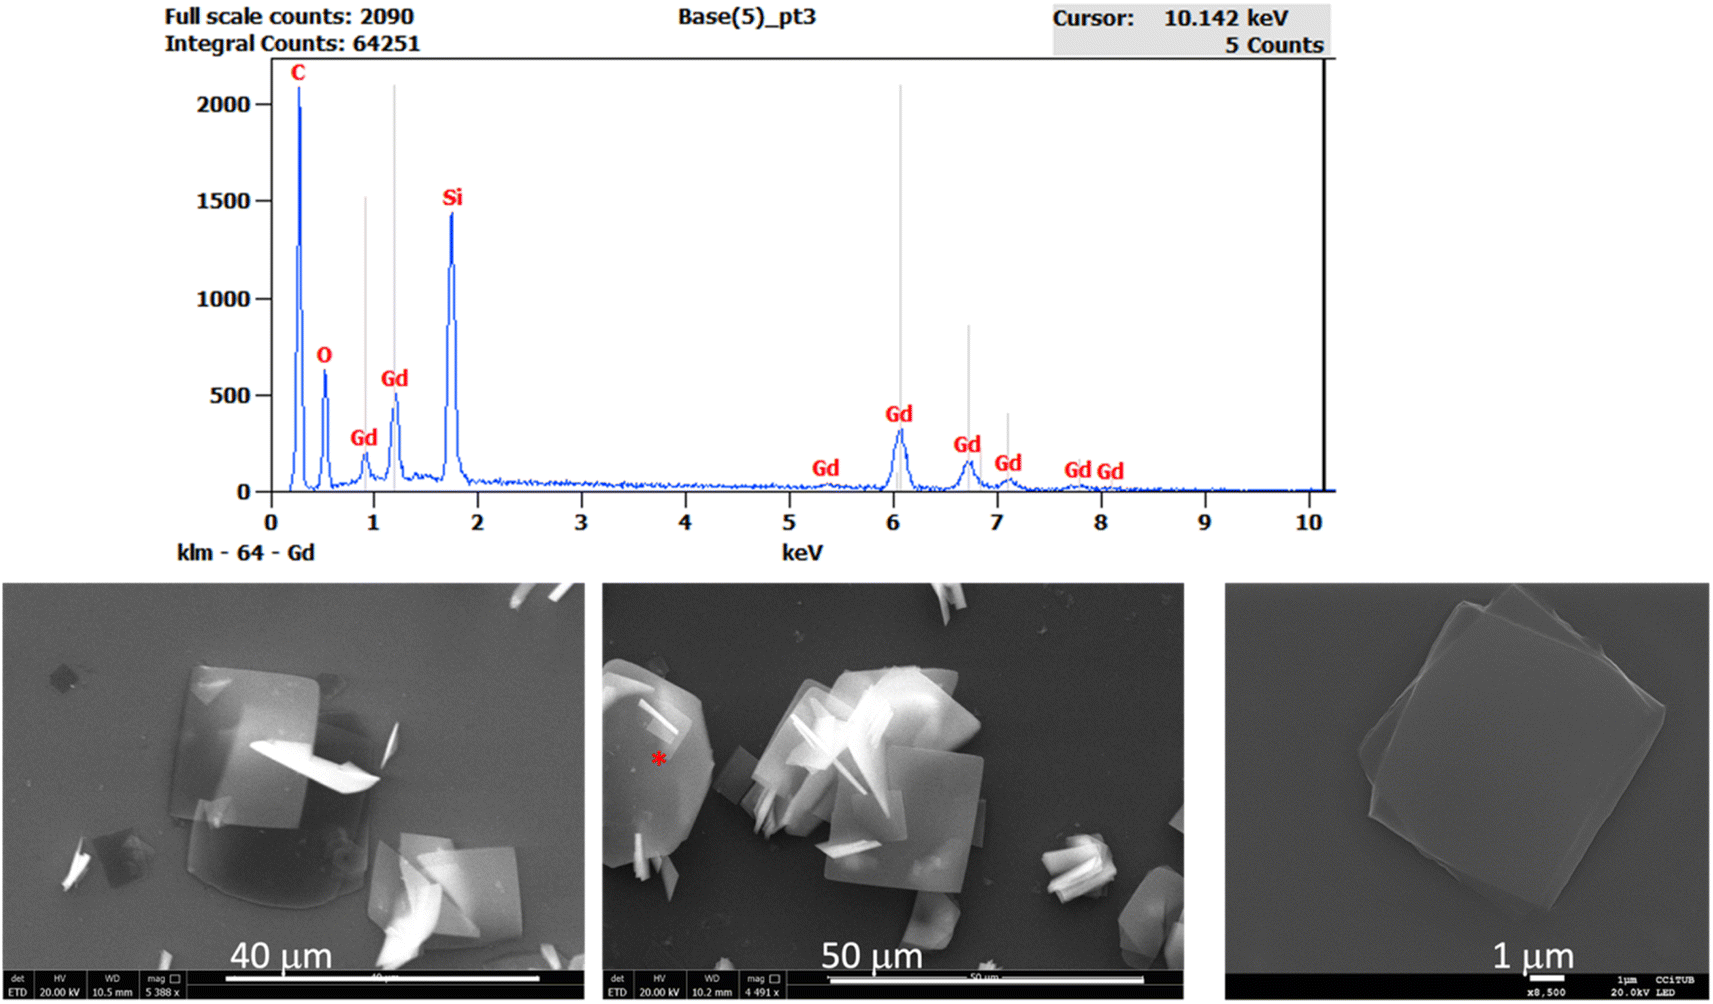 | ||
| Fig. 2 SEM images for 1Si (48 h deposition time) showing the growth of microcrystals form the functionalized Si. The EDS analysis corresponds to the flake with the red asterisk on the central image. | ||
The 1Si sample was also chemically characterized by hard X-ray photoemission spectroscopy (HAXPES) at the BM25 beamline, SpLine at the European Synchrotron Radiation source (ESRF). Fig. 3 shows the photoemission spectra for the Gd 2p1/2 and the O 1s core levels. ESI Fig. S3† contains the Gd 2p3/2 core level HAXPES spectra. The O 1s signal shows a small peak at ∼526 eV that can be attributed to oxygen bound to the Gd(III) ions of the MOF, while the bulk of the O 1s signal arises from the SiO2 layer.
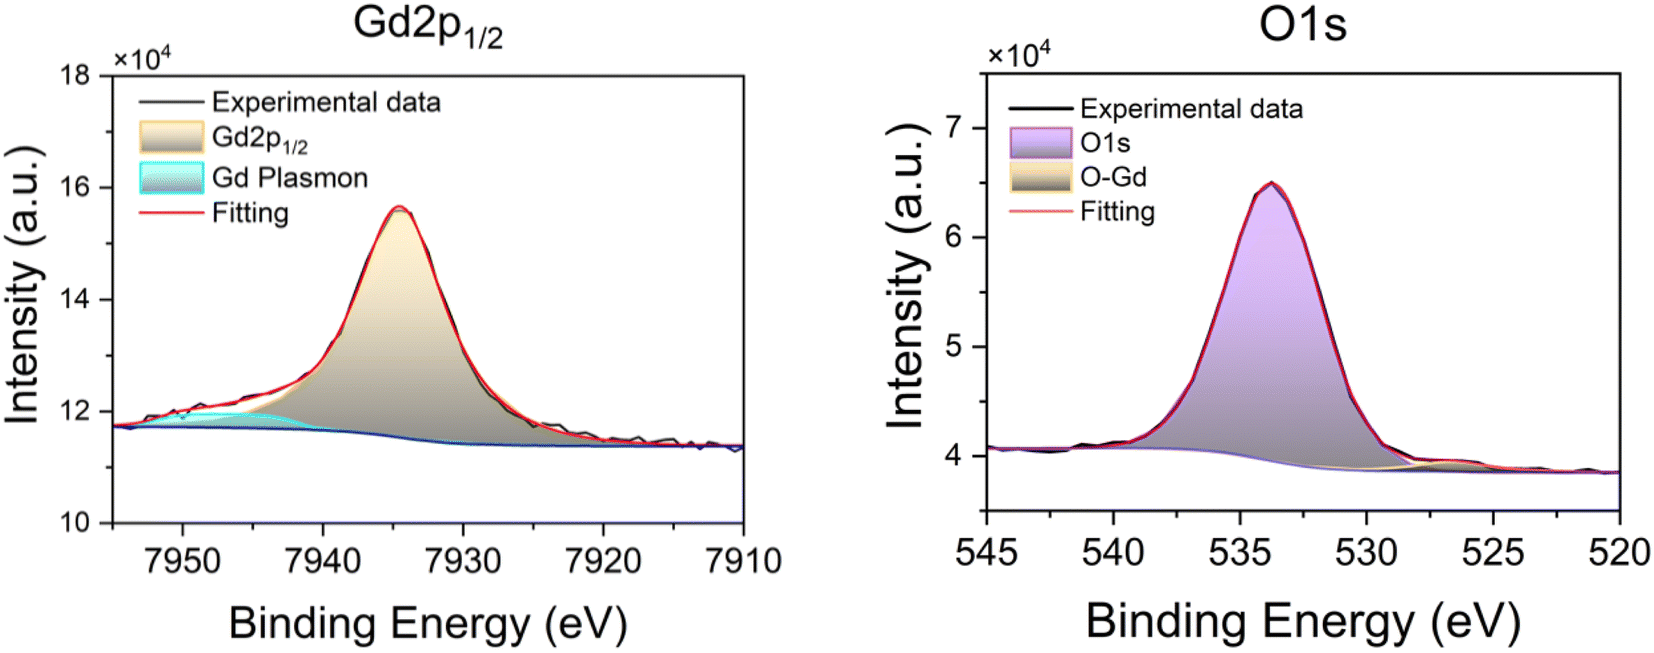 | ||
| Fig. 3 HAXPES spectra for the Gd 2p1/2 and the O 1s core levels of 1Si. | ||
Magnetic properties
The magnetic properties of 1 are shown in Fig. 4a as the susceptibility times the temperature product (χT) vs. T and magnetization as a function of field plots. The χT product at high temperatures reaches a value of 7.73 emu K mol−1, approaching the expected free-ion value of 7.875 emu K mol−1 for one Gd(III) with S = 7/2 and g = 2.0. As the temperature decreases, the χT value remains nearly constant down to 50 K, and then drops to a value of 6.2 emu K mol−1 at 2 K. The fit of the high temperature 1/χ(T) data yields a negative Curie–Weiss constant of θ = −0.62 K (Fig. 4, inset). The decrease of the χT(T) curve is caused by the combined effect of magnetic anisotropy (zero field splitting, ZFS) and a weak antiferromagnetic (AF) exchange; as shown in Fig. 4a, the data can be nicely fit within a dimer model for Gd(III) ions with g = 1.985, uniaxial anisotropy D/kB = −0.167 K, E/kB = −0.0043 K and weak AF coupling constant, J/kB = −0.036 K, as obtained by EPR (vide infra). The magnetization for 1 saturates at a value of 7.0 at 2 K and 5 T (Fig. 4b). The M(H) curve falls below the theoretical Brillouin prediction for Gd(III), pointing again to the existence of AF interactions, and the data are well described within the dimeric model with the same g, anisotropy D, E, and coupling J values as above. The carboxylato ligands that bridge the Gd(III) ions in 1 provide the pathways for magnetic exchange, and this is typically weak for lanthanoid ions.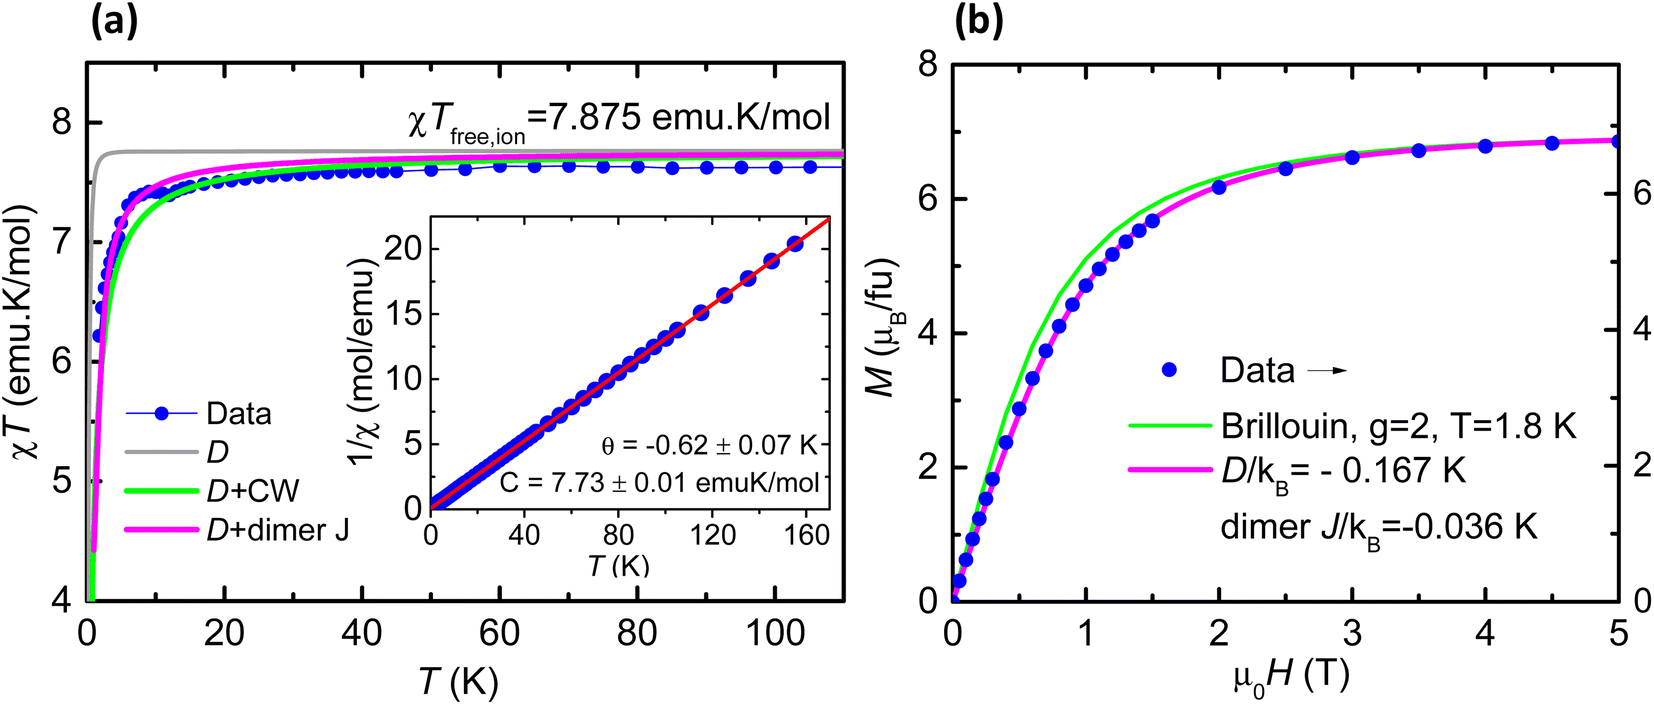 | ||
| Fig. 4 (a) Susceptibility times the temperature product, χT, as a function of the temperature at 0.1 T measured for complex 1 and theoretical curves using a model: (grey line) including only ZFS, D/kB = −0.167 K and E/kB = −0.0043 K; (green line), ZFS and interactions within a Curie–Weiss mean-field approximation (θ = −0.62 K); and (pink line), ZFS and interactions within a dimer model with AF coupling constant J/kB = −0.036 K. Inset: Curie plot; (b) magnetization vs. magnetic field data plot at 1.8 K, (green line) theoretical Brillouin function for S = 7/2 and g = 2, and (pink line) theoretical prediction for ZFS and dimeric J/kB = −0.036 K. | ||
X-band CW EPR spectra were collected for 1 at room temperature, 80 K and 10 K (ESI Fig. S4†). The signals are broad and relatively featureless, as typical for Gd(III), since high fields are needed to resolve the full spectrum. HF-EPR experiments were therefore performed on a bulk powder sample of 1. At the lowest temperature (5 K), multiple fine structures appear on either side of the central portion of the spectrum (Fig. S5†), indicative of measurable magnetic anisotropy. Simulations were then performed both without (Fig. S6†) and with (Fig. S7†) the inclusion of Gd⋯Gd exchange interactions in order to accurately determine the g-tensor components and the 2nd order zero-field splitting (ZFS) interactions. Either approach yielded the same parameters for the individual Gd(III) ions according to the following spin Hamiltonian, assuming a 4f7 electronic configuration with total spin S = 7/2 and orbital angular momentum L = 0: Ĥ = μBB0·![[g with combining tilde]](https://www.rsc.org/images/entities/b_i_char_0067_0303.gif) ·Ŝ + DŜz2 + E(Ŝx2 − Ŝy2) (eqn (1)) where μB is the Bohr magneton, B0 the externally applied magnetic field vector, the Landé-tensor, and the Ŝi (i = x, y, z) denote components of the total spin operator, Ŝ with D and E parameterizing the axial and rhombic 2nd-order ZFS interactions, respectively. The parameters employed in the best simulations are: g = 1.985 ± 0.005, D/kB = −0.167 ± 0.003 K, E/kB = −0.0043 ± 0.0015 K, i.e., E/D = 0.026. In-depth discussion of the simulation procedures is given in the ESI.† Introduction of a weak Gd⋯Gd interaction via a simple dimer model (eqn S(1)†) improves the simulations. Both ferromagnetic (FM) and antiferromagnetic (AF) cases were considered, with coupling constants J/kB = ±0.036 K (−2J(Si·Sj) convention chosen for consistency with the magnetic measurements). The FM simulations give somewhat better agreement with the experimental spectra, however, given the simplicity of the employed dimer model, it is not possible to rule out an AF coupling on the basis of the EPR results, and χT(T) data, which are more sensitive to interactions, point towards the predominance of AF interactions. Likewise, inclusion of three (or even two) g-tensor components leads to an over-parameterization of the simulations. Therefore, an isotropic g-tensor was assumed, a choice that is justified on the grounds that the ZFS interaction is expected to dominate the low-temperature spectral fine structure pattern (see ESI†). HF-EPR has been used to constrain the single-ion spin Hamiltonian parameters and to establish magnetic anisotropy parameters.
·Ŝ + DŜz2 + E(Ŝx2 − Ŝy2) (eqn (1)) where μB is the Bohr magneton, B0 the externally applied magnetic field vector, the Landé-tensor, and the Ŝi (i = x, y, z) denote components of the total spin operator, Ŝ with D and E parameterizing the axial and rhombic 2nd-order ZFS interactions, respectively. The parameters employed in the best simulations are: g = 1.985 ± 0.005, D/kB = −0.167 ± 0.003 K, E/kB = −0.0043 ± 0.0015 K, i.e., E/D = 0.026. In-depth discussion of the simulation procedures is given in the ESI.† Introduction of a weak Gd⋯Gd interaction via a simple dimer model (eqn S(1)†) improves the simulations. Both ferromagnetic (FM) and antiferromagnetic (AF) cases were considered, with coupling constants J/kB = ±0.036 K (−2J(Si·Sj) convention chosen for consistency with the magnetic measurements). The FM simulations give somewhat better agreement with the experimental spectra, however, given the simplicity of the employed dimer model, it is not possible to rule out an AF coupling on the basis of the EPR results, and χT(T) data, which are more sensitive to interactions, point towards the predominance of AF interactions. Likewise, inclusion of three (or even two) g-tensor components leads to an over-parameterization of the simulations. Therefore, an isotropic g-tensor was assumed, a choice that is justified on the grounds that the ZFS interaction is expected to dominate the low-temperature spectral fine structure pattern (see ESI†). HF-EPR has been used to constrain the single-ion spin Hamiltonian parameters and to establish magnetic anisotropy parameters.
Once the anisotropic nature of the Gd(III) ions in 1 was confirmed by HF-EPR, with an uniaxial value D/kB = −0.167 K, the dynamic magnetic properties of 1 were characterized by measuring the AC magnetic susceptibility. Fig. 5a shows the out-of-phase component of the susceptibility, χ′′(f,T), as a function of the frequency at constant applied magnetic field, μ0H = 0.2 T, at different temperatures between 1.8–20 K. In addition, results of χ′′(f,H) measurements performed at constant T = 2 K and different applied magnetic fields in the 0–1 T range are shown Fig. S8.† From these data, three main spin relaxation processes can be discerned, with relaxation times denoted τ1, τ2 and τ3. The dependence of the relaxation time with the inverse of the temperature, τ(1/T) for the different relaxation processes is shown in Fig. 5b. The relaxation behavior of Gd(III) is very different from orthodox mononuclear SMMs or single-ion magnets (SIMs), since the anisotropy energy due to ZFS is very small, in this case ΔZFS/kB ≈ |D|(S2 − 1/4) ≈ 2.0 K with S = 7/2, D/kB = −0.167 K (−0.117 cm−1), and the calculated energy difference between the lower and uppermost levels of two interacting Gd ions (J/kB = −0.036 K) at μ0H = 0.2 T is just 5.8 K.
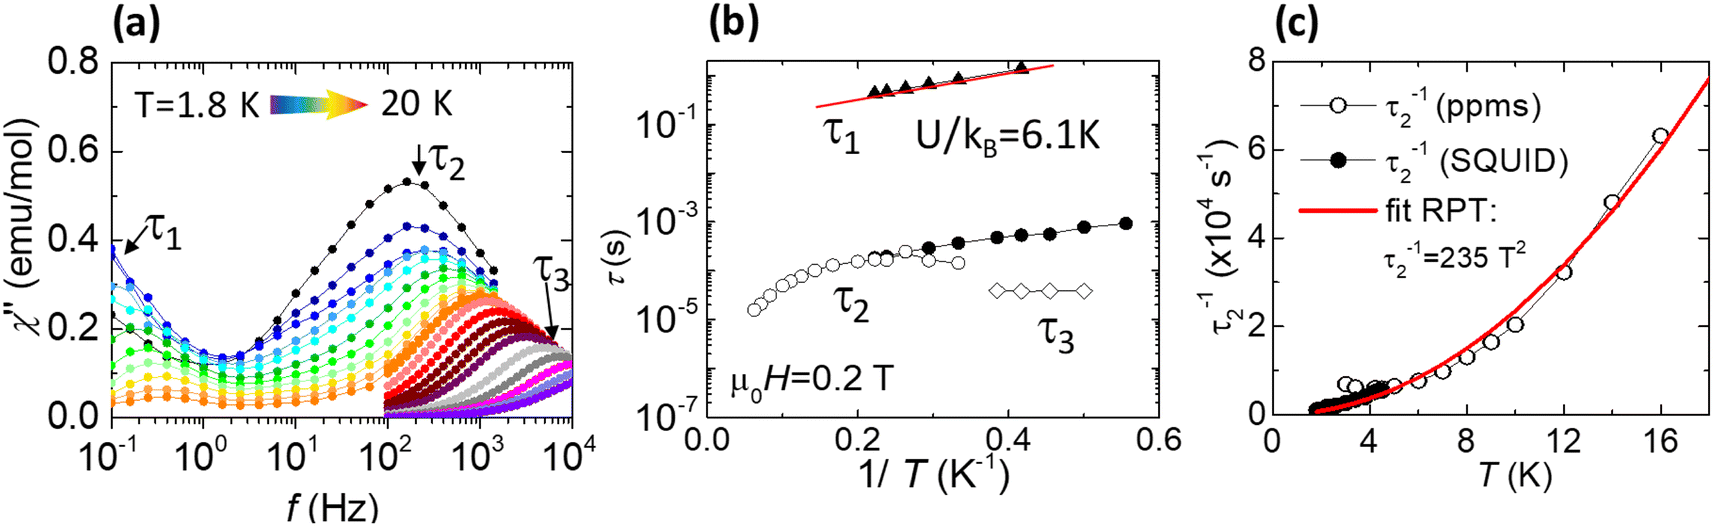 | ||
| Fig. 5 (a) Imaginary component of the ac susceptibility as a function of the frequency, χ′′(f), of complex 1 at μ0H = 0.2 T and different temperatures ranging from 1.8 K to 20 K; (b) magnetic relaxation time as a function of the inverse temperature (1/T) at μ0H = 0.2 T; (c) temperature dependence of τ2−1(T), and a fit to a power law τ2−1 = KT2, with K = 235 s−1 K−2 between 2–16 K. | ||
The first slow process has relaxation times on the order of τ1 ≈ 0.1 to 1 s. The τ1(1/T) dependence at 0.2 T could be fitted to an Arrhenius law with an activation energy of U/kB = 6.1 K, of the same order as the above calculated energy gap of 5.8 K. Previously, similar field-induced relaxation processes in Gd compounds were reported when subjected to comparable DC fields.31,32 An additional shoulder in the χ′′(f,T) with a practically T-independent relaxation time of ≈0.02 s is observed, which may be tentatively ascribed to a direct process, although with large uncertainty as the complete χ′′ peak associated with this process cannot be discriminated from the main τ2 peak. The second relaxation process (τ2) is temperature-dependent, but it cannot be assigned to an Orbach mechanism, since the energy value determined from ln[τ2(1/T)] at 10 K, U/kB = 30.4 K, is an order of magnitude larger than the anisotropy barrier. However, noting that this process follows a temperature dependence of the type τ2−1 ∝ T2 (see Fig. 5c), it can be explained by a Resonant Phonon Trapping (RPT) mechanism.31,33 This process takes place when a phonon-bottleneck effect sets in. Then the energy of the lattice modes created by the relaxing spins cannot be released into a thermal reservoir sufficiently fast. These phonons may be reabsorbed by other spins, so that the effective relaxation time becomes longer. It is noted that, for RPT to take place, the system must fulfill certain conditions.30 In particular, the wavelength of the trapped phonons should be considerably larger than the typical separation between the spins, i.e., k0rav ≪ 1, where rav is the average distance between spin sites, and k0 is the wave vector of the trapped phonon with energy hν0. Indeed, the difference between the Zeeman split mS = 7/2 and mS = −7/2 energy levels in a magnetic field of 0.2 T is ∼1.9 K. Therefore, using the Debye approximation, hν0 = csk0, and the average sound velocity obtained from the specific-heat data (cs = 4.77 × 10³ m s−1), we obtain k0 = 1.1 × 10⁷ m−1. Taking into account that rav ≈ 7.16 Å in this compound, considering both intra- and inter-layer distances, the condition k0rav ≈ 8 × 10⁻³ ≪ 1 is fulfilled. Thus, it is concluded that τ3 may be explained in terms of the RPT mechanism. The relaxation time τ3 is of the same order as previously reported for RPT processes in the [Gd2(fum)3(H2O)4]·3H2O34 and [Gd2(CNCH2COO)6(H2O)4]·2H2O.31
Finally, the very fast relaxation process at the highest frequencies (Fig. 5a and b), with a temperature-independent relaxation time of τ3 ≈ 4 × 10⁻⁵ s, may be assigned to a Quantum Tunneling of the Magnetization (QTM) process.
To further characterize the material, a suspension of flakes of 1 was spin-coated onto silicon substrates. For the exfoliation, we followed the procedure we reported for the Dy and Tb analogue.35,36 Optical images show partial coverage of the surface with flakes of average lateral size of approx. 3.4 μm (ESI Fig. S9a†). The magnetic properties of the flakes of 1 on a flat substrate were characterized by X-ray absorption spectroscopy (XAS) and X-ray magnetic circular dichroism (XMCD) at the Boreas beamline of the ALBA synchrotron. Fig. 6 shows the XAS and XMCD spectra measured at a magnetic field of 6 T and 3.4 K at the M4,5 edges of Gd. The XAS spectral features are typical of Gd(III): the M5 edge shows a shoulder at 1182.4 eV, a main peak at 1184.8, and two satellites at 1189.3 and 1191.9 eV, whereas the M4 edge exhibits two peaks at 1213.9, 1215.6 eV and a satellite at 1218.9 eV.37 We determined the spin (mS), orbital (mL), and total magnetic moment (mtot = mL + mS) per Gd(III) ion in the sample from the XAS-XMCD spectra using the corrected sum rules for lanthanides.38,39 We obtained values of, mS = 6.31 ± 0.09 μB/ion, mL = 0.19 ± 0.27 μB/ion and mtot = 6.50 ± 0.18 μB/ion. As expected for the 4f7 configuration of Gd(III) the orbital magnetic moment is vanishing though not exactly zero, as previously observed for Gd(III) complexes on surfaces.40 The field-dependence of the total magnetic moment, mtot(H), was determined by following the intensity of the XMCD(H) peak at the M5 edge between −6 T and 6 T, and scaling the curve with the value of mtot at 6 T obtained from the sum rules. Fig. S9b† compares the experimental curve, mtot(H), for the flakes of 1 on silicon with the SQUID magnetization data for the bulk material at the same temperature, 3.4 K. The two curves coincide within the experimental error. These results demonstrate the preservation of magnetic properties of 1 upon exfoliation and surface deposition.
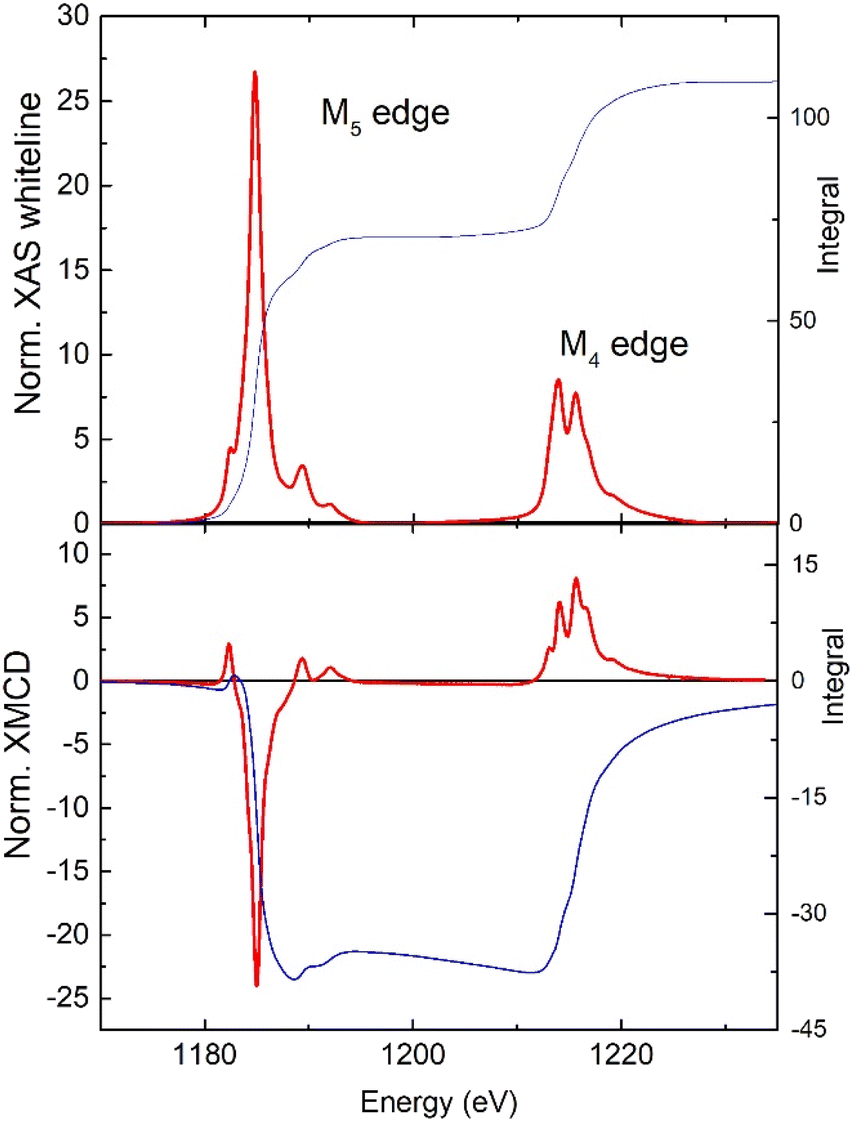 | ||
| Fig. 6 Normalized, background-subtracted XAS and XMCD spectra at the M4,5 edges of Gd measured at 3.4 K and 6 T, and the associated integrated signals (right scale). | ||
Magnetocaloric effect
To investigate the magnetic entropy in 1, we studied the heat capacity (HC) as a function of temperature in the 0.3–30 K range, at different applied magnetic fields up to 3 T (Fig. 7a). The magnetic contribution cm(T,H) to the specific heat cp(T,H), was found after subtracting the superimposed lattice contribution, cL = ATn. The specific heat curves show a broad Schottky-like contribution that shifts towards higher temperatures with increasing field. No sign of antiferromagnetic (AF) ordering is detected down to the lowest measured temperature of 0.35 K. The complex topology of the 2D layer in 1 supports a model where Gd⋯Gd dinuclear units are coupled in the 2D layer. The HC experimental data are compared to the calculated HC for a randomly oriented system of Gd⋯Gd coupled dinuclear units, with the ZFS parameters found by EPR (D/kB = −0.167 K, E = −0.0043 K, g = 1.985) and using the Hamiltonian in eqn (1) with a term introducing Gd⋯Gd coupling (J/kB = −0.036 K). The calculated curves with these parameters are compatible with the experimental data, and nicely reproduce the observed field evolution (see Fig. 7b). However, the experimental curve at zero field, as compared to the theoretical prediction, exhibits a broader contribution shifted to lower temperatures, suggesting that in this low temperature range the model used may be too simple and that additional magnetic interactions are involved.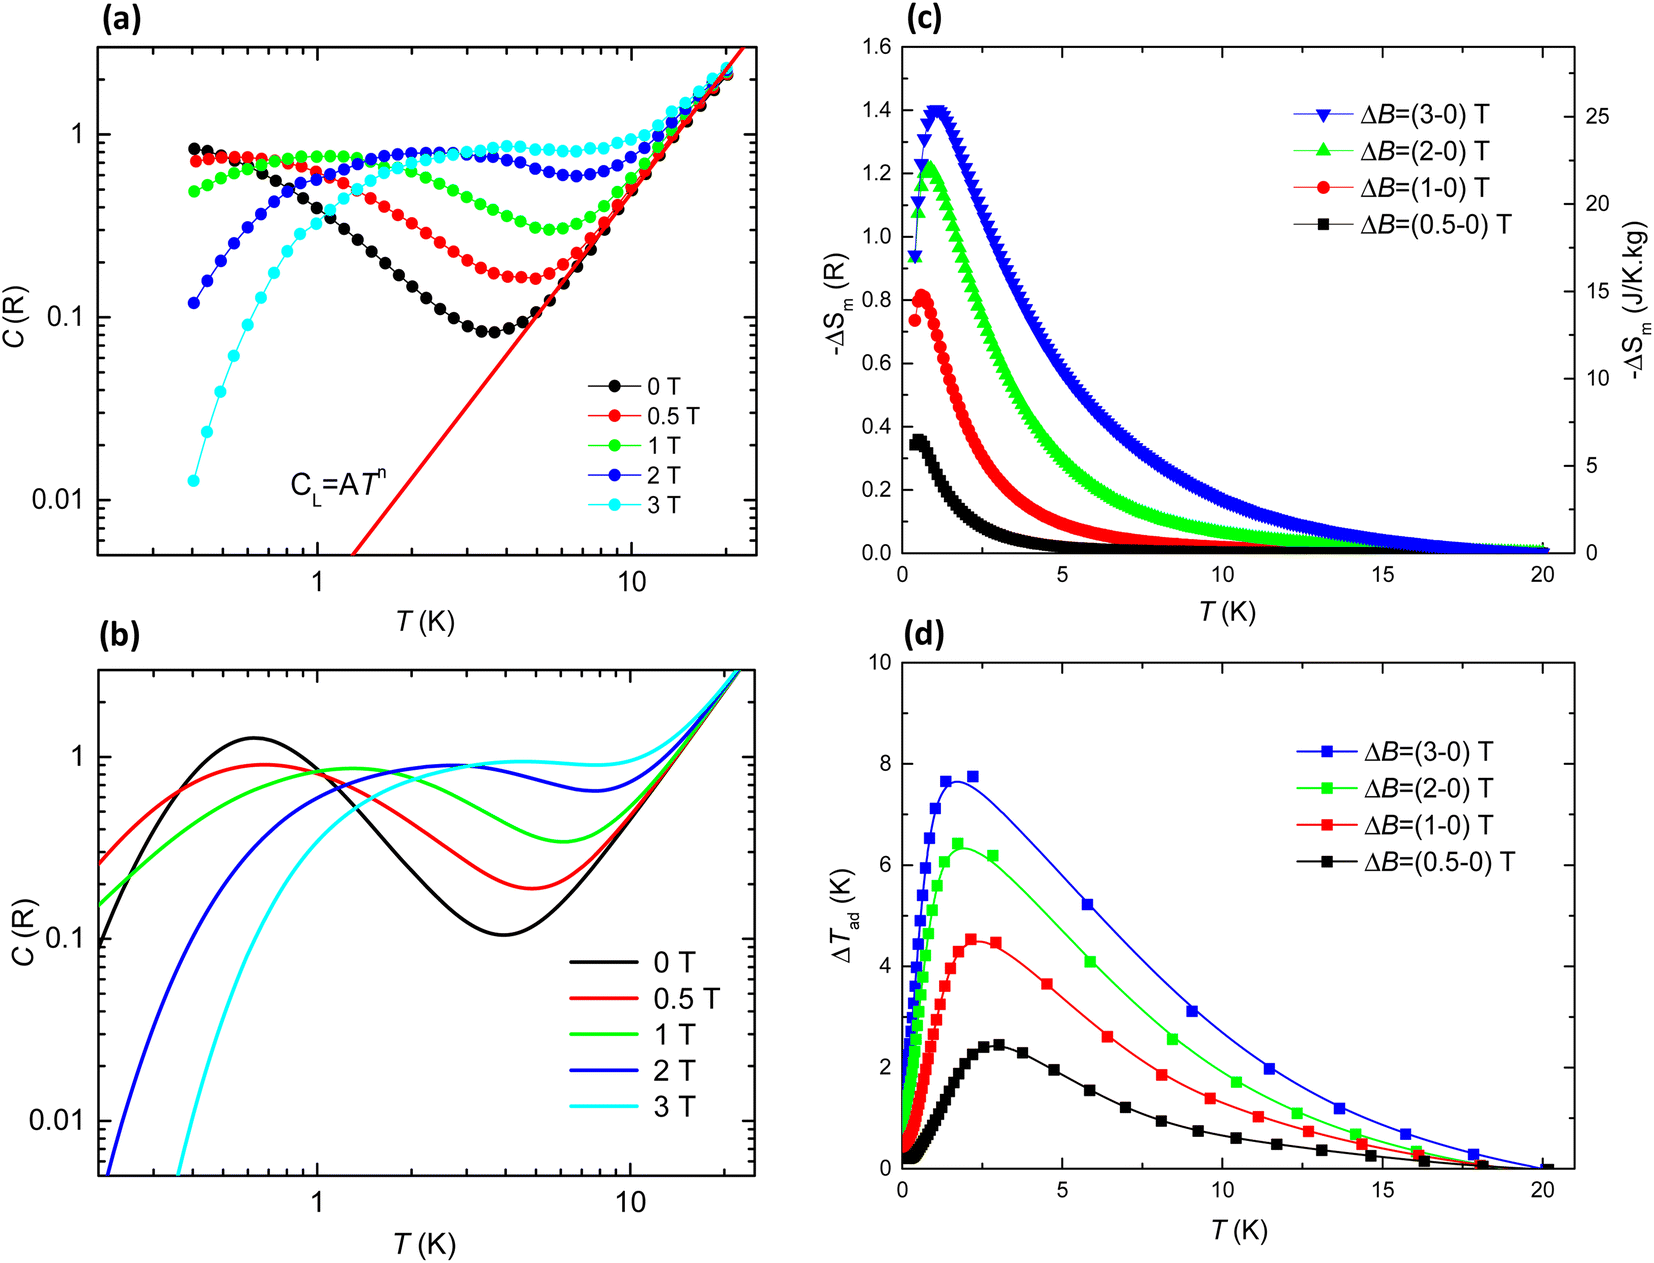 | ||
| Fig. 7 (a) Specific heat as a function of temperature at the indicated magnetic fields, cp(T,H) = cL + cm, for Gd 2D MOF 1. Red line: lattice contribution to the HC, cL = ATn, with A = 1.9 × 10⁻³ R K−2,37n = 2.27; (b) simulated cp(T,H) curves within a model of interacting Gd ions with EPR-obtained values g = 1.985, D/kB = −0.167 K, E/kB = −0.0043 K, and Gd⋯Gd coupling constant J/kB = −0.036 K; (c) temperature dependence of the magnetic entropy change, −ΔSm, and (d) temperature dependence of the adiabatic temperature change, ΔTad(T), as obtained from the heat capacity measurements for the indicated applied magnetic field changes, μ0ΔH, where T denotes the final temperature of the adiabatic cooling. | ||
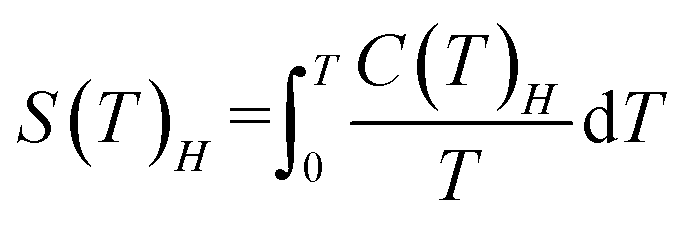
The magnetocaloric effect (MCE) performance was evaluated from the heat capacity data.41 From the HC data of Fig. 7a we firstly determine by the total entropies at applied magnetic fields Hl = 0 and Hh as a functions of temperature using the equation:
 | (1) |
Then we calculate the magnetic entropy change and adiabatic temperature change for that field change, ΔB = (Hf-0) T, as ΔSm(T)ΔH = [S(T)Hh − S(T)0]T and ΔTad(T)ΔH = [T(S)Hh − S(T)0]S, respectively. Fig. 7c shows the magnetic entropy change, −ΔSm(T,ΔB), for selected field changes, μ0ΔH = 0.5, 1, 2, 3 T. For practical purposes it is useful to consider the value of the magnetic entropy change for a magnetic field of 2 T that is easily achieved with permanent magnets. Thus, for μ0ΔH = 2 T, the maximum value is found to be −ΔSmaxm = 1.22 R (22.1 J K−1 kg−1) at Tmax = 0.79 K. This is 59% of the maximum magnetic entropy available for the system: Smax = Rln(2S + 1) = 38 J K−1 kg−1. The relative cooling power (RCP) is defined as RCP = |ΔSmmax|δTFWHM.42 For 1, The full width at half maximum of the ΔSm curve is δTFWHM = 2.48 K and RCP(1) = 54.8 J kg−1. The determined adiabatic temperature change as a function of the final temperature after the cooling, ΔTad(T), is shown in Fig. 7d. For μ0ΔH = 2–0 T this temperature change reaches a maximum of ΔTmaxad = 6.45 K at T = 1.76 K and drops to zero above 19 K, thus the material would be best suited as coolant at cryogenic temperatures.
Alternatively, the MCE can be characterized by collecting the magnetization data at various temperatures. Maxwell's equations can be used to extract the magnetic entropy change, −ΔSm.43,44 Magnetization isothermal curves at temperatures from 2 K to 10 K and fields from 0 to 7 T were collected for 1, and used to determine −ΔSm(T) (see ESI Fig. S10†). The magnetic entropy change value at 2 K and 7 T is −ΔSm(7 T) = 35 J K−1 kg−1, which is 98% of the maximum theoretical entropy, Smax. At 2 K and 2 T the determined value, –ΔSm(2 T) = 22.3 J K−1 kg−1, is in good agreement with the value found from heat capacity. The peak in the −ΔSm(T) curve that was observable in the data obtained from HC is not detected here, since magnetization measurements were performed only down to 2 K. The MCE performance of 4f and 3d molecular compounds of various dimensionalities (0D, 1D, 2D and 3D) has been recently reviewed,23 and the value of −ΔSm at 7 T in units of J K−1 kg−1 is proposed as a figure of merit. The lowest entropy values correspond to compounds with large organic ligands that result in a small density of Gd(III) ions in the material, while the large entropy values are for materials with formate, oxalate or other ligands such as sulfate.45–49 The −ΔSm(7 T) of 1 is similar to the reported 2D compounds, with values that range from 27 J K−1 kg−1 (ref. 50) to 49.29 J K−1 kg−1.51
A great advantage of compound 1 is that it can be exfoliated and deposited or grafted onto a surface, as we have shown here. This is one requirement for the application of molecular materials as magnetic refrigerators. Evangelisti and co-workers showed already that molecular Gd(III) species could be confined on a surface and retain their effective magnetic cooling properties. They propose the use of Gd MOFs in on-chip microrefrigerators, by depositing the MOF on a functionalized silicon membrane. As indicated, aliphatic linkers used to graft the MOF on the silicon ship should not hinder the conduction of heat.24,44 Our XAS and XMCD data already shows that the flakes of 1 have unchanged magnetic properties. Thus, we studied the magnetocaloric effect of 1Si. Magnetization vs. field curves at various temperatures were collected on a SQUID magnetometer in order to ascertain the magnetic entropy change of 1Si (Fig. 8b and S11†). The Si wafer with crystals of 1 grown over it, 1Si, was positioned perpendicular and parallel to the field in the SQUID. When compared to the bulk 1, the −ΔSm(T) curves show slightly lower values of entropy at 2 T, as well as a the maximum shifted to higher temperatures than for 1. The magnetic entropy change for 1Si was determined to be −ΔSm(7 T) = 31.8 J K−1 kg−1, or −ΔSm(2 T) = 17.2 J K−1 kg−1 (perpendicular) and −ΔSm(7 T) = 35.6 J K−1 kg−1, or −ΔSm(2 T) = 16.6 J K−1 kg−1 (parallel). By fitting the experimental entropy data to a peak using a logarithmic peak function (solid line in Fig. 8), we can obtain a rough estimate of δTFWHM at 2 T as 4.4 K (perpendicular) or 4.7 K (parallel), thus RCP(1Si) = 77.7 J kg−1 (perpendicular) or 75.0 J kg−1 (parallel). These approximate values are of the same order of the RCP for the bulk sample, 1, and one order of magnitude lower than the reported RCP for bulk Gd52 The small differences between the parallel and perpendicular 1Si entropy data can be attributed to the anisotropic shape of the sample. The thin layer 1Si is formed by micro and nanocrystals of 1 grafted on Si. The crystals are anisotropic in shape and orientation with respect to the field in the SQUID and polydisperse in size. The covalent bond to the Si–COO– groups is not equal for all crystals, as evidenced by the SEM images in Fig. 2 and by AFM (ESI Fig. S12†), as a large number of small crystals grow flat on the substrate (ESI Fig. S11c†) but other, larger crystals grow at random angles from the substrate (SEM images in Fig. 2). The attachment of the crystals to the substrate can cause different strains in the crystals that along with the polydispersity in size can be at the origin of the broader maximum and the shift to higher temperatures of the maximum of entropy change.
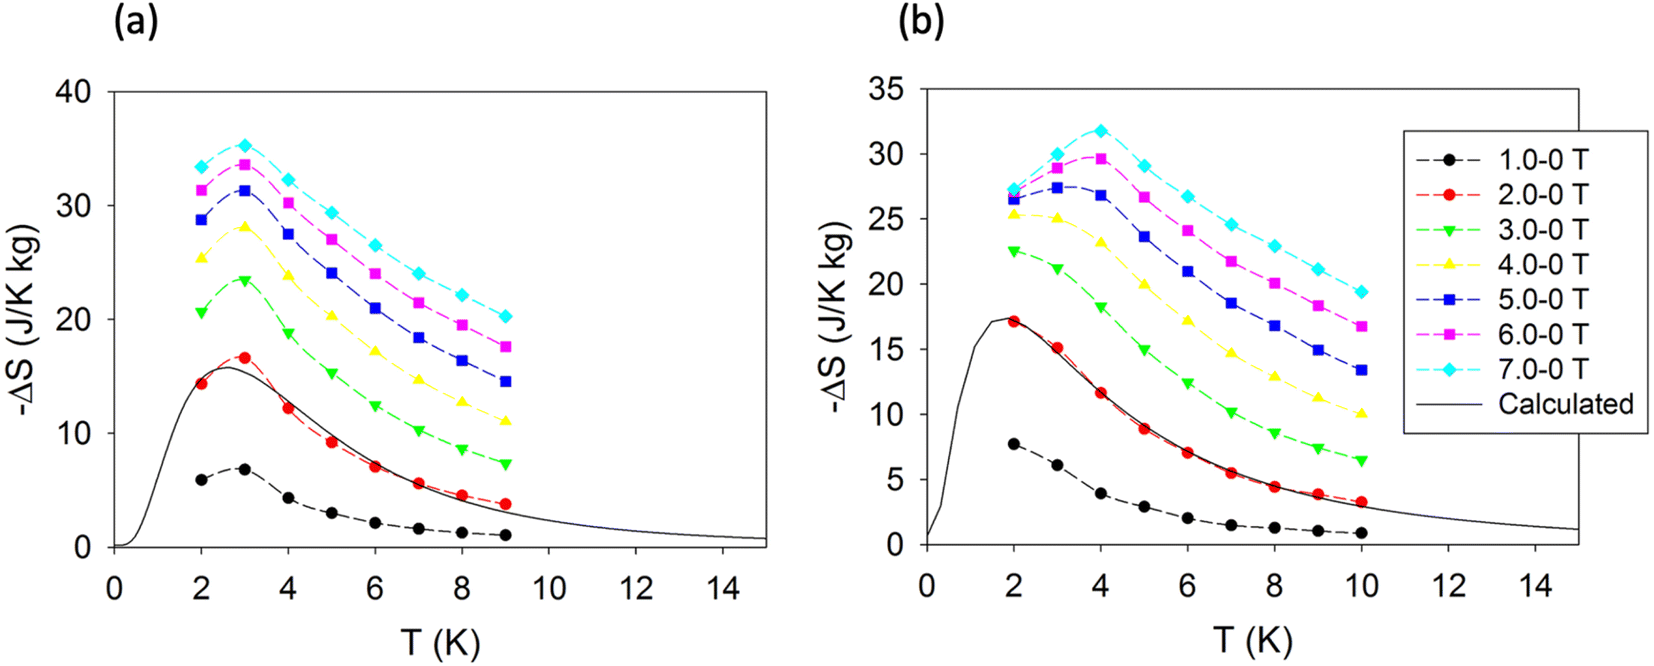 | ||
| Fig. 8 Magnetic entropy change, −ΔSm, for 1 grafted on a TSP functionalized Si wafer, 1Si, with the wafer parallel (a) and perpendicular (b) to the SQUD magnetic field. The solid line is a mathematical fit to a logarithmic peak function. | ||
Previously, thin films of oxides and metals had been proposed for their potential for cryogenic magnetic cooling of microdevices.42,53 We have shown that 2D MOF [Gd(MeCOO)(PhCOO)2] (1) can be grown on functionalized silicon wafers (1Si), and it shows a MCE similar to that of the bulk compound, opening up applications of this material as an effective cryogenic magnetic cooler for microdevices.
Conclusions
The family of [Ln(MeCOO)(PhCOO)2] van der Waals 2D MOFs offers a truly versatile system that can be used to access properties like SMM behavior (Dy, Tb), and a combination of SMM behavior and luminescence, including Ln–Ln′ energy transfer (TbEu). With the Gd analogue [Gd(MeCOO)(PhCOO)2] 1 reported here, a large magnetic entropy change and strong magnetocaloric effect are added to the properties of this versatile family of materials. The 2D MOF 1 shows a large magnetic entropy change at the technologically relevant field of 2 T, as we show by heat capacity and magnetization measurements. The paramagnetic Gd complex is anisotropic, as demonstrated by HF-EPR. Under the application of a magnetic field, different slow spin relaxation pathways were observed, the two main ones ascribed, respectively, to a thermally-activated process between ground and excited states, favored by the lifting of the Kramers degeneracy by the external field, and a resonant phonon trapping (RTP) mechanism. Furthermore, 1 can be exfoliated into monolayers and flakes, by using a simple ultrasound bath. This makes these materials amenable to the preparation of heterostructures. The flakes can be physiosorbed on surfaces by spin coating without affecting the magnetic properties of the material, as we demonstrate here by XAS and XMCD. We show how these 2D MOFs can be integrated in devices, 1 can be chemisorbed on suitably functionalized surfaces (1Si) to attain thin layers of the material that are functional in showing strong magnetic entropy change and MCE performance with RCP(1Si) = 77.7 J kg−1. This opens the possibility of using this material as an on-surface cryogenic coolant for microdevices.Author contributions
SK: investigation, formal analysis, data curation (synthesis and characterization, SEM); GGR: investigation, formal analysis, data curation (synthesis, AFM, HAXPES, CW-EPR); AA: investigation, formal analysis, data curation, writing – review and edit (heat capacity, magnetic data); JH, SH: investigation, formal analysis, data curation, writing – review and edit (HFEPR); LB: formal analysis and resources (CW-EPR); JRZ: investigation, writing – review and edit (HAXPES); JJ: investigation, writing – review and edit (theoretical calculations SHAPE and RAMAN); EB: investigation, formal analysis, data curation, visualization, writing – original draft, review and edit (heat capacity, magnetic data, XMCD); ECS: conceptualization, supervision, funding acquisition, resources, investigation, formal analysis, data curation, visualization, writing – original draft, review and edit (SCXRD, HAXPES, magnetism).Conflicts of interest
There are no conflicts to declare.Acknowledgements
ECS, EB and AA acknowledge financial support from the Spanish Government Ministerio de Ciencia Innovación y Universidades (ECS: projects PGC2018-098630-B-I00 and PID2022-137764OB-I00; EB and AA: PID2022-138492NB-I00). EB and AA acknowledge financial support from the Gobierno de Aragón (project RASMIA E12-23R). ECS acknowledges access to XALOC Alba Cells beamline with experiment number 2020084450. XAS and XMCD experiments were performed at the BOREAS beamline of the ALBA synchrotron with the support of ALBA staff (experiment number 2020084450). GGR acknowledged support from the Spanish Government Ministerio de Ciencia Innovación y Universidades (FPi contract with project PGC2018-098630-B-I00 to ECS). SH and JH acknowledge the US Department of Energy (DE-SC0020260). Work performed at the US National High Magnetic Field Laboratory is supported by the National Science Foundation (DMR-2128556) and the State of Florida. Access to ESRF beamline BM25 SpLine was financed by project A25-01-1062 to ECS. ECS and SK thank the Group d'Estructura Electrònica at UB lead by Prof. Eliseo Ruiz for the use of the ellipsometer.References
- E. Coronado, Nat. Rev. Mater., 2020, 5, 87–104 CrossRef
.
- L. A. Benítez, J. F. Sierra, W. Savero Torres, A. Arrighi, F. Bonell, M. V. Costache and S. O. Valenzuela, Nat. Phys., 2018, 14, 303–308 Search PubMed
- A. Gaita-Ariño, F. Luis, S. Hill and E. Coronado, Nat. Chem., 2019, 11, 301–309 CrossRef PubMed
- J. López-Cabrelles, L. Escalera-Moreno, Z. Hu, H. Prima-García, G. Mínguez- Espallargas, A. Gaita-Ariño and E. Coronado, Inorg. Chem., 2021, 60, 8575–8580 CrossRef PubMed
- F. Luis, P. J. Alonso, O. Roubeau, V. Velasco, D. Zueco, D. Aguilà, J. I. Martínez, L. A. Barrios and G. Aromí, Commun. Chem., 2020, 3, 176 CrossRef CAS PubMed
- M. Evangelisti, A. Candini, A. Ghirri, M. Affronte, E. K. Brechin and E. J. L. McInnes, Appl. Phys. Lett., 2005, 87, 072504 CrossRef
- I. Cimatti, L. Bondì, G. Serrano, L. Malavolti, B. Cortigiani, E. Velez-Fort, D. Betto, A. Ouerghi, N. B. Brookes, S. Loth, M. Mannini, F. Totti and R. Sessoli, Nanoscale Horiz., 2019, 4, 1202–1210 RSC
- A. Nurbawono and C. Zhang, Appl. Phys. Lett., 2013, 103, 4 CrossRef
- S. Marocchi, A. Candini, D. Klar, W. Van den Heuvel, H. Huang, F. Troiani, V. Corradini, R. Biagi, V. De Renzi, S. Klyatskaya, K. Kummer, N. B. Brookes, M. Ruben, H. Wende, U. del Pennino, A. Soncini, M. Affronte and V. Bellini, ACS Nano, 2016, 9353–9360 CrossRef CAS PubMed
- A. Candini, S. Klyatskaya, M. Ruben, W. Wernsdorfer and M. Affronte, Nano Lett., 2011, 11, 2634–2639 CrossRef CAS PubMed
- L. Gragnaniello, F. Paschke, P. Erler, P. Schmitt, N. Barth, S. Simon, H. Brune, S. Rusponi and M. Fonin, Nano Lett., 2017, 17, 7177–7182 CrossRef CAS PubMed
- V. Corradini, A. Candini, D. Klar, R. Biagi, V. De Renzi, A. L. Rizzini, N. Cavani, U. Del Pennino, S. Klyatskaya, M. Ruben, E. Velez-Fort, K. Kummer, N. B. Brookes, P. Gargiani, H. Wende and M. Affronte, Nanoscale, 2017, 10, 277–283 RSC
- M. Zhao, Y. Wang, Q. Ma, Y. Huang, X. Zhang, J. Ping, Z. Zhang, Q. Lu, Y. Yu, H. Xu, Y. Zhao and H. Zhang, Adv. Mater., 2015, 27, 7372–7378 CrossRef CAS PubMed
- H. Zhua and D. Liu, J. Mater. Chem. A, 2019, 7, 21004–21035 RSC
- G. Gabarró-Riera, G. Aromí and E. C. Sañudo, Coord. Chem. Rev., 2023, 475, 214858 CrossRef
- A. Urtizberea, E. Natividad, P. J. Alonso, M. A. Andrés, I. Gascón, M. Goldmann and O. Roubeau, Adv. Funct. Mater., 2018, 28, 1–15 CrossRef
- A. Urtizberea, E. Natividad, P. J. Alonso, L. Pérez-Martínez, M. A. Andrés, I. Gascón, I. Gimeno, F. Luis and O. Roubeau, Mater. Horiz., 2020, 7, 885–897 RSC
- J. González, P. Sevilla, G. Gabarró-Riera, J. Jover, J. Echeverría, S. Fuertes, A. Arauzo, E. Bartolomé and E. C. Sañudo, Angew. Chem., Int. Ed., 2021, 60, 12001–12006 CrossRef PubMed
- E. Bartolomé, A. Arauzo, S. Herce, A. Palau, N. Mestres, S. Fuertes, P. Sevilla, N. S. Settineri, L. Navarro-Spreafico, J. González and E. C. Sañudo, Molecules, 2021, 26(18), 5503 CrossRef PubMed
- E. Bartolomé, A. Arauzo, S. Fuertes, L. Navarro-Spreafica, P. Sevilla, H. F. Cortés, N. Settineri, S. J. Teat and E. C. Sañudo, Dalton Trans., 2023, 52, 7258–7270 RSC
- V. K. Pecharsky and K. G. Gschneider Jr, J. Magn. Magn. Mater., 1999, 200, 44–56 CrossRef CAS
- J. Romero Gómez, R. Ferreiro Garcia, A. de Miguel Catoira and M. Romero Gómez, Renewable Sustainable Energy Rev., 2013, 17, 74–82 CrossRef
- P. Konieczny, W. Sas, D. Czernia, A. Pacanowska, M. Fitta and R. Pełka, Dalton Trans., 2022, 51, 12762–12780 RSC
- G. Lorusso, E. Natividad, M. Evangelisti and O. Roubeau, Mater. Horiz., 2019, 6, 144–154 RSC
- G. Lorusso, M. Jenkins, P. González-Monje, A. Arauzo, J. Sesé, D. Ruiz-Molina, O. Roubeau and M. Evangelisti, Adv. Mater., 2013, 25, 2984–2988 CrossRef CAS PubMed
- M. Godoy-Gallardo, M. C. Manzanares-Céspedes, P. Sevilla, J. Nart, N. Manzanares, J. M. Manero, F. J. Gil, S. K. Boyd and D. Rodríguez, Mater. Sci. Eng. C, 2016, 69, 538–545 CrossRef CAS PubMed
- G. Gabarró-Riera, J. Jover, J. R. Zuazo, E. Bartolomé and E. C. Sañudo, Inorg. Chem. Front., 2022, 9, 4160–4170 RSC
- S. Stoll and A. Schweiger, J. Magn. Reson., 2006, 178, 42–55 CrossRef CAS PubMed
- J. R. Rubio-Zuazo and G. R. Castro, Nucl. Instrum. Methods Phys. Res., Sect. A, 2005, 547, 64–72 CrossRef CAS
- J. Rubio-Zuazo, M. Escher, M. Merkel and G. R. Castro, Rev. Sci. Instrum., 2010, 81, 043304 CrossRef CAS PubMed
- A. Arauzo, A. Lazarescu, S. Shova, E. Bartolomé, R. Cases, J. Luzón, J. Bartolomé and C. Turta, Dalton Trans., 2014, 43, 12342–12356 RSC
- B. Liu, B.-W. Wang, Z.-M. Wang and S. Gao, Sci. China: Chem., 2012, 5, 926 CrossRef
- R. R. Schenker, M. N. Leuenberger, G. Chaboussant, D. Loss and H. U. Güdel, Phys. Rev. B: Condens. Matter Mater. Phys., 2005, 72, 184403–184413 CrossRef
- M. Orendáč, L. Sedláková, E. Čižmár, a. Orendáčová, a. Feher, W. H. Zhu, Z. M. Wang and S. Gao, Phys. Rev. B: Condens. Matter Mater. Phys., 2010, 81, 1–8 CrossRef
- J. González, P. Sevilla, G. Gabarró-Riera, J. Jover, J. Echeverría, S. Fuertes, A. Arauzo, E. Bartolomé and E. C. Sañudo, Angew. Chem., Int. Ed., 2021, 60, 12001–12006 CrossRef PubMed
- E. Bartolomé, A. Arauzo, S. Herce, A. Palau, N. Mestres, S. Fuertes, P. Sevilla, N. S. Settineri, L. Navarro-Spreafico, J. González and E. C. Sañudo, Molecules, 2021, 26, 1–14 CrossRef PubMed
- G. Champion, N. Lalioti, V. Tangoulis, M.-A. Arrio, P. Sainctavit, F. Villain, A. Caneschi, D. Gatteschi, C. Giorgetti, F. Baudelet, M. Verdaguer and C. Cartier dit Moulin, J. Am. Chem. Soc., 2003, 125, 8371–8376 CrossRef CAS PubMed
- B. Thole, P. Carra, F. Sette and G. van der Laan, Phys. Rev. Lett., 1992, 68, 1943–1946 CrossRef CAS PubMed
- P. Carra, B. T. Thole, M. Altarelli and X. Wang, Phys. Rev. Lett., 1993, 70, 694–697 CrossRef CAS PubMed
- P. Stoll, M. Bernien, D. Rolf, F. Nickel, Q. Xu, C. Hartmann, T. R. Umbach, J. Kopprasch, J. N. Ladenthin, E. Schierle, E. Weschke, C. Czekelius, W. Kuch and K. J. Franke, Phys. Rev. B, 2016, 94, 224426 CrossRef
- M. Evangelisti, A. Candini, A. Ghirri, M. Affronte, S. Piligkos, E. K. Brechin and E. J. L. McInnes, Polyhedron, 2005, 24, 2573–2578 CrossRef CAS
- J. H. Jia, Y. J. Ke, X. Li, H. R. Zhang, Z. P. Yu, Z. H. Cheng, K. Zhai, Z. Y. Liu and J. F. Wang, J. Mater. Chem. C, 2019, 7, 14970–14976 RSC
- M. Evangelisti and E. K. Brechinb, Dalton Trans., 2010, 39, 4672–4676 RSC
- G. Lorusso, M. Jenkins, P. González-Monje, A. Arauzo, J. Sesé, D. Ruiz-Molina, O. Roubeau and M. Evangelisti, Adv. Mater., 2013, 25, 2984–2988 CrossRef CAS PubMed
- S. P. Bera, A. Mondal and S. Konar, Chem.–Asian J., 2019, 14, 3702–3711 CrossRef CAS PubMed
- T.-Q. Song, J. Dong, A.-F. Yang, X.-J. Che, H.-L. Gao, J.-Z. Cui and B. Zhao, Inorg. Chem., 2018, 57, 3144–3150 CrossRef CAS PubMed
- S.-J. Liu, C. Cao, S.-L. Yao, T.-F. Zheng, Z.-X. Wang, C. Liu, J.-S. Liao, J.-L. Chen, Y.-W. Li and H.-R. Wen, Dalton Trans., 2017, 46, 64–70 RSC
- S.-D. Han, J.-H. Li, H.-H. Liua and G.-M. Wang, Dalton Trans., 2017, 46, 10023–10028 RSC
- G. Lorusso, M. A. Palacios, G. S. Nichol, E. K. Brechin, M. Evangelisti and O. Roubeau, Chem. Commun., 2012, 48, 7592 RSC
- W.-W. Wei, L.-P. Lu, S.-S. Feng, M.-L. Zhu and U. Englerta, Acta Crystallogr., Sect. C: Struct. Chem., 2021, 77, 591–598 CrossRef CAS PubMed
- S. P. Bera, A. Mondal and S. Konar, Chem.–Asian J., 2019, 14, 3702–3711 CrossRef CAS PubMed
- C. W. Miller, D. V. Williams, N. S. Bingham and H. Srikanth, J. Appl. Phys., 2010, 107 Search PubMed
- W. Sas and M. Fitta, J. Magn. Magn. Mater., 2023, 575, 170719 CrossRef CAS
Footnote |
| † Electronic supplementary information (ESI) available. CCDC 2250164. For ESI and crystallographic data in CIF or other electronic format see DOI: https://doi.org/10.1039/d3ta06648g |
| This journal is © The Royal Society of Chemistry 2024 |