
Low band gap semiconducting covalent organic framework films with enhanced photocatalytic hydrogen evolution†
Samrat
Ghosh
 *abc,
Hüseyin
Küçükkeçeci
c,
Rajendra Prasad
Paitandi
d,
Vincent
Weigelt
c,
Veit
Dippold
c,
Shu
Seki
*d and
Arne
Thomas
*c
*abc,
Hüseyin
Küçükkeçeci
c,
Rajendra Prasad
Paitandi
d,
Vincent
Weigelt
c,
Veit
Dippold
c,
Shu
Seki
*d and
Arne
Thomas
*c
aInorganic and Physical Chemistry Laboratory, Council of Scientific and Industrial Research (CSIR), Central Leather Research Institute (CLRI), Chennai – 600020, India. E-mail: samrat@clri.res.in
bAcademy of Scientific and Innovative Research (AcSIR), Ghaziabad – 201002, India
cDepartment of Chemistry/Functional Materials, Technische Universität Berlin, Berlin 10623, Germany
dDepartment of Molecular Engineering, Graduate School of Engineering, Kyoto University, Nishikyo-ku, Kyoto 615-8510, Japan
First published on 20th November 2023
Abstract
Semiconducting covalent organic frameworks (COFs) are emerging materials for the photocatalytic hydrogen (H2) evolution, owing to their porous periodic network of π-conjugated scaffolds with tuneable band gap and optoelectronic properties. The optoelectronic properties, for example, band gap, band position and charge carrier mobility of the COF photocatalyst, play a pivotal role in their activity in photocatalytic conversions. However, it is challenging to control the band gap and band position of COFs simultaneously. In the present manuscript, we investigate the photocatalytic performance of low band gap semiconducting COFs constructed from anthracene containing π-conjugated building blocks linked with different hydroxy functionalized 1,3,5-triformylbenzene. Along with crystalline and porous COF powders, thin COF films were synthesized successfully. Such thin COF films offer several advantages in photocatalytic applications owing to their low light scattering, scalability and reusability. It is furthermore shown that the number of hydroxy groups on the 1,3,5-triformylbenzene linker largely influences the properties of the final COFs. The COF prepared from the linker with two hydroxy groups exhibits the lowest band gap of 1.8 eV and efficient exciton migration due to the formation of J-type aggregates resulting in the maximum hydrogen evolution rate (8.4 ± 0.5 mmol g−1 h−1) in the powder state. On the other hand, for COF films a steady increase in hydrogen evolution rate is observed with increasing hydroxy-functionalization and reaches a maximum for three hydroxy groups (1.6 ± 0.2 mmol m−2 h−1) due to the enhanced charge carrier mobility.
 Samrat Ghosh | Dr Samrat Ghosh has been a Scientist at CSIR – Central Leather Research Institute, India since 2021. He obtained his PhD in 2018 at CSIR – National Institute for Interdisciplinary Science and Technology in the field of Supramolecular Chemistry and received the best thesis award in Chemical Science from the Academy of Scientific and Innovative Research. Before starting his independent career, he worked as a JSPS postdoctoral fellow at Kyoto University, Japan and Alexander-von-Humboldt (AvH) postdoctoral fellow at Technische Universität Berlin, Germany. His research interests focus on the development of porous organic semiconductors for optoelectronic and photocatalytic applications with the fundamental understanding of charge dynamics. |
1. Introduction
With the rapid rise in global population, the demand for energy has increased, leading to rigorous usage of the fossil resources, causing a huge environmental impact.1 In this context, hydrogen (H2) is considered as a green fuel with high energy density, promising a sustainable future economy using sunlight as an unlimited energy source for splitting water into H2 and oxygen (O2).2 This technology relies on photocatalysts, capable of absorbing solar light, generating charge carriers, and driving the desired redox reactions to store solar energy as chemical energy for on-demand usage.3,4 To fulfil this purpose, a large number of inorganic,5–7 organic or hybrid heterogeneous photocatalysts for proton reduction and overall water splitting have been investigated.8–10 Among different types of heterogeneous photocatalysts, organic polymeric catalysts such as carbon nitride, covalent triazine frameworks, conjugated microporous polymers and most recently covalent organic frameworks (COFs) have received special attention for the photocatalytic H2 evolution reaction (HER), because of their tailorable structures and properties.11–14COFs are covalently connected two- (2D) or three- (3D) dimensional crystalline porous polymers that can be potentially applied in gas adsorption, separation, catalysis, energy storage, sensing and biomedical applications.15–18 Particularly, 2D-COFs are promising as photocatalysts due to their extended π-conjugated networks, which can serve as light harvesters, and their high surface areas, which provide a large number of accessible catalytically active sites for the required redox reactions.19,20 The bottom-up synthesis of COFs is advantageous to introduce different types of π-conjugated building blocks, enabling tuneable band gaps, optical and electronic properties.21 Besides the choice of such building blocks, the way how they are connected also plays a crucial role in allowing intramolecular charge transfer and electronic communication between the π-conjugated building blocks.22,23 Numerous COFs have been employed so far in combination with co-catalysts and sacrificial electron donors (SEDs) to achieve photocatalytic HER.20 The photocatalytic performance of a COF depends on several factors, primarily, its light absorption ability (i.e., band gap) and band position, the ability of charge separation and transport, along with crystallinity, porosity, stacking, stability, morphology, water dispersibility, pH and co-catalyst.24,25
Solar radiation encompasses wavelengths from the high energy ultra-violet (UV) to visible (Vis) to infrared (IR) (250–2250 nm) making it challenging to harness the entire solar spectrum. Most COF photocatalysts absorb in the UV-Vis wavelength which accounts for approximately 47% of the solar spectrum, while 74% is reached until 1000 nm.26 Thus, enhancing light harvesting by reducing the band gap of the photocatalyst can lead to improved catalytic performance and solar-to-hydrogen efficiency (SHE).27 However, a decrease in band gap simultaneously shifts the band positions (valence (VB) and conduction band (CB)) and sometimes these band positions fall at or below the potential of proton reduction, rendering the photocatalyst inactive.28 Typically, efficient COF photocatalysts for the HER have a band gap of >2 eV while no activity is observed if the band gap falls below 2 eV due to the shift in the CB and VB position.20 Therefore, simultaneous control of the band gap and band position presents a challenging task.
In most cases COFs are used as dispersed powders when tested for photocatalytic HER.19 In such a case, the catalytic activity per mass greatly varies with the applied amount of the photocatalyst, due to the increased scattering of the dispersion with rising powder content. To avoid this scattering effect, in most cases very low amounts of COF powders (i.e., a few mg) are applied, yielding on the one hand remarkable high gravimetric hydrogen evolution numbers, while the overall hydrogen evolution values are rather low. It should be further noted that there is no realistic scenario imaginable in which a suspended photocatalyst can be upscaled to produce a reasonable amount of H2.29 Finally, the photocatalytic activity of suspended photocatalysts can differ strongly when experimental conditions and setups are varied. In comparison to suspended powders, thin films of photocatalysts offer inherent advantages such as low light scattering, scalability, easy recovery, and reusability, making them more suitable for practical applications.30,31 Additionally, film photocatalysts can provide consistent, quantifiable, and reliable results.
In this work, we report a series of π-conjugated COFs, by condensing extended π-conjugated 9,10-bis(4-aminophenylethynyl)anthracene (AntT) with benzene-1,3,5-tricarbaldehydes containing different numbers of hydroxy groups in the ortho-position to the aldehyde functions (n = 0, 1, 2, 3), resulting in COFs named AntTTF, AntTMH, AntTDH and AntTTH respectively (Scheme 1). AntT serves as a π-conjugated planar building block known for its strong light-harvesting ability.32 Our previous studies demonstrated that the β-ketoenamine linkage plays a crucial role in maintaining the planarity and in-plane conjugation between the AntT scaffold through intramolecular H-bonding, leading to high charge carrier mobility and band-like transport of photogenerated charge carriers.33 Thus, when the number of hydroxy groups is varied, it should be possible to investigate the effect of keto–enol tautomerism on the band gap, band position, charge separation and transport and consequently photocatalytic performance. With a gradual increase in the number of hydroxy groups, it is anticipated that the equilibrium shifts towards the keto-form (Scheme 1), leading to a significant difference in optical and electronic properties as well as photocatalytic performance. In addition to the powder form, all COFs were obtained as crystalline films. In the powder state, AntTDH exhibits the lowest bandgap of 1.8 eV due to the formation of J-type aggregates and high photocatalytic HER rate of 8.4 ± 0.5 mmol g−1 h−1. On the other hand, AntTTH shows the highest photocatalytic HER rate of 1.6 ± 0.2 mmol m−2 h−1 in the film state, which could be attributed to the broad light absorption and enhanced charge carrier mobility.
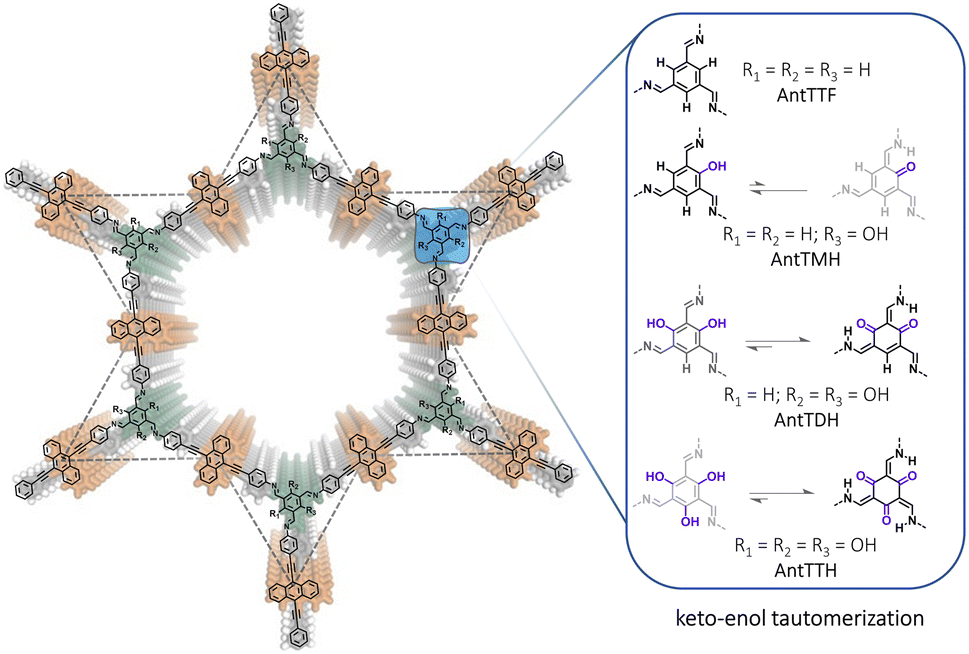 | ||
| Scheme 1 Chemical structures of anthracene-based COFs and possible equilibria of the keto–enol tautomerization using different hydroxy functionalized linkages. | ||
2. Results and discussion
All COF powders and films were synthesized under acid catalysed solvothermal conditions upon condensing AntT with 1,3,5-triformylbenzene (TF), 2,4,6-triformylphenol (MH), 2,4,6-triformylresorcinol (DH) and 2,4,6-triformylphloroglucinol (TH) using mesitylene/dioxane as the solvent mixture. The COF powders were prepared with a high concentration of the building blocks, while for the preparation of COF films, a quartz substrate was submerged vertically into a solution of a lower concentration of the monomers. Previously, we have reported the synthesis of AntTTH and AntTTF, and characterized both COFs in detail using various analytical techniques.33 In the present work, the structural identity and optoelectronic properties of these COFs were controlled again, which proved to be consistent with the published results. In this work, two new COFs, AntTMH and AntTDH were synthesized, and all COFs were tested for photocatalytic H2 evolution.To confirm the formation of crystalline frameworks, powder X-ray diffraction (PXRD) analysis was conducted for all the synthesized COFs and compared with the simulated PXRD pattern obtained through geometrical optimization. All the COFs except AntTMH exhibit a strong diffraction peak around 2θ ∼2.26° with similar diffractions at higher 2θ values, indicating the formation of isoreticular crystalline frameworks (Fig. 1a, c and S1a†). Unfortunately, we could not obtain a crystalline AntTMH despite employing various synthetic conditions, mostly forming amorphous polymers in which building blocks are partially trapped as evident from the multiple diffraction peaks in PXRD and difficult to remove by washing (Fig. S1b†). In the case of AntTTH, the diffraction peaks at 2.27°, 3.64°, 4.54°, 7.79°, 12.07° and 26.5° correspond to (100), (2–10), (200), (4–20), (6–10) and (001) planes, respectively. Similar diffraction peaks were observed for AntTDH at 2.28°, 3.63°, 4.50°, 6.02°, 8.14°, 12.18° and 25.7° corresponding to (010), (2–10), (020), (3–10), (4–30), (6–10) and (001) planes, respectively. Additionally, AntTTF displayed diffraction peaks at 2.29°, 3.88°, 4.70°, 6.1° and 26.0° corresponding to (100), (101), (200), (201) and (001) planes respectively (Fig. S1a†). The experimental PXRD pattern matched well with the geometry optimized eclipsed (AA) stack calculated using density functional-based tight binding (DFTB+) in Materials Studio software package (details provided in the ESI†). To investigate the chemical connectivity of the synthesized COF powders and films, the Fourier-transform infrared (FT-IR) spectra were recorded and compared with the corresponding building blocks. The disappearance of the –NH2 stretching band and appearance of the characteristic imine (1623 cm−1) and enamine (1253 cm−1) stretching bands validate the network formation, where AntTTF is connected through the imine, while AntTDH and AntTTH are linked via both imine and enamine.34,35 In order to probe the chemical similarity between the powder and films, Raman spectra were compared. Identical Raman spectra were obtained for both the powder and film samples of the COF, indicating the same chemical integrity (Fig. S2b†). To further elucidate the chemical structure of COFs, 13C cross-polarization magic angle spinning (CP-MAS) NMR measurements were performed. Both AntTTH and AntTDH exhibited signals at 106 and 178–190 ppm, corresponding to enamine C![[double bond, length as m-dash]](https://www.rsc.org/images/entities/char_e001.gif) C and carbonyl CO carbon, respectively characteristic of the β-ketoenamine linkage (Fig. 1b and d).25,36 Additionally, the absence of a strong imine CN signal at ∼156–160 ppm for both AntTTH and AntTDH confirms the predominance of the keto- over the enol- form. Possibly due to an extended reaction time of seven days, AntTDH largely remains in the keto-form. Chemically, even the keto-form of AntTDH should contain one imine linkage along with two β-ketoenamine linkages, as evident from the signal at 110 ppm as marked in blue in the solid-state 13C CP-MAS NMR spectrum (Fig. 2d). Furthermore, X-ray photoelectron spectroscopy (XPS) analysis of all the COF powders and films were consistent with the FT-IR, Raman and 13C CP-NMR results. Deconvolution of the N 1s spectrum revealed that AntTTF exhibits the most intense peak at 399.1 eV, assigned to imine nitrogen (Fig. S3a and b†). In contrast, AntTTH and AntTDH showed a strong peak at 400.2 eV, assigned to the secondary amine of the β- ketoenamine linkage (Fig. S3c–f†).36 Additionally, the N 1s spectrum of AntTDH is slightly broader compared to that of AntTTH, suggesting the presence of imine nitrogen along with β-ketoenamine that are merged together. These results are consistent in the powder as well as in the film state, further validating that both AntTTH and AntTDH predominantly remain in the keto-form which opens up the possibility of intramolecular H-bonding.37 The permanent porosities of all the COFs were assessed by nitrogen (N2) adsorption–desorption isotherms at 77 K. The Brunauer–Emmett–Teller (BET) surface areas of AntTTH, AntTDH and AntTTF powders were 940, 866, and 535 m2 g−1, respectively (Fig. S4a†). On the other hand, the calculated BET surface areas of AntTTH, AntTDH and AntTTF films were 561, 481 and 275 m2 g−1, respectively, which is comparatively lower than the ones found for the respective powders (Fig. S4b†). For the preparation of COF films, a quartz substrate was submerged vertically into a solution of monomers with lower concentration and heated at 120 °C (Fig. 2a). This method resulted in uniform transparent films for all the COFs (Fig. 2b).
C and carbonyl CO carbon, respectively characteristic of the β-ketoenamine linkage (Fig. 1b and d).25,36 Additionally, the absence of a strong imine CN signal at ∼156–160 ppm for both AntTTH and AntTDH confirms the predominance of the keto- over the enol- form. Possibly due to an extended reaction time of seven days, AntTDH largely remains in the keto-form. Chemically, even the keto-form of AntTDH should contain one imine linkage along with two β-ketoenamine linkages, as evident from the signal at 110 ppm as marked in blue in the solid-state 13C CP-MAS NMR spectrum (Fig. 2d). Furthermore, X-ray photoelectron spectroscopy (XPS) analysis of all the COF powders and films were consistent with the FT-IR, Raman and 13C CP-NMR results. Deconvolution of the N 1s spectrum revealed that AntTTF exhibits the most intense peak at 399.1 eV, assigned to imine nitrogen (Fig. S3a and b†). In contrast, AntTTH and AntTDH showed a strong peak at 400.2 eV, assigned to the secondary amine of the β- ketoenamine linkage (Fig. S3c–f†).36 Additionally, the N 1s spectrum of AntTDH is slightly broader compared to that of AntTTH, suggesting the presence of imine nitrogen along with β-ketoenamine that are merged together. These results are consistent in the powder as well as in the film state, further validating that both AntTTH and AntTDH predominantly remain in the keto-form which opens up the possibility of intramolecular H-bonding.37 The permanent porosities of all the COFs were assessed by nitrogen (N2) adsorption–desorption isotherms at 77 K. The Brunauer–Emmett–Teller (BET) surface areas of AntTTH, AntTDH and AntTTF powders were 940, 866, and 535 m2 g−1, respectively (Fig. S4a†). On the other hand, the calculated BET surface areas of AntTTH, AntTDH and AntTTF films were 561, 481 and 275 m2 g−1, respectively, which is comparatively lower than the ones found for the respective powders (Fig. S4b†). For the preparation of COF films, a quartz substrate was submerged vertically into a solution of monomers with lower concentration and heated at 120 °C (Fig. 2a). This method resulted in uniform transparent films for all the COFs (Fig. 2b).
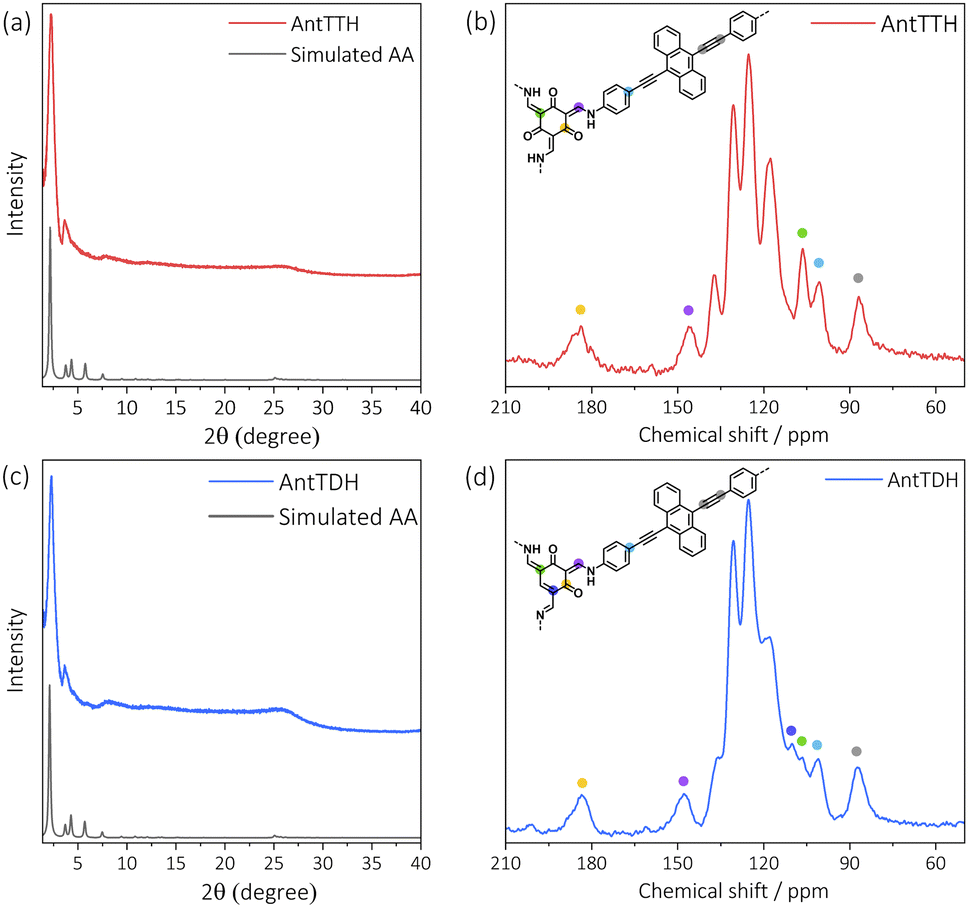 | ||
| Fig. 1 Experimental and simulated PXRD pattern of (a) AntTTH and (c) AntTDH powders. Solid state 13C CP-MAS spectra of (b) AntTTH and (d) AntTDH powders with the corresponding chemical structure of the smallest repeating unit. | ||
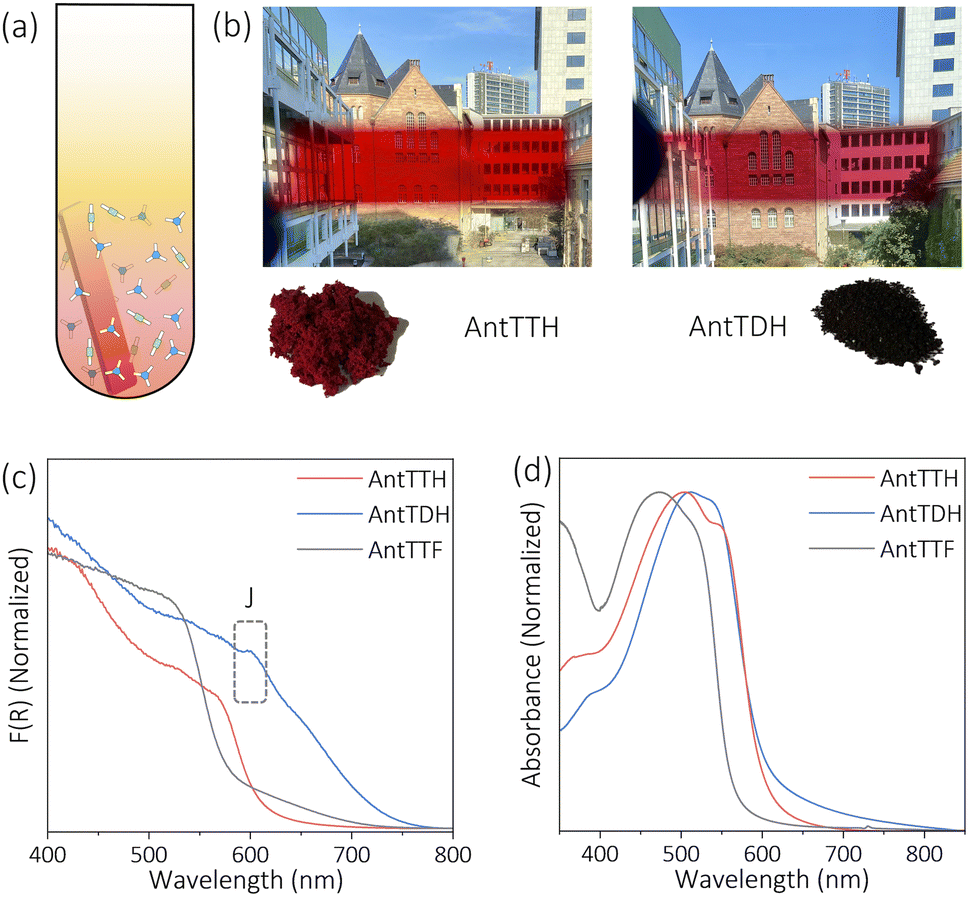 | ||
| Fig. 2 (a) Schematic illustration of the in situ preparation of the COF films. (b) Images of COF films and powders of AntTTH and AntTDH, representing the colour and optical transparency of the films. UV-Vis (c) diffuse reflectance spectra of powders and (d) absorption spectra of films of AntTTH, AntTDH and AntTTF. | ||
In the next step, the light harvesting properties and optical band gaps of all the COFs in both powder and film states were investigated, which are essential for photocatalytic applications. Both the powder and film of AntTTH and AntTTF exhibit dark red and orange red colours respectively, while AntTDH appeared as a black powder and showed a purple red colour in the film state (Fig. 2b). UV-Vis diffuse reflectance spectra (DRS) were recorded for the powder samples and AntTDH showed a very broad absorption extending to 750 nm with an optical band gap of 1.8 eV, calculated from the Tauc plot (Fig. 2c and S5†). Such a low band gap and broad absorption are advantageous for enhancing photocatalytic performance. On the other hand, AntTTH and AntTTF powders absorb until 620 and 580 nm, having an optical band gap of 2.0 and 2.2 eV respectively (Fig. 2c). Similarly, in the film state, both AntTTH and AntTDH exhibited a red shifted optical absorption compared to AntTTF. The keto–enol tautomerization and intramolecular H-bonded planar structure of AntTTH and AntTDH facilitate the push–pull effect via intramolecular charge transfer from the electron donating anthracene to the electron accepting keto- functionalized benzene, leading to extended conjugation with strong π–π interaction between the layers.38–40 The contrasting colour in the film and powder state of AntTDH arose due to the formation of long range J-type aggregates which is evident from the red shifted band at 600 nm.41–43 All the COFs contain a 9,10-bis(phenylethynyl)anthracene (BPEA) unit, known to show a strong red shift aggregate band with increase in particle size.44 The larger particle size in the powder state compared to the film explains the difference in the optical absorption of AntTDH (Fig. S6†). However, the question arises why a similar red shifted J-aggregate band is absent in the case of AntTTH and AntTTF, even though both contain BPEA. This can be explained with the help of the molecular dipole moment which plays a crucial role in J-type aggregate formation.45 The dipole moments were calculated for the energy optimized smallest repeating unit and notably AntTDH showed the highest dipole moment along the molecular plane compared to the other one due to the unsymmetrically positioned keto groups (electron accepting) with respect to the electron donating anthracene (Fig. S7†), while the symmetric structures of AntTTH and AntTTF reduce the resultant dipole moment. This large molecular dipole moment of AntTDH favours the strong J-type aggregation. Also, J-type aggregates are known to facilitate the exciton migration which is beneficial for the photocatalytic reactions.46
The VB positions of all the COFs were calculated from the PYS measurement (Fig. S8a–c†) and converted into potential relative to the normal hydrogen electrode (NHE). The estimated VB potentials of AntTTH, AntTDH and AntTTF were at 1.14, 1.26 and 1.04 V respectively. The CB potentials were calculated by subtracting the optical band gap from the VB potential, resulting in values of −0.86, −0.54 and −1.16 V for AntTTH, AntTDH and AntTTF powders, respectively (Fig. 3a). Similarly, band positions were calculated for the COF films (Fig. S8d†). The calculated CB potentials of all the COFs are significantly higher than the proton reduction potential and the VB potentials are considerably lower than the oxidation potential of L-ascorbic acid (AA) calculated at pH = 2.6.47 Hence all the COFs have sufficient driving force to perform the photocatalytic proton reduction. Therefore, we proceeded to investigate the photocatalytic HER of all the COF powders and films. Initially, the photocatalytic activity of the COF powders was assessed under visible light (≥420 nm, 300 W) in the presence of 2 wt% Pt co-catalyst and AA as the SED at pH = 2.6. Since the COF powders were hydrophobic, polyethylene glycol (molecular weight ∼5800) was used as an additive to ensure a stable dispersion (Fig. S9a†). Under identical photocatalytic conditions, all the COF powders exhibited photocatalytic HER, with AntTDH displaying the maximum photocatalytic HER rate of 8.4 ± 0.5 mmol g−1 h−1, followed by AntTTH and AntTTF with the rates of 2.8 ± 0.3 and 0.7 ± 0.1 mmol g−1 h−1 respectively (Fig. 3b). This trend in photocatalytic activity, AntTDH > AntTTH > AntTTF, is in line with the visible light harvesting ability in the powder state as evident from Fig. 2c. The photocatalytic activity of AntTDH is comparable to those of the high-performance COFs.20,47 The broad optical absorption and low band gap of AntTDH enhance the photocatalytic activity. Additionally, electrochemical impedance spectroscopy (EIS) was performed to assess the interfacial charge transfer resistance for all the COF powders. The ascending order of the semicircle diameter of the Nyquist plot is as follows: AntTDH < AntTTH < AntTTF (Fig. S10a and b†). The smaller semicircle diameter of AntTDH corresponds to comparatively lower interfacial charge transfer resistance, which is beneficial for the charge carrier migration (Fig. S10b†). The trends in EIS measurements align with the observed photocatalytic hydrogen evolution in the powder state. Moreover, upon light irradiation, the semicircle diameter of the Nyquist plot decreases for all the COFs compared to the dark, indicating photoinduced decrease in charge transfer resistance. Additionally, among all COFs, AntTDH exhibited the highest photocurrent followed by AntTTH and AntTTF (Fig. S10c†), further corroborating their respective photocatalytic performance. Nevertheless, it is crucial to acknowledge that these measurements are highly sensitive to the film quality and sample quantity, hence comparing two distinct films may sometimes yield unreliable results and can be misleading.
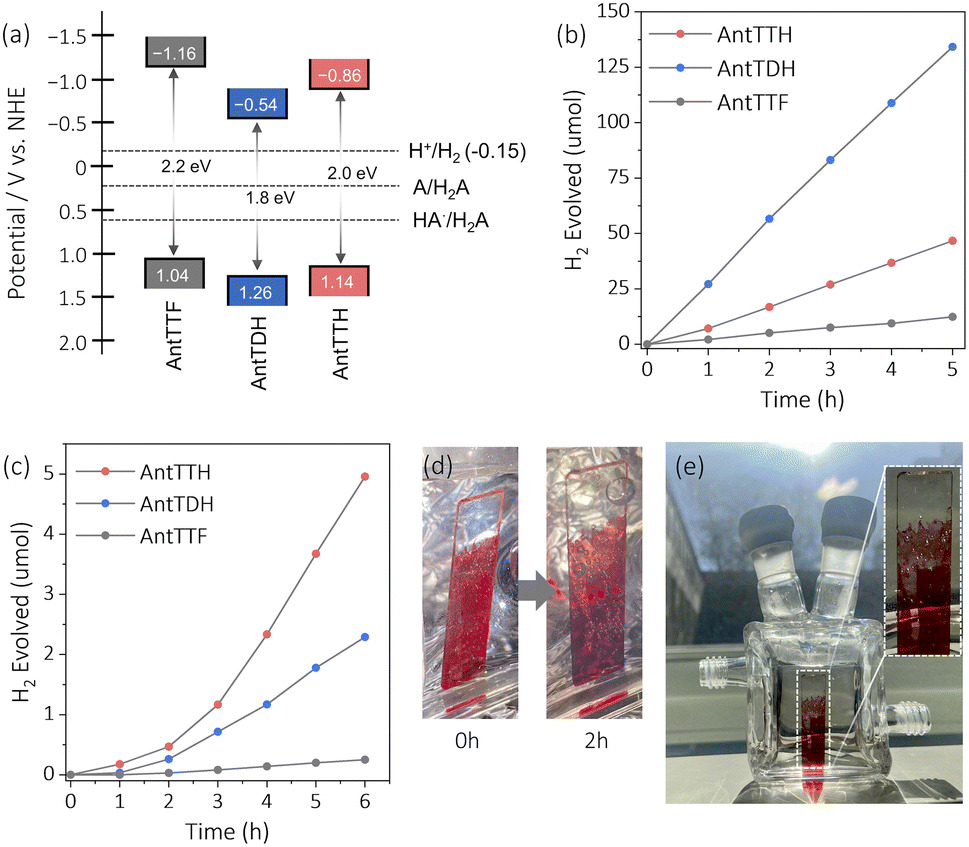 | ||
| Fig. 3 (a) Calculated band position and band gap of the COF powders vs. normal hydrogen electrode (NHE) along with the potential of H+/H2 and oxidation potentials of L-ascorbic acid, HA˙/H2A and A/H2A at pH 2.6. Time course for photocatalytic HER under visible light (≥420 nm) of (b) COF powders (3 mg of COF with 2 wt% Pt) and (c) COF films (with 2 wt% Pt) in 16 mL 0.1 M ascorbic acid aqueous solution at pH 2.6. (d) Photograph of AntTTH film over quartz at different time intervals of photocatalytic reaction showing the formation of H2 gas bubbles. (e) The image of the AntTTH film is illuminated with diffused sunlight inside a photocatalytic reactor with the corresponding enlarged image showing the formation of H2 gas bubbles. | ||
The photocatalytic activity of the COF films, grown on transparent quartz substrates, was evaluated under visible light (≥420 nm, 300 W) using identical photocatalytic conditions using Pt co-catalyst and AA as the SED at pH = 2.6. These COF films were submerged vertically in the photocatalytic reactor and illuminated from the front side (Fig. S9b†). To compare the photocatalytic activity in the film state, the amount of H2 evolved was divided by the respective optical density at the absorption maximum of the respective COF films. Judging from Fig. 3c, the COF films showed a relatively longer induction period for the deposition of the Pt co-catalyst compared to the powder form. The films of AntTTH exhibited the maximum rate of photocatalytic HER of 1.6 ± 0.2 mmol m−2 h−1 followed by AntTDH and AntTTF with a rate of 0.7 ± 0.1 and 0.07 mmol m−2 h−1 respectively. After irradiating for 2 h, visually noticeable H2 gas bubbles were observed (Fig. 3d), which increased in size over time and eventually dissipated from the COF film surface (ESI Video†). Notably, even under the diffused sunlight which is much lower in intensity compared to the 300 W xenon lamp, the formation of H2 gas bubbles was observed after 2 h of light irradiation for the AntTTH COF film (Fig. 3e). The trend in photocatalytic activity of the films differs compared to the powders and follows the order AntTTH > AntTDH > AntTTF. However, in both cases β-ketoenamine linked intramolecular H-bonded COFs demonstrated higher photocatalytic activity compared to the purely imine-linked AntTTF. In order to assess the photostability of the COFs, PXRD, FT-IR and XPS measurements were conducted after 24 hours of photocatalysis on both powder and film samples. AntTTH and AntTDH were chosen as representatives, given their high photocatalytic activity among other COFs. The PXRD results suggest a partial loss of crystallinity for both the films and powders after the photocatalysis compared to their pristine state (Fig. S11†), a common occurrence for most COF photocatalysts. The FT-IR spectra remain identical before and after photocatalysis, affirming the retention of the chemical structure (Fig. S12†). Furthermore, no significant shift in the binding energy of N 1s in XPS spectra before and after the photocatalysis confirms the chemical stability (Fig. S13†). Additionally, the presence of metallic platinum after the photocatalysis, confirmed by XPS results, supports the photoreduction of the platinum salt by COF (Fig. S13†). Overall, both COFs display good photochemical stability in the film as well as in the powder state, rendering them recyclable and suitable for practical applications.
To elucidate the reasons behind the observed trends in photocatalytic activity for both the powder and film states, we conducted electron paramagnetic resonance (EPR) spectroscopy and flash photolysis time-resolved microwave conductivity (FP-TRMC).25,28 The FP-TRMC is an electrodeless method to probe the intrinsic photoconductivity, expressed as ϕΣμ, where ϕ and Σμ correspond to the charge carrier generation quantum yield and the total charge carrier mobilities respectively.48 In the case of COF powders, the high photocatalytic activity of AntTDH may be attributed to the combined effects of broad absorption, low band gap and J-type aggregate formation, which is known to facilitate long-range exciton migration, as reported in the literature.46 To probe the exciton migration, EPR spectrum was recorded for the Pt loaded COF powders under light and in the dark, where the Pt/COF heterojunction may aid the dissociation of the excitons into free charge carriers. Negligible EPR signals were observed in the dark for all the Pt-loaded COF powders, however, the signal intensified upon visible light irradiation (Fig. 4a). The maximum signal intensity was observed for AntTDH followed by AntTTH and AntTTF, aligning with the photocatalytic activity trend observed in the powder state. However, pristine COF powders showed a small increase in EPR signal in light compared to the dark indicating the low charge separation without Pt (Fig. S14a†). Based on these experimental results, a mechanism for the photocatalytic proton reduction of COF powders can be proposed, which includes photoexcitation, exciton generation, migration, dissociation and transfer to the co-catalyst followed by proton reduction (Fig. 4b).49 However, it is important to note that this mechanism may not be generalized for all COF photocatalysts. In the film state, despite AntTTH and AntTDH exhibiting similar optical absorption and band gap, AntTTH displayed two-fold photocatalytic activity compared to AntTDH. In order to explain this, FP-TRMC measurements were performed on the COF films. Notably, AntTTH exhibited relatively high photoconductivity compared to AntTDH and AntTTF, indicating the better charge separation and transport (Fig. 4c). These photoconductivity trends are consistent with the observed photocatalytic activity in the film state. However, low photoconductivity was observed for all the pristine COF powders (Fig. S14b†), probably due to the low charge separation which corroborates with the EPR results. Hence in the film state, it seems plausible that after photoexcitation, excitons generate and separate into the free charge carriers that eventually reach the catalytic centre and reduce the protons (Fig. 4d).
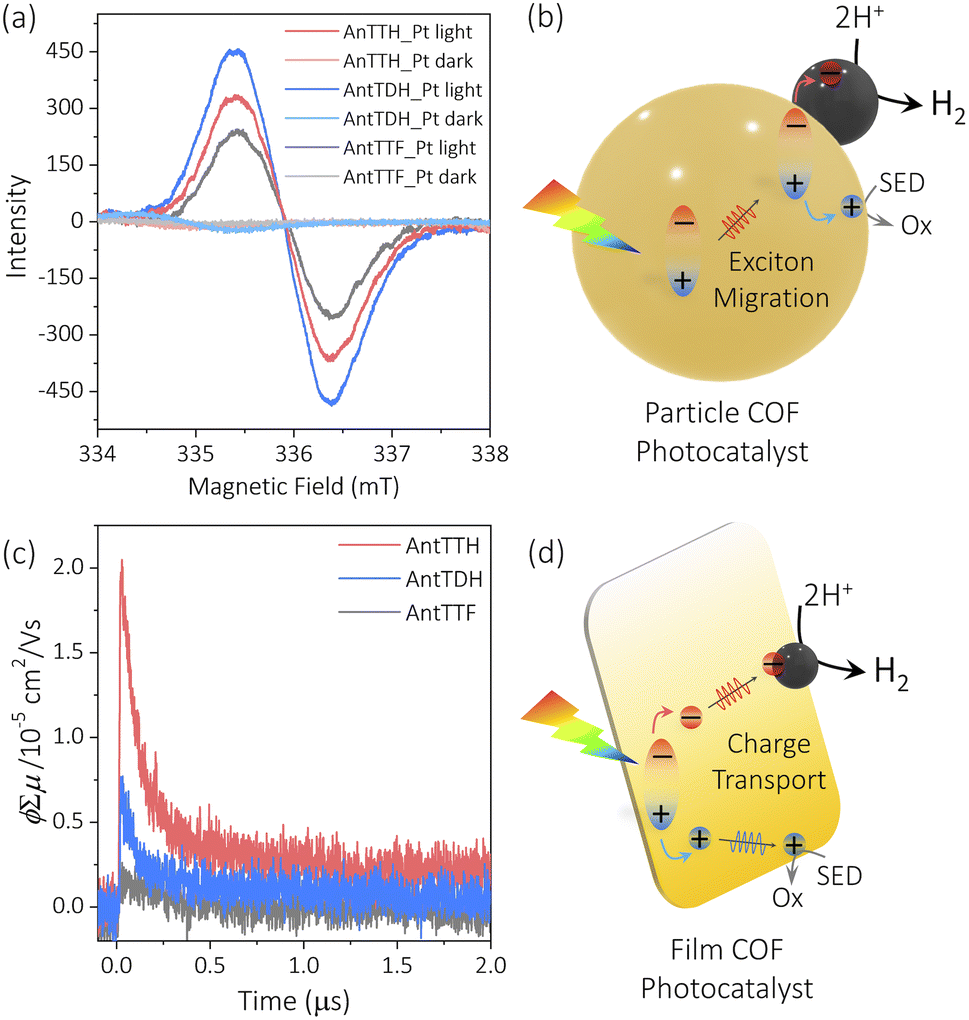 | ||
| Fig. 4 (a) Change in the EPR signal of 2 wt% Pt loaded COF powders under light and in the dark. (c) Photoconductivity transients of COF films under 355 nm laser excitation. Proposed mechanism for the photocatalytic HER in (b) COF particles and (d) COF films. | ||
3. Conclusions
In summary, we have extended the family of π-conjugated anthracene-based COFs, by rational introduction of different number of hydroxy functionalized 1,3,5-triformylbenzene as the linker. With the increasing number of hydroxy functional groups, the photocatalytic HER varies significantly, which could be attributed to the change in band gap, band position and electronic properties. Notably, AntTDH showed strong J-type aggregation in the powder state due to the large molecular dipole moment. In the powder state, the COF having the lowest band gap, AntTDH, exhibited the highest photocatalytic activity, while in the film state, an increasing number of hydroxy functionalization improved the photocatalytic activity. A contrasting difference in mechanism was observed, where exciton migration via J-type aggregates governs the overall photocatalytic activity for the powders, while film state catalysis depends on photoconductivity/charge carrier mobility. This study demonstrates that simultaneous control over band gap and band position is one of the keys to enhance the photocatalytic activity. Furthermore, our work introduces the potential of COF films as a future platform for various practical applications.4. Experimental
4.1 Materials
The compounds, namely, 9,10-bis(4-aminophenylethynyl)anthracene, 2-hydroxy-1,3,5-benzenetricarboxaldehyde, 2,4-dihydroxy-1,3,5-benzenetricarboxaldehyde, and 2,4,6-trihydroxy-1,3,5-benzenetricarboxaldehyde were synthesized according to literature procedures33,36 and characterized using mass, 1H and 13C NMR spectroscopies. The chemical 1,3,5-benzenetricarboxaldehyde and other reagents and solvents were purchased from different commercial suppliers and utilized without further purification.4.2 Synthesis of COF powders
AntT (60.0 mg, 0.147 mM, 3 equiv.) and TF (15.8 mg, 0.098 mM, 2 equiv.)/MH (17.4 mg, 0.098 mM, 2 equiv.)/DH (19.0 mg, 0.098 mM, 2 equiv.)/TH (20.6 mg, 0.098 mM, 2 equiv.) were taken in a 15 mL Pyrex reaction tube (o.d. × i.d. = 12 × 10 mm2 and a length of 15 cm); subsequently, mesitylene (3 mL) and 1,4-dioxane (3 mL) were added as the solvents. In order to have a homogeneous dispersion, the reaction mixture was sonicated for 15 minutes, followed by addition of aqueous acetic acid (0.6 mL, 6 M) and further sonicated for 10 minutes. Three freeze–pump–thaw cycles were performed at 77 K (liquid N2 bath) to degas the reaction mixture. The tube was then flame-sealed off and placed in a sand bath kept at 120 °C for 3 days (for AntTTF & AntTMH) and 7 days (for AntTDH & AntTTH) inside an oven. After cooling to room temperature, the precipitate was collected by filtration and washed repeatedly with N,N-dimethylacetamide (DMAC), methanol, acetone, and dichloromethane (DCM). To ensure complete removal of the building blocks, the precipitate was subjected to Soxhlet extraction using acetone as the solvent for 12 h. Finally, the precipitate was dried at 100 °C under reduced pressure.4.3 Synthesis of COF films over quartz
AntT (10.0 mg, 0.024 mM, 3 equiv.) and TF (2.6 mg, 0.016 mM, 2 equiv.)/MH (2.9 mg, 0.016 mM, 2 equiv.)/DH (3.1 mg, 0.016 mM, 2 equiv.)/TH (3.4 mg, 0.016 mM, 2 equiv.) were taken in a 15 mL Pyrex reaction tube (o.d. × i.d. = 12 × 10 mm2 and a length of 15 cm); subsequently mesitylene (4 mL) and 1,4-dioxane (1 mL) were added as the solvent. In order to have a homogeneous dispersion, the reaction mixture was sonicated for 15 minutes, followed by addition of aqueous acetic acid (0.5 mL, 5 M) and further sonicated for 5 minutes. Afterward, a transparent quartz substrate (height × width = 40 × 9 mm) was submerged vertically into the reaction mixture. To degas the reaction mixture, three freeze–pump–thaw cycles were performed at 77 K (liquid N2 bath). The tube was flame sealed off and placed in a sand bath kept at 120 °C for 3 days (for AntTTF & AntTMH) and 7 days (for AntTDH & AntTTH) inside an oven. After cooling to room temperature, the COF film was collected and washed repeatedly with N,N-dimethylacetamide (DMAC), methanol, acetone, and dichloromethane (DCM), to remove the building blocks completely. Finally, the COF film was dried under ambient conditions.4.4 Characterization
The solution state 1H and 13C NMR spectra were acquired in various deuterated solvents using TMS (0 ppm for 1H) or CDCl3 (77 ppm for 13C) as an internal standard, and recorded on a Bruker Avance II 200 (1H: 200 MHz; 13C: 50 MHz) spectrometer. 13C solid state NMR (cross-polarization magic-angle spinning (CP/MAS)) spectra were recorded on a Bruker range Avance 400 MHz solid state spectrometer operating at 100.6 MHz, equipped with a Bruker 4 mm double resonance probe-head operating at a spinning rate of 10 kHz. Fourier-Transform Infrared (FT-IR) spectra were recorded on a JASCO FT-IR 4700 instrument. Solid COF samples were directly placed in a germanium cell and attenuated total reflectance (ATR) was measured for 512 scans. Raman spectra of all the COFs were recorded on a JASCO NRS-4100 Confocal Raman Microscope. Solid COF samples (as pellets) or films were placed over quartz substrates and 532 nm laser was used and averaged with 1024 scans. Powder X-ray diffraction (PXRD) measurements were carried out on a Bruker D8 Advance diffractometer in reflection geometry, operating with a Cu Kα anode (λ = 1.54178 Å) operating at 40 kV and 40 mA. Samples were ground and mounted as loose powders onto a low background Si sample holder. Nitrogen sorption measurements were performed at 77 K using an Autosorb-iQ-MP and prior to the analysis the samples were dried and degassed at 120 °C for 12 h. Using the N2 adsorption isotherms, the surface areas were calculated over a pressure range of 0.01–0.9 = p/p0 using Brunauer–Emmett–Teller (BET) methods. Solid state diffuse reflectance and film state ultraviolet-visible spectroscopy (UV-Vis) spectra were recorded on a Varian Cary 300 UV-Vis spectrophotometer. Electron paramagnetic resonance (EPR) spectra were measured at room temperature under ambient conditions using a JEOL JES-FA200 X-band spectrometer. To understand the effect of light, COF powders were taken in an EPR tube and excited with a focused xenon lamp. The morphology was analysed using scanning electron microscopy (SEM), performed on an S-2700 scanning electron microscope (Hitachi, Tokyo, Japan). Photoelectron Yield Spectroscopy (PYS) measurements were carried out in a Bunko Keiki BIP-KV202GD instrument.4.5 Flash photolysis time-resolved microwave conductivity
The photoconductivity was evaluated using the FP-TRMC measurement under ambient conditions. Transient charge carriers were generated through photoexcitation by laser pulses of the third harmonic generation (λ = 355 nm) from a Spectra Physics INDI-HG Nd:YAG laser with a pulse duration of 5–8 ns at a photon density of 9.1 × 10¹⁵ photon per cm2. The frequency and power of the probe microwave were set at around 9.1 GHz and 3 mW, respectively, so that the electric field of the microwave was sufficiently small and did not perturb the motion of charge carriers.4.6 Photocatalytic hydrogen production
All the photocatalytic reactions were conducted in a two-neck 32 mL side irradiation quartz reactor having a circulation system to maintain the temperature. In the case of COF powders, 3 mg COF powder was physically mixed by grinding with 3 mg PEG (molecular weight ∼5800) and dispersed in 16 mL of 0.1 M L-ascorbic acid via sonication. Subsequently, 2 μl of H2PtCl6 aqueous solution (8 wt%) was added and briefly sonicated and transferred into the reactor, while the COF films grown over the quartz substrate were submerged vertically in a reactor containing 16 mL of 0.1 M L-ascorbic acid and the required amount of H2PtCl6 aqueous solution (8 wt%) was added. Prior to irradiation, the reactor was sealed with rubber stoppers and degassed using argon for 15 minutes. After that, the reactor was irradiated with a 300 W Xe lamp (L. O. T. – Quantum Design) with 420 nm long pass filters. Throughout the reaction, the temperature of the system was maintained at 20 °C by water circulation. The gas sample was collected manually from the headspace using gas tight syringes and H2 was quantified by gas chromatography (FULI Instruments, GC9790 II(PLF-01)) equipped with a thermal conductivity detector.4.7 Electrochemical measurements
Electrochemical impedance spectra (EIS) and transient photocurrent were measured using a GAMRY Instruments Potentiostat/Galvanostat/ZRA in a standard three electrode configuration. A homogeneous suspension of respective COFs was prepared by dispersing 5 mg COF powders in 1 mL isopropanol and 5 μL Nafion (5 wt% Nafion in isopropanol) was added as an additive and the mixture was mechanically grounded followed by sonication for 10 minutes. The working electrodes were prepared by spreading a 100 μL homogeneous suspension over the surface of a fluorine-doped tin oxide (FTO) glass substrate and then dried at 50 °C over hot plates. A mixture of 0.5 M Na2SO4 and 0.1 M ascorbic acid aqueous solution (pH ∼2.6) was used as the electrolyte and purged with argon for 5 min prior to the measurement. The EIS and transient photocurrent measurements were performed in the dark and in light using a Lumatec Superlite (400–700 nm).Author contributions
S. G. conceived the project, performed the experiments and wrote the manuscript with the support of S. S. and A. T. S. G. designed, synthesized and characterized the COFs. V. W. performed the solid-state 13C CP-MAS NMR and V. D. conducted FT-IR, XPS and electrochemical analysis. Photocatalysis and SEM measurements were performed together by S. G. and H. K. R. P. P. and S. S. carried out the Raman, EPR and TRMC measurements.Conflicts of interest
There are no conflicts to declare.Acknowledgements
The present work is financially supported by Deutsche Forschungsgemeinschaft (DFG, German Research Foundation) under Germany's Excellence Strategy – EXC 2008 – 390540038 – UniSysCat and within the project TH 1463/18-1. The authors are furthermore grateful to the BMBF (Fördermaßnahme CO2 WIN, Förderkennzeichen 033RC02–4PRODIGY). S. G. sincerely acknowledges the Alexander von Humboldt Foundation for the postdoctoral fellowship. The authors thank Maria Unterweger and Christina Eichenauer for the PXRD and surface area measurements respectively. It is our pleasure to thank Dr Hajime Suzuki from Kyoto University for performing PYS measurements. Dr Michael Traxler, Dr Julia Grüneberg, Dr Jin Yang, Dr Jérôme Roeser and Dr Johannes Schmidt are acknowledged for their general help and fruitful scientific discussions. S. G. is thankful to the facility of the Supercomputer System, Institute for Chemical Research, Kyoto University, Japan. H. K. thanks the Einstein Center for Catalysis/Berlin International Graduate School for Natural Science and Engineering for funding.References
- Q. Schiermeier, J. Tollefson, T. Scully, A. Witze and O. Morton, Nature, 2008, 454, 816–823 CrossRef CAS.
- N. S. Lewis, Science, 2016, 351, aad1920 CrossRef PubMed.
- K. Maeda and K. Domen, J. Phys. Chem. Lett., 2010, 1, 2655–2661 CrossRef CAS.
- A. Kudo and Y. Miseki, Chem. Soc. Rev., 2009, 38, 253–278 RSC.
- Z. Xie, D. Chen, J. Zhai, Y. Huang and H. Ji, Appl. Catal., B, 2023, 334, 122865 CrossRef CAS.
- Y. Wang, D. Chen, J. Zhang, M. S. Balogun, P. Wang and Y. Huang, Adv. Funct. Mater., 2022, 32, 2112738 CrossRef CAS.
- X. Lu, K. h Ye, S. Zhang, J. Zhang, J. Yang, Y. Huang and H. Ji, Chem. Eng. J., 2022, 428, 131027 CrossRef CAS.
- Y. Wang, H. Suzuki, J. Xie, O. Tomita, D. J. Martin, M. Higashi, D. Kong, R. Abe and J. Tang, Chem. Rev., 2018, 118, 5201–5241 CrossRef CAS PubMed.
- X. P. Tao, Y. Zhao, S. Y. Wang, C. Li and R. G. Li, Chem. Soc. Rev., 2022, 51, 3561–3608 RSC.
- Y. Bai, K. Hippalgaonkar and R. S. Sprick, J. Mater. Chem. A, 2021, 9, 16222–16232 RSC.
- X. Wang, K. Maeda, A. Thomas, K. Takanabe, G. Xin, J. M. Carlsson, K. Domen and M. Antonietti, Nat. Mater., 2009, 8, 76–80 CrossRef CAS.
- C. B. Meier, R. Clowes, E. Berardo, K. E. Jelfs, M. A. Zwijnenburg, R. S. Sprick and A. I. Cooper, Chem. Mater., 2019, 31, 8830–8838 CrossRef CAS.
- N. Chaoui, M. Trunk, R. Dawson, J. Schmidt and A. Thomas, Chem. Soc. Rev., 2017, 46, 3302–3321 RSC.
- G. B. Wang, S. Li, C. X. Yan, F. C. Zhu, Q. Q. Lin, K. H. Xie, Y. Geng and Y. B. Dong, J. Mater. Chem. A, 2020, 8, 6957–6983 RSC.
- C. S. Diercks and O. M. Yaghi, Science, 2017, 355, aal1585 CrossRef.
- K. Geng, T. He, R. Liu, S. Dalapati, K. T. Tan, Z. Li, S. Tao, Y. Gong, Q. Jiang and D. Jiang, Chem. Rev., 2020, 120, 8814–8933 CrossRef CAS.
- H. Chen, H. S. Jena, X. Feng, K. Leus and P. Van Der Voort, Angew. Chem., 2022, 61, e202204938 CrossRef CAS.
- X. Zhao, P. Pachfule and A. Thomas, Chem. Soc. Rev., 2021, 50, 6871–6913 RSC.
- H. Wang, H. Wang, Z. Wang, L. Tang, G. Zeng, P. Xu, M. Chen, T. Xiong, C. Zhou, X. Li, D. Huang, Y. Zhu, Z. Wanga and J. Tang, Chem. Soc. Rev., 2020, 49, 4135–4165 RSC.
- K. Prakash, B. Mishra, D. D. Díaz, C. M. Nagaraja and P. Pachfule, J. Mater. Chem. A, 2023, 11, 14489–14538 RSC.
- N. Keller and T. Bein, Chem. Soc. Rev., 2021, 50, 1813–1845 RSC.
- M. Traxler, S. Reischauer, S. Vogl, J. Roeser, J. Rabeah, C. Penschke, P. Saalfrank, B. Pieber and A. Thomas, Chem. – Eur. J., 2023, 29, e2022029 CrossRef PubMed.
- Y. Chen, X. Luo, J. Zhang, L. Hu, T. Xu, W. Li, L. Chen, M. Shen, S.-B. Ren, D.-M. Han, G.-H. Ning and D. Li, J. Mater. Chem. A, 2022, 10, 24620–24627 RSC.
- T. Banerjee, K. Gottschling, G. Savasci, C. Ochsenfeld and B. V. Lotsch, ACS Energy Lett., 2018, 3, 400–409 CrossRef CAS PubMed.
- S. Ghosh, A. Nakada, M. A. Springer, T. Kawaguchi, K. Suzuki, H. Kaji, I. Baburin, A. Kuc, T. Heine, H. Suzuki, R. Abe and S. Seki, J. Am. Chem. Soc., 2020, 142, 9752–9762 CAS.
- Q. Wang and K. Domen, Chem. Rev., 2020, 120, 919–985 CrossRef CAS.
- P. Zhou, I. A. Navid, Y. Ma, Y. Xiao, P. Wang, Z. Ye, B. Zhou, K. Sun and Z. Mi, Nature, 2023, 613, 66–70 CrossRef CAS.
- J. Yang, S. Ghosh, J. Roeser, A. Acharjya, C. Penschke, Y. Tsutsui, J. Rabeah, T. Wang, S. Y. Djoko Tameu, M.-Y. Ye, J. Grüneberg, S. Li, C. Li, R. Schomäcker, R. Van De Krol, S. Seki, P. Saalfrank and A. Thomas, Nat. Commun., 2022, 13, 6317 CrossRef CAS.
- M. Schröder, K. Kailasam, J. Borgmeyer, M. Neumann, A. Thomas, R. Schomäcker and M. Schwarze, Energy Technol., 2015, 3, 1014–1017 CrossRef.
- X. Hu, Z. Zhan, J. Zhang, I. Hussain and B. Tan, Nat. Commun., 2021, 12, 6596 CrossRef CAS.
- D. J. Woods, S. A. J. Hillman, D. Pearce, L. Wilbraham, L. Q. Flagg, W. Duffy, I. McCulloch, J. R. Durrant, A. A. Y. Guilbert, M. A. Zwijnenburg, R. S. Sprick, J. Nelson and A. I. Cooper, Energy Environ. Sci., 2020, 13, 1843–1855 RSC.
- M. Levitus and M. A. Garcia-Garibay, J. Phys. Chem. A, 2000, 104, 8632–8637 CrossRef CAS.
- S. Ghosh, Y. Tsutsui, T. Kawaguchi, W. Matsuda, S. Nagano, K. Suzuki, H. Kaji and S. Seki, Chem. Mater., 2022, 34, 736–745 CrossRef CAS.
- S. Kandambeth, A. Mallick, B. Lukose, M. V. Mane, T. Heine and R. Banerjee, J. Am. Chem. Soc., 2012, 134, 19524–19527 CrossRef CAS.
- S. Kandambeth, K. Dey and R. Banerjee, Covalent Organic Frameworks: Chemistry beyond the Structure, J. Am. Chem. Soc., 2018, 141, 1807–1822 CrossRef PubMed.
- M. Traxler, S. Gisbertz, P. Pachfule, J. Schmidt, J. Roeser, S. Reischauer, J. Rabeah, B. Pieber and A. Thomas, Angew. Chem., Int. Ed., 2022, 61, e202117738 CrossRef CAS.
- H. Wang, C. Qian, J. Liu, Y. Zeng, D. Wang, W. Zhou, L. Gu, H. Wu, G. Liu and Y. Zhao, J. Am. Chem. Soc., 2020, 142, 4862–4871 CrossRef CAS.
- X. Li, Q. Gao, J. Aneesh, H.-S. Xu, Z. Chen, W. Tang, C. Liu, X. Shi, K. V. Adarsh, Y. Lu and K. P. Loh, Chem. Mater., 2018, 30, 5743–5749 CrossRef CAS.
- N. N. Xia, M. Z. Rong and M. Q. Zhang, J. Mater. Chem. A, 2016, 4, 14122–14131 RSC.
- K. Wang, Y. Zhong, W. Dong, Y. Xiao, S. Ren and L. Li, Angew. Chem., Int. Ed., 2022, 61, e202304611 Search PubMed.
- F. Wurthner, T. E. Kaiser and C. R. Saha-Moller, Angew. Chem., Int. Ed., 2011, 50, 3376–3410 CrossRef PubMed.
- S. Ghosh, S. Cherumukkil, C. H. Suresh and A. Ajayaghosh, Adv. Mater., 2017, 1703783 CrossRef.
- N. Keller, M. Calik, D. Sharapa, H. R. Soni, P. M. Zehetmaier, S. Rager, F. Auras, A. C. Jakowetz, A. Görling, T. Clark and T. Bein, J. Am. Chem. Soc., 2018, 140, 16544–16552 CrossRef.
- Y. Yagita and K. Matsui, J. Lumin., 2015, 161, 437–441 CrossRef CAS.
- N. J. Hestand and F. C. Spano, Chem. Rev., 2018, 118, 7069–7163 CrossRef CAS.
- A. V. Sorokin, I. I. Filimonova, R. S. Grynyov, G. Y. Guralchuk, S. L. Yefimova and Y. V. Malyukin, J. Phys. Chem. C, 2010, 114, 1299–1305 CrossRef CAS.
- L. -J. Wang, P. -Y. Dong, G. Zhang and F. -M. Zhang, Energy Fuels, 2023, 37, 6323–6347 CrossRef CAS.
- S. Seki, A. Saeki, T. Sakurai and D. Sakamaki, Phys. Chem. Chem. Phys., 2014, 16, 11093–11113 RSC.
- F. Liu, Y. He, X. Liu, Z. Wang, H.-L. Liu, X. Zhu, C.-C. Hou, Y. Weng, Q. Zhang and Y. Chen, ACS Catal., 2022, 12, 9494–9502 CrossRef CAS.
Footnote |
| † Electronic supplementary information (ESI) available. See DOI: https://doi.org/10.1039/d3ta04552h |
| This journal is © The Royal Society of Chemistry 2024 |