 Open Access Article
2-Methylfuran from pinewood by molten-salt hydropyrolysis and catalytic hydrogenation of the furfural intermediate†
Adriana Estrada
León‡
 *a,
Leidy Marcela
Ulloa-Murillo‡
b,
Stef
Ghysels
 a,
Daniel
Nowakowski
 c,
Wolter
Prins
a and
Frederik
Ronsse
a
aThermochemical Conversion of Biomass Research Group, Department of Green Chemistry and Technology, Ghent University, Coupure Links 653, 9000, Belgium. E-mail: Adriana.EstradaLeon@UGent.be
bDepartment of Agro-Environmental Chemistry and Plant Nutrition, Faculty of Agrobiology, Food and Natural Resources, Czech University of Life Sciences Prague, Kamycká 129, Prague 165 00, Czech Republic
cBioenergy Research Group, European Bioenergy Research Institute, Aston University, Birmingham B4 7ET, UK
First published on 13th May 2024
Abstract
This study explores the production pathway of 2-methylfuran (MF) renewable fuels by integrating molten salt hydropyrolysis of lignocellulosic biomass for furfural generation and subsequent catalytic hydrodeoxygenation of furfural to MF in the vapour phase using copper-based catalysts. In response to the increasing demand for biofuels, where bioethanol-blended gasoline dominates, MF presents itself as a promising fuel additive with improved fuel characteristics. This work focuses on optimizing MF production from pine wood pyrolysis using an innovative reaction environment, being chloride molten salts, eliminating the need for biomass fractionation. Employing a tandem micro-reactor and evaluating two Cu-based catalysts, Cu/SiO2 and Cu/activated carbon (Cu/AC), the study aims to identify optimal conditions for MF production in this integrated process. The process demonstrated selective furfural production in the first step, with subsequent high-yield conversion to 2-methylfuran (up to 92% selectivity) using Cu/AC. Optimal hydrodeoxygenation occurred at 400–500 °C, yielding approximately 10.3 wt% of 2-methylfuran on a dry pinewood basis. Cu/AC outperformed Cu/SiO2 due to higher copper loading and dispersion. Notably, chloromethane, a byproduct from molten salt hydropyrolysis, was removed entirely during hydrodeoxygenation with Cu/AC. The study outlined conditions for an in situ conversion route from pinewood to furfural and 2-methyl furan in the vapour phase.
Introduction
The use of petrol fuels blended with biofuels in motor vehicles with gasoline engines has taken a major market share especially in the EU and US, with the aim to reduce their greenhouse gas emissions. In the US for instance, gasoline blended with 10% (by volume) bio-ethanol (or E10) accounts for more than 95% of the fuels consumed for vehicles with gasoline engines while in Europe all regular fuel-powered vehicles use either E10 or E5 (with 5% bio-ethanol by volume).1,2In the EU, E10 fuel has a market share (2023) above 70% in most countries and a move to increase the bio-ethanol volume to 20% (E20 fuel) is being considered.2,3 Higher gasoline–ethanol blends are also available in the market, such as E85 (containing 51% to 83% bio-ethanol) or ED95 (95% ethanol) which are used specifically in flex-fuel vehicles and in designated heavy-duty engines respectively.4,5 Importantly, in the EU no more petrol or diesel cars and light duty vehicles will be sold after 2035 to reach climate neutrality goals by 20505 which means that their fuel demand will gradually decrease. Conversely, in other countries like Brazil, blended fuel demand is expected to grow; in this country the current regulation for ethanol blending with petrol stands at 27% (or E27).6
Now, bio-ethanol is mainly produced from food crops (1st generation) like wheat and sugar beets (EU), maize (US) and sugar cane (Brazil). Bio-ethanol from sugarcane bagasse is also currently produced at the commercial scale by the Brazilian company Raizen.7 Bio-ethanol however, is no longer the only renewable fuel candidate considered for blended petrol fuels. An extensive review has shown the technical potential of 2-methylfuran (MF) as a novel renewable fuel to replace bio-ethanol in petrol blends.3 Some physicochemical properties of MF, bio-ethanol and gasoline are compared in Table 1.
| Parameter | Gasoline | Bio-ethanol | 2-Methylfuran |
|---|---|---|---|
| Chemical formula | C4H10–C12H26 | C2H6O | C5H6O |
| RON | 94.2 | 109 | 103 |
| Gravimetric oxygen content (wt%) | 0 | 34.7 | 19.5 |
| Lower heating value, LHV (MJ kg−1) | 43.9 | 26.8 | 31.2 |
| Latent heat of vaporization (kJ kg−1) | 349 | 919.6 | 358.4 |
Just like bio-ethanol, MF has a higher research octane number (RON) than gasoline, enabling gasoline-blended fuels to reach higher thermal efficiencies in internal combustion engines (through higher compression ratios).8 With respect to the energy density, MF has a higher lower heating value (LHV) than bio-ethanol which also makes it attractive as a fuel additive.
Regarding the latent heat of vaporization (an important factor for the internal combustion engine performance), MF outperforms bio-ethanol because of the much lower latent heat requirements. Generally, MF has been found to be suitable for both spark ignition and compression ignition engines when used in blends at a ratio < 20%.9 Because of the properties, research regarding MF production from bio-based furfural has grown considerably over the last decade.
In current MF production pathways, furfural is first hydrogenated and forms furfuryl alcohol as an intermediate product; subsequently this intermediate undergoes hydrogenolysis to form MF.15 For the hydrodeoxygenation of furfural to MF in the gas or liquid phase, different metal-based catalysts have been previously investigated. Because of the scarcity and cost of noble-metal catalysts, a shift to more abundant and cheap transition-metal based catalysts occurs in furfural hydrogenation research.
Among these, copper-based catalysts are favoured (Table 2) mainly for the production of MF, but also for furfuryl alcohol and cyclopentanone production.16 This is because copper-based catalysts have a lower hydrogenating capacity, which limits the C–C ring cleavage and promotes the formation of furfuryl alcohol and MF.17
| Phase | Solvent | Gas | Pressure (MPa) | Temp. (°C) | Time (h) | Catalyst | MF selectivitya (%) | MF yield (wt%) | Ref. |
|---|---|---|---|---|---|---|---|---|---|
| a Based on furfural input. | |||||||||
| Vapor | NA | H2 | 0.1 | 210 | 5 | 10% Cu/mesoporous silica | ca. 95 | ca. 90 | 17 |
| NA | H2 | 0.1 | 210 | 1 | 10% Cu/SiO2 | ca. 58 | ca. 1.8 | 17 | |
| NA | H2 | 0.1 | 220 | — | 23% Cu/SiO2 | 89.5 | 89.5 | 20 | |
| Liquid | 2-Propanol | N2 | 2.04 | 180 | 10 | Ru/carbon | 64 | 61 | 21 |
| 2-Propanol | N2 | — | 220 | 4 | 10Cu–3Pd/ZrO2 | 62 | 62 | 22 | |
| 2-Propanol | N2 | — | 220 | 4 | 10Cu–3Pd/SiO2 | 35 | 35 | 22 | |
| 2-Propanol | N2 | 2 | 180 | 5 | 17% Cu/activated carbon | ca. 80 | ca. 80 | 23 | |
| 2-Propanol | H2 | 4 | 230 | 2 | 5/5% CuNi/carbon foam | 53 | 48 | 24 | |
Regarding the reaction phase of furfural conversion to MF, vapor-phase processes appear more suitable in terms of MF selectivity. Besides, less harsh conditions are required. Vapor-phase furfural hydrodeoxygenation proceeds mainly at atmospheric pressure, whereas liquid-phase processes require at least 2 MPa of pressure, alongside a longer time-on-stream.
During catalytic hydrodeoxygenation of furfural, small amounts of furan via furfural decarbonylation are also produced, since this reaction is thermodynamically possible at temperatures above 250 °C.17,18 Although traces of tetrahydrofurfuryl alcohol have also been reported as a side-product of furfuryl alcohol ring hydrogenation, the latter reaction is less likely to occur.17,18 Pino et al. showed that once furfuryl alcohol is formed via furfural hydrogenation, the hydrogenolysis path to produce MF is favored kinetically and thermodynamically, compared to the ring hydrogenation towards tetrahydrofurfuryl alcohol.18
Although the literature regarding MF production from lignocellulosic biomass-derived furfural is vast, the various steps involved in the conversion process are always studied separately. In other words, recovery yields of furfural from biomass (through different mechanisms like hydrolysis) have been reported on the one hand, while bio-based furfural conversion rates and MF selectivity have been studied on the other hand. Hence, it is not possible to assess the overall MF yield that can be achieved in practice from a continuous process based on these individual studies. Theoretically though, considering that the yield of furfural from corncob hydrolysis is 47.6%19 and that furfural hydrogenation yields ca. 90% of MF at best (Table 2), an overall MF yield of 42.84% could be achieved.
Among the different biological and thermochemical processes used for the conversion of biomass to end-products or intermediate chemicals, thermochemical processing of biomass in a molten salt has become an interesting technological route, in particular in the field of fast pyrolysis. This is because in fast pyrolysis, the molten salt bath can be used as a heat carrier, solvent and catalyst.25 It is the catalytic activity in biomass conversion that makes the use of molten salts appealing when targeting a narrow spectrum of intermediates or end-products rather than a wide range of different condensable compounds, which is the typical profile obtained in bio-oil from ordinary biomass fast pyrolysis. In that sense, chloride molten salts are an interesting choice for a molten salt medium since these are known to be highly catalytic eutectic mixtures, especially when ZnCl2 is one of the salt constituents. ZnCl2, which is a Lewis acid, is known to lower the decomposition temperature of biomass and significantly alter the pyrolysis product distribution.26
Fast (hydro)pyrolysis of lignocellulosic biomass in the presence of chloride molten salts has shown that the product stream is rich in furfural with very few lignin derivatives.27 This can be considered an advantageous process to produce MF because the furfural-rich vapours from molten salt pyrolysis of biomass could be catalytically hydrotreated in the vapor phase, without otherwise requiring biomass fractionation to extract furfural. Particularly, among the different types of lignocellulosic biomass at our disposal to research, pinewood stands as a good alternative for exploring the approach previously highlighted, given its high volatile matter content (85 wt%) and low ash (0.55 wt%) content.
Fast (hydro)pyrolysis of lignocellulosic biomass using chloride molten salts composed of a ZnCl2![[thin space (1/6-em)]](https://www.rsc.org/images/entities/char_2009.gif) :
:![[thin space (1/6-em)]](https://www.rsc.org/images/entities/char_2009.gif) KCl
KCl![[thin space (1/6-em)]](https://www.rsc.org/images/entities/char_2009.gif) :
:![[thin space (1/6-em)]](https://www.rsc.org/images/entities/char_2009.gif) NaCl mixture as a heat transfer and catalytic medium, has shown to give high furfural yields, about 17 wt% under hydrogen and 32 wt% under a helium atmosphere (yields expressed on a feedstock weight basis), at low pressures of 0.4 MPa.15 In our previous study, it was also shown that by increasing the H2 pressure from 0.4 MPa to 1.6 MPa, furfural hydrodeoxygenation to MF was enhanced. However, at 1.6 MPa less furans were formed overall. In this respect and considering MF production, it seems more interesting to conduct molten salt (hydro)pyrolysis of lignocellulosic biomass at low pressures to attain the highest furan yield (mainly furfural) and subsequently hydrotreat the pyrolysis products in the vapor phase using the same pressure to produce MF.
NaCl mixture as a heat transfer and catalytic medium, has shown to give high furfural yields, about 17 wt% under hydrogen and 32 wt% under a helium atmosphere (yields expressed on a feedstock weight basis), at low pressures of 0.4 MPa.15 In our previous study, it was also shown that by increasing the H2 pressure from 0.4 MPa to 1.6 MPa, furfural hydrodeoxygenation to MF was enhanced. However, at 1.6 MPa less furans were formed overall. In this respect and considering MF production, it seems more interesting to conduct molten salt (hydro)pyrolysis of lignocellulosic biomass at low pressures to attain the highest furan yield (mainly furfural) and subsequently hydrotreat the pyrolysis products in the vapor phase using the same pressure to produce MF.
In this framework, this research aims to prove an alternative route to produce MF renewable fuels, by combining two processes: (1) molten salt hydropyrolysis of lignocellulosic biomass to generate furfural and (2) catalytic hydrodeoxygenation of furfural to MF in the vapor phase using Cu-based catalysts. The specific objective is to determine which of the Cu-based catalysts used (Cu/SiO2 and Cu/activated carbon) performs best within this concept, in terms of MF selectivity. A tandem micro reactor was employed to thermally convert biomass to furfural (1st step) to the highest possible degree, and then subsequently convert the furfural to MF (2nd step) in a close-coupled reactor. This study will eventually report the optimal conditions of MF production from pine wood pyrolysis in molten salts, via furfural as an intermediate.
Experimental
Feedstock and chloride molten salts
The lignocellulosic feedstock used in this study was pinewood (Lignocel®). Prior to its use, the feedstock was dried at 105 °C and sieved to a particle size below 100 μm. The characteristics of this feedstock have been previously described.15Zinc(II) chloride (>98%, Sigma-Aldrich), potassium chloride (>98% Sigma-Aldrich) and sodium chloride (>99%, Sigma-Aldrich) were used to prepare an eutectic mixture with a composition of 44.3–41.9–13.8 mol% respectively. The ZnCl2![[thin space (1/6-em)]](https://www.rsc.org/images/entities/char_2009.gif) :
:![[thin space (1/6-em)]](https://www.rsc.org/images/entities/char_2009.gif) KCl
KCl![[thin space (1/6-em)]](https://www.rsc.org/images/entities/char_2009.gif) :
:![[thin space (1/6-em)]](https://www.rsc.org/images/entities/char_2009.gif) NaCl mixture used (named salt B in our previous study) has a melting point of 204 °C.28 For the preparation of salt B, the individual salts were heated to 300 °C for 24 hours in porcelain crucibles. Upon cooling to 105 °C, the dried salts were mixed in their corresponding molar concentration and then stored at 105 °C until further usage. One batch of prepared salt B was used for the whole series of experiments.
NaCl mixture used (named salt B in our previous study) has a melting point of 204 °C.28 For the preparation of salt B, the individual salts were heated to 300 °C for 24 hours in porcelain crucibles. Upon cooling to 105 °C, the dried salts were mixed in their corresponding molar concentration and then stored at 105 °C until further usage. One batch of prepared salt B was used for the whole series of experiments.
Catalyst preparation and characterization
 | (1) |
 | (2) |
| VH2O = (mCu + msup) × IM | (3) |
The weighed Cu(NO3)2·xH2O was then mixed in demineralized water (based on the previously determined IM) and further mixed homogeneously with each support; approximately 3 g of each catalyst was prepared. Next, the copper impregnated supports were dried at 105 °C for at least 12 hours, calcined in a muffle furnace at 550 °C for 4 h (at a rate of 2 °C min−1) and then cooled to 105 °C. Finally, the Cu/SiO2 and Cu/AC catalysts were reduced in a hydrogen atmosphere (99.999%, Air Liquide, Belgium). For this, ca. 300 mg of catalyst was placed in a u-shape glass tube and heated in a ceramic furnace (Goldbrunn); the furnace was supplied by Expondo, Zielona Gora, Poland. The catalysts were heated at 500 °C for 2 hours, employing a heating rate of approx. 2 °C min−1 and a H2 flow rate of 40 mL min−1. The reduced Cu/SiO2 and Cu/AC were stored in glass vials which were flushed with nitrogen gas to prevent oxidation.
SEM-EDX analysis
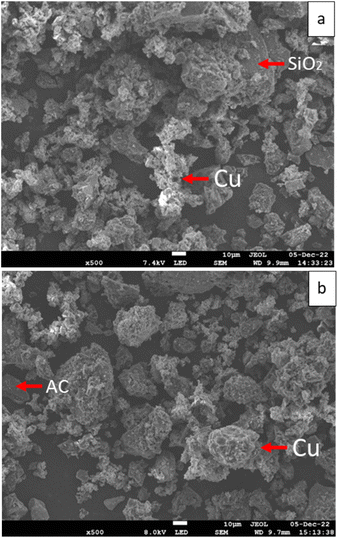
A surface morphology assessment of the Cu-based catalysts was carried using a JEOL 7800F Prime field emission scanning electron microscope (SEM) equipped with an Oxford's Instrument energy dispersive X-ray (EDX) analyzer. Images were taken at 15 kV with 200 to 500 times magnification using the lower electron detector (LED) mode. EDX scanning (elemental mapping) was applied for the following elements: C, O, Al, Si, Ca and Cu. The samples were mounted using SEM carbon tape.SEM scans in Fig. 1 reflect the copper distribution in the catalyst samples (Cu/SiO2 and Cu/AC).
They show that copper was successfully loaded onto both catalyst supports, covering the majority of the support surface. These observations are also seen from the SEM scans with a smaller magnification (between 200 and 350 times) in Fig. S.1 and S.2 in the ESI.†
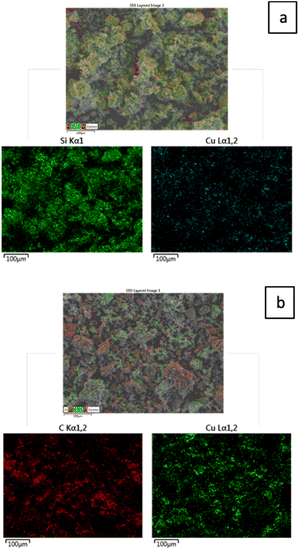
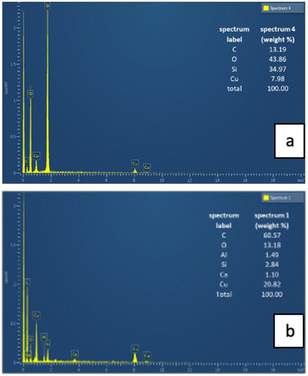
The layered EDX images and extracted spectra of the Cu/SiO2 and Cu/AC catalysts, which show their elemental composition and distribution, are included in Fig. 2 and 3 respectively. These figures first show the composite EDX images containing C, Cu, Si and O elements; then the subsequent images display only the Si and Cu images for the Cu/SiO2 catalyst and, the C and Cu for the Cu/AC catalyst. By comparing the two layered EDX images, it is evident that more copper was loaded on the activated carbon support than on the silica support, potentially making the latter more catalytically active. Moreover, while copper seems more uniformly distributed on the silica support, it appeared to be accumulated at some locations (clustered) on the activated carbon surface. The integrated EDX spectra indeed confirmed that there was more of the loaded metal element (Cu) on the activated carbon support than on the silica support. The spectra showed that the Cu/SiO2 contained C (13.19 wt%), O (43.86 wt%), Si (34.97 wt%) and Cu (7.98 wt%) elements, while Cu/AC contained C (60.57 wt%), O (13.18 wt%), Al (1.49 wt%), Si (2.84 wt%), Ca (1.10 wt%) and Cu (20.82 wt%). The Al, Ca and Si found in Cu/AC could be linked to the nature of activated carbon itself.
ICP-OES analysis
Inductively coupled plasma optical emission spectroscopy (ICP-OES) analysis was used for the quantification of Cu loaded onto the Cu/SiO2 and Cu/AC catalysts. Prior to the analysis, the two Cu-based catalysts were digested using microwave destruction. To this end, 0.1 g of each catalyst was mixed with 2 mL of double distilled water and 10 mL of HNO3 (65% a.r., Chemlab nv, Zedelgem, Belgium). The microwave oven used was an Anton Paar Multiwave 5000, which was heated at a rate of 5 °C min−1 to 200 °C and kept at this temperature for 20 minutes. For the ICP-OES analysis, conducted using a Thermo Scientific system, the digested catalyst samples were diluted up to 20 times in 5% HNO3. The calibration standard curve used to quantify Cu was from 2 to 50 mg kg−1. The analysis was performed in triplicate.In accordance with SEM-EDX, the ICP-OES analysis of the catalysts showed that the mass fraction of copper loaded onto the activated carbon support was higher than the one loaded onto the silica support (Table 3). The Cu mass fraction found in the Cu/SiO2 support was in fact more in line with the intended metal loading (0.17 g g−1). A possible explanation for the higher Cu mass fraction observed in the Cu/AC catalyst may be derived from its preparation method. Previous research by Abdedayem et al. has shown that by using incipient wetness impregnation (as done in this study), there was a collapse in the porosity of activated carbon loaded with cobalt, due to a substantial amount of the metal fixed on the activated carbon surface. This was not observed when cobalt was loaded onto the activated carbon support employing a wetness impregnation method, where the volume of the metal solution used to impregnate the support was 100 times the measured pore volume of the activated carbon.31 It is therefore possible that the incipient wetness impregnation of Cu to activated carbon resulted in a higher than anticipated loading of the metal as well as in a more heterogeneous distribution of the metal.
| Catalyst | Cu mass fraction (wt%) |
|---|---|
| Cu/SiO2 | 14.84 ± 0.28 |
| Cu/AC | 27.79 ± 0.28 |
BET analysis and pore size distribution
Nitrogen adsorption/desorption experiments were performed on a 3P Instrument micropore analyzer from Meritics. Before analysis, the samples were degassed at 180 °C overnight. Pore size distributions were expressed in diameter (nm) and were calculated using the BJH (Barrett–Joyner–Halenda) method. The adsorption/desorption isotherms and the pore size distribution plots of the Cu-based catalysts and their corresponding supports are shown respectively in Fig. S.3 and S.4 of the ESI.†In both Cu-based catalysts, the specific surface area is lower compared to that of the support itself (Table 4), which is expected given the samples became heavier with Cu loading and the deposition of metal could also induce pore blocking. Regarding their porosity, the Cu/SiO2 catalyst can be categorized as mesoporous (2 nm < dp < 50 nm) while Cu/AC is microporous (dp < 2 nm).
| Sample | BET (m2 g−1) | Peak pore size (nm) |
|---|---|---|
| SiO2 | 246 | 12.0 |
| Cu/SiO2 | 182 | 11.4 |
| AC | 1324 | 1.1 |
| Cu/AC | 717 | 1.1 |
XRD analysis
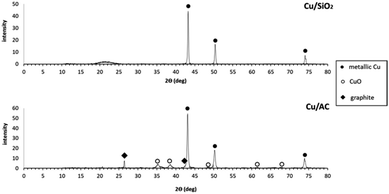
XRD analysis of the Cu-based catalysts was carried out using a Bruker D8 Advance diffractometer with a Cu Kα radiation source (λ = 1.5418 Å) operating at 40 mA and 40 kV. The X-ray intensity data were collected by using a Lynxeye PSD detector in the 10–80° 2θ range with a step size of 0.02° and at 1 s per step.XRD patterns for the Cu-based catalysts are presented in Fig. 4. Three distinctive diffraction peaks were observed in both catalysts at 2θ = 43.6°, 50.0° and 74.4°, which all correspond to metallic Cu.32,33 These results show that the treatment conditions (500 °C under H2) ensured the reduction of CuO to metallic Cu completely in the case of Cu/SiO2, resembling XRD patterns observed for Cu catalysts supported on gamma alumina.34 In the case of Cu/AC however, there were additional diffraction peaks observed at ca. 2θ = 35.5°,38.5°,48.5°,61.5° and 68.0°, which all coincide with CuO diffraction peaks (specifically the main peaks at 35.5° and 38.5°). Yet, smaller peaks previously reported at 2θ = ca. 33° and 58° for CuO, were not observed in the Cu/AC catalyst XRD pattern.35 In any case, this suggested that reduction of copper with the AC support was not as effective as with the SiO2 support. This could have occurred because the Cu/AC catalysts had more Cu loaded than the Cu/SiO2 catalyst which means that the former most likely required more time to complete the reduction of CuO. Also because of the approx. 6 times higher surface area of activated carbon compared to silica, diffusion of hydrogen also requires more time. The diffraction peak observed at ca. 2θ = 26.5° in the Cu/AC catalyst can be explained because of the nature of the support. Graphite-like carbon materials have 2 reported diffraction peaks at 2θ = ca. 25–26.3° and 43°;36,37 the first peak coincided well with the diffraction peak observed in the Cu/AC pattern. It is possible that the other diffraction peak for graphite-like carbon (i.e. 43°) is hidden behind the large peak corresponding to metallic Cu, generated at the same Bragg angle. However, it is also possible that the diffraction peak at 2θ = 43° was not at all formed. Lee et al. suggested that the presence of a more developed crystalline carbon only causes a peak at 26°.38 There was also a diffraction peak observed for the Cu/SiO2 catalyst which can be explained by the nature of the support since a broad peak centered at ca. 2θ = 22° has been previously associated with SiO2.17,39
Molten salt hydropyrolysis and hydrodeoxygenation
The detailed procedure for the TMR calibration and the calibration equations are also described in our previous publication.39 Briefly, the reactor was calibrated by injecting standard compounds into the reactor at 0.4 MPa and 350 °C, and the constructed calibration curves had a R2 > 0.97. Also, for standard compounds that were not directly measured, the calibration curves were constructed based on the effective carbon number (ECN) theory. The ECN theory enables us to calculate relative response factors utilizing the flame ionization detector, in cases where pure materials are not available for detector calibration.40
The Cu-based catalysts were placed in the secondary quartz tube reactor of the TMR. Prior to this though, the Cu-based catalysts (48 mg) were mixed with SiC (352 mg) of 1 mm diameter. The catalyst/SiC mixtures were prepared (ca. 400 mg) to ensure proper flow of the carrier gas containing the volatile products that have been produced in the primary reactor, given that both catalysts had a small particle size (<100 μm) and could induce a too high pressure drop in the microreactor if used in their pure form. Fig. S.5 in the ESI† shows a picture of the catalyst bed prepared in the quartz tube. After the Cu-based catalysts were placed inside the TMR, they were left overnight at 250 °C under constant H2 flow (50 mL min−1). A blank analysis was always performed prior to any experiment, to ensure that no products were released from the catalysts.
Micro-pyrolysis experiments
The analytical scale experiments for molten salt hydropyrolysis of pinewood and subsequent hydrodeoxygenation of the vapors with Cu-based catalysts are listed in Table 5.![[thin space (1/6-em)]](https://www.rsc.org/images/entities/char_2009.gif) :
:![[thin space (1/6-em)]](https://www.rsc.org/images/entities/char_2009.gif) KCl
KCl![[thin space (1/6-em)]](https://www.rsc.org/images/entities/char_2009.gif) :
:![[thin space (1/6-em)]](https://www.rsc.org/images/entities/char_2009.gif) NaCl in a ratio of 44.3–41.9–13.8 mol%
NaCl in a ratio of 44.3–41.9–13.8 mol%
| Experiment number | Hydrodeoxygenation (2nd reactor) | 2nd reactor temperature (°C) |
|---|---|---|
| 1 | Cu/SiO2 (1st series) | 200 |
| 2 | 300 | |
| 3 | 400 | |
| 4 | 500 | |
| 5 | Cu/SiO2 (2nd series) | 300 |
| 6 | 400 | |
| 7 | 500 | |
| 8 | 600 | |
| 9 | 300 | |
| 10 | Cu/AC (1st series) | 300 |
| 11 | 400 | |
| 12 | 500 | |
| 13 | Cu/AC (2nd series) | 300 |
| 14 | 400 | |
| 15 | 500 |
These experiments were conducted at 0.4 MPa. The 1st and 2nd interfaces of the TMR, which are the compartments between the 1st and 2nd reactor and between the 2nd reactor and the GC-injector, were kept constant at 320 °C and 280 °C respectively, throughout the entire experimental series. One minute after the injection of the sample cup (containing pinewood and salt B), being the time in which the molten salt pyrolysis reactions were completed, the temperature of the 1st reactor was reduced from 350 °C to 200 °C to minimize any salt volatilization/hydrolysis as shown in previous work.27
In addition to the experiments shown in Table 5, two control analyses were performed. They consisted of pinewood hydropyrolysis with and without molten salts at 350 °C while excluding the hydrodeoxygenation step (i.e. 2nd reactor in TMR was empty). For the sample preparation, a biomass mass fraction in the biomass-salt B mixture of 0.1 (±0.004) was used: approx. 200 to 300 μg of pinewood were weighed and mixed with 1800 to 2700 μg of salt B.
For processing the data, Thermo Scientific Xcalibur (version 4.2.28.14) was used for the peak area integration and the NIST tandem mass spectral library (version 2.3) was employed for the peak identification. All peaks with a relative area of over 1% were identified from the MS spectra and quantified using the FID chromatogram peak area (when possible). The identification process of several compounds in this work is depicted in Fig. S.6 through S.9 of the ESI.† The yield of individual compounds was determined on a dry biomass basis according to eqn (4):
 | (4) |
Then, the MF selectivity, total yield of furans and total yield of ketones was determined according to eqn (5)–(7):
 | (5) |
 | (6) |
 | (7) |
Results and discussion
Molten salt hydropyrolysis
The addition of chloride molten salts (ZnCl2![[thin space (1/6-em)]](https://www.rsc.org/images/entities/char_2009.gif) :
:![[thin space (1/6-em)]](https://www.rsc.org/images/entities/char_2009.gif) KCl
KCl![[thin space (1/6-em)]](https://www.rsc.org/images/entities/char_2009.gif) :
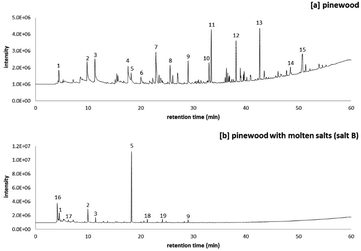
:![[thin space (1/6-em)]](https://www.rsc.org/images/entities/char_2009.gif) NaCl) as a reacting and heat transfer medium drastically changed the hydropyrolysis products from pinewood, forming a narrow list of volatile products (Fig. 5). The peak list of the pyrograms shown in Fig. 5 is included in Table 6. Fig. 5 shows that the total ion count of the volatile products was higher in the presence of salt B than in its absence. In our previous work it was shown that salt B catalyses primary and secondary reactions of the holocellulose fraction of pinewood, predominantly forming furan-ring compounds (peak 5, 17, 18 and 19 in Fig. 5), out of which furfural (FF) was the main one (11 wt%). More in depth, this work has shown the catalytic effect of salt B on the hydropyrolysis product distribution viz. through reaction mechanisms which have been proposed based on the analysis of model compound reactions with the chloride salts.15
NaCl) as a reacting and heat transfer medium drastically changed the hydropyrolysis products from pinewood, forming a narrow list of volatile products (Fig. 5). The peak list of the pyrograms shown in Fig. 5 is included in Table 6. Fig. 5 shows that the total ion count of the volatile products was higher in the presence of salt B than in its absence. In our previous work it was shown that salt B catalyses primary and secondary reactions of the holocellulose fraction of pinewood, predominantly forming furan-ring compounds (peak 5, 17, 18 and 19 in Fig. 5), out of which furfural (FF) was the main one (11 wt%). More in depth, this work has shown the catalytic effect of salt B on the hydropyrolysis product distribution viz. through reaction mechanisms which have been proposed based on the analysis of model compound reactions with the chloride salts.15
| Peak no. | Compound | Peak no. | Compound |
|---|---|---|---|
| 1 | Methanol | 14 | D-Allose |
| 2 | Acetic acid | 15 | Levoglucosan |
| 3 | Hydroxyacetone | 16 | Chloromethane |
| 4 | Acetone | 17 | 2-Methylfuran |
| 5 | Furfural | 18 | Acetylfuran |
| 6 | Furfuryl alcohol | 19 | 5-Methylfurfural |
| 7 | 1,2-Cyclopentanedione | 20 | Furan |
| 8 | 2(5H)-furanone | 21 | 2,5-Dimethylfuran |
| 9 | Guaiacol | 22 | 2-Pentanone |
| 10 | Creosol | 23 | Cyclopentanone |
| 11 | Pentanal | 24 | 2-Methylcyclopentanone |
| 12 | 4-Vinyl guaiacol | 25 | Cyclopentenone |
| 13 | Trans-isoeugenol | 26 | 2-Methyl-2-cyclopentenone |
Another effect of the presence of salt B was the reduction in the formation of methoxyphenols. While from pure pinewood hydropyrolysis, a variety of methoxyphenols was formed (peak 9, 10, 12, and 13 in Fig. 5a), only a single methoxyphenol compound (peak 9 = guaiacol) was produced in the presence of salt B (Fig. 5b). The reduction in methoxyphenol formation is directly associated with chloromethane production in molten salt hydropyrolysis of lignocellulosic biomass (peak 16 in Fig. 5b). Indeed it has been proven that these production patterns are interconnected to a large degree: chloride molten salts promote demethoxylation reactions of methoxyphenols formed during biomass (hydro)pyrolysis generating multiple methyl groups, which subsequently react with the hydrolyzed salts to form chloromethane.27
Low temperature (350 °C) and a moderately low pressure (0.4 MPa) applied in molten salt hydropyrolysis of pinewood have been shown to yield the highest quantity of FF, the precursor for 2-methylfuran (MF) production.15
Despite the fact that an increase in hydropyrolysis pressure to 1.6 MPa has been shown to promote the partial hydrodeoxygenation of FF to MF, these higher pressures have not been applied. By employing a lower pressure of 0.4 MPa in the 1st reaction step (molten salt hydropyrolysis) and forming the maximum possible amount of FF, the effectiveness of the Cu-based catalysts in the hydrodeoxygenation of FF to MF (2nd reaction step) could be better assessed.
Besides at lower pressures, the overall furanic yield was also higher in molten salt hydropyrolysis. It should be noted however, that even at a lower pressure, MF was already directly produced in molten salt hydropyrolysis of pinewood (peak 17 in Fig. 5b), although in very low yields (0.3 wt%).
Molten salt hydropyrolysis and subsequent hydrodeoxygenation
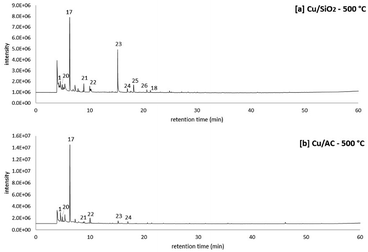
A two-step process consisting of (1) molten salt hydropyrolysis of pinewood and (2) catalytic vapor phase hydrodeoxygenation was investigated in the TMR setup for the production of MF. In this section, the product distribution obtained from the proposed two-step process is discussed under specific conditions.Fig. 6 shows the results from combined molten salt hydropyrolysis of pinewood at 350 °C and vapor phase hydrodeoxygenation using Cu/SiO2 and Cu/AC catalysts at 500 °C. The peak list of the pyrograms shown in Fig. 6 is also included in Table 6. The chromatograms clearly show that with both of the Cu-based catalysts, the main product observed was MF (peak no. 17), which validated the proposed concept. In the vapor phase, FF (formed from the 1st step process) was initially hydrogenated to furfuryl alcohol and then hydrodeoxygenated to MF, a reaction mechanism previously demonstrated using model compounds15 and shown in other research as well.41
Particularly, Jiménez-Gomez et al. proposed that Cu-based catalysts in furfural hydrogenation lead to products without the scission of C–C bonds (i.e. MF and furfuryl alcohol) because of the copper surface affinity to the oxygen atom in furfural's carbonyl group.17
Apart from MF, there were also other peaks observed for products from the proposed 2-step process, including other furan-ring compounds (furan, 2,5-dimethylfuran, and acetylfuran corresponding to peaks 20, 21 and 18 respectively) and ketones (peak 22 to 26 in Fig. 6). Particularly when observing the ketones formed from the hydropyrolysis volatiles over the Cu/SiO2 catalyst, the production of cyclopentanone (peak 23 in Fig. 6) stands out. Because cyclopentanone was not observed in molten salt hydropyrolysis (1st step), it is evident that this cyclic ketone was a product of the catalytic hydrotreatment (2nd step) of the hydropyrolysis volatiles.
The production of cyclopentanone from catalytic conversion of furfural has been widely studied. Cyclopentanone is an important intermediate chemical used in the synthesis of solvents, fragrances, cosmetics and agrochemicals. Commercially, cyclopentanone is produced by intramolecular decarboxylative ketonization of adipic acid. The latter however, is an expensive process (because of the adipic acid) and produces significant waste streams.42 Cyclopentanone can also be formed from hydrogenation of furfural in the liquid phase, using water as a solvent and catalysts such as CuZnAl and NiCu.43,44 Although liquid phase conversion is preferred because the presence of water is important for the ring rearrangement reaction to occur, furfural hydrogenation to cyclopentanone has also been reported in the vapor phase.45 The reaction to convert furfural to cyclic ketones in the vapor-phase (Fig. 7) can be explained because of the water produced from the in situ conversion of furfuryl alcohol to MF as previously reported.45
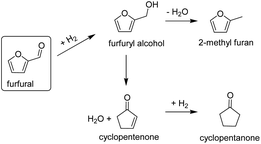 | ||
| Fig. 7 Scheme for furfural conversion routes to cyclic ketones in the vapor phase.43,45 | ||
MF selectivity
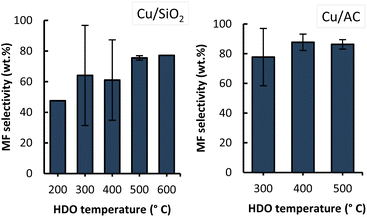
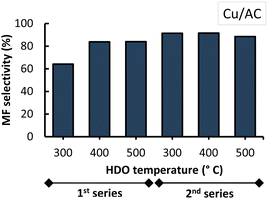
The overall MF selectivity highly depended on the type of Cu-based catalyst used and the applied temperature as shown in Fig. 8.By comparing the two graphs in this figure, it can be observed that Cu/AC performs better than Cu/SiO2 given the higher MF selectivity attained overall with Cu/AC (up to 87%). The better performance of Cu/AC could be explained by the higher loading and higher dispersion of Cu on activated carbon (as observed from EDX images in Fig. 3), leading to a higher amount of available sites for the hydrodeoxygenation reactions to occur, ultimately favouring the conversion to MF. However, additional techniques (e.g. high resolution TEM) should be applied to verify this claim.
Jiménez-Gomez et al. demonstrated the existence of a strong relationship between the copper dispersion and the MF selectivity, where the formation of MF was favoured when a higher Cu surface area was available.17 In the referred study, it was shown that when the Cu surface area increased from 1.9 m2 Cu per g to 5.4 m2 Cu per g (by changing the support material), the MF selectivity increased from ca. 24% to ca. 94% respectively.17 Moreover, this study also showed that using Cu supported on mesoporous silica instead of Cu on commercial silica, resulted in a higher metal surface area and therefore higher MF selectivity.
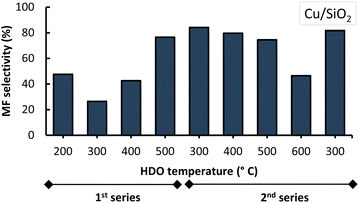
These observations most likely explain the lower performance of the Cu/SiO2 catalyst in this work as seen in Fig. 8. It is relevant to highlight that the sequence of the performed experiments impacted the MF selectivity attained, as can be observed from the high standard deviations under the conditions of 300 °C with both Cu/SiO2 and Cu/AC, and of 400 °C with Cu/SiO2. The MF selectivity, in detail from sequential experiments, with Cu/SiO2 and Cu/AC is shown in Fig. 9 and 10.
With both Cu-based catalysts it was observed that, once the 1st series of experiments was completed at 500 °C, the MF selectivity increased in the 2nd series of experiments. The latter was observed at HDO temperatures of 300 °C and 400 °C for both Cu-based catalysts during the second series. This suggests that at the beginning the catalysts were not fully active (i.e. fully reduced). They became more active when subjected, for a prolonged time as they continuously resided in the micro-pyrolysis setup in between subsequent experiments, to similar conditions as those of their prior reduction process (i.e. a high temperature H2 atmosphere).
Now, it was also observed that an increase in HDO temperature to 500 °C in the second series, lowered MF selectivity especially when Cu/SiO2 was used. Increasing the HDO temperature to 600 °C resulted in an even lower MF selectivity (<50%). Interestingly, lowering the HDO temperature from 600 °C to 300 °C within the same 2nd series of experiments, showed comparable MF selectivity (∼83 wt%) which suggests consistency in the output of the Cu-catalyst at this temperature.
In the next section, the yield of MF and other furan-ring compounds is compared under the different conditions tested. Because of the noticeable differences in the two repeated series of catalytic experiments performed, the results will be shown and discussed separately per series from this point onwards.
MF and furanic yields
The yield of volatiles (on a dry biomass basis), specifically of 2-methylfuran (MF), furfural (FF), furan (FUR), furfuryl alcohol (FA), acetylfuran (ACF) and 2,5-dimethylfuran (DMF) is discussed in this section. Fig. 11 and 12 show all the furanic yields obtained from the combined molten salt hydropyrolysis of pinewood and subsequent HDO of the volatiles with Cu/SiO2 and Cu/AC respectively. A more detailed list of all the products from hydropyrolysis of pinewood and subsequent HDO of the volatiles with Cu/SiO2 and Cu/AC is included in the ESI, Tables S.1 and S.2.†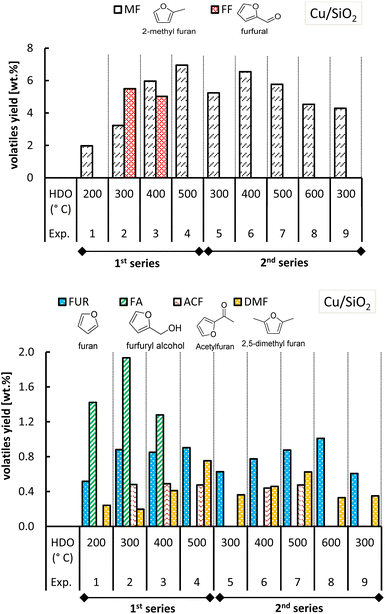 | ||
| Fig. 11 Yield of MF and other furanics obtained from molten salt hydropyrolysis of pinewood and subsequent hydrodeoxygenation with Cu/SiO2. Conditions: 0.4 MPa and hydropyrolysis at 350 °C. | ||
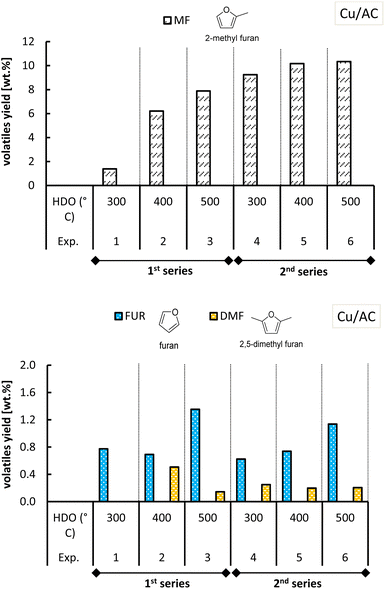 | ||
| Fig. 12 Yield of MF and other furanics obtained from molten salt hydropyrolysis of pinewood and subsequent hydrodeoxygenation with Cu/AC. Conditions: 0.4 MPa and hydropyrolysis at 350 °C. | ||
The highest MF yields from the combined conversion steps were found at 500 °C with both Cu-based catalysts, though a higher MF yield was attained with Cu/AC (10.3 wt%) compared to Cu/SiO2 (6.9 wt%). MF yields obtained with each Cu catalyst varied in the two series of experiments, especially in the case of Cu/SiO2. In the 1st series of experiments with Cu/SiO2, it was observed that at the HDO temperatures of 300 °C and 400 °C, furfural was produced with a yield of 5.5 wt% and 5.0 wt% respectively.
Apparently not all furfural (from the 1st step) was converted. At the same temperatures, furfuryl alcohol (intermediate product of furfural hydrogenation) was also formed and not completely converted into MF. The fact that at a HDO temperature of 200 °C and 500 °C, no furfural was observed had distinct reasons. On the one hand, at 200 °C furfural may have condensed onto Cu/SiO2 because of the proximity to its boiling point (162 °C). On the other hand, at 500 °C, probably all furfural from the 1st step was completely hydrodeoxygenated to MF.
In the 2nd series of experiments with Cu/SiO2 however, furfural and furfuryl alcohol were not observed at 300 °C and 400 °C like in the 1st series. Although at these temperatures, the MF yields in the 2nd series were higher than those of the 1st series, the total yield of furanics was diminished (shown in Fig. S.10 of the ESI†). This decrease in furanic yield may be caused by coke deposition on the Cu/SiO2 catalyst, which could occur as a result of the higher catalyst activity in the second series of experiments. If more active sites are formed the catalyst becomes prone to coke build up.
The deposition of carbonaceous species onto Cu/SiO2 may occur by chemisorption mechanisms rather than by, for instance, encapsulation mechanisms because the conversion of furfural to MF still took place.46 In the first case only part of the active metal sites is shielded while in the second case any contact with the active metal sites is made impossible.
The hydrotreatment of the volatiles with the Cu/AC catalysts converted all the furfural from the 1st step at any HDO temperature tested (Fig. 12). In the 2nd series of experiments with Cu/SiO2 however, furfural and furfuryl alcohol were not observed at 300 °C and 400 °C like in the 1st series. Although at these temperatures, the MF yields in the 2nd series were higher than those of the 1st series, the total yield of furanics was diminished (shown in Fig. S.10 of the ESI†). This decrease in furanic yield may be caused by coke deposition on the Cu/SiO2 catalyst, which could occur as a result of the higher catalyst activity in the second series of experiments. If more active sites are formed the catalyst becomes prone to coke build up.
Regarding the other furan-ring compounds formed, it has been shown that the formation of furan in pinewood hydropyrolysis is catalyzed by chloride molten salts, as the result of promoted decarbonylation of furfural.15 In the case of the two-step process, it was seen that furfural can be further converted to furan in the 2nd step as well (Fig. 11 and 12).
Furan formation was temperature dependent as its yield increased with increasing HDO temperature with both of the Cu-based catalysts. At a HDO temperature of 500 °C with Cu/AC, the furan yield attained was the highest (ca. 1.1–1.2 wt%). Perhaps the activated carbon support in the Cu/AC catalyst is responsible for this. Activated carbons were demonstrated before to promote furan formation (as well as the formation of phenolic compounds) in biomass pyrolysis because of their well-developed porosity and high internal surface area.47 The latter could also potentially explain why acetylfuran (produced in the 1st step of molten salt hydropyrolysis) was no longer observed when the Cu/AC catalyst was used in the HDO step, instead of Cu/SiO2.
With respect to 2,5-dimethylfuran, this was found as an end-product for both Cu-based catalysts, although with slightly lower yields when using the Cu/AC catalyst. The formation of acetylfuran and 2,5-dimethylfuran has been demonstrated previously.15 In the previous section, it was reasoned that the Cu-based catalysts also promoted the hydrogenation of furfural to cyclic ketones such as cyclopentanone and cyclopentenone (Fig. 7). The formation of these cyclic ketones is temperature dependent, as their yields increased with the HDO temperature increasing up to 500 °C; see Fig. 13 and 14.
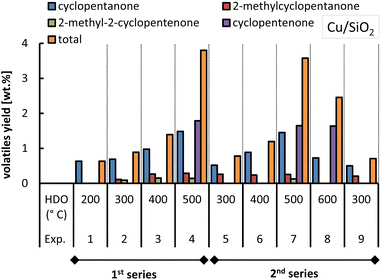 | ||
| Fig. 13 Yield of ketones obtained from molten salt hydropyrolysis of pinewood and subsequent hydrodeoxygenation with Cu/SiO2. Conditions: 0.4 MPa and hydropyrolysis at 350 °C. | ||
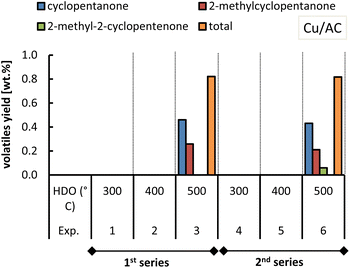 | ||
| Fig. 14 Yield of ketones obtained from molten salt hydropyrolysis of pinewood and subsequent hydrodeoxygenation with Cu/AC. Conditions: 0.4 MPa and hydropyrolysis at 350 °C. | ||
At 500 °C (HDO temperature), the total cyclic ketone yield was much higher for Cu/SiO2 (ca. 3.7 wt%) than for Cu/AC (0.8 wt%).
In the case of the Cu/AC catalyst at 500 °C only the cyclic ketones were produced whereas with Cu/SiO2 they were formed in a wider temperature range (200 °C to 600 °C). The fact that Cu/SiO2 better promoted the conversion of furfural to cyclopentanone, and to cyclopentenone at higher temperatures, could be ascribed to the acidic silica support. Copper catalysts with solid acid supports were shown to have a high activity towards the formation of cyclopentanone from furfural.16 In this case, Cu is responsible for the hydrogenation of furfural to furfuryl alcohol and then the Lewis acid sites provided by the acidic support can accept the electron of the carbonyl group, favoring the rearrangement of furfuryl alcohol into cyclopentenone, which is finally hydrogenated to cyclopentanone.16
Chloromethane (CH3Cl) hydrochlorination
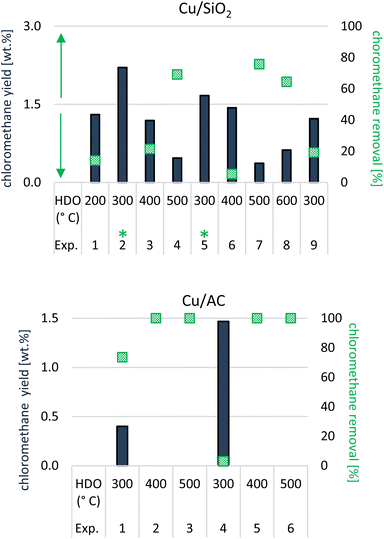
As shown in Fig. 5, (hydro)pyrolysis of lignocellulosic biomass in chloride molten salts generated CH3Cl, which is an undesirable side-product. In this study, chloromethane is produced alongside MF, other furanics and cyclic ketones. Without the use of catalytic vapor-phase upgrading (i.e., only lignocellulosic biomass converted within the molten salts), the CH3Cl yield in the analysed volatiles was 1.5%. After the ex situ catalytic upgrading of the volatiles from hydropyrolysis of lignocellulosic biomass within molten salts, the yield of chloromethane mostly decreased compared to the benchmark (<1.5%); in some cases however, it increased (>1.5%). Based on the relative difference in chloromethane yield between an experiment and the benchmark in the absence of catalytic vapor-phase upgrading, the CH3Cl removal (in %) was calculated and is plotted in Fig. 15.Chloromethane gradually disappeared from the volatile stream when the temperature in the 2nd step, hydrotreatment, increased (Fig. 15), an effect which was seen with either of the formulated catalysts. In some cases, specifically at low catalysis temperature (300 °C) with Cu/SiO2, a slightly negative removal was seen, meaning that a larger yield than 1.5 wt% of chloromethane was ultimately quantified in the volatiles after ex situ catalytic upgrading.
At first, it was thought that the removal of chloromethane was caused by hydrochlorination which is possible at atmospheric pressures and in the presence of a catalyst according to the following equation:48
| CH3Cl(g) + H2(g) → CH4(g) + HCl(g) |
It was not possible to identify or quantify methane in the chromatograms because the m/z-range in the chromatograms started at 29. But if hydrochlorination of CH3Cl had occurred, then HCl would have been detected as an end-product from the two-step investigated process.
However, no peak matching that of HCl was detected (after scanning for m/z 36) and it was therefore concluded that the reaction above was unlikely to occur. It was more likely that CH3Cl was cracked because of the chlorination of Cu into CuCl, according to the following equation previously reported in the literature:49
| CH3Cl(g) + Cu → CuCl(s) + 1/2C(s) + 1/2CH4(g) + 1/2H2(g) |
Alternatively, and especially in the case of Cu/AC where XRD analysis still showed the presence of CuO, chloromethane could have also interacted with CuO as shown in the following equation:50
| 2CH3Cl + 7CuO → CuCl2 + 6Cu + 2CO2 + 3H2O |
As can be seen from Fig. 15, the removal of CH3Cl is indeed remarkable with the Cu/AC catalyst, achieving 100% elimination of CH3Cl at HDO temperatures of 400 and 500 °C.
With the Cu/SiO2 catalyst, the CH3Cl removal was less efficient and only complete at a HDO temperature of 600 °C. These observations are in line with those reported by Blaser et al., which also showed higher CH3Cl conversion rates with Cu/AC (ca. 40%) than with Cu/SiO2 (ca. 6 to 7%).49
Conclusions
In this investigation, the objective was to assess the feasibility of converting pinewood to 2-methylfuran in a two-step process consisting of (1) molten salt hydropyrolysis of pinewood and (2) hydrodeoxygenation of the vapors over Cu-based catalysts at a moderately low pressure of 0.4 MPa. It was shown that furfural is produced selectively in the first step while it can be converted to 2-methylfuran with a high selectivity (up to 92%) using a Cu catalyst supported on activated carbon (Cu/AC). Furfural hydrodeoxygenation to 2-methylfuran was optimal in the temperature range of 400 °C to 500 °C with 2-methylfuran yields of approx. 10.3 wt% on a dry pinewood basis. A hydrodeoxygenation temperature of no more than 400 °C is more appropriate because no cyclic ketones (such as cyclopentanone) are formed then as side-products. Hence downstream recovery of 2-methylfuran would be simpler. On a furfural basis, the 2-methylfuran yields could range between 15.6 wt% and 29.4 wt%, considering a furfural yield from molten salt pyrolysis of 17 wt% under H2 and 32 wt% under He, respectively.This research has also shown that the catalytic hydrotreatment of pinewood volatiles with Cu supported on silica (Cu/SiO2) instead of activated carbon (Cu/AC) yielded overall less MF. This can be explained by the higher loading and higher dispersion degree of copper in the Cu/AC catalyst. Cu/SiO2 was catalytically active towards both the conversion of furfural into MF as well as to the transformation of furfural into cyclic ketones, probably because of the acidity of the support. One of the most significant findings emerging from this research was that chloromethane, an undesirable side-product formed in molten salt hydropyrolysis, is removed from the volatile stream during the hydrodeoxygenation step. HDO with Cu/AC resulted in 100% removal of chloromethane, which was assumed to react with the copper of the catalyst to form copper(I) chloride (CuCl).
This research has determined the conditions for an integrated conversion route of lignocellulosic biomass, in this case pinewood, to furfural and its subsequent conversion to 2-methylfuran (MF), all taking place in the vapor-phase. It should be noted however, that catalyst deactivation was not yet examined. Further research should therefore explore the effects of a more extended use of the Cu/AC catalyst for the volatile hydrotreatment. Above all one should determine how long it takes before the catalyst starts to deactivate and find feasible methods to regenerate it. In addition, future research could also explore different Cu loadings on AC in tandem with a more thorough characterization of Cu/AC catalysts (e.g. high resolution TEM).
Author contributions
Adriana Estrada León: conceptualization, data curation, formal analysis, investigation, writing – original draft. Marcela Ulloa Murillo: conceptualization, data curation, formal analysis, investigation, writing – original draft. Stef Ghysels: conceptualization, supervision, writing – review and editing. Daniel Nowakowski: formal analysis, investigation, writing – review and editing. Wolter Prins: writing – review and editing. Frederik Ronsse: conceptualization, funding acquisition, resources, supervision, writing – review and editing.Conflicts of interest
There are no conflicts to declare.Abbreviations
| MF | 2-Methylfuran |
| HDO | Hydrodeoxygenation |
Acknowledgements
The authors would like to acknowledge the ABC-Salt project (grant agreement number 764089) for the financial support and collaboration.References
- E4tech (UK) Ltd, E20 Supply and Demand Study, E4tech (UK) Ltd for ePURE, https://www.epure.org/wp-content/uploads/2020/11/191128-def-rep-e4tech-e20-supply-and-demand-study-final-report.pdf, accessed November 29, 2023 Search PubMed.
- ePURE (European Renewable Ethanol), E10 in Europe, https://www.e10info.eu/e10-in-europe/, accessed November 29, 2023 Search PubMed.
- ePURE (European Renewable Ethanol), Fuel Blends, https://www.epure.org/about-ethanol/fuel-market/fuel-blends/, accessed November 29, 2023 Search PubMed.
- ePURE (European Renewable Ethanol), ED95: An Ethanol Blend to Fuel Europe's Heavy-Duty Transport, https://www.epure.org/news/ed95-an-ethanol-blend-to-fuel-europes-heavy-duty-transport/#:%7E:text=ED95 is a fuel grade, in certain heavy-duty vehicles, accessed November 29, 2023 Search PubMed.
- European Parliament, EU ban on the sale of new petrol and diesel cars from 2035 explained, https://www.europarl.europa.eu/resources/library/images/20221025PHT46002/20221025PHT46002_original.jpg, accessed May 17, 2023 Search PubMed.
- ETEnergyWorld, Brazil's Ethanol Journey: From ‘a Fuel of the Future’ to the ‘Future of Fuel’, https://energy.economictimes.indiatimes.com/news/oil-and-gas/brazils-ethanol-journey-from-a-fuel-of-the-future-to-the-future-of-fuel/90941877, accessed November 29, 2023 Search PubMed.
- Raizen, Renewables, https://www.raizen.com.br/en/our-business/renewables#second-generation-ethanol, accessed May 17, 2023 Search PubMed.
- D. S. Hirshfeld, J. A. Kolb, J. E. Anderson, W. Studzinski and J. Frusti, Environ. Sci. Technol., 2014, 48, 11064–11071 CrossRef CAS PubMed.
- A. Tuan Hoang and V. Viet Pham, Renewable Sustainable Energy Rev., 2021, 148, 111265 CrossRef CAS.
- G. J. Udo, J. J. Awaka-Ama, E. J. Uwanta, I. O. Ekwere and I. R. Chibueze, Front. Chem., 2020, 8, 2–8 CrossRef PubMed.
- H. Xiao, P. Zeng, Z. Li, L. Zhao and X. Fu, Fuel, 2016, 175, 157–163 CrossRef CAS.
- B. M. Masum, H. H. Masjuki, M. A. Kalam, S. M. Palash and M. Habibullah, J. Cleaner Prod., 2015, 86, 230–237 CrossRef CAS.
- O. Khan, A. K. Yadav, M. E. Khan and M. Parvez, Energy Sources, Part A, 2021, 43, 1793–1803 CrossRef CAS.
- J. Yanowitz, E. Christensen and R. McCormick, Contract, 2011, 303, 275–300 Search PubMed.
- A. Estrada Leon, R. Ramamurthy, S. Ghysels, S. Niazi, W. Prins and F. Ronsse, Fuel Process. Technol., 2023, 250, 107917 CrossRef CAS.
- C. García-Sancho, J. M. Mérida-Robles, J. A. Cecilia-Buenestado, R. Moreno-Tost and P. J. Maireles-Torres, Int. J. Mol. Sci., 2023, 24, 2443 CrossRef PubMed.
- C. P. Jiménez-Gómez, J. A. Cecilia, R. Moreno-Tost and P. Maireles-Torres, ChemSusChem, 2017, 10, 1448–1459 CrossRef PubMed.
- N. Pino, D. López and J. F. Espinal, J. Mol. Model., 2019, 25, 1–10 CrossRef CAS PubMed.
- B. Yao, Q. Kang, J. Fu, Y. Liu, W. Ao, L. Wang, Z. Jiang, T. Zhang, Y. Song, Z. Deng, A. A. Siyal and J. Dai, Biomass Bioenergy, 2023, 168, 106658 CrossRef CAS.
- F. Dong, Y. Zhu, H. Zheng, Y. Zhu, X. Li and Y. Li, J. Mol. Catal. A: Chem., 2015, 398, 140–148 CrossRef CAS.
- P. Panagiotopoulou and D. G. Vlachos, Appl. Catal., A, 2014, 480, 17–24 CrossRef CAS.
- X. Chang, A. F. Liu, B. Cai, J. Y. Luo, H. Pan and Y. B. Huang, ChemSusChem, 2016, 9, 3330–3337 CrossRef CAS PubMed.
- W. Gong, C. Chen, R. Fan, H. Zhang, G. Wang and H. Zhao, Fuel, 2018, 231, 165–171 CrossRef CAS.
- T. Varila, E. Mäkelä, R. Kupila, H. Romar, T. Hu, R. Karinen, R. L. Puurunen and U. Lassi, Catal. Today, 2021, 367, 16–27 CrossRef CAS.
- H. S. Nygård and E. Olsen, Int. J. Low-Carbon Technol., 2012, 7, 318–324 CrossRef.
- Q. Lu, C. Q. Dong, X. M. Zhang, H. Y. Tian, Y. P. Yang and X. F. Zhu, J. Anal. Appl. Pyrolysis, 2011, 90, 204–212 CrossRef CAS.
- A. Estrada Leon, M. Pala, H. J. Heeres, W. Prins and F. Ronsse, J. Anal. Appl. Pyrolysis, 2022, 168, 105739 CrossRef CAS.
- S. Niazi, E. Olsen and H. S. Nygård, J. Mol. Liq., 2020, 317, 114069 CrossRef CAS.
- U. Rashid, S. Soltani, S. I. Al-Resayes and I. A. Nehdi, Metal oxides in energy technologies, Elsevier Inc., 2018 Search PubMed.
- J. R. A. Sietsma, A. Jos van Dillen, P. E. de Jongh and K. P. de Jong, Stud. Surf. Sci. Catal., 2006, 162, 95–102 CrossRef CAS.
- A. Abdedayem, M. Guiza, F. J. Rivas Toledo and A. Ouederni, Ozone: Sci. Eng., 2017, 39, 435–446 CrossRef CAS.
- D. Collins, T. Luxton, N. Kumar, S. Shah, V. K. Walker and V. Shah, PLoS One, 2012, 7(8), e42663 CrossRef CAS PubMed.
- Q. Li, S. W. Zhang, Y. Zhang and C. Chen, Nanotechnology, 2006, 17, 4981–4985 CrossRef CAS.
- H. Yahiro, K. Nakaya, T. Yamamoto, K. Saiki and H. Yamaura, Catal. Commun., 2006, 7, 228–231 CrossRef CAS.
- M. F. Luo, P. Fang, M. He and Y. L. Xie, J. Mol. Catal. A: Chem., 2005, 239, 243–248 CrossRef CAS.
- M. Saad, A. Białas, P. Grzywacz, C. Czosnek, B. Samojeden and M. Motak, Chem. Process Eng., 2020, 41, 59–67 CAS.
- A. G. El-Deen, N. A. M. Barakat, K. A. Khalil and H. Y. Kim, New J. Chem., 2014, 38, 198–205 RSC.
- S. M. Lee, S. H. Lee and J. S. Roh, Crystals, 2021, 11, 1–11 Search PubMed.
- Y. Liang, J. Ouyang, H. Wang, W. Wang, P. Chui and K. Sun, Appl. Surf. Sci., 2012, 258, 3689–3694 CrossRef CAS.
- J. T. Scanlon and D. E. Willis, J. Chromatogr. Sci., 1985, 23, 333–340 CAS.
- P. Panagiotopoulou and D. G. Vlachos, Appl. Catal., A, 2014, 480, 17–24 CrossRef CAS.
- S. Dutta and N. S. Bhat, ACS Omega, 2021, 6, 35145–35172 CrossRef CAS PubMed.
- J. Guo, G. Xu, Z. Han, Y. Zhang, Y. Fu and Q. Guo, ACS Sustain. Chem. Eng., 2014, 2, 2259–2266 CrossRef CAS.
- Y. Yang, Z. Du, Y. Huang, F. Lu, F. Wang, J. Gao and J. Xu, Green Chem., 2013, 15, 1932–1940 RSC.
- T. Omotoso, L. V. Herrera, T. Vann, N. M. Briggs, L. A. Gomez, L. Barrett, D. Jones, T. Pham, B. Wang and S. P. Crossley, Appl. Catal., B, 2019, 254, 491–499 CrossRef CAS.
- A. Ochoa, J. Bilbao, A. G. Gayubo and P. Casta, Renewable Sustainable Energy Rev., 2020, 119, 109600 CrossRef CAS.
- Z. Yang, H. Lei, Y. Zhang, K. Qian, E. Villota, M. Qian, G. Yadavalli and H. Sun, Appl. Energy, 2018, 220, 426–436 CrossRef CAS.
- S. Liu, J. A. Otero, M. Martin-Martinez, D. Rodriguez-Franco, J. J. Rodriguez and L. M. Gómez-Sainero, Catalysts, 2020, 10, 1–38 Search PubMed.
- E. Blaser, C. Rosier, M. Huet, C. Geantet and S. Loridant, Catal. Sci. Technol., 2022, 12, 2006–2014 RSC.
- Y. W. Yang, Environ. Sci. Technol., 2001, 35, 3259–3262 CrossRef PubMed.
Footnotes |
| † Electronic supplementary information (ESI) available. See DOI: https://doi.org/10.1039/d4se00106k |
| ‡ These authors contributed equally. |
| This journal is © The Royal Society of Chemistry 2024 |

