
 Open Access Article
 This Open Access Article is licensed under a Creative Commons Attribution-Non Commercial 3.0 Unported Licence
From brew to clean fuel: harnessing distillery wastewater for electrolysis H2 generation using nano scale nickle selenide water oxidation catalysts†
Michael
Walsh
a,
Jeannie Z. Y.
Tan
 a,
Sanjay
Nagarajan
b,
Kenneth
Macgregor
c,
John M.
Andresen
a,
M. Mercedes
Maroto-Valer
a and
Sudhagar
Pitchaimuthu
*a
a,
Sanjay
Nagarajan
b,
Kenneth
Macgregor
c,
John M.
Andresen
a,
M. Mercedes
Maroto-Valer
a and
Sudhagar
Pitchaimuthu
*a
aResearch Centre for Carbon Solutions (RCCS), Institute of Mechanical, Processing and Energy Engineering, School of Engineering and Physical Sciences, Heriot-Watt University, UK. E-mail: S.Pitchaimuthu@hw.ac.uk
bDepartment of Chemical Engineering, University of Bath, Bath BA27AY, UK
cThe Scotch Whisky Research Institute, The Robertson Trust Building, Research Avenue North, Riccarton, Edinburgh, EH14 4AP, UK
First published on 24th November 2023
Abstract
This study reports a promising and innovative approach for electrochemical green H2 generation using distillery industry wastewater. We employed solvothermally derived Ni2Se3 nanoparticles with a particle size of ∼50 nm as the anode catalyst material to effectively oxidise the acetic acid present in the distillery wastewater. The utilisation of a Ni2Se3 nanoparticle-coated stainless steel electrode significantly enhanced the current density (282 mA cm−2) in the electrochemical cell compared to the pristine SS (stainless steel) electrode (146 mA cm−2) at 2 V RHE. Also, the distillery wastewater electrolyte based cell exhibits higher current density compared to conventional freshwater (i.e., NaOH-based) electrolyte. The distillery wastewater electrolyte demonstrated remarkable H2 gas evolution (∼15 mL h−1 cm−2), showcasing its potential for sustainable H2 generation. However, it was observed that the aggressive bubbling effect at the cathode led to a lower H2 evolution reaction activity when compared to the freshwater-based electrolyte, which displayed a H2 production rate of ∼22 mL h−1 cm−2. These findings underscore the potential of employing Ni2Se3 as an effective oxidation catalyst in the production of H2 gas from pre-treated brewery wastewater H2 gas. The utilisation of Ni2Se3 nanoscale water oxidation catalysts in this context opens up new possibilities for both wastewater treatment and H2 production, paving the way for a more sustainable and resource-efficient future.
1 Introduction
With the world's population ever increasing, and in turn a constant growth of industrial activity and modernisation, the demand for energy across the globe has never been higher. This increase in demand for energy can be seen in the rise of greenhouse gas emissions as more hydrocarbons are consumed in order to meet the worlds energy needs.1 The overuse of natural hydrocarbon resources causes significant harm to Earth's ecosystem and climate.2 Consequently, affordable sustainable energy access is crucial for survival. Scientific knowledge has positively impacted key advancements in this area and has been crucial in the development of green H2 technology. Primarily, increasing interest in electrocatalytic H2 generation as a greener alternative to carbon-emitting processes, such as steam methane reforming, is becoming more evident.3–5In the electrochemical method, 9 kg of water is required to produce 1 kg of H2.6 With regards to the global target of net-zero emissions, the availability of sustainable H2 is key to achieving these aims. This is evident in the goal of ∼15 Mt green H2 generation by 2030. In this context, it becomes clear that a significant amount of freshwater will be required.7 Currently, ∼20.5 billion litres of freshwater are consumed annually in the electrolysis process for H2 production. However, it is important to note that this accounts for only 1.5 parts per million (ppm) of the Earth's available freshwater. When compared to sectors like irrigated agriculture, which utilise over 2700 billion cubic meters of water each year, the water requirement for H2 production remains relatively minimal.8 Despite its low impact on the overall water supply chain, concerns about freshwater scarcity necessitate a reduction in water extractions from all available sources. Therefore, it becomes crucial to explore solutions that enable H2 production to utilise the abundant wastewater resources available on Earth. By tapping into wastewater resources, the water footprint of H2 can be further reduced, alleviating pressure on the freshwater supply chain and promoting sustainability.
Recent studies had examined the potential of using industrial wastewater as a raw material for photo- and electrocatalytic H2 generation.9–13 This promising development suggested that industrial wastewater could be a viable alternative to freshwater resources. One approach involved identifying regional wastewater sources, such as the wastewater produced from Scotch whisky production, which is currently discharged into local rivers after physical or chemical treatment processes. However, resource recovery from this wastewater stream is crucial. By implementing systems for recovery, treatment, and reuse, a significant portion of the wastewater can be repurposed for activities, such as boiler feed water and cooling processes, leading to reduced disposal costs.14,15 Depending on the composition of the brewery wastewater, the presence of sugars, alcohol, and soluble starch allow the wastewater to be utilised for biogas production. However, there is still considerable potential for utilising this wastewater in the electrolysis process due to its high biomass content.16,17
In recent years, a wide range of electrocatalytic materials have been developed for the H2 evolution reaction (HER), but less research has been carried out on the development of materials for the water oxidation process.18 To achieve successful green H2 generation with minimal energy input, designing an efficient, low-cost, sustainable water oxidation catalyst is indispensable. Currently, existing water oxidation catalysts, such as RuO2 and IrO2, are known to be highly efficient, but their high costs and corrosive behaviour limit their industrial deployment.19,20 Metal chalcogenides, particularly nickel chalcogenides, are receiving profound attention due to their catalytic activity for HER or oxygen evolution reactions (OER) in alkaline solutions.21 However, enhancing the number of active sites remains a challenge for producing highly efficient HER and OER catalysts via a facile synthesis process.22–24 Nickel selenides (NiSe) are the second largest studied nickel chalcogenides for electrocatalytic water splitting.25,26 Four different types of nickel selenides are reported in the literature Ni1−xSe (0 < x < 0.15), NiSe2, Ni3Se4 and Ni2Se3.27 In general, nickel selenides are black in colour and do not dissolve in water. The insolubility of nickel selenides in water is a crucial parameter that makes them perfect for electrocatalytic water splitting applications. Interestingly, there is no other solvent that is capable of dissolving nickel selenides, but they tend to dissolve readily in highly oxidising acids, such as HNO3.27 Owing to its stability in neutral water and neutral water electrolyte solutions, NiSe is an appropriate catalyst for electrochemical water splitting in neutral and near-neutral media.
This study aims to explore the potential advantages of employing NiSe as a water oxidation electrocatalyst for the simultaneous generation of O2 and H2 gas from distillery industry wastewater. Several important factors were investigated in this research, including the stability of the NiSe coating, the performance of the catalyst over an extended period of time, and the overall stability of the materials before and after the electrolysis process. To assess the effectiveness of NiSe in the distillery wastewater electrolyte, all the obtained results are compared with those obtained in a freshwater (i.e., NaOH-based) electrolyte. This comparison provided a comprehensive evaluation of the performance and suitability of NiSe as an oxidative electrocatalyst to enhance H2 generation from distillery wastewater.
2 Experimental
2.1 Chemicals
Selenium powder (Se, 99% purity); sodium tetrahydridoborate/sodium borohydride (NaBH4, ≥99.8%); ethanol; sodium hydroxide; N,N-dimethylformamide (N,N-DMF, ≥99.8%); nickel(II) chloride hexahydrate (NiCl2·6H2O) and ruthenium(IV) oxide (RuO2, 99.9% purity) and dimethyl sulfoxide (DMSO, ≥99.9%) were purchased from Sigma-Aldrich. Deuterated water (D2O) was purchased from Fisher Chemical. All chemicals were used without further purification. Milli Q water (18 ΩM) was used throughout the study.2.2 NiSe catalysts preparation
The NiSe catalysts was prepared using solvothermal method. Typically, 0.32 g of Se powder was dispersed in 0.19 g of NaBH4 before adding 30 mL of N,N-DMF. The resultant solution (solution A) was then mixed using a magnetic stirrer (200 rpm) for 1 h. After that, 0.48 g of NiCl2 was added to solution A and placed back on the stirrer for a further stirring (200 rpm, 1 h), forming solution B. Once the desired time has elapsed, solution B was transferred to an autoclave jar (100 mL capacity) and kept in an electric furnace (Thermo Scientific) at 170 °C for a select duration of time. The electric furnace was switched off after completion of the desired time duration. The autoclave jar was left to cool to room temperature, after which the solution was transferred to a glass beaker. It was then washed with ethanol and water alternatively four times. During the washing process, the powder was collected using a centrifuge. The final powder sample was further annealed at 60 °C for 24 h in a vacuum drying oven. On completion of this process, the resultant NiSe nanomaterial was kept under vacuum conditions to prevent oxidation occurring in the material.2.3 NiSe electrode fabrication
Briefly, 4.5 mg of the synthesized NiSe powder was dispersed in 3 mL ethanol and placed in an ultrasonic bath for 30 min. A stainless-steel substrate (316 L) was then placed on a hotplate at 100 °C. The NiSe ink was then removed from the ultrasonic bath and 100 μL was then immediately dispersed onto both sides of the substrate using a micropipette. After heating for a further 5 min, the electrode was suitably ready to carry required electrochemical experiments. The ultimate catalyst loading of NiSe on stainless steel is approximately 1.67 mg cm−2.2.4 Material characterisation
We conducted X-ray diffraction (XRD) analysis to delve into the crystalline structure of the NiSe powder (Malvern Panalytical Empyrean Diffractometer) equipped with Cu Kα radiation (l = 1.5418 Å) and compared with the ICDD-JCPDS powder diffraction file database. For a comprehensive understanding of its surface characteristics, we employed both field emission scanning electron microscopy (FE-SEM, Quanta 200 F FEI) and high resolution transmission electron microscopy (HRTEM, FEI Titan Themis 200) equipped with an energy-dispersive X-ray spectroscopy (EDX) detector operated at 200 kV. To gain insights into the chemical composition and bonding states of NiSe, we employed X-ray photoelectron spectroscopy (XPS) (Kratos Axis Supra). Carbon 1s (284.6 eV) was used to calibrate the binding energies of other element scanned at high resolution. The distillery water was analysed with nuclear magnetic resonance spectroscopy (NMR, Bruker AVIII-400). Typically, 100 μL of the liquid sample was mixed with 100 μL of DMSO standard solution and 400 μL of D2O in an NMR tube. The DMSO standard solution was made by diluting the DMSO with D2O to obtain the final concentration (1.262 mM). The samples were analysed using 1H NMR equipped with water suppression.2.5 Electrochemical measurements
The electrochemical performance of NiSe was carried out using an electrochemical station (Autolab PGSTAT 302N), utilising the potentiostat function to apply the potential voltage to the system. NOVA software (version 2.1.5) was used to run the measurements for all experiments. The cell consisted of a typical 3 electrode system with a NiSe working electrode, Ni foam counter electrode and Hg/HgO (model: CHI 152, CH Instruments) reference electrode. A Hg/HgO reference electrode was selected as a suitable accompaniment to the 1.0 M NaOH (pH = 14.0) aqueous electrolyte that was used for all measurements. Polarisation curves were obtained from linear sweep voltammetry (LSV) studies in a potential range of −0.2 to 1.2 V vs. Hg/HgO. All measured potentials vs. the Hg/HgO were converted to the reversible H2 electrode (RHE) scale via the Nernst equation:28| Evs. RHE = Evs. Hg/HgO + 0.098 + 0.059pH | (1) |
 is the standard potential of Hg/HgO at 25 °C. The electrode surface area was kept constant at 3 cm2 for all measurements.
The electrochemically active surface area (ECSA) of the Ni2Se3 coating on SS was determined based on cyclic voltammetry (CV) measurements. Various scan rates ranging from 0.001 V s−1 to 0.1 V s−1 at non-faradaic region potential were applied. The peak current was recorded for each scan rate and plotted against the current density.
2.6 Distillery wastewater
The distillery wastewater was collected by industrial partner the Scotch Whisky Research Institute. It contains trace amounts of alcohol, dissolved copper, caustic soda, etc. The distillery wastewater contained solid waste and was primarily removed by centrifuging at 10![[thin space (1/6-em)]](https://www.rsc.org/images/entities/char_2009.gif) 000 rpm for 10 min. NaOH was added to the resultant solution to prepare 1.0 M of NaOH-distillery waste solution, which was used as the electrolyte for all electrochemical experiments.
000 rpm for 10 min. NaOH was added to the resultant solution to prepare 1.0 M of NaOH-distillery waste solution, which was used as the electrolyte for all electrochemical experiments.
2.7 H2 generation
The H2 generation from the electrochemical cells was measured using a gas chromatograph (GC, Agilent Technologies 7890B equipped with TCD-FID detectors). The two-compartment electrochemical cell separated by a membrane (Nafion) was setup to measure H2 evolution when a constant potential of 0.75 V vs. Hg/HgO was applied to the circuit. SS or Ni2Se3/SS and Ni foam were used as the electrodes and aqueous NaOH and NaOH-distillery wastewater were filled as the electrolyte in the anode and cathode compartments, respectively. The electrochemical compartments were sealed with a rubber stopper, which had an inlet and outlet port, to ensure minimal gas leakage. To push the generated H2 into the GC, the inlet port on the cathode compartment was bubbled with N2 (BOC, 99.995%, 0.8 mL min−1) throughout the experiment. The outlet of the cathode compartment was connected to the GC sampling port for continuous injection of sample. Area under the curve obtained in each injection was used to quantify the amount of H2 generated.3 Results and discussion
The crystallinity of as-synthesized NiSe powder was characterised using XRD (Fig. 1a). The predominant XRD peaks exhibits at 29.9°, 33.5°, 33.57°, 42.9°, 50.7°, 55.5° and 57.5° confirmed the formation of cubic phase of Ni2Se3 (JCPDS – 1-1495).29 When the Ni2Se3 powder was coated onto the SS, the XRD pattern did not show any significant difference when compared to the pristine Ni2Se3 powder (Fig. 1a). The morphology of Ni2Se3 were analysed using SEM and HRTEM. The hydrothermally synthesised Ni2Se3 revealed a highly dispersed spherical shape (∼30–50 nm of diameter), as shown in the SEM images (Fig. S1†). In addition, the Ni2Se3 nanoparticles exhibited an interconnected network (Fig. S1†), highlighting the possibility of good electrocatalytic performance due to its highly exposed and active catalytic surface area, and the catalyst's ability to promote electrolyte accessibility and accelerate electron transport.30 The HRTEM image (Fig. 1b) clearly evidenced that the Ni2Se3 nanoparticles exhibit a size distribution ranging between 30–50 nm, which aligned with SEM results. Crystal plane of (111) with a d-spacing of 3.4 Å is indexed in Fig. 1c evidencing that the as-synthesized Ni2Se3 was highly crystallized. The elemental mapping analysis of the Ni2Se3 nanoparticle (Fig. 1d) revealed a uniform distribution of Ni and Se throughout the entire particle (Fig. 1e and f). The presence of oxygen (Fig. 1f) in the NiSe sample could potentially be attributed to atmospheric oxidation during sample characterisation or storage. It is important to consider the possibility of oxygen incorporation and its effects when interpreting the results and discussing the properties of the NiSe nanoparticles.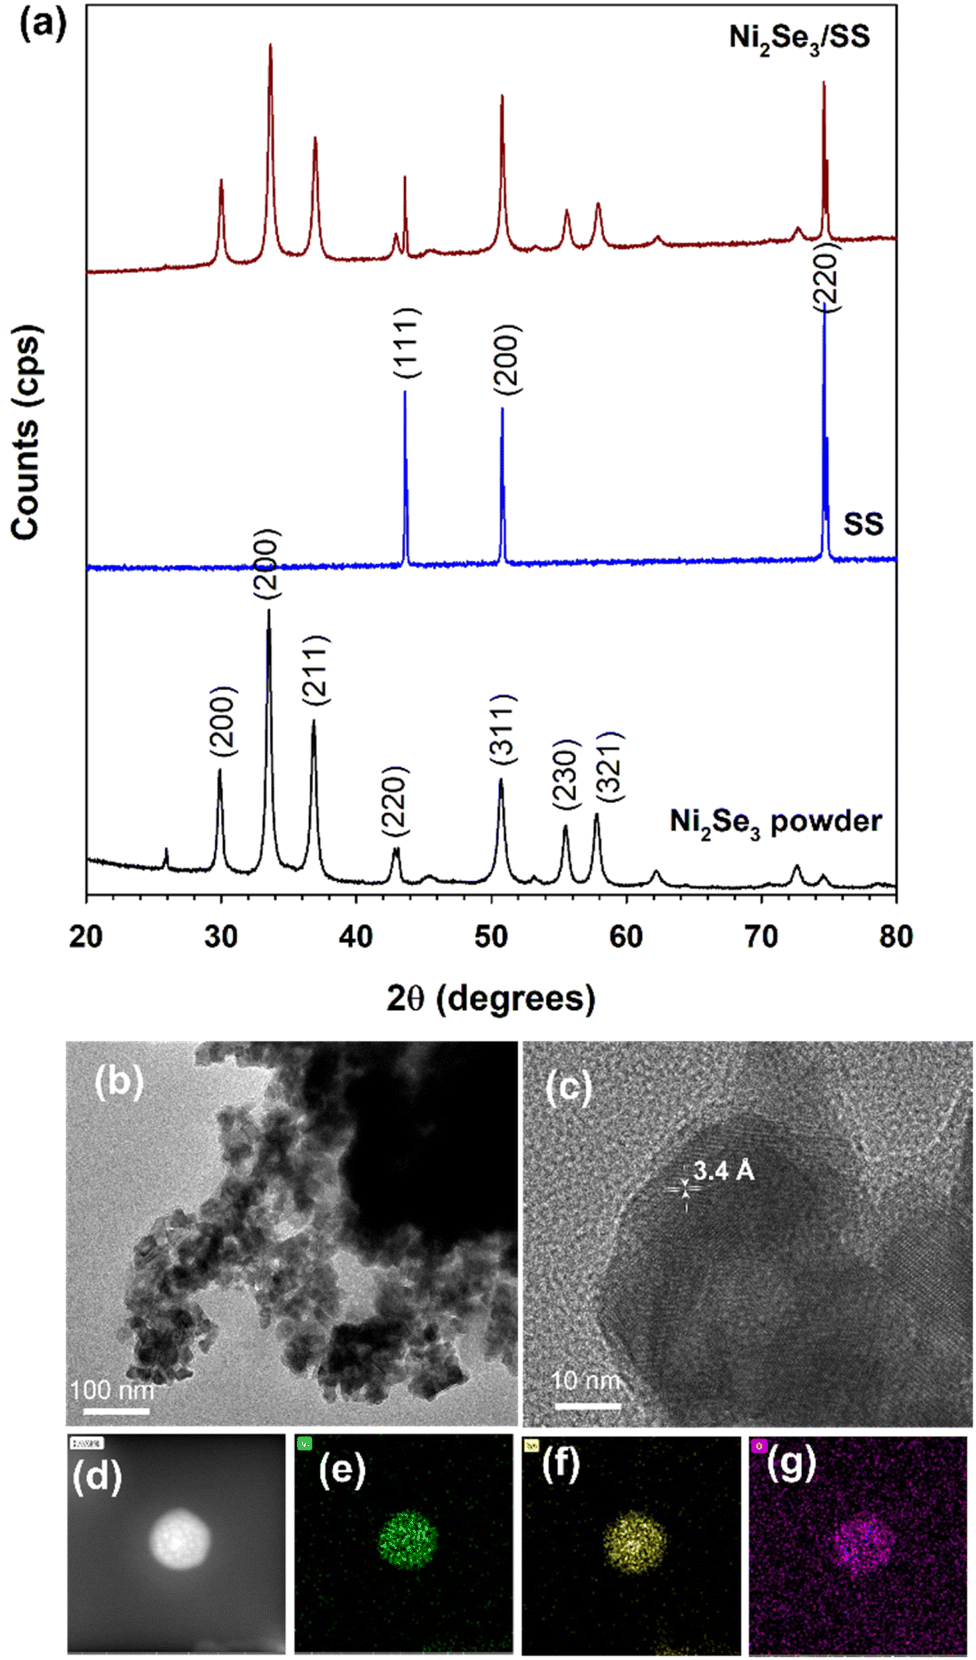 | ||
| Fig. 1 (a) XRD pattern of Ni2Se3 powder, stainless steel substrate (SS) and Ni2Se3 coated SS (Ni2Se3/SS). HRTEM images of Ni2Se3 powder (b) at 100 nm scale and (c) 10 nm scale. (d) Elemental mapping of Ni2Se3 uniformly dispersing the elements of (e) Ni, (f) Se and (g) O. | ||
The chemical environment of the as-synthesised Ni2Se3 powder was analysed with XPS. The full-scan spectrum of NiSe2 (Fig. 2a) confirmed the presence of Ni, Se, C, and O. The high-resolution of Ni 2p (Fig. 2b) shows that the characteristic peaks at 852.3 and 869.3 eV were attributed to Ni2+, and the peaks located at 854.4 and 872.3 eV were originated from Ni3+.31–33 The Ni3+ most likely originated from the surface oxide phase. In addition, the broad peaks centred at 859.5 and 878.9 eV could be assigned to the satellite peaks (labelled as sat. in Fig. 2b). The Se 2d spectra displayed the characteristic peaks at 54.5 eV and 55.1 eV which correspond to Se 3d5/2 and Se 3d3/2, respectively, indicated the existence of Se2− (Fig. 2b).
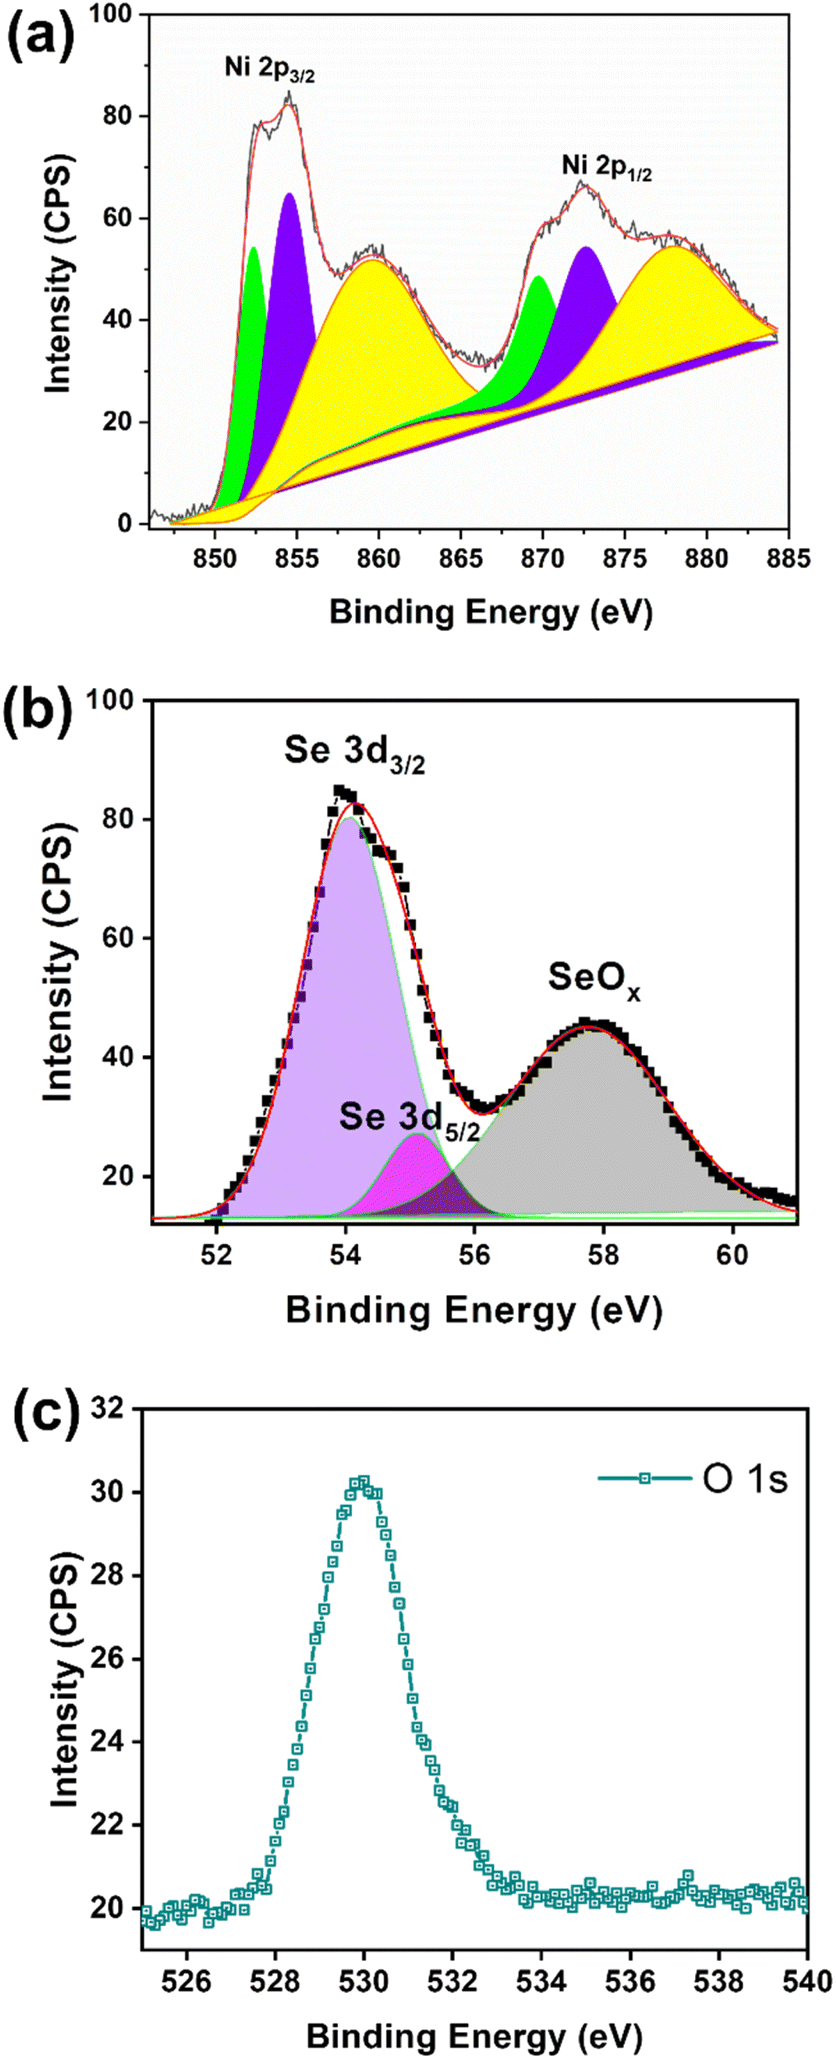 | ||
| Fig. 2 (a) High resolution of Ni 2p, (b) Se 3d, and (c) O 1s spectra of XPS using the as-synthesized Ni2Se3 powder sample. | ||
Meanwhile, the broad peak located at 57.8 eV confirmed the oxidation state of Se.34,35 The peak at 531.8 eV (Fig. 2c) was attributed to the oxygen of metal oxides, which may have resulted from the surface oxidising after exposure to air.36
The electrocatalytic activity of the Ni2Se3 anode was analysed in two different electrolytes, namely fresh water (NaOH solution only) and distillery wastewater (distillery wastewater and NaOH). To compare the performance, J–V plots obtained from linear sweep voltammetry of SS and Ni2Se3/SS electrodes in the presence of different anolyte were studied. During the process of water splitting for O2 generation, an applied potential is employed in the cell. This potential initiates the oxidation of water molecules on the anode, resulting in the production of O2.
Simultaneously, the by-product protons (H+) are transported to the cathode surface through the membrane. At the cathode, the protons undergo reduction and combine with electrons supplied by the circuit, generating H2. The water splitting reactions occurring at the anode and cathode (alkaline environment) can be explained by the following reactions (eqn (2)–(4)):37,38
| Cathode: 2H2O + 2e− → H2 + 2OH− (E0 = −0.83 V vs. SHE) | (2) |
| Anode: 2OH− → H2O + 2e− + ½O2 (E0 = 0.4 V vs. SHE) | (3) |
| Overall: H2O → H2 + ½O2 | (4) |
These reactions elucidate the fundamental processes taking place during water electrolysis, in which the electrocatalytic activity of Ni2Se3 was crucial in enhancing the efficiency of these reactions. The current density generated by electrochemical cells indicate the electrocatalytic efficiency of the catalysts in O2 and H2 evolutions through OER and HER reactions (eqn (1) and (2)), respectively. Notably, the Ni2Se3/SS electrode (Fig. 3) exhibits a significantly higher current density of 223 mA cm−2 compared to the pristine SS electrode (146 mA cm−2) in freshwater-based electrolyte, evidencing Ni2Se3 possessed superior OER activity. In particular, the Ni2Se3 catalyst reduced the overpotential of the pristine SS electrode from approximately 410 mV (@10 mA cm−2) to 240 mV (@10 mA cm−2), effectively demonstrating its efficacy in facilitating water oxidation reactions. Furthermore, the current density of Ni2Se3 experiences a notable improvement of ∼21%, reaching 282 mA cm−2 at 2.1 V RHE in distillery industry wastewater, compared to the freshwater-based electrolyte (223 mA cm−2 at 2.1 V RHE). The increase in current density was attributed to the presence of organic moieties in the distillery wastewater that was evidenced using nuclear magnetic resonance (NMR) analysis (ESI Fig. S2a†). The current enhancement in distillery wastewater electrolyte was further examined by conducting cyclic voltammetry (CV) in the potential region between 0.9–1.9 V vs. RHE (Fig. 3b). Subsequently, we compare the CV results of Ni2Se3/SS anode using both freshwater and distillery wastewater electrolytes (Fig. 4).
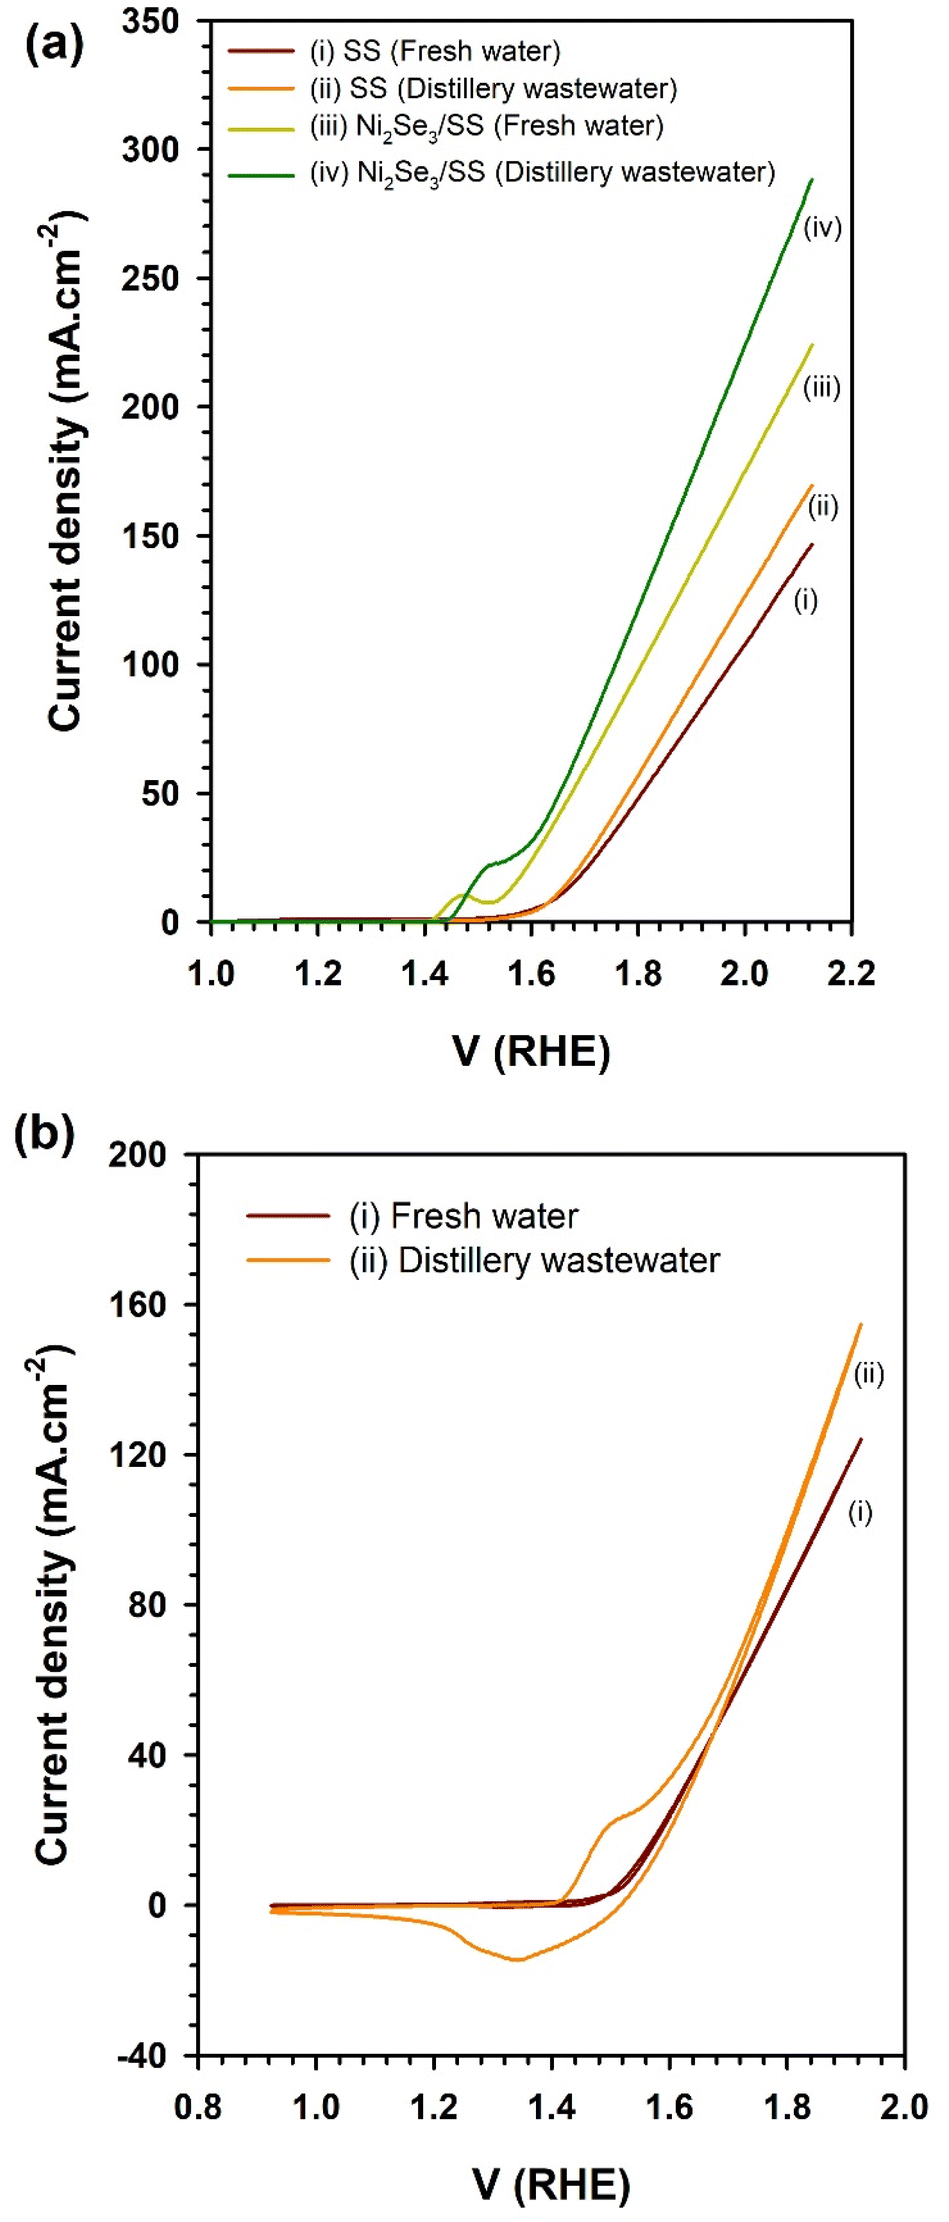 | ||
| Fig. 3 (a) Linear sweep voltammogram results of stainless steel and Ni2Se3 nanoparticles coated stainless steel substates in freshwater and distillery wastewater electrolyte. (b) CV of Ni2Se3/SS anode in freshwater and distillery wastewater-based electrolyte. Note that the concentration of the electrolyte was 1 M NaOH. | ||
 | ||
| Fig. 4 Tafel plots of Ni2Se3 in freshwater and distillery wastewater electrolytes. | ||
A strong oxidation peak around 1.5 V RHE in the distillery wastewater-based electrolyte, which was absent in the freshwater electrolyte, was observed. This peak was attributed to the presence of acetate species in the distillery wastewater, which underwent an anodic oxidation reaction. It was proposed that when in contact with the electrocatalyst, acetate undergoes oxidation, generating oxidative electrons that significantly contribute to H2 production by enhancing the rate of proton reduction at the cathode:39
| 2CH3COO− → 2CO2 + C2H6 + 2e− | (5) |
| At the cathode: 2H+ + 2e− → H2 | (6) |
An alternative route for acetic acid oxidation, where acetic acid oxidation yields 8e− (eqn (7))40 and these oxidative electrons transfer to the cathode via the external circuit, which effectively reduces the protons under alkaline conditions, contributing to H2 generation (eqn (6)).
| CH3COO− + 6OH− → 2CH4 + 4O2 + H+ + 8e− | (7) |
The proton diffusion coefficient (Dn) of distillery wastewater was estimated using CV plots at different scan rates (Fig. S4†) and determined using the following relation (eqn (8)).
| Ip = 2.69 × 10⁵ × n3/2 × A × D1/2 × C × ν1/2 | (8) |
To compare the water oxidation performance of Ni2Se3 in with the commercial RuO2, we conducted LSV tests (as illustrated in Fig. S4†) under identical alkaline conditions, using a freshwater-based electrolyte. The current density of Ni2Se3 (Fig. S4†) reveals that it was comparable, particularly at higher applied potentials around 2 V RHE, when compared to the commercial RuO2 catalyst. It's worth mentioning that RuO2 is not the most ideal water oxidation candidate for demonstrating in alkaline electrolysis, as indicated by the Pourbaix diagram.41
The concentration of organic species (acetic acid) within the water significantly influences the overall performance of hydrogen generation during water splitting.42,43 To investigate this effect, LSV tests were conducted using a Ni2Se3/SS anode in three distinct distillery water electrolytes: DW1, DW2, and DW3. These samples were collected at different stages of the water treatment process at the distillery industry site. The LSV results for DW1, DW2, and DW3 are presented in Fig. S5.† The data clearly indicates variations in current density across the distillery wastewater samples. This disparity in the current density was attributed to differences in the concentration of organic matter and the presence of heavy metals, such as copper, in the wastewater. Hence, the critical factor determining H2 generation performance was the specific stage at which the samples were collected at the distillery water treatment site.
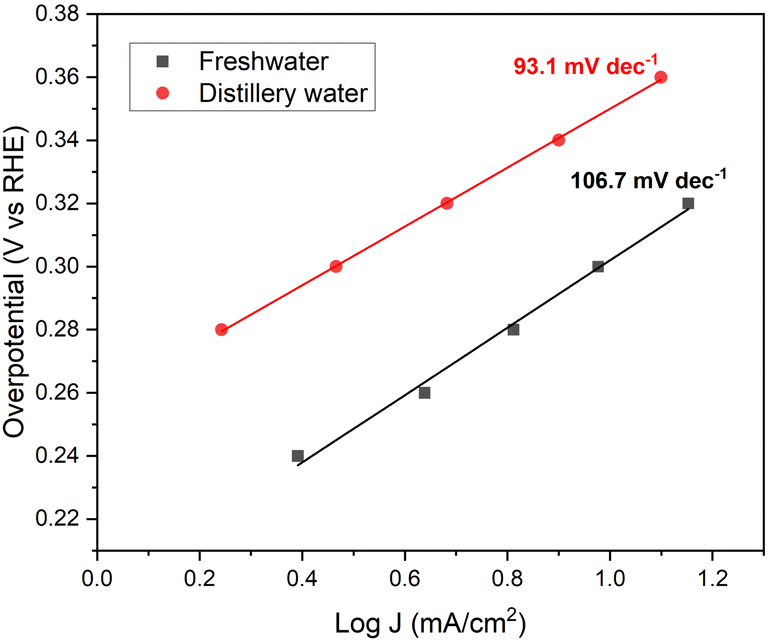
Tafel analysis is an invaluable tool that provides insights into both the activity and kinetics of electrochemical reactions simultaneously.44,45 By plotting logJ vs. V overpotential (RHE) (Fig. 4), the Tafel slope offers valuable information about the catalyst's self-oxidation and double-layer charging effects.46 Additionally, Tafel slope data allows one to determine the required increase in overpotential to enhance the reaction rate by a factor of ten. In the case of Ni2Se3, the Tafel slope (Fig. 4) was estimated through chronoamperometry experiments. Notably, in distillery wastewater electrolyte, the Tafel slope of Ni2Se3 is significantly reduced to 93.1 mV dec−1, compared to the freshwater-based electrolyte (106.7 mV dec−1). This reduction suggests an improved performance of Ni2Se3 as an oxygen evolution reaction (OER) catalyst when operating in distillery wastewater. Furthermore, when compared to the conventional OER catalyst PtC (120 mV dec−1) in literature, the lower Tafel slope value of synthesised Ni2Se3 nanoparticles in the current work implies the potential of catalyst quality.47 Nonetheless, when comparing the Tafel slope values of Ni2Se3 with those reported in previous literature, it becomes evident that there is room for further enhancement in the quality of Ni2Se3. This improvement can be achieved through various approaches, including careful substrate selection, innovative doping techniques, and the meticulous design of nanostructures. These strategies, as discussed in references, offer avenues for optimizing the performance and efficiency of Ni2Se3 catalysts.48–53 A recent review conducted by Anantharaj et al.54 has presented a comprehensive comparison of Tafel slope values of nickel selenide in electrochemical water oxidation reactions. Their findings revealed that Tafel values fall within the range of 24 to 128 mV dec−1 across various nanostructures, substrates, and electrolyte conditions. These results demonstrated the influence of different electrolyte compositions on the Tafel slope values of Ni2Se3 catalyst, emphasising the importance of considering the electrolyte conditions for optimizing the catalyst's performance in specific applications.
Electrochemical Impedance Spectroscopy (EIS) is a valuable tool for gaining insights into charge transfer resistance at electrode/electrolyte interfaces involved in electrochemical reactions.55,56 It offers a means to understand the various components contributing to resistance, such as the catalyst,57 electrolyte,58 and membrane,59 and how they collectively impact overall water splitting performance. In our current study, we employ EIS to investigate the reasons behind the superior current density achieved with distillery wastewater-based electrolytes in comparison to freshwater-based electrolytes. The EIS measurement was presented in Nyquist plots (Fig. 5) from the electrochemical cells featuring Ni2Se3/SS anodes and Ni foam cathode with different electrolytes. The impedance measurements were conducted at the open circuit potential (OCP), a state in which the catalyst's effect does not significantly impact the overall resistance of the cells. The diameter of the semicircles depicted in Fig. 5 corresponds to the charge transfer resistance values of the electrode/electrolyte interfaces. A wider semicircle signifies higher resistance, whereas a narrower one indicates lower resistance. In this context, the distillery wastewater-based electrolysis exhibited notably lower charge transfer resistance than its freshwater counterpart. This phenomenon was attributed to the presence of organic substances and potentially copper particles in the distillery wastewater, both of which contribute to lowering the overall electrolyte resistance. The lower electrolyte resistance is one of the reasons for the enhanced electrochemical performance in distillery water-based electrolytes.
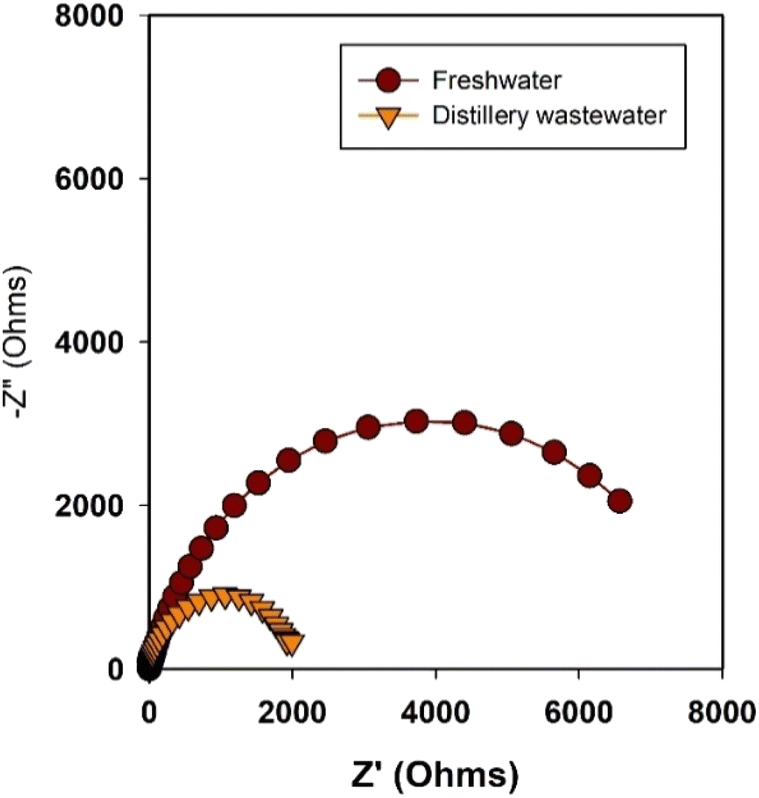 | ||
| Fig. 5 Nyquist plots of Ni2Se3 (anode) and Ni mesh (cathode) in both freshwater and distillery wastewater electrolytes. It is important to note that impedance measurements were conducted at open circuit potential. | ||
The recovery of H2 generation from wastewater pollutants treatment is an innovative approach in recent times. Notably, a wastewater electrolysis cell opens pathways for decentralised H2 production with simultaneous on-site wastewater treatment.60,61 The current density and corresponding H2 production exhibited from the electrochemical cell with a Ni2Se3 anode is presented in Fig. 6. Though Ni2Se3 has shown higher current density in distillery wastewater-based electrolyte, an aggressive bubbling effect was observed at the cathode over time (see the Video in ESI†), This had the effect of reducing the catalytic activity of the Ni cathode in the production of H2. As a result, the cell using freshwater electrolyte produced 0.37 mL min−1; whereas distillery wastewater-based cell resulted in 0.25 mL min−1. Overall, Ni2Se3 coated SS electrode was capable to produce ∼13 mL h−1 cm−2 of H2 from distillery wastewater. In the case of O2 evolution at anode compartment, we observed distillery waste-based electrolyte produces higher oxygen evolution than fresh water based electrolyte (Fig. S6†). This is most likely due to the reduction of acetate (CH3COO−), which was formed after mixing NaOH into the distillery waste solution that contains notable amounts acetic acid, forming CH4 and O2 as illustrated in eqn (3). As a result, distillery wastewater produced three times the amount of CH4 than that of freshwater, and a continuous evolution of O2 throughout the electrocatalytic measurement, which could be observed in the NMR (0.23 ppm in 1H NMR) and GC (Fig. S2B†), respectively.
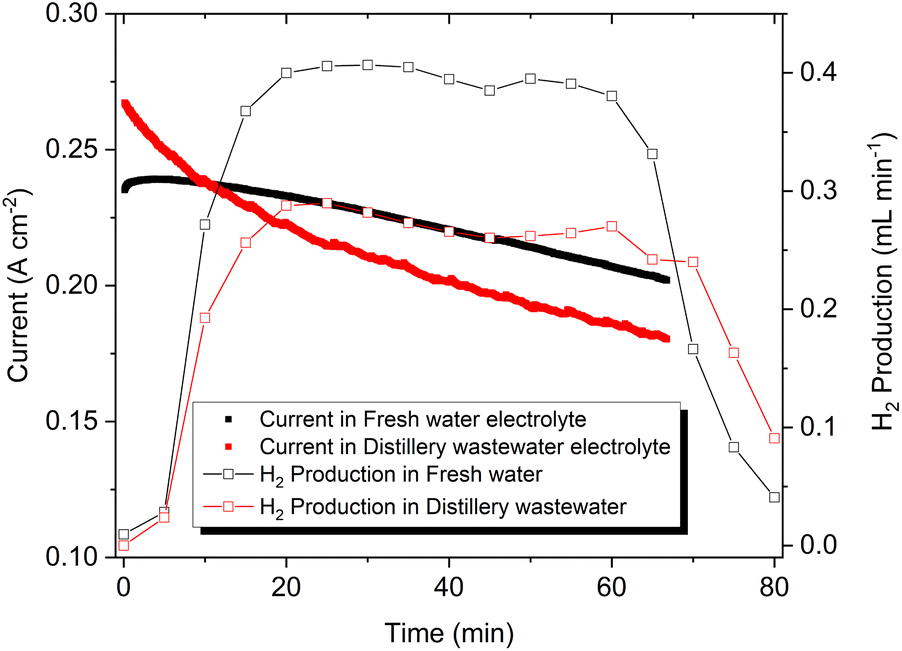 | ||
| Fig. 6 H2 generation of Ni2Se3/SS electrodes using fresh water (black) and distillery wastewater based electrolyte (red). Note that the concentration of electrolytes was 1.0 M NaOH. | ||
To assess the stability of the Ni2Se3/SS electrode in water oxidation reactions, a chronopotentiometry experiment was conducted at a current density of 10 mA cm−2. Fig. S7† illustrates that the cell potential remained notably stable around 1.6 V RHE for a duration of 12 hours. This observation suggests that the Ni2Se3/SS electrode exhibited high stability when it exposed in distillery wastewater-based electrolyte. Following the completion of the 12 h chronoamperometry studies, we conducted a surface examination of the Ni2Se3/SS anode under SEM (Fig. S8a and b†). The SEM images reveal a slight increase in the size of the Ni2Se3 nanoparticles after the electrochemical reaction. This phenomenon was attributed to two factors: (a) the formation of a thin oxidation layer, SeO2, during the reactions. (b) The agglomeration effect on the particles. Notably, despite these changes, there was no significant accumulation of particulate matter on the surface of the Ni2Se3 catalyst before or after the reaction. This observation underscored the significant surface stability of Ni2Se3 against electrochemical corrosion reactions, particularly in its ability to oxidise the organic substances present in the distillery wastewater (Fig. 3).
For a comprehensive assessment of catalytic performance and scalability potential, it is more informative to focus on a key metric: the turnover frequency (TOF). This metric quantifies the rate at which molecules (such as H2 and O2 in the context of water splitting) are produced per second per active site while maintaining a specific overpotential. In the present work, this approach is crucial for comparing the intrinsic catalytic activity of Ni2Se3 in freshwater and distillery water. As a pivotal measure in catalysis, the TOF per active Ni2Se3 site under freshwater and distillery water was computed for the OER, assuming 100% faradaic efficiency, and is presented in the accompanying Fig. 7. The TOF of oxygen generation using Ni2Se3/SS anode can be estimated using the relation:62,63
| TOF = [total oxygen turnovers (cm−2)/active sites density] | (9) |
| Active sites density = (number of active sites × ECSA) | (10) |
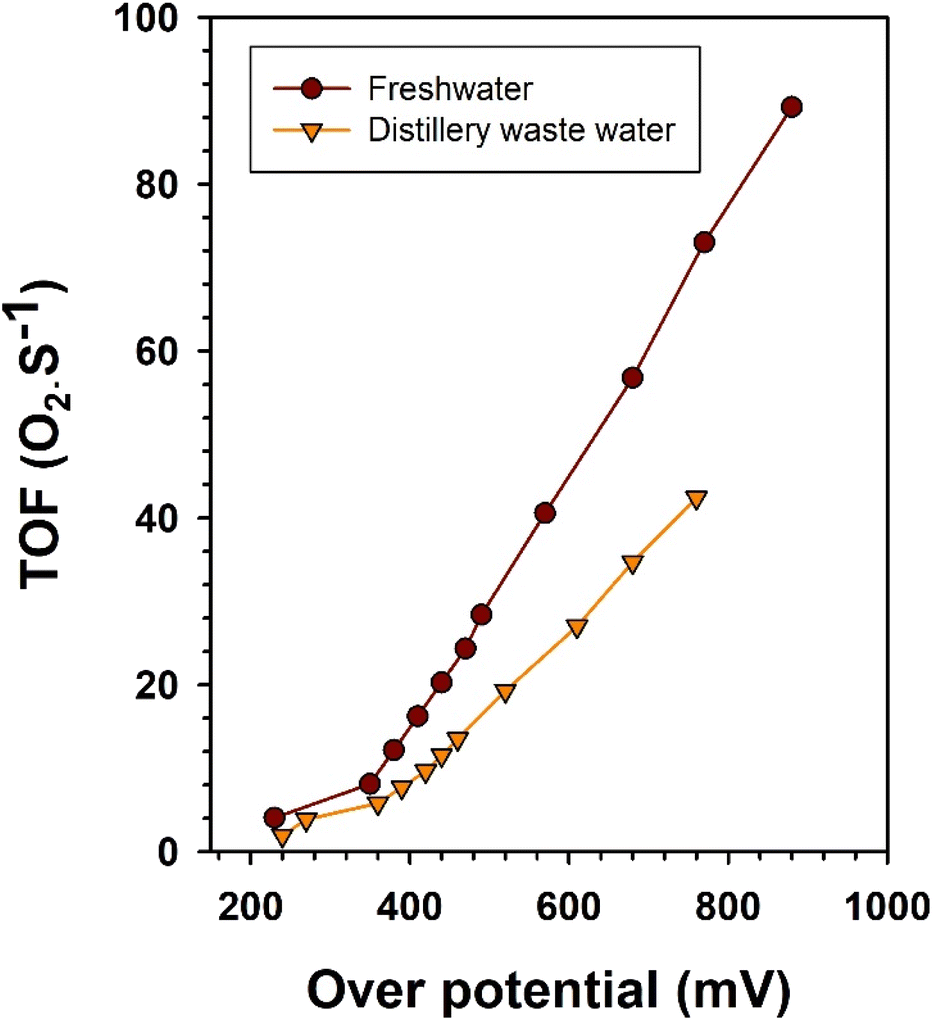 | ||
| Fig. 7 TOF of Ni2Se3/SS anode in electrolytic oxygen generation performance in fresh water and distillery wastewater. | ||
A detailed estimation of total oxygen turnovers can be found in ESI.† ECSA calculations were performed using the following equation:
| ECSA = (CDL)/Cs | (11) |
Ni2Se3/SS anode exhibited a significantly higher TOF in freshwater when compared to distillery wastewater (Fig. 7). This observation suggested that Ni2Se3 has a notable capacity to catalyse the electrochemical oxidation of water molecules for oxygen generation at its active sites. In contrast, the lower TOF observed in distillery wastewater suggested a reduced capacity for oxygen generation. This could be attributed to the presence of competitive catalytic activities that favoured the oxidation of organic molecules, hampering the electrochemical water oxidation process.
We have comparatively analysed the electrocatalytic performance of Ni2Se3 synthesized in this study with recent reports on nickel selenide-based anodes, which were synthesized through different techniques, used in water splitting reactions (Table 1). Notably, the Ni2Se3, which was synthesized via the solvothermal method, exhibited a significantly lower overpotential of 240 mV compared to other counterparts.
| Catalyst | Synthesis technique | Coating surface | Reference electrode | Electrolyte | Overpotential (mV) measured @ 10 mA cm−2 | References |
|---|---|---|---|---|---|---|
| NiSe2 | Chemical vapour deposition | Glassy carbon | Ag/AgCl | 1 M KOH | 230 | 65 |
| NiSe/NiOx | Solvothermal | Ni foam | Hg/HgO | 1 M KOH | 243 | 66 |
| NiSe | Electrodeposition | Au coated glass | Hg/HgO | 1 M KOH | 290 | 67 |
| NiSe2 | Solvothermal | Glassy carbon | Ag/AgCl | 1 M KOH | 378 | 68 |
| NiSe2/MoSe2 | Hydrothermal/selenization | Glassy carbon | Hg/HgO | 1 M KOH | 295 | 69 |
| NiSe2/NiO nanosheet | Selenization | Glassy carbon | Hg/HgO | 1 M KOH | 300 | 70 |
| NiSe-2 | Electrodeposition | Ni foam | SCE | 1 M KOH | 252 | 71 |
| NiSe@Ni | Electrodeposition/selenization | Stainless steel | Ag/AgCl | 1 M KOH | 290 | 72 |
| Ni2Se3 | Solvothermal | Stainless steel | Hg/HgO | 1 M NaOH | 240 | Present work |
It is worth to note that when handling distillery wastewater, several considerations should be considered. Firstly, it is important to note that freshly collected distillery water samples tend to yield higher H2 production due to the potential presence of alcohol molecules, which may evaporate into the atmosphere. To mitigate this, one of the recommended practices is to store the distillery samples at freezing temperatures to preserve the alcohol content. Additionally, conducting experiments involving varied temperatures can provide valuable insights into the impact of temperature on current density enhancement. Exploring the effects of temperature variations in electrochemical experiments could help to uncover the potential strategies for optimising H2 production. Additionally, it is crucial to further test this electrolyte in a flow cell type setup. Such testing would help address critical issues related to electrolyte evaporation and any other associated challenges that may arise in practical applications. Flow cell configurations allow for continuous operation and can provide insights into the long-term stability and performance of the electrolyte, helping to assess its feasibility for scalable sustainable H2 production from distillery wastewater. Furthermore, analysing the distillery wastewater after electrolysis can provide valuable information regarding the recovery of value-added products. Although this aspect is beyond the scope of the present study, investigating the potential recovery of valuable substances from the electrolyzed wastewater could be a worthwhile avenue for future research. Moreover, it is worth mentioning that the electrochemical activity of the NiSe nanoscale catalyst can be further improved through various approaches. These approaches can include modifying the coating method on steel substrates and exploring the use of highly conducting substrates as alternatives to steel.
To mitigate the bubbling effect at the cathode, effective approaches involve the incorporation of ultrasonic treatment73 or cavitation treatment74 at the cathode. For instance, a study conducted by Ehrnst and colleagues73 showcased an enhancement in the HER performance. This improvement stems from the intense local electromechanical coupling induced by acoustic forcing. This acoustic influence disrupts the tetrahedrally-coordinated hydrogen bond network of water molecules at the electrode–electrolyte interface. Consequently, it leads to the generation of a higher concentration of “free” water molecules, making them more accessible to catalytic sites on the unmodified polycrystalline electrode. By optimizing these factors, the performance and efficiency of the NiSe catalyst can be enhanced for future applications.
4 Conclusions
In conclusion, our study successfully synthesised nanoscale Ni2Se3 catalysts through a solvothermal method and evaluated their performance as water oxidation catalysts in electrolysis H2 generation, using both freshwater and distillery industry wastewater. Notably, the nano scale Ni2Se3 catalyst coated on a SS electrode exhibited a significantly higher current density in distillery industry wastewater-based electrolytes compared to NaOH. At an applied potential of 0.75 V Hg/HgO, it demonstrated the production of approximately 13 mL h−1 of H2, with a relatively stable performance. However, it is essential to acknowledge the challenges posed by the presence of bubbles on the anode and cathode surfaces, resulting from biomass oxidation and reduction processes. These bubbles have a significant impact on sustainable H2 generation. To address this issue, the implementation of bubble removal techniques (ultrasonic treatment, cavitation), in conjunction with the electrolyser, show a promising and forward-thinking approach to safeguard the electrode surface and ensure long-term sustainability. Furthermore, future research endeavours could focus on conducting additional experiments to analyse the by-products generated after the electrolytic oxidation of distillery wastewater. Such investigations would provide valuable insights into the pathways of the oxidation process at the anode. This work contributes to the advancement of utilizing biomass industry wastewater as a feedstock for the electrolysis process, thereby reducing the extensive freshwater footprint associated with green H2 generation. Our findings underscore the potential of harnessing alternative and sustainable resources in the pursuit of clean and eco-friendly energy solutions.Author contributions
SP conceived the idea, acquired funding, and wrote, reviewed and edited the manuscript. MW performed materials synthesis, electrochemical and analytical experiments and drafted the manuscript. JZYT demonstrated the materials characterisation, product analysis and gas quantification analysis and writing. SN, JA, and helped with the data analysis and proofreading.Conflicts of interest
There are no conflicts to declare.Acknowledgements
SP thanks Heriot-Watt University for start-up grant support. JZYT acknowledges UKRI ISCF Industrial Challenge within the UK Industrial Decarbonisation Research and Innovation Centre (IDRIC) award number: EP/V027050/1 for partially supporting this research work.References
- F. P. Colelli, J. Emmerling, G. Marangoni, M. N. Mistry and E. D. Cian, Nat. Commun., 2022, 13, 4964 CrossRef CAS.
- B. J. van Ruijven, E. D. Cian and I. S. Wing, Nat. Commun., 2019, 10, 2762 CrossRef.
- J. A. Turner, Science, 2004, 305, 972–974 CrossRef CAS PubMed.
- J. Jia, L. C. Seitz, J. D. Benck, Y. Huo, Y. Chen, J. W. D. Ng, T. Bilir, J. S. Harris and T. F. Jaramillo, Nat. Commun., 2016, 7, 13237 CrossRef CAS PubMed.
- M. Wang, Z. Wang, X. Gong and Z. Guo, Renewable Sustainable Energy Rev., 2014, 29, 573–588 CrossRef CAS.
- S. G. Simoes, J. Catarino, A. Picado, T. F. Lopes, S. di Berardino, F. Amorim, F. Gírio, C. M. Rangel and T. Ponce de Leão, J. Cleaner Prod., 2021, 315, 128124 CrossRef CAS.
- S. Pitchaimuthu, K. Sridharan, S. Nagarajan, S. Ananthraj, P. Robertson, M. F. Kuehnel, Á. Irabien and M. Maroto-Valer, Energies, 2022, 15, 7399 CrossRef CAS.
- R. R. Beswick, A. M. Oliveira and Y. Yan, ACS Energy Lett., 2021, 6, 3167–3169 CrossRef CAS.
- Y. Chen, Nat. Rev. Earth Environ., 2022, 3, 604 CrossRef.
- K. R. Davies, M. G. Allan, S. Nagarajan, R. Townsend, V. Asokan, T. Watson, A. R. Godfrey, M. M. Maroto-Valer, M. F. Kuehnel and S. Pitchaimuthu, Ind. Eng. Chem. Res., 2023, 62, 19084–19094 CAS.
- K. R. Davies, M. G. Allan, S. Nagarajan, R. Townsend, T. Dunlop, J. D. McGettrick, V. S. Asokan, S. Ananthraj, T. Watson, A. R. Godfrey, J. R. Durrant, M. M. Maroto-Valer, M. F. Kuehnel and S. Pitchaimuthu, J. Environ. Chem. Eng., 2023, 11, 110256 CrossRef CAS.
- K. Cho, D. Kwon and M. R. Hoffmann, RSC Adv., 2014, 4, 4596–4608 RSC.
- B. Jones, K. R. Davies, M. G. Allan, S. Anantharaj, I. Mabbett, T. Watson, J. R. Durrant, M. F. Kuehnel and S. Pitchaimuthu, Sustainable Energy Fuels, 2021, 5, 3084–3091 RSC.
- C. Edwards, C. C. McNerney, L. A. Lawton, J. Palmer, K. Macgregor, F. Jack, P. Cockburn, A. Plummer, A. Lovegrove and A. Wood, Resour., Conserv. Recycl., 2022, 179, 106114 CrossRef CAS PubMed.
- J. S. White, K. L. Stewart, D. L. Maskell, A. Diallo, J. E. Traub-Modinger and N. A. Willoughby, ACS Omega, 2020, 5, 6429–6440 CrossRef CAS.
- R. Price, L. MacDonald, N. Gillies, A. Day, E. Brightman and J. Li, Faraday Discuss., 2023, 247, 270–290 RSC.
- C. Duffy, D. Styles, I. Schestak, K. Macgregor, F. Jack, D. Henn, K. Black and P. P. M. Iannetta, J. Cleaner Prod., 2023, 395, 136436 CrossRef.
- B. M. Hunter, H. B. Gray and A. M. Müller, Chem. Rev., 2016, 116, 14120–14136 CrossRef CAS PubMed.
- F.-Y. Chen, Z.-Y. Wu, Z. Adler and H. Wang, Joule, 2021, 5, 1704–1731 CrossRef CAS.
- Y. Wang, L. Zhang, K. Yin, J. Zhang, H. Gao, N. Liu, Z. Peng and Z. Zhang, ACS Appl. Mater. Interfaces, 2019, 11, 39728–39736 CrossRef CAS.
- Y. Liu, Y. Guo, Y. Liu, Z. Wei, K. Wang and Z. Shi, Energy Fuels, 2023, 37, 2608–2630 CrossRef CAS.
- H. Ren, Z.-H. Huang, Z. Yang, S. Tang, F. Kang and R. Lv, J. Energy Chem., 2017, 26, 1217–1222 CrossRef.
- J. Yin, J. Jin, H. Lin, Z. Yin, J. Li, M. Lu, L. Guo, P. Xi, Y. Tang and C.-H. Yan, Advanced Science, 2020, 7, 1903070 CrossRef CAS.
- Y. Wang, B. Yu, M. He, Z. Zhai, K. Yin, F. Kong and Z. Zhang, Nano Res., 2022, 15, 4820–4826 CrossRef CAS.
- A. T. Swesi, J. Masud, W. P. R. Liyanage, S. Umapathi, E. Bohannan, J. Medvedeva and M. Nath, Sci. Rep., 2017, 7, 2401 CrossRef.
- J. Zhang, Y. Wang, C. Zhang, H. Gao, L. Lv, L. Han and Z. Zhang, ACS Sustain. Chem. Eng., 2018, 6, 2231–2239 CrossRef CAS.
- S. Anantharaj, S. Kundu and S. Noda, J. Mater. Chem. A, 2020, 8, 4174–4192 RSC.
- C. Wang, W. D. Wu, Y. Wang, D. Xu and F. Yan, New J. Chem., 2017, 41, S2 Search PubMed.
- Z. Zhuang, Q. Peng, J. Zhuang, X. Wang and Y. Li, Chem.–Eur. J., 2006, 12, 211–217 CrossRef CAS.
- R. Andaveh, A. Rouhaghdam, J. Ai, M. Maleki, K. Wang, A. Seif, G. B. Darband and J. Li, Appl. Catal., B, 2023, 325, 122355 CrossRef CAS.
- Y. Zhang, Y. Liu, M. Ma, X. Ren, Z. Liu, G. Du, A. M. Asiri and X. Sun, Chem. Commun., 2017, 53, 11048–11051 RSC.
- J. Yang, Z. Sun, J. Wang, J. Zhang, Y. Qin, J. You and L. Xu, CrystEngComm, 2019, 21, 994–1000 RSC.
- M. Zhu, Q. Yan, Y. Xue, Y. Yan, K. Zhu, K. Ye, J. Yan, D. Cao, H. Xie and G. Wang, ACS Sustain. Chem. Eng., 2021, 10, 279–287 CrossRef.
- M. Zhu, D. Zhang, Q. Lu, Y. Yan, K. Zhu, K. Ye, J. Yan, D. Cao, Q. Wang, X. Huang and G. Wang, Int. J. Hydrogen Energy, 2021, 46, 20524–20533 CrossRef CAS.
- J.-N. Huang, B. Wen, J.-G. Zhu, Y.-S. Zhang, J.-Z. Gao and Z.-Z. Chen, Sci. Total Environ., 2020, 733, 138929 CrossRef CAS.
- Y. Du, G. Cheng and W. Luo, Catal. Sci. Technol., 2017, 7, 4604–4608 RSC.
- Y. Li, L. Zhou and S. Guo, EnergyChem, 2021, 3, 100053 CrossRef CAS.
- C. Huang, J. Zhou, D. Duan, Q. Zhou, J. Wang, B. Peng, L. Yu and Y. Yu, Chin. J. Catal., 2022, 43, 2091–2110 CrossRef CAS.
- S. D. Ross, M. Finkelstein and R. C. Petersen, J. Am. Chem. Soc., 1964, 86, 4139–4143 CrossRef CAS.
- D. Karakashev, D. J. Batstone, E. Trably and I. Angelidaki, Appl. Environ. Microbiol., 2006, 72, 5138–5141 CrossRef CAS PubMed.
- K. Du, L. Zhang, J. Shan, J. Guo, J. Mao, C.-C. Yang, C.-H. Wang, Z. Hu and T. Ling, Nat. Commun., 2022, 13, 5448 CrossRef CAS.
- B. You, X. Liu, N. Jiang and Y. Sun, J. Am. Chem. Soc., 2016, 138, 13639–13646 CrossRef CAS PubMed.
- T. Kahlstorf, J. N. Hausmann, T. Sontheimer and P. W. Menezes, Global chall., 2023, 7, 2200242 CrossRef.
- T. Shinagawa, A. T. Garcia-Esparza and K. Takanabe, Sci. Rep., 2015, 5, 13801 CrossRef PubMed.
- R. Sanchis-Gual, A. Seijas-Da Silva, M. Coronado-Puchau, T. F. Otero, G. Abellán and E. Coronado, Electrochim. Acta, 2021, 388, 138613 CrossRef CAS.
- S. Anantharaj, S. Noda, M. Driess and P. W. Menezes, ACS Energy Lett., 2021, 6, 1607–1611 CrossRef CAS.
- Y.-Y. Sun, M.-Y. Jiang, L.-K. Wu, G.-Y. Hou, Y.-P. Tang and M. Liu, Sustainable Energy Fuels, 2020, 4, 582–588 RSC.
- Z. Feng, L. Ren, Y. Liu and B. Gao, J. Solid State Electrochem., 2023, 27, 1469–1476 CrossRef CAS.
- S. Dutta, A. Indra, Y. Feng, T. Song and U. Paik, ACS Appl. Mater. Interfaces, 2017, 9, 33766–33774 CrossRef CAS PubMed.
- C. Tang, N. Cheng, Z. Pu, W. Xing and X. Sun, Angew. Chem., Int. Ed., 2015, 54, 9351–9355 CrossRef CAS.
- O. A. Oyetade and R. J. Kriek, Electrocatalysis, 2020, 11, 35–45 CrossRef CAS.
- C. An, Y. Wang, P. Jiao, S. Wu, L. Gao, C. Zhu, J. Li and N. Hu, Catalysts, 2022, 12, 1055 CrossRef CAS.
- B. Singh and A. Indra, Chem.–Asian J., 2020, 15, 607–623 CrossRef CAS.
- S. Anantharaj and S. Noda, Int. J. Hydrogen Energy, 2020, 45, 15763–15784 CrossRef CAS.
- S. Anantharaj and S. Noda, ChemElectroChem, 2020, 7, 2297–2308 CrossRef CAS.
- S. Wang, J. Zhang, O. Gharbi, V. Vivier, M. Gao and M. E. Orazem, Nat. Rev. Methods Primers, 2021, 1, 41 CrossRef CAS.
- A. R. C. Bredar, A. L. Chown, A. R. Burton and B. H. Farnum, ACS Appl. Energy Mater., 2020, 3, 66–98 CrossRef CAS.
- L. Zhu, P. Yang, W. Lyu, Q. Wang and K. Wang, Int. J. Electrochem. Sci., 2022, 17, 22099 CrossRef CAS.
- Y. Jing and B. P. Chaplin, J. Membr. Sci., 2016, 511, 238–249 CrossRef CAS.
- H. Park, C. D. Vecitis and M. R. Hoffmann, J. Phys. Chem. C, 2009, 113, 7935–7945 CrossRef CAS.
- H. Park, C. D. Vecitis and M. R. Hoffmann, J. Phys. Chem. A, 2008, 112, 7616–7626 CrossRef CAS PubMed.
- A. Karmakar and S. Kundu, Mater. Today Energy, 2023, 33, 101259 CrossRef CAS.
- J. Kibsgaard and T. F. Jaramillo, Angew. Chem., Int. Ed., 2014, 53, 14433–14437 CrossRef CAS.
- R. Andaveh, A. S. Rouhaghdam, J. Ai, M. Maleki, K. Wang, A. Seif, G. B. Darband and J. Li, Appl. Catal., B, 2023, 325, 122355 CrossRef CAS.
- I. H. Kwak, H. S. Im, D. M. Jang, Y. W. Kim, K. Park, Y. R. Lim, E. H. Cha and J. Park, ACS Appl. Mater. Interfaces, 2016, 8, 5327–5334 CrossRef CAS.
- R. Gao, G.-D. Li, J. Hu, Y. Wu, X. Lian, D. Wang and X. Zou, Catal. Sci. Technol., 2016, 6, 8268–8275 RSC.
- U. De Silva, J. See, W. P. R. Liyanage, J. Masud, J. Wu, W. Yang, W.-T. Chen, D. Prendergast and M. Nath, Energy Fuels, 2021, 35, 4387–4403 CrossRef CAS.
- S. K. Ramesh, V. Ganesan and J. Kim, ACS Appl. Energy Mater., 2021, 4, 12998–13005 CrossRef CAS.
- C. Yin, F. Yang, S. Wang and L. Feng, Chin. J. Catal., 2023, 51, 225–236 CrossRef CAS.
- Z. Liu, C. Zhang, H. Liu and L. Feng, Appl. Catal., B, 2020, 276, 119165 CrossRef CAS.
- Z. Feng, H. Zhang, L. Wang, B. Gao, P. Lu and P. Xing, J. Electroanal. Chem., 2020, 876, 114740 CrossRef CAS.
- Y.-Y. Sun, Y.-X. Zhu, L.-K. Wu, G.-Y. Hou, Y.-P. Tang, H.-Z. Cao and G.-Q. Zheng, Electrochim. Acta, 2020, 353, 136519 CrossRef CAS.
- Y. Ehrnst, P. C. Sherrell, A. R. Rezk and L. Y. Yeo, Adv. Energy Mater., 2023, 13, 2203164 CrossRef CAS.
- A. Angulo, P. van der Linde, H. Gardeniers, M. Modestino and D. F. Rivas, Joule, 2020, 4, 555–579 CrossRef CAS.
Footnote |
| † Electronic supplementary information (ESI) available: Details of SEM, CV, NMR, results. See DOI: https://doi.org/10.1039/d3se01445b |
| This journal is © The Royal Society of Chemistry 2024 |