
 Open Access Article
 This Open Access Article is licensed under a
 Creative Commons Attribution 3.0 Unported Licence
Quantification of extracrystalline acid sites in MFI zeolites after post-synthetic passivation treatments using mesitylene benzylation kinetics†
Sopuruchukwu
Ezenwa
 ,
Geoffrey M.
Hopping
,
Eric D.
Sauer
,
Teah
Scott
,
Savanna
Mack
and
Rajamani
Gounder
*
,
Geoffrey M.
Hopping
,
Eric D.
Sauer
,
Teah
Scott
,
Savanna
Mack
and
Rajamani
Gounder
*
Davidson School of Chemical Engineering, Purdue University, West Lafayette, IN 47907, USA. E-mail: rgounder@purdue.edu
First published on 25th January 2024
Abstract
Brønsted acid sites (H+) located at extracrystalline surfaces of zeolites influence catalyst reactivity, selectivity, and deactivation behavior. The number of extracrystalline H+ sites is difficult to quantify reliably using spectroscopic or titrimetric techniques when present in dilute quantities, such as after post-synthetic surface passivation treatments. Here, methods to quantify extracrystalline H+ sites on MFI zeolites were developed by measuring the kinetics of mesitylene benzylation with dibenzyl ether to form 1,3,5-trimethyl-2-benzylbenzene, which is sterically prevented from forming at intracrystalline H+ sites within microporous voids. These methods were applied to investigate MFI zeolite samples that were systematically treated using ammonium hexafluorosilicate (AHFS) with varying treatment durations, AHFS concentrations, and numbers of successive treatment cycles. Rates of mesitylene benzylation with dibenzyl ether (363 K) were measured on a suite of MFI samples with known amounts of external H+ sites (0.01–0.15 H+ext/Al), quantified by 2,6-di-tertbutylpyridine titration, to determine the intrinsic zero-order rate constant for mesitylene benzylation (per H+ext). Quantification of zero-order rate constants on post-synthetically treated MFI zeolites shows that AHFS treatments selectively passivate extracrystalline H+ sites with efficacies that depend on the specific treatment conditions used. The kinetic methods developed here enable quantifying extracrystalline acid sites in amounts below the detection limits of common spectroscopic and titration techniques on various small-pore and medium-pore zeolites, enabling assessments of the efficacy of post-synthetic surface passivation treatments and rigorous evaluation of the reactivity of extracrystalline H+ sites during acid catalysis.
1. Introduction
Zeolites are microporous crystalline aluminosilicates containing framework anionic centers generated upon lattice Si4+ substitution with Al3+ ([AlO4/2]−), which provide charge-compensation for Brønsted acid sites (H+) and metal cations (Mn+) or complexes (e.g., [MxOy]n+) that behave as catalytic active sites for upgrading hydrocarbons and oxygenates to higher value chemicals and fuels.1–3 The location of active sites within internal microporous voids (<2 nm diameter) or at extracrystralline (also referred to as “external”) unconfined crystallite surfaces4,5 influences catalytic reactivity, because microporous voids impose constraints on molecular access to internal active sites, as described by shape selectivity concepts,6 and provide van der Waals contacts that influence the stabilities of reactive intermediates and transition states, as described by confinement effects.7 The relative amount of external H+ sites (H+ext) to internal acid sites depends on various material properties, including the bulk Si/Al ratio, crystallite size and morphology, and extent of Al zoning (i.e., Al concentration gradients from the crystallite core to its surface), all of which are influenced by synthetic and post-synthetic conditions.5,8,9 Aluminosilicate MFI zeolites (Al-MFI) have a three-dimensional, ten-membered ring (10-MR) pore structure (∼0.55 nm pore limiting diameter), wherein external acid sites are thought to lower para-dialkylbenzene product selectivity during toluene alkylation with methanol10–12 or ethanol13,14 (573–873 K) because unselective toluene alkylation or dialkylbenzene isomerization pathways occur at unconfined surfaces. During butene oligomerization in Al-MFI (1.5 MPa, 573 K), initial rates correlated with the number of external acid sites, while secondary reactions (e.g., isomerization, cracking, dehydrocyclization) at external acid sites were suggested to increase the selectivity to lighter hydrocarbons and favor the deposition of bulky carbonaceous species.15 External acid sites in Al-MFI zeolites were also inferred to accelerate coke deposition rates on external surfaces during the conversion of methanol to hydrocarbons (743 K).16 Furthermore, the location of MoOx precursors and MoCx active sites on external surfaces of Mo/Al-MFI was shown to lead to lower methane conversion rates, lower selectivity to C2–C6 hydrocarbons and faster deactivation rates during methane dehydroaromatization (950–973 K).17–19 Taken together, these studies demonstrate that methods to alter the number of external acid sites of MFI zeolites can be used to influence reactivity, selectivity and deactivation during catalysis.Various strategies have been explored to passivate the external acid sites of Al-MFI zeolites. The coating of Al-MFI crystallites with inert layers of crystalline or amorphous silica has been reported to passivate external acid sites12,18–21 and result in increased para-xylene selectivity during toluene methylation (623–673 K).12,20 However, coating Al-MFI using silica layers also imposes additional diffusion resistance at the crystallite exterior, favoring egress of the faster diffusing para-xylene isomer (over ortho- and meta-xylene) formed within micropores during toluene methylation.20,22,23 The poisoning of external acid sites using bulky alkylpyridine bases (e.g., 4-methylquinoline) has also been reported to increase para-xylene selectivity during toluene methylation (673 K).10 Furthermore, post-synthetic chemical treatments with ammonium hexafluorosilicate (AHFS) have been used to passivate external acid sites in Al-MFI zeolites.24–27 Silva et al. used AHFS to treat Al-MFI samples having similar bulk and surface Al contents (measured via X-ray Photoelectron Spectroscopy (XPS)) and obtained modified samples with similar bulk Al and H+ contents but slightly decreased surface Al content.24 During meta-xylene reactions (623 K), AHFS-treated samples exhibited similar meta-xylene isomerization rates as the parent MFI samples, but slightly higher para-xylene/ortho-xylene product ratios and lower meta-xylene disproportionation rates.24 The selective dealumination of external surfaces without significant changes to diffusion pathlength was proposed to suppress isomerization or disproportionation reactions involving bulkier intermediates and transition states, which are sterically hindered within micropores.24 In another study, Han et al. treated Al-MFI using AHFS solutions and observed a ∼30% decrease in bulk Al and H+ contents but a ∼45% decrease in external H+ content, as estimated by selective titration of external H+ sites by tetrapropylammonium and 4-(phenylazo)-l-naphthylamine.25 The authors further reported that the passivated MFI samples resulted in products from propene oligomerization (500 K) that had improved viscosity index because of reduced branching in the C20+ fraction, due to suppression of isomerization and cracking side-reactions at external acid sites.25 Although these studies indicated preferential removal of external Al (and associated H+) sites on MFI zeolites during AHFS treatments, systematic studies are needed to determine how AHFS treatment conditions quantitatively influence the extent of external H+ site removal.
The extent of external H+ site removal during AHFS treatments is not precisely known, in part because of well-known limitations in quantifying low amounts of external acid sites using currently available techniques. Interpretations of XPS data remain largely qualitative, because quantitative assessments are limited by low signal-to-noise ratios (for surface Si/Al > 100) and the XPS sampling depth (up to 10 nm, or ∼5 MFI unit cells),5,21,28 and provide an upper-bound estimate of the number of H+ sites if all Al are assumed to be in framework locations. Alternative techniques using adsorption of bulky Brønsted base titrants (e.g., 2,6-di-tert-butylpyridine, DTBP)9,21,29,30 followed by quantification via infrared (IR) spectroscopy, nuclear magnetic resonance (NMR) spectroscopy, thermogravimetry or temperature-programmed desorption (TPD) allow the direct quantification of external H+ acid sites, but are limited to MFI samples with significant amounts of external acid sites (>10 μmol H+ext g−1; Scheme S1, ESI†) because of equipment detection limits on reliable quantification.9,21,30 Therefore, techniques that allow for direct and reliable quantification of external acid sites in Al-MFI zeolites, especially when present at low concentrations, will provide insights into the efficacy of surface passivation techniques and facilitate assessments of the catalytic consequences of external acid sites in MFI of different origin.31 Catalytic reactions provide an option to accurately quantify, via product formation rates, low concentrations of active sites that participate in large numbers of catalytic turnovers at a steady-state turnover frequency.32,33
Reactions that occur exclusively on external acid sites in Al-MFI without accessing internal acid sites are desirable as probe reactions to quantify external acid sites. The gas-phase cracking of 1,3,5-triisopropylbenzene (TIPB; kinetic diameter, dkin ∼0.90 nm) (523–673 K)9,12,21,28 has been used to probe relative external H+ contents in Al-MFI. Corma et al. fitted a pseudo first-order rate equation to TIPB conversion data on MFI samples with different amounts of external acid sites and estimated an apparent rate constant that correlated with the amount of external acid sites estimated semi-quantitatively using DTBP-IR.9 However, the use of TIPB cracking as a quantitative probe reaction for external acid sites in MFI is often limited by rapid coking during initial time-on-stream, the complex reaction network (e.g., further depropylation to benzene, olefin oligomerization and cracking, aromatic isomerization), the involvement of internal acid sites in secondary reactions, and the dearth of knowledge on the kinetic and mechanistic details and the influence of transport phenomena during such assessments. On the other hand, the liquid-phase benzylation of mesitylene (1,3,5-trimethylbenzene, TMB; dkin ∼0.70 nm kinetic diameter) with benzyl alcohol (BA; dkin ∼0.55 nm) to 1,3,5-trimethyl-2-benzylbenzene (TMB2B; dkin ∼0.75 nm) has been reported to occur exclusively (343–393 K) on external acid sites in MFI zeolites, because bulky TMB molecules are unable to diffuse into the micropores of MFI under the reaction conditions.34–40 Conditions of excess TMB relative to BA (TMB![[thin space (1/6-em)]](https://www.rsc.org/images/entities/char_2009.gif) :BA molar ratios > 30:1) are often assumed to lead to a pseudo-first-order dependence on BA concentration, and the intrinsic first-order mesitylene benzylation rate constant (per H+ext; quantified by in situ DTBP titration of acid sites during ethanol dehydration34,35 or by 2,4,6-trimethylpyridine TPD36) was shown to vary within 3× for various MFI samples possessing conventional, nanosheet or hierarchical structures. The parallel self-etherification of BA to dibenzyl ether (DBE; dkin ∼0.60 nm) and H2O was also shown to occur on both internal and external H+ sites of MFI, but with rates that were significantly influenced by intracrystalline transport constraints.34,36,37,39 However, at increasing BA conversions (>10%), the contribution of mesitylene benzylation with DBE to TMB2B formation rates becomes non-negligible, and current knowledge is limited about the intrinsic differences between BA and DBE as benzylating agents.35,36,39 A follow-up study reported that rates of mesitylene benzylation with BA exhibited a negative-order dependence on BA concentration while rates of BA self-etherification (343 K) approached a zero-order dependence with increasing BA concentrations.40 Although these latter studies show that mesitylene benzylation is an appropriate reaction to probe the reactivity of external H+ sites and is useful in evaluating properties of hierarchical zeolites, further developments in methodology are needed to use mesitylene benzylation kinetics as a convenient probe to quantify external H+ sites on MFI zeolites of varied synthetic or post-synthetic treatment histories under conditions that lead to steady-state turnover rates and are independent of reactant concentrations.
:BA molar ratios > 30:1) are often assumed to lead to a pseudo-first-order dependence on BA concentration, and the intrinsic first-order mesitylene benzylation rate constant (per H+ext; quantified by in situ DTBP titration of acid sites during ethanol dehydration34,35 or by 2,4,6-trimethylpyridine TPD36) was shown to vary within 3× for various MFI samples possessing conventional, nanosheet or hierarchical structures. The parallel self-etherification of BA to dibenzyl ether (DBE; dkin ∼0.60 nm) and H2O was also shown to occur on both internal and external H+ sites of MFI, but with rates that were significantly influenced by intracrystalline transport constraints.34,36,37,39 However, at increasing BA conversions (>10%), the contribution of mesitylene benzylation with DBE to TMB2B formation rates becomes non-negligible, and current knowledge is limited about the intrinsic differences between BA and DBE as benzylating agents.35,36,39 A follow-up study reported that rates of mesitylene benzylation with BA exhibited a negative-order dependence on BA concentration while rates of BA self-etherification (343 K) approached a zero-order dependence with increasing BA concentrations.40 Although these latter studies show that mesitylene benzylation is an appropriate reaction to probe the reactivity of external H+ sites and is useful in evaluating properties of hierarchical zeolites, further developments in methodology are needed to use mesitylene benzylation kinetics as a convenient probe to quantify external H+ sites on MFI zeolites of varied synthetic or post-synthetic treatment histories under conditions that lead to steady-state turnover rates and are independent of reactant concentrations.
Here, we perform systematic studies to determine the effects of AHFS treatment conditions on bulk structural properties and numbers of external acid sites of MFI zeolites and build upon previous studies34,36 to develop mesitylene benzylation kinetics as a characterization method to quantify the extent of external acid site removal in MFI zeolites after different passivation treatments. Three commercially available MFI zeolite samples are studied to facilitate benchmarking41 to prior work and show that variations in AHFS treatment conditions have minimal effects on the bulk microporosity and mesoporosity and bulk Al and H+ contents of the two MFI samples, but result in significant changes in the bulk Al and H+ contents and mesoporosity of the third MFI sample. Liquid-phase batch reactor kinetic studies are used to obtain initial rates (per Altotal) of mesitylene benzylation with DBE or BA and show that measured rates have an apparent zero-order dependence on DBE and BA concentrations. After eliminating the influence of extracrystalline transport limitations on measured rates, measured reaction orders are interpreted using mechanism-derived rate equations. Optimal conditions for this probe reaction involve mesitylene benzylation with DBE in the zero-order kinetic regime to avoid the parallel self-etherification reactions and secondary TMB–DBE reactions during mesitylene benzylation with BA, eliminate the rate dependence on reactant concentrations, and further constrain the diffusion of the bulkier benzylating agent from extracrystalline fluid phases to intracrystalline phases. Measured zero-order mesitylene benzylation rate constants (per Altotal) are regressed against independently measured concentrations of external acid sites (per Altotal) on certain MFI samples, used to calibrate the intrinsic zero-order mesitylene benzylation rate constant (per H+ext), which is then used to quantify external acid sites on AHFS-treated samples with measurable mesitylene benzylation rates but external acid sites too dilute in quantity to reliably permit their direct titration.
2. Experimental
2.1. Post-synthetic treatment of MFI zeolites using ammonium hexafluorosilicate
Three MFI samples (CBV 2314, Lot #2493-39; CBV3024E, Lot #2493-75; CBV 8014, Lot #2493-47) were obtained commercially from Zeolyst International in their NH4-form. Methods to treat MFI samples using AHFS solutions were adapted and modified from the literature,24,25,42–44 which are based on methods introduced by Skeels and Breck.45,46 First, desired concentrations of AHFS and ammonium acetate solutions were prepared. In an example treatment for Zeolyst CBV2314, for a desired 1:1 molar ratio of Si (in AHFS) to Al (in zeolite), or SiAHFS/Alzeolite = 1, 0.24 g of AHFS (NH4SiF6; Sigma Aldrich, 99.999%) was dissolved with deionized water (18.2 MΩ cm) in a 50 cm3 polypropylene copolymer volumetric flask (Thermo Scientific Nalgene ASTM Class B) to obtain 50 cm3 of 0.27 M AHFS solution [safety: in addition to basic lab PPE (goggles, gloves, lab coat), additional PPE (thicker gloves, face shield) and engineering controls (e.g., fume hood) are recommended when working with large quantities (>100 mL) and high concentrations (>5 wt%) of certain fluoride containing solutions such as AHFS. Compatible materials (polypropylene, high-density polyethylene or Teflon) are recommended for handling or containing such solutions. Glass-based materials (e.g., borosilicate, quartz) are not recommended for handling AHFS solutions. Follow proper disposal guidelines for used or excess AHFS solutions]. In a separate Pyrex glass volumetric flask, 15.15 g of ammonium acetate (NH4CH3COO; Sigma Aldrich, 99.99%) was dissolved in deionized water to obtain 250 cm3 of 0.8 M ammonium acetate solution. Then, 1.0 g of NH4-MFI (Zeolyst CBV 2314; Lot #249339) was added to 250 cm3 of 0.8 M ammonium acetate solution in a 500 cm3 perfluoroalkoxy alkane (PFA) jar (Savillex Corp.) and the initial pH of the mixture was 6.7 using a pH meter (measured using a Mettler Toledo SevenCompact pH Ion S220 probe). The jar containing the NH4-MFI/ammonium acetate mixture in its container was placed in a silicone oil bath preheated to 353 K and stirred with a magnetic stir bar at 300 rpm. This was followed by the dropwise addition (∼1–3 cm3 min−1) of 50 cm3 of AHFS solution to the MFI/ammonium acetate mixture using a polypropylene separatory funnel (Thermo Scientific Nalgene). Upon completion, the PFA jars were capped and held at 353 K for 4 or 48 hours. After the allotted time was completed, the solution was removed from the oil bath, cooled on a benchtop for 30–35 minutes, and the final pH was measured (ranging from 6.1–6.3, depending on the AHFS concentration). Next, the solution was decanted, the solids were washed 4 times using deionized water at ambient temperature (100 cm3 per gram zeolite per wash), and the solids were recovered via centrifugation and dried for 48 hours in an oven at 363 K under stagnant air. After drying, the zeolite was weighed for rough yield calculations, and then stored as the as-treated form (presumably in the NH4+ form) in capped borosilicate scintillation vials (VWR).
Following the outlined procedure, additional experiments were performed to vary the treatment duration (4 and 48 h) and concentration of the AHFS solution (SiAHFS/AlZeolite = 1 and 2) for Zeolyst CBV2314. For AHFS treatment of MFI samples (CBV2314, CBV3024E, and CBV8014) in multiple successive cycles, a similar procedure was also used with the exception that the starting amounts of the parent zeolites were 5 g and the volumes of AHFS and ammonium acetate solutions are reduced to 10 cm3 of AHFS solution gzeolite−1 and 100 cm3 of ammonium acetate solution gzeolite−1. The AHFS solution concentrations were adjusted to maintain SiAHFS/AlZeolite = 2 in the final treatment solution, and each cycle was run for 4 h. The final pH of the AHFS treatment solutions containing the zeolite and ammonium acetate ranged from 6.2 to 6.5. Samples were washed as described earlier and dried for 24–48 h between successive cycles. The second and third treatment cycles respectively used ∼3.5 g and ∼2.2 g of zeolite.
2.2. Characterization of MFI zeolites
X-ray diffraction (XRD) measurements were used to verify crystallographic structures on parent and as-treated forms of the MFI samples and were performed on a Rigaku SmartLab X-ray diffractometer with a Cu Kα radiation source (λ = 0.154 nm) operated at 1.76 kW. Diffraction patterns were measured from 4–40° with a step size of 0.01° and a scan rate of 0.0167° s−1. All XRD patterns are normalized such that the maximum peak intensity in each pattern is set to unity and are shown in Fig. 1a (and Fig. S1, ESI†).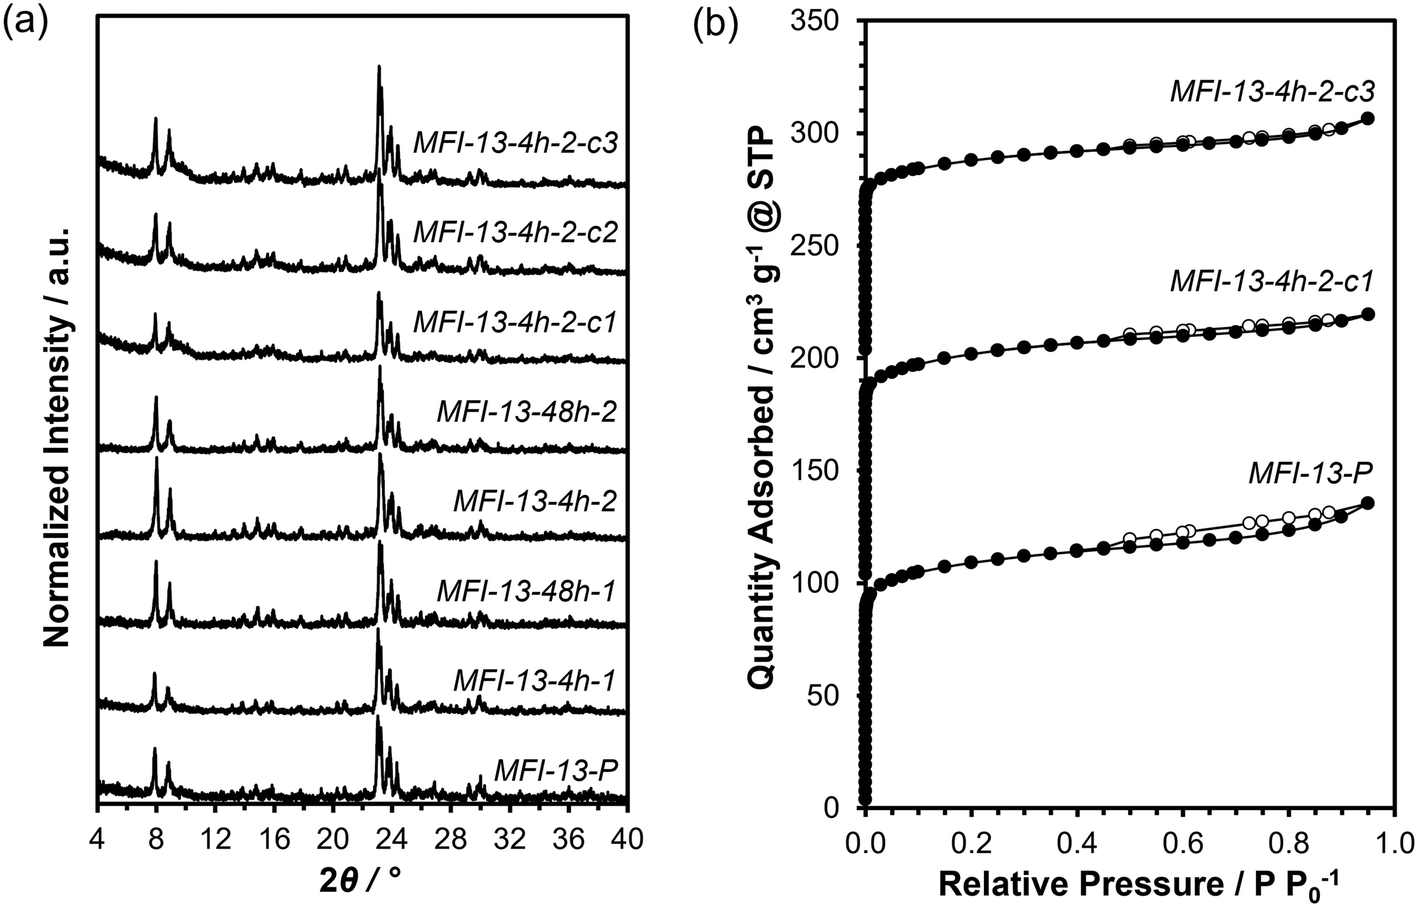 | ||
| Fig. 1 (a) Powder XRD patterns and (b) N2 adsorption (closed)–desorption (open) isotherms (77 K) of parent MFI-13 (MFI-13-P) and AHFS-treated MFI-13 (MFI-Si/Al-duration-concentration-cycle#). The isotherms were vertically offset by 100 cm3 g−1 for clarity. | ||
Prior to micropore volume measurements, parent and as-treated forms of the MFI samples were converted to the H-form by treating in flowing dry air (1.67 cm3 s−1 gzeolite−1, 99.999% UHP, Indiana Oxygen) to 773 K (0.0167 K s−1) in a muffle furnace (Nabertherm) and holding for 4 h. Micropore volumes were obtained from N2 adsorption isotherms at 77 K on a Micromeritics 3-Flex physisorption analyzer. Samples were degassed by heating to 393 K (0.167 K s−1) under vacuum (5 μmHg) for 2 h and then heated to 623 K (0.167 K s−1) under vacuum (<5 mmHg) for 9 h prior to N2 adsorption/desorption measurements. Micropore volumes were obtained by converting adsorbed gas volumes (cm3 gcat−1 at STP) to liquid volumes using a density conversion factor for liquid N2 at 77 K. Micropore volumes estimated using the extrapolation of the linear volumetric N2 uptake (0.05–0.35 P/P0) to zero pressure (i.e., t-plot method) agreed within ±15% with those estimated from the analysis of the semilogarithmic derivative plot of the isotherm ∂(Vads)/∂(ln(P/P0)) vs. ln(P/P0), where the first maximum represents the micropore filling transition and the subsequent minimum represents the end of micropore filling.47 Mesopore volumes are obtained by subtracting micropore volumes from total pore volumes measured at P/P0 = 0.95.48 N2 adsorption isotherms are shown in Fig. 1b (and Fig. S2–S3, ESI†). Micropore volumes obtained via the derivative method are summarized in Table 1 (values obtained via linear extrapolation are summarized in Table S2, ESI†).
| Samplea | Si/Altotb | Altot per unit cellc | H+tot/Altotd | V micro/cm3 g−1e | V meso/cm3 g−1f | V tot/cm3 g−1f | H+ext/Altotg | H+ext/Altoth |
|---|---|---|---|---|---|---|---|---|
| a Parent MFI samples are denoted as MFI-Si/Al-P while AHFS-treated MFI samples are denoted as MFI-Si/Al-duration-concentration-cycle# where Si/Al is the Si/Al ratio of the parent MFI sample, duration is the duration of AHFS treatment (4 h or 48 h), concentration is the SiAHFS/AlZeolite molar ratio (1 or 2), and cycle# is the number of successive treatment cycles (c1, c2, and c3; omitted for samples with only one treatment cycle). b Determined from ICP-OES. Uncertainties are ±10%, unless otherwise noted. c Calculated from elemental analysis (Si, Al) and 96 T-site unit cell. Uncertainties are ±10%, unless otherwise noted. d Determined from NH3 desorbed from NH4-form MFI and Al contents of NH4-form MFI. Uncertainties are ±15%. e Micropore volumes (Vmicro) determined from volumetric uptake of liquid N2 at the first minimum of the semilogarithmic derivative plot of the isotherm ∂(Vads)/∂(ln(P/P0)) versus ln(P/P0). Uncertainties are ±0.01 cm3 g−1, unless otherwise noted. f Mesopore volumes (Vmeso) are obtained by subtracting Vmicro from total pore volumes (Vtotal) measured at P/P0 = 0.95. Uncertainties are ±0.01 cm3 g−1, unless otherwise noted. g Determined from gas-phase adsorption of DTBP followed by flushing and TPD. Uncertainties are ±15%. h Estimated using the measured zero-order rate constant (per Altot) for mesitylene benzylation (with DBE) and the intrinsic mesitylene benzylation rate constant (per H+ext) from regressions against standard samples. Uncertainties range from ±20% to ±35%. i Values in parentheses reflect the standard deviation of the average of 3–4 replicate measurements. j Synthesized using reported methods in ref. 54 and 55. “—” indicates not measured. | ||||||||
| MFI-13-P | 12.5 (±0.5)i | 7.1 (±0.2)i | 0.74 (±0.04)i | 0.14 (±0.01)i | 0.08 (±0.01)i | 0.22 (±0.01)i | 0.010 | 0.0070 |
| MFI-13-4h-1 | 12.8 | 7.0 | 0.51 | 0.13 | 0.07 | 0.20 | — | — |
| MFI-13-48h-1 | 12.5 | 7.1 | 0.53 | 0.13 | 0.05 | 0.18 | — | — |
| MFI-13-4h-2 | 13.3 | 6.7 | 0.61 | 0.14 | 0.05 | 0.19 | — | — |
| MFI-13-48h-2 | 13.4 | 6.7 | 0.71 | 0.14 | 0.05 | 0.19 | — | — |
| MFI-13-4h-2-c1 | 13.2 | 6.8 | 0.71 | 0.13 | 0.06 | 0.19 | — | 0.0033 |
| MFI-13-4h-2-c2 | 13.5 | 6.6 | — | — | — | — | — | 0.0002 |
| MFI-13-4h-2-c3 | 14.2 | 6.3 | 0.65 | 0.12 | 0.05 | 0.17 | <0.001 | 0.0001 |
| MFI-16-P | 15.7 | 5.7 | 0.46 | 0.11 | 0.08 | 0.19 | 0.021 | 0.0016 |
| MFI-16-4h-2-c1 | 22.5 | 4.1 | 0.62 | 0.12 | 0.04 | 0.16 | — | 0.0007 |
| MFI-16-4h-2-c2 | 24.7 | 3.7 | — | — | — | — | — | — |
| MFI-16-4h-2-c3 | 26.5 | 3.5 | 0.78 | 0.10 | 0.04 | 0.14 | — | 0.0003 |
| MFI-40-P | 39.8 | 2.4 | 0.75 | 0.14 | 0.09 | 0.23 | 0.039 | 0.0298 |
| MFI-40-4h-2-c1 | 41.0 | 2.3 | 0.80 | 0.13 | 0.08 | 0.21 | — | 0.0103 |
| MFI-40-4h-2-c2 | 41.9 | 2.2 | — | — | — | — | — | — |
| MFI-40-4h-2-c3 | 42.8 | 2.2 | 0.79 | 0.14 | 0.05 | 0.19 | — | 0.0139 |
| MFI-C666j | 46.6 | 2.0 | 0.74 | 0.15 | 0.14 | 0.29 | 0.089 | 0.0778 |
| MFI-C868j | 47.8 | 2.0 | 0.73 | — | — | — | 0.146 | 0.1554 |
Elemental compositions of Si and Al were determined on the NH4-form of parent samples and as-treated forms (presumably in the NH4+ form) of their derivative samples using inductively coupled plasma-optical emission spectroscopy (ICP-OES) with a Thermo Scientific iCAP 7000 PlusSeries and are summarized in Tables 1 (and Table S1, ESI†). Zeolite samples (∼0.02 g) were dissolved in 2.5 g of hydrofluoric acid solutions (48 wt% HF solution per g zeolite; TraceMetal Grade, Fisher Chemical) and after >24 h was followed by dilution with 50 g of deionized water (18.2 MΩ cm) and addition of 1 g of HNO3 (70 wt%, SigmaAldrich) [caution: when working with concentrated HF solutions, use appropriate personal protective equipment, ventilation, and other safety precautions].
NH4+-form samples were obtained by another aqueous-phase ion-exchange of NH4-form parent samples and their as-treated (presumably in the NH4+ form) derivative samples using 150 cm3 of 1 M ammonium nitrate (NH4NO3, ≥98%, Sigma-Aldrich) solution per g of the MFI sample while stirring under ambient conditions for 24 h. Then the solution was decanted and the resulting solids were washed 4 times using deionized water at ambient temperature (100 cm3 per gram zeolite per wash) and the solids were recovered via centrifugation, dried for 48 hours in an oven at 363 K under stagnant air and stored as the NH4-form in capped borosilicate scintillation vials. The proton contents were determined by ammonia (NH3) TPD from NH4-form MFI samples using a Micromeritics Autochem II 2920 Chemisorption analyzer. Zeolite samples (∼0.05 g) were held between two quartz wool plugs in a U-shaped quartz reactor and placed in a furnace. Then, the samples were held at 313 K (0.167 K s−1) for 1 h under He flow (1.67 cm3 s−1, 99.999% UHP, Indiana Oxygen), then heated to 823 K and held for 0.5 h to desorb NH3 while the effluent gas was analyzed using an online quadrupole mass spectrometer (Cirrus 3, MKS Instruments). The total proton content on the zeolites was estimated from the total moles of NH3 desorbed assuming a 1:1 stoichiometry. The NH3-TPD profiles are shown in Fig. S4–S7 (ESI†), the total proton contents (per Altotal) are summarized in Table 1 and total proton contents (per g zeolite) are summarized in Table S1 (ESI†).
2.3. Kinetic studies of mesitylene benzylation with dibenzyl ether and benzyl alcohol
The experimental procedure for liquid-phase mesitylene benzylation batch reactor studies was adapted and modified from the literature.34,38,39 All liquid reactants were used as received and without further purification. Prior to kinetic studies, NH4-forms of MFI samples were converted to their H-forms by treating in flowing dry air (1.67 cm3 s−1 gzeolite−1, 99.999% UHP, Indiana Oxygen) to 773 K (0.0167 K s−1) in a muffle furnace (Nabertherm) and holding for 4 h. The samples (in the H-form) were pelleted, crushed, and sieved into 125–250 μm aggregates. The MFI sample (∼0.03–0.20 g; H-form) and a PTFE magnetic stir bar (VWR) were added into a 10 cm3 thick-walled glass batch reactor (VWR), sealed with a crimp top (PTFE/silicone septum, Agilent) and placed in an oil bath atop a digital stirring hot plate (IKA RCT basic) under stirring at 900 rpm. The sample was heated to 423 K (∼1 K s−1) and held for 1 h to desorb water using a syringe needle (VWR; 20 gauge) inserted through the septum. Next, the batch reactor was cooled to the reaction temperature (363 ± 1 K). In a separate 10 cm3 thick-walled glass vial on an adjacent heated stir plate, mesitylene (∼6 cm3, ≥99.0%, Thermo Scientific) was preheated to 363 K for 0.5 h and then 5.0 cm3 of preheated mesitylene was transferred using a 2.5 cm3 glass syringe (Hamilton) into the batch reactor containing the preheated sample at 363 K. After the batch reaction mixture was further preheated at 363 K for 0.5 h under stirring (900 rpm) and autogenous pressures, an aliquot (0.05–0.1 cm3) was extracted using a 1 cm3 single-use polypropylene syringe (VWR) attached with a 6′′ needle (Kemtech America) to confirm negligible secondary reactions of mesitylene (e.g., isomerization or disproportionation). The mesitylene benzylation reaction was initiated by injecting DBE (0.04–0.50 cm3, 99%, Thermo Scientific) or BA (0.05–0.20 cm3, ≥99.0%, Sigma Aldrich) into the reaction mixture using a glass syringe (0.10 cm3 or 0.50 cm3, Hamilton). The reaction mixture typically represents TMB:DBE or TMB:BA molar ratios of 14–160:1 and 19–75:1, respectively. Aliquots of the reaction mixture were collected at fixed intervals (2, 5, 10, 20, and 30 minutes after introduction of the benzylating agent), filtered with 0.2 μm PTFE filters (VWR) to separate any solid catalyst and stop the reaction, and immediately refrigerated (275 K) to further quench any residual reactions prior to subsequent analysis. The reaction times were chosen to maintain differential conversions (TMB conversion < 0.1%) and minimize effects of deactivation to facilitate kinetic analysis. The cumulative aliquot volume (<0.50 cm3) extracted from the liquid phase batch reactor amounted to <10% of the initial liquid volume (5.1–5.5 cm3).
Reaction aliquots were analyzed using a gas chromatograph (GC, Agilent 7890B) equipped with an Agilent DB-WAX polar column (30 m × 320 μm × 0.5 μm) for component (TMB, DBE, BA, TMB2B) separation before peak area quantification using a flame ionization detector (FID). A small amount (∼0.002 cm3) of each reaction aliquot was manually injected into the GC using a glass syringe (0.001 cm3, Agilent) with ∼30 rinses in a methanol/acetone solvent mixture (50/50 vol/vol) between injections. The relative areas of DBE, BA and TMB2B to TMB and the relative response factors were used to determine the concentration of each species relative to TMB (mol/mol TMB) because TMB constituted the majority (>95%) of the liquid volume throughout the mesitylene benzylation reaction, which was also run at very low TMB conversions (<0.1%). The concentrations of all species (mol m−3) were obtained using their relative concentrations to TMB and the initial molar concentration of TMB (6500–7000 mol m−3) in the total batch reaction mixture. During reactions with DBE, the minor contributions (<10%) of trace BA impurities (mol BA/mol DBE = 0.001; <0.5 mol BA impurity m−3 in the reaction mixture) was subtracted from measured BA concentrations to obtain the actual concentrations of BA produced during contact with the catalyst. We assumed an ideal solution behavior at low DBE and BA concentrations (<10 vol% in TMB) during our reaction studies. The GC-FID response factor of BA relative to TMB was determined by injecting known ratios of BA to TMB in toluene while the relative response factors of DBE and TMB2B to TMB were estimated using the effective carbon number (ECN) approach.49 The retention times of all reactant and product species as well as trace impurities in reactants (<0.5% carbon mole basis) were identified by both injecting the references and comparing the order of elution with published chromatograms from the Agilent GC column guide. Initial rates of product formation (per mol Altotal) were determined by multiplying the slope of the concentration profiles against the batch reactor time by volume of the reaction mixture divided by the total moles of Al in the catalyst.
2.4. Quantification of external acid sites using DTBP temperature programmed desorption
The number of external acid sites was obtained from MFI samples by DTBP adsorption followed by TPD according to a previously reported protocol.29 A solution (DTBP:C6H6 = 1:600) was prepared by adding 0.12 g of DTBP (≥97%, Sigma-Aldrich) to 26.4 g of C6H6 (Sigma Aldrich, HPLC grade, ≥99.9%) [caution: when working with benzene, a known carcinogen, use appropriate personal protective equipment, engineering controls, and other recommended safety precautions]. Zeolite samples (∼0.05 g; NH4+-form) were pelleted, crushed, and sieved to retain aggregates between 180 and 250 μm in diameter. The sieved samples were packed as a bed supported between two plugs of quartz wool (0.030–0.050 g) in a vertical tubular packed-bed reactor (quartz, 7 mm ID). The bed temperature was measured using a K-type thermocouple in contact with the side of the quartz tube at the level of the bed and maintained at the desired temperature using a three-zone furnace (Applied Test Systems) and Watlow temperature controllers (EZ-ZONE). Prior to adsorption studies, the packed bed was pre-treated to 773 K (0.083 K s−1) in a 5% O2/N2 flow (UHP, Indiana Oxygen, 1.67 cm3 s−1) for 4 h, and then cooled (0.333 K s−1) to adsorption temperature (354–364 K) and flushed with He (1.67 cm3 s−1, 99.999% UHP, Indiana Oxygen) for 1 h before DTBP–C6H6 was introduced.
The liquid DTBP–C6H6 mixture was introduced (6.7 × 10⁻⁵ cm3 s−1) using a syringe pump (KD Scientific Legato 100) and vaporized in a heated (473 K) low dead volume mixing tee (Valco Instruments) into a carrier stream of He (0.82 cm3 s−1, 99.999% UHP, Indiana Oxygen). The feed stream composition was stabilized for 1 h and verified from reactor bypass injections (0.15 ks sampling intervals) to an online GC (Agilent 7890B) using a DB-Wax column (30 m × 320 μm × 0.5 μm) and equipped with an FID. Heated lines upstream of the reactor were maintained at >400 K, while heated lines from the reactor outlet to GC were maintained at >430 K to prevent condensation. Then, the DTBP-C6H6-He stream was introduced into the zeolite sample until the concentration of DTBP in the reactor effluent was the same as that during bypass measurements. Following that, the DTBP-C6H6-He flow is stopped and a stream of He (0.83 cm3 s−1) from an independent flush line (not connected to syringe pump) was used to flush the reactor for 4 h to remove all physisorbed DTBP. The reactor was then heated to 873 K (0.083 or 0.167 K s−1) while the effluent was monitored until DTBP was no longer detected. The molar flow rate of DTBP in the reactor effluent was calculated using the integrated GC peak area and the GC response factor for DTBP and the total molar flow rate (≈0.83 cm3 s−1) of all species in the reactor inlet.
The external Brønsted acid content on the zeolites was estimated from the total moles of DTBP desorbed, assuming a 1:1 stoichiometry since DTBP is both unable to diffuse into MFI micropores under the adsorption conditions and unable to coordinate with Lewis acidic Al on external MFI surfaces.9,30 The total moles of DTBP desorbed during the TPD agreed within 10% with the total moles of chemisorbed DTBP obtained from the difference in the moles of DTBP adsorbed (during DTBP adsorption) and physisorbed (during He flush). The DTBP-TPD profiles are shown in Fig. S8–S13 (ESI†), external proton contents (per Altotal) summarized in Table 1 and external proton contents (per g zeolite) are summarized in Table S1 (ESI†).
3. Results and discussion
3.1. Post-synthetic AHFS treatments and characterization of MFI zeolites
In this section, we systematically investigate three commercially sourced MFI samples (Zeolyst) to determine the effects of various AHFS treatment conditions at a fixed treatment temperature (353 K) on bulk structural properties and the number of external acid sites in MFI zeolites. Parent MFI samples are denoted as MFI-Si/Al-P, while AHFS-treated MFI samples are denoted as MFI-Si/Al-duration-concentration-cycle# where Si/Al is the Si/Al ratio of the parent MFI sample (CBV 2314, CBV3024E, and CBV 8014; 13, 16, and 40, respectively), duration is the duration of AHFS treatment (4 h or 48 h), concentration is the SiAHFS/Alzeolite molar ratio (1 or 2), and cycle# is the number of successive treatment cycles (c1, c2, and c3; omitted for samples with only one treatment cycle). The effects of AHFS treatment duration and AHFS concentrations were studied on the sample with the highest Al content (MFI-13-P), while the effects of varying the bulk Si/Al and number of successive treatment cycles (at fixed durations and AHFS concentrations) were assessed on all three samples. The characterization data of the three parent samples and their derivative AHFS-treated samples are summarized in Table 1. The recovered solid yields after AHFS treatments varied between 80 and 90%, which suggests a slight loss of samples during AHFS treatment and washing steps since dissolution of zeolite crystallites or minority amorphous phases are expected to be negligible24 under the treatment conditions (pH = 6.1–6.3; 353 K, <48 h).Bulk Si/Al ratios, Al contents (per unit cell) and H+ content (per Altotal) are shown in Table 1 for MFI-13-P treated once at varying AHFS treatment durations (4 h or 48 h) and concentrations (SiAHFS/Alzeolite = 1 or 2). The bulk Si/Al slightly increased (within 7%) with increasing AHFS treatment durations or concentrations, indicating that neither bulk dealumination nor bulk silication occurred to appreciable extents during AHFS treatment of MFI-13-P. In addition, the bulk H+/Al varied non-systematically with AHFS concentration, showing a ∼30% lower value than the parent sample after treatment with low AHFS concentrations (SiAHFS/Alzeolite = 1), but only 4–17% lower values than the parent sample after treatment with AHFS concentrations (SiAHFS/Alzeolite = 2). Overall, these findings indicate that under the AHFS treatment conditions used (4–48 h, SiAHFS/Alzeolite = 1–2, 353 K), the bulk framework and acid site properties of MFI-13 are largely preserved. Next, we assess the effects of varying the bulk Si/Al and number of successive treatment cycles on the bulk structural properties and number of acid sites of MFI samples.
For the MFI-40 series, micropore volumes negligibly decreased (<10% compared to MFI-16-P; Table 1) during successive treatment cycles of MFI-40-P. However, most of the decrease in mesopore volume (∼40%) occurred between the first treatment cycle (MFI-40-4h-2-c1) and the third treatment cycle (MFI-40-4h-2-c3). Despite this decrease in mesopore volumes in the MFI-40 series, the hysteresis loop did not significantly change across treatment cycles (Fig. S3b†), which contrasts with both the decrease in hysteresis observed after one treatment cycle and subsequent elimination of hysteresis by the third treatment cycle on MFI-13-P and MFI-16-P. Taken together, we conclude that multiple cycles of AHFS treatments negligibly changed (<15%) the micropore volumes but more significantly decreased the mesopore volumes (by ∼35–50%) and attenuated the hysteresis behavior on the three commercial MFI samples studied here. These findings suggest that AHFS treatments weakly influence the bulk framework integrity but might heal vacancy defects located within intracrystallite voids or deposit silica at zeolite surfaces within intercrystallite mesoporous voids.
We further assessed the effects of multiple AHFS treatment cycles on the bulk elemental and proton contents of the MFI samples. The bulk Si/Al ratio, total Al contents (per unit cell) and H+ content (per Altotal) are summarized in Table 1. As shown in Fig. 2a, the total Al content (per unit cell) slightly decreased by a constant amount with each treatment cycle for MFI-13 (∼0.3 Al per unit cell per cycle) and MFI-40 (∼0.1 Al per unit cell per cycle), which indicates that similar amounts of Al were removed (∼10% of Al in the parent) when normalized by the bulk Al content (per unit cell) in the parent samples (7.1 for MFI-13-P and 2.4 for MFI-40-P). Nevertheless, we cannot rule out that minor changes in Al content were caused by significant silica deposition during AHFS treatments because micropore volumes (a quantitative measure of the crystalline fraction of zeolite samples) also slightly decreased (up to ∼15%) on MFI-13 and MFI-40. In contrast, the Al content on MFI-16-P significantly decreased (∼30%) after the first treatment cycle, but then decreased by a much smaller amount (∼7% per cycle) in the second and third successive AHFS treatments. This significant decrease cannot be ascribed to bulk silication since the micropore volume negligibly changed (<5%) after the first treatment cycle of MFI-16-P, but rather reflects significant bulk dealumination.
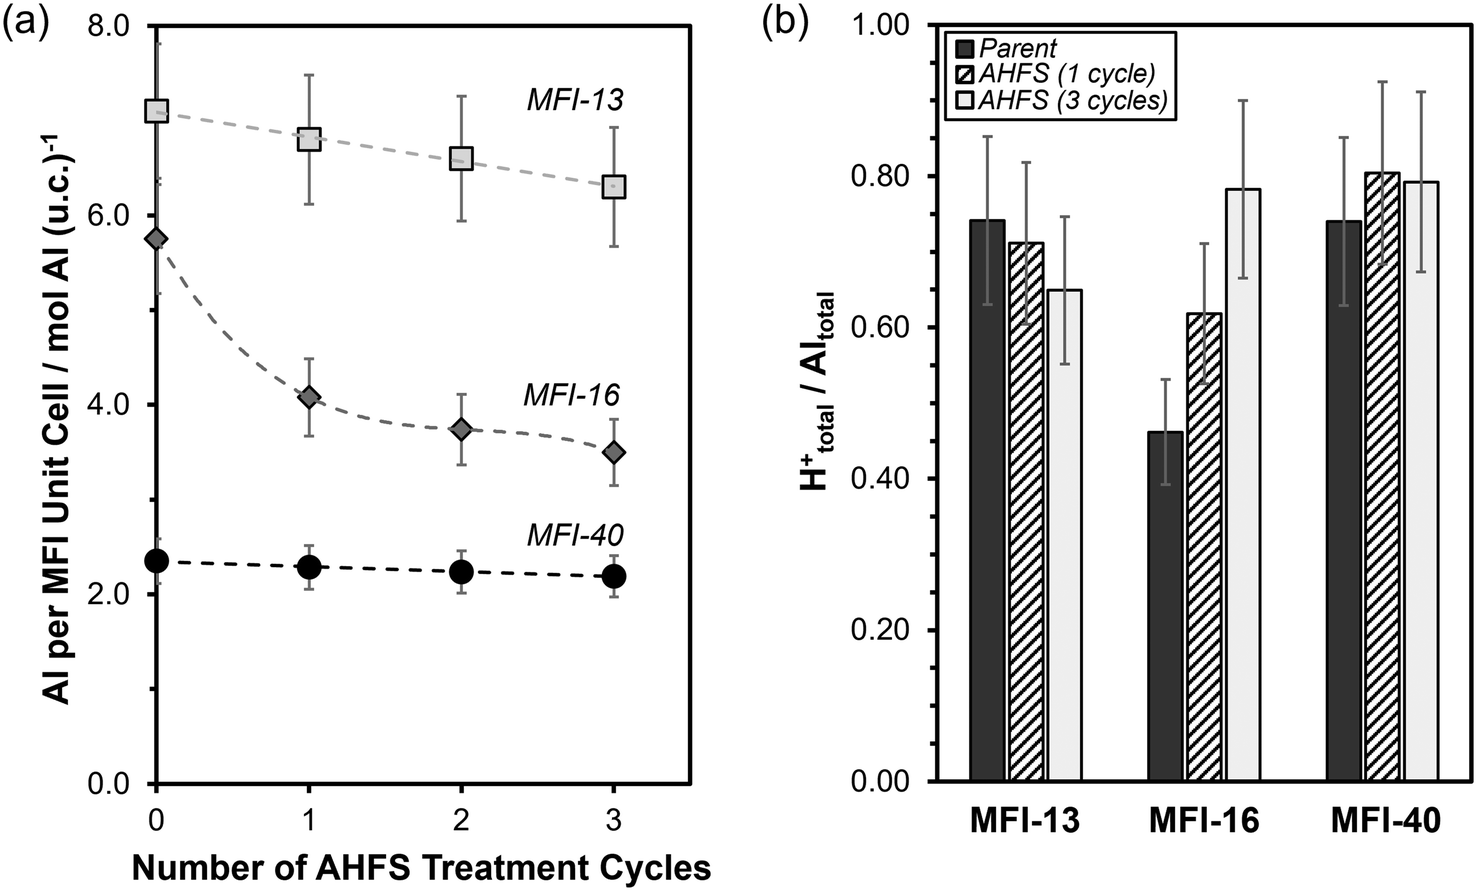 | ||
| Fig. 2 (a) Total Al content per MFI unit cell (96 T atoms) and (b) bulk H+tot/Altot molar ratio as a function of the number of AHFS-treatment cycles. Dashed lines in (a) serve to guide the eye. Error bars in (a) reflect uncertainties (±10% in (a) and ±15% in (b)). | ||
Analysis of the bulk H+/Al ratio of MFI-13 and MFI-40 during multiple treatment cycles (Fig. 2b) indicates that the relative proportion of framework Al and extraframework Al on these samples remained relatively unchanged (±0.10). However, on MFI-16, the bulk H+/Al ratio increased significantly with successive AHFS treatment cycles (Fig. 2b). This increase in bulk H+/Al ratio results from the significant decrease in bulk Al content (per g zeolite) without any change to the bulk H+ content (per g zeolite) (Table S1, ESI†) and indicates a preferential removal of extraframework Al during AHFS treatments on MFI-16. Together, these findings show that the AHFS treatments negligibly altered the total and relative amounts of framework Al and extraframework Al in the studied MFI samples (MFI-13-P, MFI-40-P), except for the sample (MFI-16-P) with significant amounts of extraframework Al (∼50% of total Al).
Our findings are largely consistent with prior reports44,52,53,56,57 on the effects of AHFS treatment (353–363 K) on the bulk structural properties of MFI zeolites. Choi and co-workers observed negligible changes to micropore and mesopore volumes, Si/Al ratios, and H+ content during AHFS treatment on MFI-40 (CBV8014, Zeolyst).56 Lercher and co-workers reported that the significant decrease in total Al content (∼45%) on MFI-16 (CBV3024E; Zeolyst) and a minor decrease in bulk proton content (∼15%) during AHFS treatment (SiAHFS/Alzeolite = 4) resulted from the preferential removal of extraframework Al.57 While probing the efficacy of selectively removing extraframework Al using AHFS treatments on MFI-16 (CBV3024E, Zeolyst), White and co-workers reported that both framework crystallinity and bulk H+ content significantly decreased at high AHFS concentrations (SiAHFS/Alzeolite = 4, 6, or 8) but were both preserved at the lower AHFS concentrations (SiAHFS/Alzeolite = 1 or 2) that led to significant removal of extraframework Al (up to ∼60%).53 More recent studies from White and co-workers have provided further insights that AHFS treatments can significantly remove partially framework-coordinated tetrahedral Al without affecting the fully framework-coordinated tetrahedral Al, and that the relative proportions of both framework Al species vary non-systematically and depend on treatment histories of MFI-13 (CBV2314), MFI-16 (CBV3024E) and MFI-40 (CBV8014).58–60 Thus, despite the significant variations in conditions of AHFS treatments as well as possible variations in actual batches of commercial MFI (Zeolyst) samples previously studied, our results taken together with those from previous reports indicate that AHFS treatments negligibly change the bulk structural integrity and framework Al and proton contents.
Although earlier studies24–26 reported that AHFS treatments selectively passivated external Brønsted acid sites in MFI zeolites either by selective replacement of Al on external surfaces with Si or deposition of Si on external surfaces, quantitative insights are lacking regarding the extent of external acid site removal during such AHFS treatments. We first used XPS (section S7, ESI†) to show that AHFS treatment can alter the Si/Al ratio of the outer rim (depth of up to 10 nm) of the MFI-13 zeolite crystallites (diameter ∼300 nm) while preserving the bulk Si/Al ratio. MFI-13-P had a bulk Si/Al ratio (12.5 ± 0.5; measured by ICP) similar to that on the outer rim (13 ± 2), while MFI-13-48h-2 had a bulk Si/Al ratio (13.4 ± 0.5) that was much lower than that on the outer rim (39 ± 8) (Table S3, Fig. S14, ESI†). We then attempted to use DTBP titration of external H+ sites, quantified via subsequent DTBP TPD, on the MFI-13 subjected to three AHFS treatment cycles (MFI-13-4h-2-c3) but the quantities of desorbed DTBP were below the detection limits (H+ext/Altot < 0.001; Table 1; section S6, Fig. S9, ESI†). This motivated the development of a catalytic technique based on insights from previous mesitylene benzylation studies34,36,39 to quantify the number of external acid sites on MFI zeolites obtained after various AHFS treatments.
3.2. Liquid-phase mesitylene benzylation kinetic measurements and mechanistic studies
In this section, we discuss kinetic measurements that show how concentrations of reactant and product species evolve with reaction time during mesitylene benzylation reactions in a liquid-phase (well-mixed) batch reactor at differential mesitylene conversions. We show how mesitylene benzylation rates (per total Al) depend on concentrations of the benzylating agent (DBE or BA) and how apparent rate constants (per total Al) differ among MFI samples before and after treatment with AHFS. We provide mechanistic insights to interpret measured mesitylene benzylation rate constants obtained under kinetically controlled conditions, and analyze reaction rates that solely reflect the product of the rate constant for the kinetically relevant mesitylene benzylation step and the total numbers of active sites in unconfined locations that are able to stabilize the required benzylation transition states.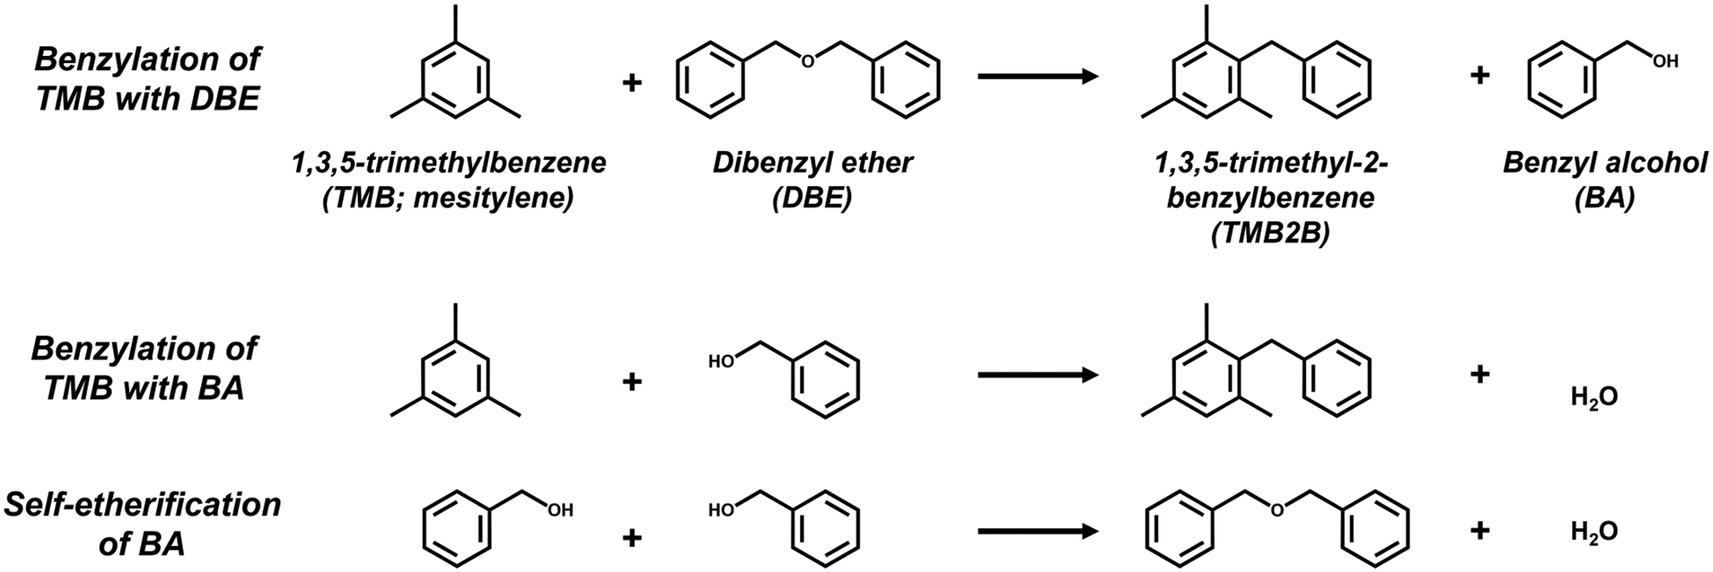 | ||
| Scheme 1 Reaction scheme for benzylation of mesitylene (TMB) with dibenzyl ether (DBE) or benzyl alcohol (BA) to form 1,3,5-trimethyl-2-benzylbenzene (TMB2B) and for self-etherification of BA to dibenzyl ether (DBE). | ||
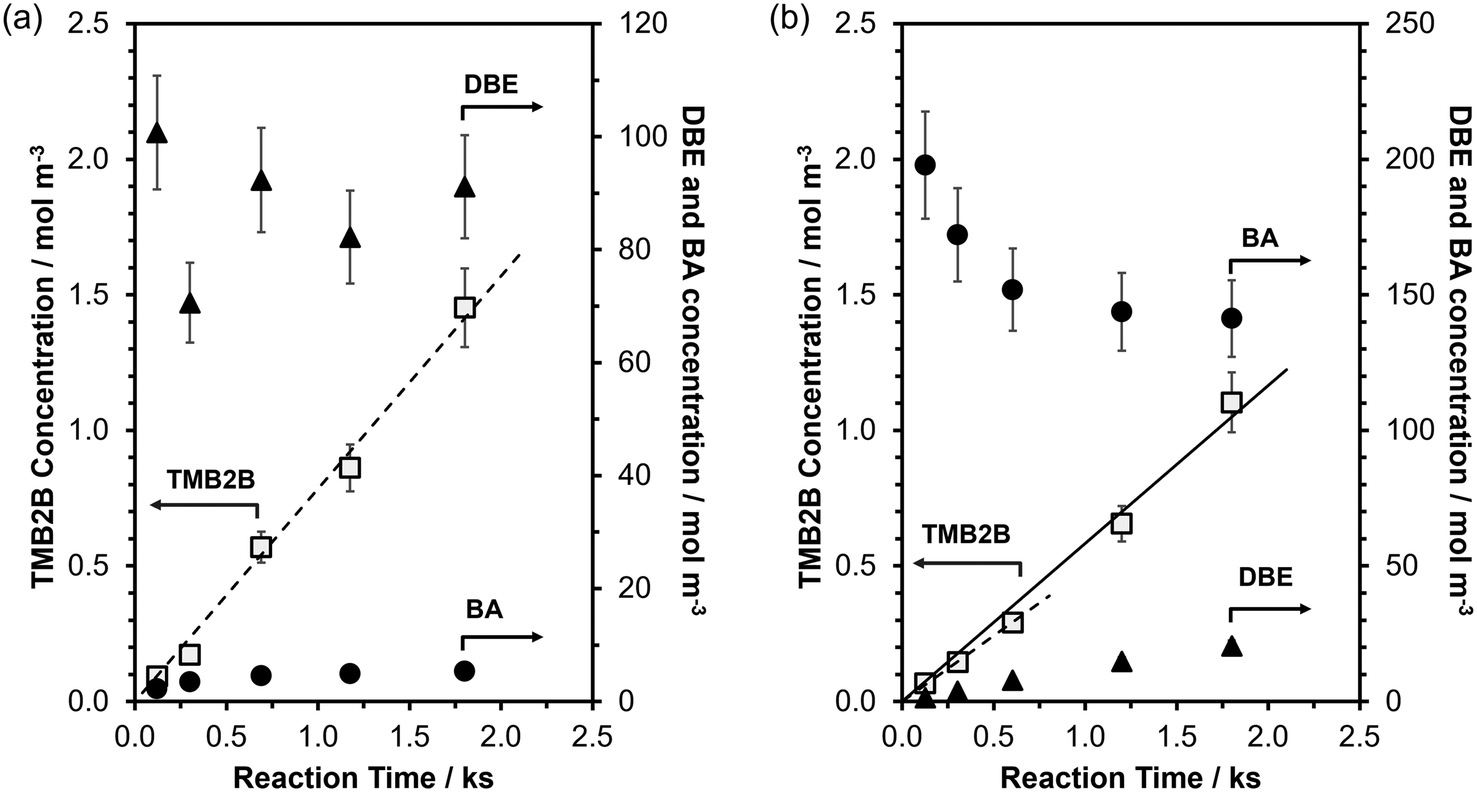 | ||
| Fig. 3 Liquid-phase concentrations of TMB2B (□), BA (●) and DBE (▲) as a function of batch reaction time during mesitylene benzylation (363 K) with (a) DBE (TMB:DBE molar ratio = 75:1; DBE/Al molar ratio = 25) or (b) BA (TMB:BA molar ratio = 40:1; BA/Al molar ratio = 23) on MFI-40-P. Dashed lines represent the best-fit line of the TMB2B concentration vs. time at short reaction times. Solid line in 3(b) represents the best fit line of the TMB2B concentration vs. time at all reaction times. Uncertainties in measured concentrations are ±10%. | ||
During mesitylene benzylation with DBE (TMB:DBE molar ratio = 75:1), TMB2B concentrations increased linearly with reaction time (Fig. 3a) indicating that the mesitylene benzylation with DBE proceeded irreversibly and that any deactivation of acid sites was negligible at the low conversions (XTMB < 0.1% and XDBE,total < 5%; Fig. S15, ESI†) and short reaction times of this study (<0.5 h). In contrast, BA concentrations (Fig. 3a) and BA/TMB2B molar ratios (Fig. S15b, ESI†) approached steady-state values with increasing reaction times. The non-unity steady-state BA/TMB2B molar ratios (∼4; Fig. S15b, ESI†) and steady-state BA/DBE molar ratios (∼0.06; Fig. S15b, ESI†) at longer reaction times suggest that the majority of the BA (>80%) are not formed as side products of mesitylene benzylation (Scheme 1), but rather by acid-catalyzed DBE hydrolysis by trace amounts of adventitious H2O (reverse step of BA self-etherification) at internal H+ sites that do not catalyze TMB benzylation. Initial rates of mesitylene benzylation with DBE were estimated by fitting temporal TMB2B concentration profiles to a differential (well-mixed) batch reactor model without needing to correct for approach-to-equilibrium (details in section S9, ESI†).
By comparison, during mesitylene benzylation with BA (TMB:BA molar ratio 40:1), TMB2B concentrations increased slightly non-linearly with reaction time (Fig. 3b) indicating that the mesitylene benzylation reaction proceeds far from equilibrium with negligible catalyst deactivation under the reaction conditions (XTMB < 0.1%, XBA→TMB2B < 0.5%, trxn < 0.5 h); thus, mesitylene benzylation rates slightly increase with reaction time due to contributions of non-TMB-BA reactions. The increasing DBE concentrations and decreasing BA concentrations approached steady-state values at long reaction times (Fig. 3b) because BA self-etherification reactions catalyzed by both internal and external H+ sites approach equilibrium as BA conversions increase (XBA→DBE > 15%) at longer reaction times. Thus, contributions of secondary TMB-DBE reactions were non-negligible at high BA conversions (XBA,total > 10%) and initial rates of mesitylene benzylation with BA were estimated by only analyzing temporal TMB2B concentration profiles at low BA conversions (XBA,total < 10%). Differential reactor operation was confirmed by varying the site-contact time by changing the catalyst-to-solution ratio (section S9, Fig. S16, ESI†). Artifacts of extracrystalline transport limitations on measured rates were excluded by agitating the reaction mixture at high speeds (∼900 rpm) (further discussion in section S9, ESI†). Here, kinetic analyses will be limited to mesitylene benzylation reactions that are catalyzed at external acid sites.34–39 The reaction profiles shown in either Fig. 3a and b are representative of all catalyst samples and reaction conditions studied in this work for mesitylene benzylation with either DBE or BA (section S10, ESI†).
Initial rates of mesitylene benzylation (rTMB2B) with DBE (363 K; per total Al, Fig. 4a) and with BA (XBA < 10%, Fig. 4b) showed a zero-order dependence on DBE concentrations (45–390 mol m−3 or ∼1–8 vol%) and BA concentrations (95–370 mol m−3, ∼1–4 vol%), respectively. In addition, initial mesitylene benzylation rates are expected to have a zero-order dependence on mesitylene concentrations (∼7000 mol m−3) because mesitylene is present in far excess in solution (>90 vol%) at concentrations much greater than the number of Al sites (TMB/Altotal > 1000).34 Thus, initial mesitylene benzylation rates (per total Al) can be described by the measured zero-order rate benzylation constant (kTMB2B,meas; per total Al):
| rTMB2B = kTMB2B,meas | (1) |
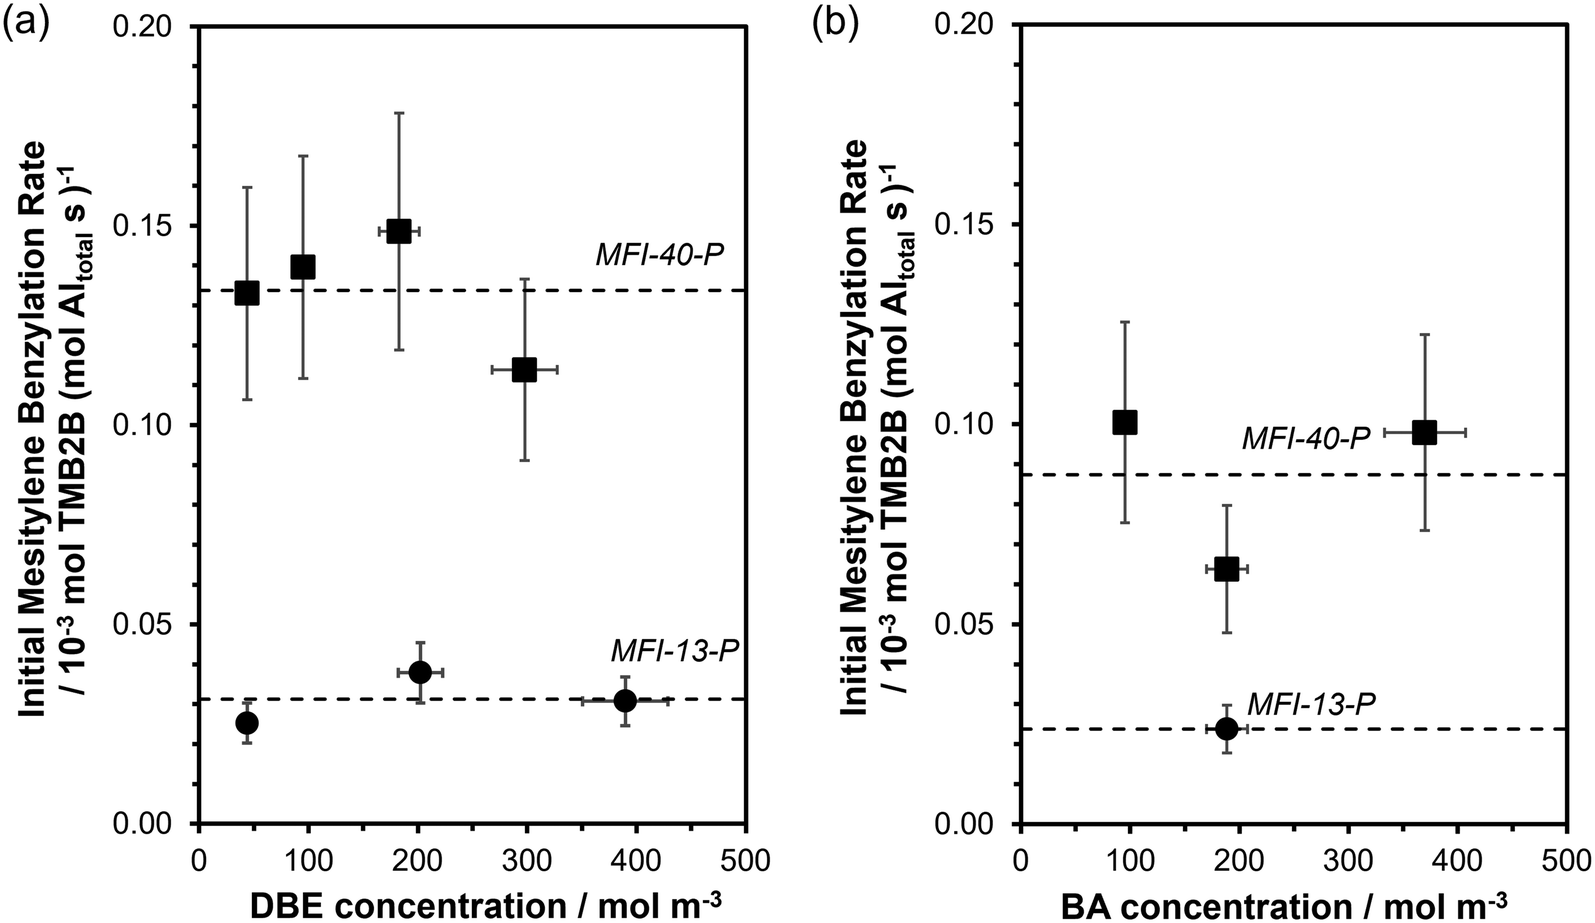 | ||
| Fig. 4 Initial mesitylene benzylation rates (per total Al; 363 K) as a function of initial concentrations of (a) DBE and (b) BA during mesitylene benzylation on MFI-13 (●) and MFI-40 (■). Dashed lines represent the average values of initial rates across measured concentrations. Vertical error bars reflect uncertainties in mesitylene benzylation rates (±20% in (a) and ±25% in (b)). Horizontal error bars reflect uncertainties (±10%) in DBE or BA concentrations. MFI-13-P was evaluated at only one BA concentration and the dashed line represents the rate at this concentration. | ||
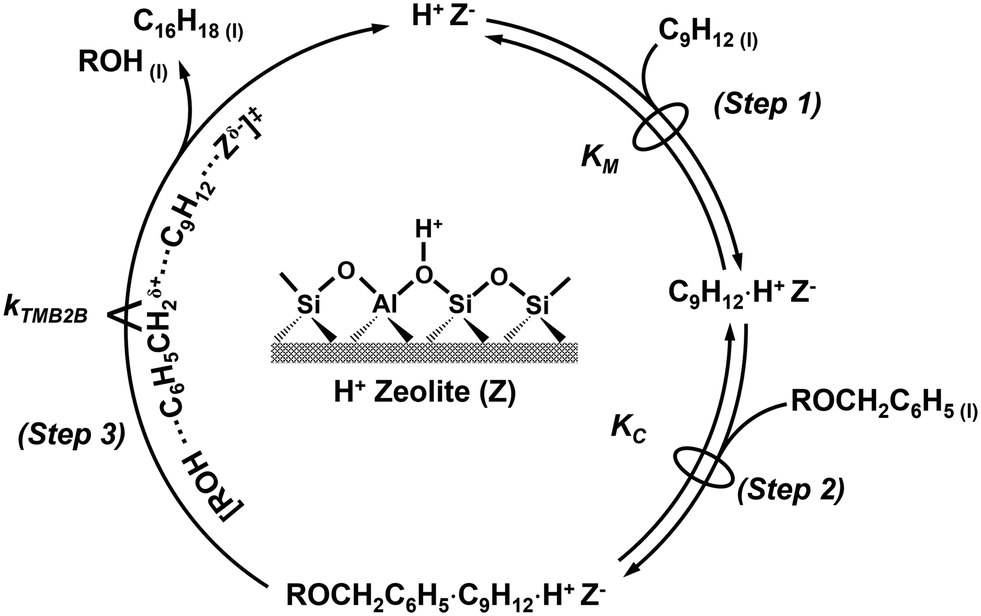 | ||
| Scheme 2 Proposed reaction mechanism (via the concerted pathway) for benzylation of mesitylene (C9H12) with a benzylating agent (ROCH2C6H5) on a Brønsted acid site (H+Z−) to form 1,3,5-trimethyl-2-benzylbenzene (C16H18) and a leaving group (ROH). Steps are described in the text. | ||
The reaction sequence begins with the quasi-equilibrated adsorption of mesitylene from the bulk solvent phase (C9H12(l)) to the active site (H+Z−) (step 1, Scheme 2), followed by the quasi-equilibrated adsorption of benzylating species (ROCH2C6H5(l) or BzOR(l)) to form a co-adsorbed complex (C9H12·ROCH2C6H5·H+Z−) (step 2, Scheme 2). The quasi-equilibrated adsorption of the benzylating species at active sites (ROCH2C6H5·H+Z−) is omitted here, but is included in the full rate derivation (section S8, ESI†). Following the formation of the co-adsorbed complex, an irreversible and kinetically relevant C–C bond formation (step 3, Scheme 2) between a 2-carbon of mesitylene and the benzylic carbon of DBE (or BA) forms 1,3,5-trimethyl-2-benzylbenzene (C16H18·H+Z−) and the associated leaving group of the benzylating agent (ROH) that desorbs from the active site and into the extracrystalline solvent phase (C16H18(l)) to close the catalytic cycle.
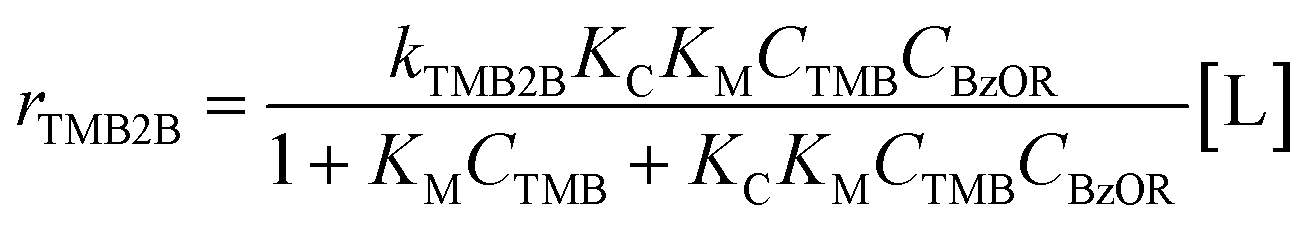
Assuming the C–C bond formation step is the kinetically relevant step and that all adsorption–desorption steps are quasi-equilibrated, the following rate expression can be derived (full derivation and further discussions are presented in section S8, ESI†):
 | (2) |
:1) or to the total Al sites (>1000:1) and at the negligible product concentrations (XTMB < 0.1%, XBzOR < 10%), mesitylene-derived species are assumed to be the most abundant surface intermediates. Thus, eqn (2) can be simplified and recast to the following form: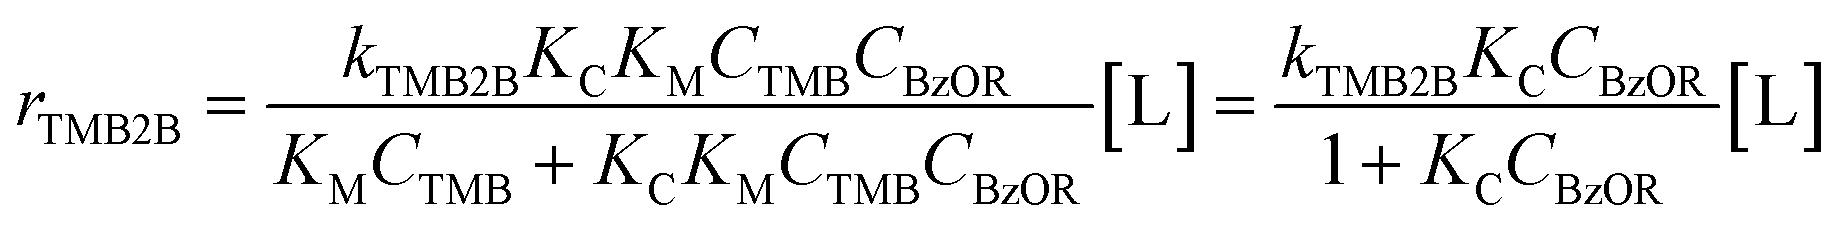 | (3) |
The functional form of eqn (3) accounts for the difference in the assumed pseudo-first order dependence on BA concentration (due to excess TMB) in previous studies (343–393 K, ∼2 vol% BA in TMB, ∼0.5 vol% DBE in TMB)34–39 and our observed apparent zero-order dependence on the concentrations of either benzylating agent (363 K, ∼1–8 vol%; 45–390 mol m−3). The apparent zero-order dependence of mesitylene benzylation rates on BA concentration in our study is somewhat consistent with the slightly negative-order dependence of mesitylene benzylation rates reported within similar concentration ranges (200–400 mol m−3), albeit at slightly lower temperatures (343 K).40 Under the conditions studied here, at sufficiently high concentrations of the benzylating agent (>200 mol m−3), measured rates (rTMB2B; per total Al) reflect the product of the zero-order rate constant (kTMB2B; per external H+) for forming the kinetically relevant mesitylene benzylation transition state and the number of all accessible active sites (i.e., [L] = [H+ext]; per total Al) saturated with the co-adsorbed complex as the single most abundant reactive intermediate (MARI) (eqn (4)):
| rTMB2B ≅ kTMB2B[H+ext] | (4) |
 | ||
| Fig. 5 Measured zero-order TMB2B formation rate constants (per total Al) during mesitylene benzylation (363 K) with DBE or BA on (a) MFI-13-P, MFI-13-4h-2-c3 and (b) MFI-40-P, MFI-40-4h-2-c3. Error bars reflect uncertainties in measurements (±20% (DBE) and ±25% (BA)). Measured zero-order TMB2B formation rate constants (per total Al) for MFI-13-P (DBE) and MFI-40-P (DBE or BA) were obtained by averaging rates measured in zero-order kinetic regimes (from Fig. 4) while those for the rest reflect single or average of two rate measurements at a fixed DBE or BA concentration in the zero-order regime. | ||
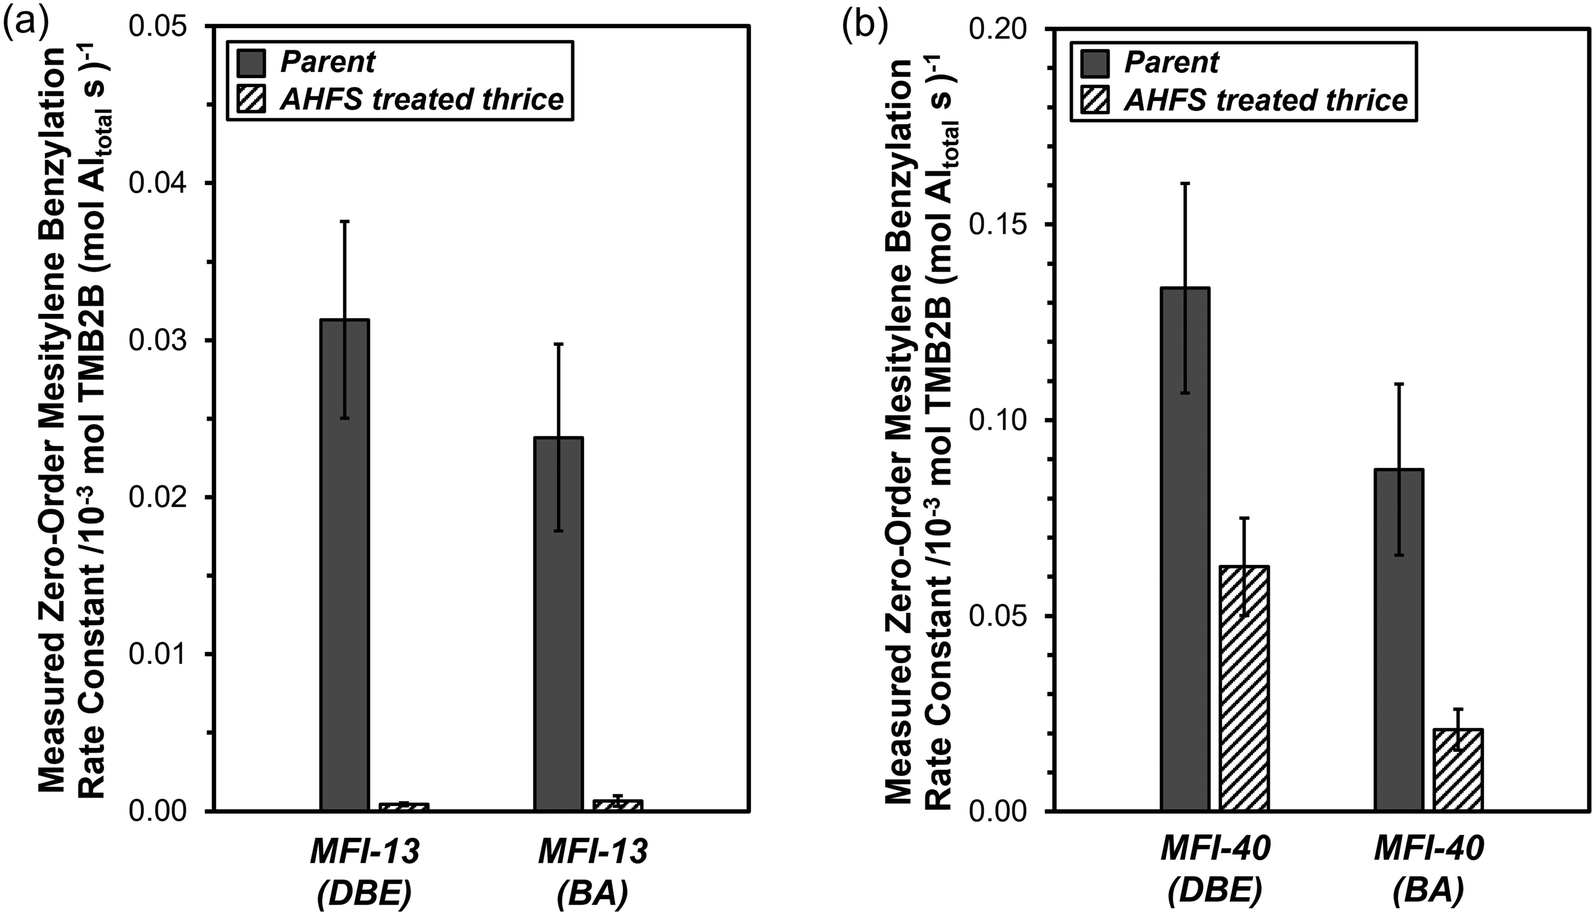
Measured zero-order mesitylene benzylation rate constants (per total Al) with DBE and BA were compared on two parent MFI samples (MFI-13-P, MFI-40-P) and their derivative samples obtained after three successive AHFS treatment cycles (MFI-13-4h-2-c3, MFI-40-4h-2-c3) (Fig. 5a–b). The values of kTMB2B,meas (per total Al) for MFI-13-4h-2-c3 were lower than those for MFI-13-P by ∼70(±20)× (DBE) and ~40(±20)× (BA). In addition, the values of kTMB2B,meas (per total Al) for MFI-40-4h-2-c3 were lower than those for MFI-40-P by 2.1(±0.5)× (DBE) and 4.2(±1.5)× (BA). These lower kTMB2B,meas values indicate that the concentrations of external active sites (per total Al) on the AHFS-treated MFI samples are much lower than those on their parent MFI samples.
3.3. Mesitylene benzylation rate constants normalized by external H+ sites in MFI zeolites
The intrinsic zero-order rate constant (per external H+) of mesitylene benzylation with DBE (363 K) on external acid sites of MFI was first obtained from kinetic measurements in the zero-order kinetic regime on a set of MFI samples with independently measured concentrations of external acid sites. The fractions of external H+ sites (per total Al) were measured on MFI-13-P and MFI-40-P using DTBP titration and desorption methods (described in section 2.4; DTBP-TPD profiles shown in section S6, ESI†) and were estimated to be 0.010 (±0.002) and 0.039 (±0.008), respectively (Table 1). In addition, the fraction of external acid sites was measured on two additional MFI samples (MFI-C666, MFI-C868) that were synthesized using previously reported methods involving gemini-type quaternary ammonium surfactants with different alkyl chain lengths,54,55 which result in nanocrystalline zeolite morphologies possessing significantly higher extracrystalline surface area, and in turn, higher fractions of acid sites exposed at external surfaces. The fractions of external acid sites (per total Al) on MFI-C666 and MFI-C868 were measured to be 0.089 (±0.013) and 0.146 (±0.022), respectively (Table 1). The measured zero-order rate constants for mesitylene benzylation with DBE (per total Al) are plotted against the measured fraction of external H+ sites (per total Al) as shown in Fig. 6a. As expected, the values of kTMB2B,meas (per total Al) increase linearly with [H+ext] (per total Al), with a slope reflecting the intrinsic rate constant at external H+ sites (kTMB2B; normalized per H+ext) to be 4.5(±0.5) × 10−3 mol TMB2B (mol H+ext)−1 s−1. These data are consistent with earlier findings34–36 that external H+ sites in MFI solely catalyze mesitylene benzylation reactions and that their intrinsic reactivity is similar (within <1.5×) among conventional and nanocrystalline MFI samples (MFI-13-P, MFI-40-P, MFI-C666, MFI-C868). The dependence of kTMB2B,meas (per total Al) on [H+ext] (per total Al) is also expected from using transition state theory to interpret measured rate constants and their dependence on Gibbs free energy differences between the kinetically relevant transition and precursor states (section S8.1, ESI†). Although a zero-order rate constant can also be recovered for the sequential mechanism, the choice of the prevalent mechanism does not affect the dependence of kTMB2B,meas (per total Al) on [H+ext] (per total Al) nor the validity of zero-order mesitylene benzylation rates as a quantitative probe of external H+ sites (additional discussion in section S8.2, ESI†).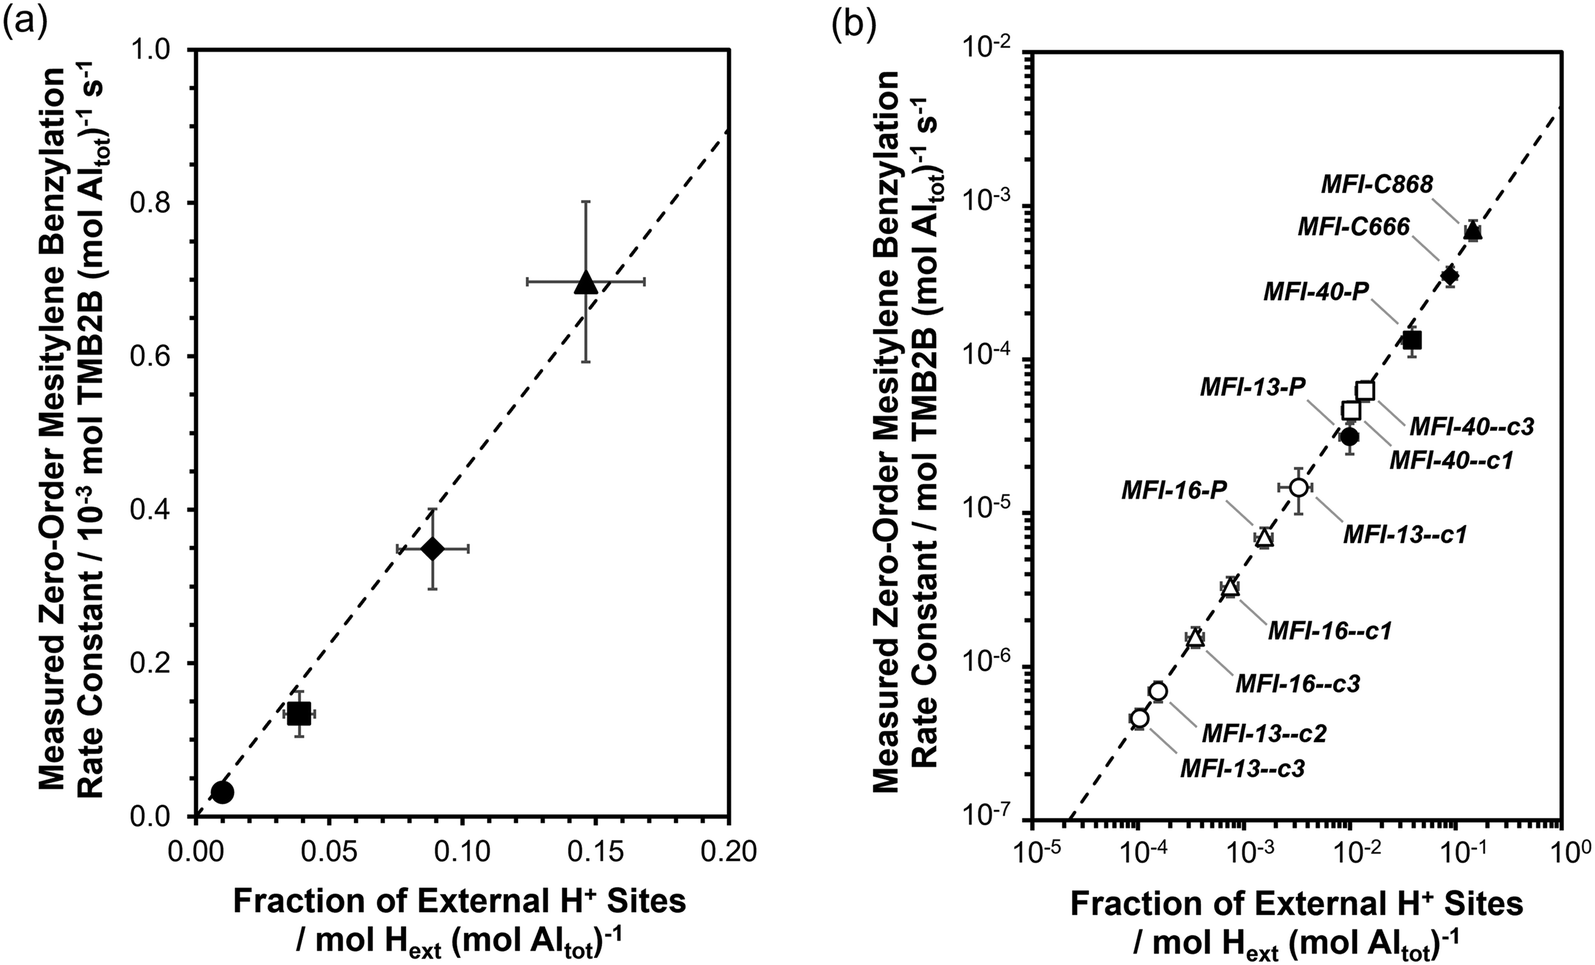 | ||
| Fig. 6 (a) Measured zero-order rate constants (per total Al) for mesitylene benzylation with DBE (363 K) as a function of the fraction of external H+ sites (per total Al) on MFI-13-P (●), MFI-40-P (■), MFI-C666 (◆) and MFI-C868 (▲). Vertical error bars reflect uncertainties (±15% to ±25%) in rate constants. Horizontal error bars reflect uncertainties (±15%) in the measured fraction of external H+ sites. Dashed lines represent the regressed best fits of the data to a linear regression model with zero-intercept. (b) Plot in (a) (in log scale) including zero-order mesitylene benzylation rate constants (per total Al) on MFI-16-P and AHFS-treated samples (open symbols) against the predicted fraction of external H+ sites (per total Al). Horizontal error bars reflect propagated uncertainties (±20% to ±35%) in predicted fractions of external H+ sites. For clarity, the sample codes of the AHFS-treated samples are truncated by omitting the AHFS treatment duration (4 h) and concentration (SiAHFS/AlZeolite = 2). | ||
The value of the intrinsic zero-order mesitylene benzylation rate constant (per H+ext) was then used to estimate the fraction of external acid sites on MFI samples obtained by different passivation treatments (Fig. 6b), given the challenges of reliably and directly quantifying the number of external H+ sites in MFI samples containing low numbers of external H+ sites (<∼10 μmol H+ext g−1) (titration experiment shown for MFI-13-4h-2-c3 in Fig. S9, ESI†). Measured rate constants are summarized in Table S4 (ESI†), estimated fractions of external H+ sites (per total Al) on the MFI samples obtained via various AHFS treatments are summarized in Table 1, and estimated numbers of external acid sites per g of zeolite are summarized in Table S4 (ESI†).
Fig. 6b displays the decreases in the fraction of external acid sites (measured via mesitylene benzylation kinetics) for different MFI zeolite samples after increasing numbers of AHFS treatment cycles. The fraction of external acid sites on both MFI-13 and MFI-16 decreased continuously with increasing numbers of AHFS treatment cycles, with more significant decreases (up to 70× lower than the parent) within the MFI-13-series than within the MFI-16 series (up to 5× lower than the parent). Specifically, the number of external H+ sites (per g zeolite; Table S4, ESI†) on an MFI-13 sample treated thrice with AHFS (MFI-13-4h-2-c3) decreased by ∼99% relative to MFI-13-P, while the total number of acid sites (per g zeolite; Table S1, ESI†) only decreased by ∼10%, indicating the selective and nearly complete passivation of external H+ sites on MFI-13-4h-2-c3. Similarly, the total number of external acid sites (per g zeolite; Table S4, ESI†) in MFI-16-4h-2-c3 decreased by ∼90% relative to MFI-16-P while preserving the same bulk number of acid sites (per g zeolite; Table S1, ESI†). In contrast, the number of external H+ sites (per g zeolite; Table S4, ESI†) on the MFI-40 sample obtained after three successive AHFS treatment cycles (MFI-40-4h-2-c3) decreased in half (∼55%) relative to MFI-P, while the bulk H+ content (per g zeolite; Table S1, ESI†) remained the same, indicating only partial passivation of external H+ sites on MFI-40-4h-2-c3. Taken together, these results indicate that although AHFS treatments can selectively passivate a significant fraction of external acid sites in MFI zeolites, the efficacy of such treatments in MFI zeolites varies in a non-systematic manner depending on the treatment conditions and parent sample. These findings also illustrate the utility of catalytic probes, when compared to stoichiometric probes using spectroscopic or titrimetric methods, in amplifying dilute concentrations of external H+ sites on MFI zeolites thereby enabling their reliable quantification. The convenience of this kinetic method is further realized by measuring rates in a zero-order kinetic regime (as opposed to a first- or fractional-order regime) as it obviates the need to know the reactant concentration and allows the direct estimation of rate constants from measured rates.
4. Conclusions
Catalytic methods were developed to quantify the number of residual Brønsted acid sites at extracrystalline surfaces of MFI zeolites (H+ext) obtained from various post-synthetic treatments using ammonium hexafluorosilicate (AHFS) solutions. Measured zero-order rate constants (kTMB2B,meas; per total Al) for mesitylene benzylation with dibenzyl ether (DBE), obtained under kinetically controlled regimes without convoluting influences of side reactions, solely depend on the concentration of external H+ sites (per total Al) that stabilize mesitylene benzylation transition states at unconfined surfaces saturated with reactant-derived intermediates. The intrinsic zero-order rate constants for mesitylene benzylation with DBE (kTMB2B; per external H+) were calibrated using a set of MFI samples with varying external H+ contents (0.01–0.15; per total Al) that can be independently measured using a bulky base titrant (2,6-di-tert-butylpyridine). The value of kTMB2B (per external H+) can be used alongside kTMB2B,meas (per total Al) measured on various post-synthetically modified MFI samples under similar reaction conditions to reliably estimate the concentration of external H+ sites (per total Al), providing a method to do so for samples with dilute amounts of external H+ sites that cannot be reliably estimated from stoichiometric probes using typical spectroscopic or titration methods.MFI samples treated with AHFS under various conditions retain their bulk structural properties and total Al and H+ content, except for one sample that initially contained a significant amount of extraframework Al. Their external H+ content decreases significantly upon AHFS treatment, but to different degrees that depend on the specific treatment conditions used and the parent sample. Quantification of these subtle differences in external H+ content using mesitylene benzylation with DBE required rate measurements in a fixed kinetic regime, most conveniently in the zero-order kinetic regime because it directly measures a rate constant without requiring knowledge of reactant concentrations, thus enabling the use of measured reaction rates directly as a site measurement. The rates of mesitylene benzylation with DBE and benzyl alcohol (BA) behave similarly under the studied conditions wherein the rates have a zero-order dependence on the concentration of benzylating species and differ by less than a factor of 2. However, parallel BA etherification side reactions alter the identity of the benzylating species during the reaction time course; thus, we suggest that using DBE as the benzylating agent reduces uncertainty in rate measurements and provides a more quantitative characterization of the number of external H+ sites in MFI zeolites. We expect that this catalytic method developed here can be used to quantify the number of external acid sites on various small-pore and medium-pore zeolites of different origin to enable more reliable assessments of the efficacy of various surface passivation procedures and to facilitate rigorous evaluation of the catalytic consequences of external H+ sites during acid catalysis.
Author contributions
This manuscript was written through contributions of all authors, and all authors have given approval to the final version of the manuscript.Conflicts of interest
The authors declare that they have no known competing financial interests or personal relationships that could have appeared to influence work reported in this paper.Acknowledgements
The authors acknowledge financial support provided by the National Science Foundation under Cooperative Agreement No. EEC-1647722, which is an Engineering Research Center for the Innovative and Strategic Transformation of Alkane Resources (CISTAR). S. E. also acknowledges financial support from CISTAR Bill Murray and Dick Reitz Purdue Fellowships. The authors thank Dr. Songhyun Lee (Purdue) for synthesizing two of the MFI samples (MFI-C666, MFI-C868) used in this study. The authors also thank Dr. Songhyun Lee, Ricem Diaz Arroyo (Purdue), Olivia Gluth (University of Washington) and Elizabeth Bickel (Purdue) for helpful technical discussions during the early stages of this study. The authors also thank Dmitry Zemlyanov (Purdue Birck Nanotechnology Center) for assistance with XPS measurements.References
- C. Martínez and A. Corma, Coord. Chem. Rev., 2011, 255, 1558–1580 CrossRef.
- C. H. Bartholomew and R. J. Farrauto, Fundamentals of Industrial Catalytic Processes, John Wiley & Sons, 2011 Search PubMed.
- S. I. Zones, Microporous Mesoporous Mater., 2011, 144, 1–8 CrossRef CAS.
- M. Farcasiu and T. F. Degnan, Ind. Eng. Chem. Res., 1988, 27, 45–47 CrossRef CAS.
- J. P. Gilson and E. G. Derouane, J. Catal., 1984, 88, 538–541 CrossRef CAS.
- T. F. Degnan, J. Catal., 2003, 216, 32–46 CrossRef CAS.
- R. Gounder and E. Iglesia, Chem. Commun., 2013, 49, 3491–3509 RSC.
- E. G. Derouane, J. P. Gilson, Z. Gabelica, C. Mousty-Desbuquoit and J. Verbist, J. Catal., 1981, 71, 447–448 CrossRef CAS.
- A. Corma, V. Fornés, L. Forni, F. Márquez, J. Martínez-Triguero and D. Moscotti, J. Catal., 1998, 179, 451–458 CrossRef CAS.
- T. Yashima, Y. Sakaguchi and S. Namba, in Studies in Surface Science and Catalysis, ed. T. Seivama and K. Tanabe, Elsevier, 1981, vol. 7, pp. 739–751 Search PubMed.
- K. Hashimoto, T. Masuda and Y. Hariguchi, Nippon Kagaku Kaishi, 1989, 3, 575–582 CrossRef.
- D. Yi, X. Xu, X. Meng, N. Liu and L. Shi, J. Porous Mater., 2019, 26, 1767–1779 CrossRef CAS.
- G. Paparatto, G. De Alberti, G. Leofanti and M. Padovan, in Studies in Surface Science and Catalysis, ed. T. Inui, Elsevier, 1989, vol. 44, pp. 255–263 Search PubMed.
- Y. S. Bhat, J. Das, K. V. Rao and A. B. Halgeri, J. Catal., 1996, 159, 368–374 CrossRef CAS.
- A. G. Popov, V. S. Pavlov and I. I. Ivanova, J. Catal., 2016, 335, 155–164 CrossRef CAS.
- Y. Zhai, S. Zhang, Y. Shang, Y. Song, W. Wang, T. Ma, L. Zhang, Y. Gong, J. Xu and F. Deng, Catal. Sci. Technol., 2019, 9, 659–671 RSC.
- I. Lezcano-González, R. Oord, M. Rovezzi, P. Glatzel, S. W. Botchway, B. M. Weckhuysen and A. M. Beale, Angew. Chem., Int. Ed., 2016, 55, 5215–5219 CrossRef.
- W. Ding, G. D. Meitzner and E. Iglesia, J. Catal., 2002, 206, 14–22 CrossRef CAS.
- Y. Gan, Q. Lv, Y. Li, H. Yang, K. Xu, L. Wu, Y. Tang and L. Tan, Chem. Eng. Sci., 2023, 266, 118289 CrossRef CAS.
- D. Van Vu, M. Miyamoto, N. Nishiyama, Y. Egashira and K. Ueyama, J. Catal., 2006, 243, 389–394 CrossRef.
- A. Ghorbanpour, A. Gumidyala, L. C. Grabow, S. P. Crossley and J. D. Rimer, ACS Nano, 2015, 9, 4006–4016 CrossRef CAS PubMed.
- J. Wei, J. Catal., 1982, 76, 433–439 CrossRef CAS.
- J.-H. Kim, A. Ishida, M. Okajima and M. Niwa, J. Catal., 1996, 161, 387–392 CrossRef CAS.
- J. M. Silva, M. F. Ribeiro, F. R. Ribeiro, N. S. Gnep, M. Guisnet and E. Benazzi, React. Kinet. Catal. Lett., 1995, 54, 209–215 CrossRef CAS.
- S. Han, D. S. Shihabi and C. D. Chang, J. Catal., 2000, 196, 375–378 CrossRef CAS.
- E. Benazzi, J. M. Silva, M. F. Ribeiro, F. R. Ribeiro and M. Guisnet, in Studies in Surface Science and Catalysis, ed. L. Bonneviot and S. Kaliaguine, Elsevier, 1995, vol. 97, pp. 393–400 Search PubMed.
- E. Bowes and D. S. Shihabi, US Pat., US5080878A, 1992 Search PubMed.
- S. Namba, A. Inaka and T. Yashima, Zeolites, 1986, 6, 107–110 CrossRef CAS.
- B. L. Foley and A. Bhan, ACS Catal., 2020, 10, 10436–10448 CrossRef CAS.
- K. Góra-Marek, K. Tarach and M. Choi, J. Phys. Chem. C, 2014, 118, 12266–12274 CrossRef.
- P. J. Kunkeler, R. S. Downing and H. van Bekkum, in Studies in Surface Science and Catalysis, Elsevier, 2001, vol. 137, pp. 987–1001 Search PubMed.
- M. Boudart, Chem. Rev., 1995, 95, 661–666 CrossRef CAS.
- H. Muller, Pure Appl. Chem., 1995, 67, 601–613 CrossRef.
- X. Zhang, D. Liu, D. Xu, S. Asahina, K. A. Cychosz, K. V. Agrawal, Y. A. Wahedi, A. Bhan, S. A. Hashimi, O. Terasaki, M. Thommes and M. Tsapatsis, Science, 2012, 336, 1684–1687 CrossRef CAS PubMed.
- D. Liu, X. Zhang, A. Bhan and M. Tsapatsis, Microporous Mesoporous Mater., 2014, 200, 287–290 CrossRef CAS.
- C. Li, H. J. Cho, Z. Wang, J. Gou, Y. Ren, H. Xi and W. Fan, ChemCatChem, 2016, 8, 2406–2414 CrossRef CAS.
- A. Korde, B. Min, Q. Almas, Y. Chiang, S. Nair and C. W. Jones, ChemCatChem, 2019, 11, 4548–4557 CrossRef CAS.
- L. Emdadi, S. C. Oh, Y. Wu, S. N. Oliaee, Y. Diao, G. Zhu and D. Liu, J. Catal., 2016, 335, 165–174 CrossRef CAS.
- H. I. Adawi, F. O. Odigie and M. L. Sarazen, Mol. Syst. Des. Eng., 2021, 6, 903–917 RSC.
- D. Xu, O. Abdelrahman, S. H. Ahn, Y. Guefrachi, A. Kuznetsov, L. Ren, S. Hwang, M. Khaleel, S. Al Hassan, D. Liu, S. B. Hong, P. Dauenhauer and M. Tsapatsis, AIChE J., 2019, 65, 1067–1075 CrossRef CAS.
- T. Bligaard, R. M. Bullock, C. T. Campbell, J. G. Chen, B. C. Gates, R. J. Gorte, C. W. Jones, W. D. Jones, J. R. Kitchin and S. L. Scott, ACS Catal., 2016, 6, 2590–2602 CrossRef CAS.
- G. Garralón, V. Fornés and A. Corma, Zeolites, 1988, 8, 268–272 CrossRef.
- Q. L. Wang, M. Torrealba, G. Giannetto, M. Guisnet, G. Perot, M. Cahoreau and J. Caisso, Zeolites, 1990, 10, 703–706 CrossRef CAS.
- C. S. Triantafillidis, A. G. Vlessidis, L. Nalbandian and N. P. Evmiridis, Microporous Mesoporous Mater., 2001, 47, 369–388 CrossRef CAS.
- D. W. Breck, H. Blass and G. W. Skeels, US Pat., US4503023A, 1985 Search PubMed.
- G. W. Skeels and D. W. Breck, in Proceedings of the Sixth International Zeolite Conference, Butterworths, Guildford, UK, Reno, USA, 1984, pp. 87–96 Search PubMed.
- W. S. Borghard, E. W. Sheppard and H. J. Schoennagel, Rev. Sci. Instrum., 1991, 62, 2801–2809 CrossRef CAS.
- M. Thommes, K. Kaneko, A. V. Neimark, J. P. Olivier, F. Rodriguez-Reinoso, J. Rouquerol and K. S. W. Sing, Pure Appl. Chem., 2015, 87, 1051–1069 CrossRef CAS.
- J. T. Scanlon and D. E. Willis, J. Chromatogr. Sci., 1985, 23, 333–340 CAS.
- D. V. Peron, V. L. Zholobenko, J. H. S. de Melo, M. Capron, N. Nuns, M. O. de Souza, L. A. Feris, N. R. Marcilio, V. V. Ordomsky and A. Y. Khodakov, Microporous Mesoporous Mater., 2019, 286, 57–64 CrossRef CAS.
- P. L. Llewellyn, Y. Grillet, J. Patarin and A. C. Faust, Microporous Mater., 1993, 1, 247–256 CrossRef CAS.
- A. Palčić, S. Moldovan, H. El Siblani, A. Vicente and V. Valtchev, Adv. Sci., 2022, 9, 2104414 CrossRef.
- M. Abdolrahmani, K. Chen and J. L. White, J. Phys. Chem. C, 2018, 122, 15520–15528 CrossRef CAS.
- K. Kim, R. Ryoo, H.-D. Jang and M. Choi, J. Catal., 2012, 288, 115–123 CrossRef CAS.
- S. Lee and M. Choi, J. Catal., 2019, 375, 183–192 CrossRef CAS.
- K. Lee, S. Lee, Y. Jun and M. Choi, J. Catal., 2017, 347, 222–230 CrossRef CAS.
- S. Schallmoser, T. Ikuno, M. F. Wagenhofer, R. Kolvenbach, G. L. Haller, M. Sanchez-Sanchez and J. A. Lercher, J. Catal., 2014, 316, 93–102 CrossRef CAS.
- K. Chen, S. Horstmeier, V. T. Nguyen, B. Wang, S. P. Crossley, T. Pham, Z. Gan, I. Hung and J. L. White, J. Am. Chem. Soc., 2020, 142, 7514–7523 CrossRef CAS.
- K. Chen, Z. Gan, S. Horstmeier and J. L. White, J. Am. Chem. Soc., 2021, 143, 6669–6680 CrossRef CAS.
- K. Chen, A. Zornes, V. Nguyen, B. Wang, Z. Gan, S. P. Crossley and J. L. White, J. Am. Chem. Soc., 2022, 144, 16916–16929 CrossRef CAS.
- J. J. Chiu, D. J. Pine, S. T. Bishop and B. F. Chmelka, J. Catal., 2004, 221, 400–412 CrossRef CAS.
- S. Svelle, M. Visur, U. Olsbye, Saepurahman and M. Bjørgen, Top. Catal., 2011, 54, 897 CrossRef CAS.
- K. De Wispelaere, J. S. Martínez-Espín, M. J. Hoffmann, S. Svelle, U. Olsbye and T. Bligaard, Catal. Today, 2018, 312, 35–43 CrossRef CAS.
- M. DeLuca, P. Kravchenko, A. Hoffman and D. Hibbitts, ACS Catal., 2019, 9, 6444–6460 CrossRef CAS.
- M. Bocus, L. Vanduyfhuys, F. De Proft, B. M. Weckhuysen and V. Van Speybroeck, JACS Au, 2022, 2, 502–514 CrossRef CAS PubMed.
- D. Acharya, W. Chen, J. Yuan, Z. Liu, X. Yi, Y. Xiao and A. Zheng, Catal. Lett., 2021, 151, 3048–3056 CrossRef CAS.
- S. Xing, K. Liu, T. Wang, R. Zhang and M. Han, Catal. Sci. Technol., 2021, 11, 2792–2804 RSC.
- P. B. Venuto, Microporous Mater., 1994, 2, 297–411 CrossRef CAS.
- I. Hill, A. Malek and A. Bhan, ACS Catal., 2013, 3, 1992–2001 CrossRef CAS.
- R. J. Madon and E. Iglesia, J. Mol. Catal. A: Chem., 2000, 163, 189–204 CrossRef CAS.
Footnote |
| † Electronic supplementary information (ESI) available. See DOI: https://doi.org/10.1039/d3re00589e |
| This journal is © The Royal Society of Chemistry 2024 |