 Open Access Article
Dynamic experiments in flow accelerate reaction network definition in a complex hydrogenation using catalytic static mixers†
Stefano
Martinuzzi
ab,
Markus
Tranninger
 c,
Peter
Sagmeister
 ab,
Martin
Horn
c,
Jason D.
Williams
 *ab and
C. Oliver
Kappe
 *ab
*ab
aCenter for Continuous Flow Synthesis and Processing (CCFLOW), Research Center Pharmaceutical Engineering GmbH (RCPE), Inffeldgasse 13, 8010 Graz, Austria. E-mail: jason.williams@rcpe.at
bInstitute of Chemistry, NAWI Graz, University of Graz, Heinrichstrasse 28, 8010 Graz, Austria. E-mail: oliver.kappe@uni-graz.at
cInstitute of Automation and Control, Graz University of Technology, Inffeldgasse 21b, 8010 Graz, Austria
First published on 29th September 2023
Abstract
Kinetic screening, when conducted in batch or under steady state flow conditions, is time consuming. In this work we leverage transient flow experiments to investigate the hydrogenation of an aryl ketone in a gas–liquid flow reactor, catalyzed by catalytic static mixers and monitored using process analytical technologies. Ramping reactor parameters over time allowed the exploration of different residence times and temperatures in a single experiment, allowing rapid definition of the reaction network. Data analysis using a batch approximation approach and a plug flow reactor approach allowed parameterization of predictive reaction models. A Pd/Al2O3 catalyst performed ketone reduction, followed by dehydration to the ethylbenzene derivative. Conversely, Pt/Al2O3 and Ru/Al2O3 showed aromatic ring hydrogenation as the main reaction pathway, following ketone reduction. The developed workflow is likely to be highly applicable to other chemical systems and reaction types.
Introduction
During the development, optimization and scale up of chemical processes, reaction modeling serves an increasingly important role.1–3 This is particularly true in the pharmaceutical industry, where detection, understanding and minimization of impurities is a key requirement for regulatory approval.4–6 Studies to define and parameterize reaction models require a range of experimental conditions to be examined and are generally performed in batch, or flow under steady state conditions.7–9 Standard batch and flow methods are, however, time consuming. For example, screening different temperatures in batch requires a different experiment for each temperature level and cannot easily be parallelized. Moreover, the possibility of mass- and heat transfer limitations make batch testing even less suitable.Plug flow reactors (PFRs) are perhaps the most commonly used continuous reactor type for chemical synthesis in flow.10,11 They present lower heat- and mass transfer limitations, yet are generally operated under steady state conditions. For reaction screening, this can be problematic, due to the long experimentation times (and high material consumption) required to reach steady state for each set of reaction conditions. A solution to this issue is the use of dynamic flow experiments, where one or more variable is changed dynamically during the course of the reaction.
Dynamic (or transient) flow experimentation enables rapid screening of numerous distinct reaction conditions and is particularly useful in process optimization. By continuously changing input parameters over time, different residence times and reagent stoichiometries can be investigated, allowing kinetic parameters to be estimated in just one experiment. This process can be further expedited and enhanced by the strategic use of inline and online process analytical technologies (PAT).12–15 Dynamic experiments have been developed and demonstrated by various groups, but, thus far, used exclusively for homogeneous reactions.16–24 Application of this technique to heterogeneously-catalyzed gas–liquid reactions, however, has not yet been investigated.
Heterogeneously-catalyzed hydrogenation is a key process in the chemical and pharmaceutical industries.25 Bulk chemical hydrogenations are usually carried out using packed-bed reactors, but pharmaceutical and fine chemical companies have been slower to take up this efficient processing method.25 In order to encourage this move, alternative continuous flow solutions have been presented, such as reactors containing catalytic static mixers (CSMs). Here, the catalyst is coated on 3D-printed metal inserts, thus providing a high surface area, good heat transfer and low pressure drop,26 within a tube-in-shell type reactor. Hydrogenation of various functional groups, such as nitro compounds, aldehydes and olefins, using CSMs has been reported by Hornung and by our own research group.27–37 This technology represents a scalable alternative to packed bed, particularly due to the ease of scalability bestowed by low pressure drop and efficient heat exchange.
Aryl ketones are an important class of building blocks in active pharmaceutical ingredients (APIs), and their intermediates. Reduction of such ketones is generally achieved using (super) stoichiometric metal hydride reagents, resulting in large quantities of waste.38,39 Accordingly, catalytic procedures, which make use of molecular hydrogen, represent an environmentally-desirable alternative. Although solid supported homogeneous catalysis has been well utilized for the hydrogenation of aryl ketones,40 relatively few reports describe this transformation using traditional heterogeneous catalysis.41–44
In this work we use dynamic flow experiments to parameterize reaction models for the gas–liquid hydrogenation of 4-hydroxyacetophenone 1. The hydrogenation is carried out in a tube-in-shell reactor fitted with Pd/Al2O3, Pt/Al2O3 or Ru/Al2O3-coated CSMs (Fig. 1). Inline and online PAT are used to monitor the reaction composition in real time, providing a large dataset for model parameterization. Modeling was performed using both a batch-approximated modeling approach (coded in MATLAB) and a plug flow reactor modeling approach (coded in Julia) to fit kinetic parameters that describe the reaction network for all three catalyst materials.
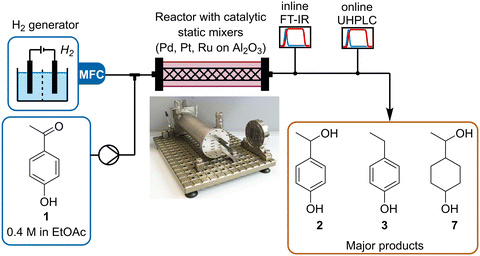 | ||
| Fig. 1 Schematic representation of the setup used to study the hydrogenation of ketone 1, using different metal/Al2O3 CSMs. | ||
Results and discussion
Reaction and analytical setup
The reaction and analytics setup was similar to that reported in previous studies within our research group (Fig. 1).29,35 The liquid stream, supplied by a high-performance liquid chromatography (HPLC) pump (Knauer, Azura), was merged in a Y-mixer with hydrogen gas, delivered by a hydrogen generator (ThalesNano, H-Genie). The resulting slug flow was then directed into the reactor (Ehrfeld, Miprowa). After leaving the reactor, the outlet stream was cooled and exited through a membrane-based back-pressure regulator (BPR, Equilibar, ZF Precision, combined with a pressure controller, Bronkhorst, EL-Press) set to 20 bar. The liquid stream was analyzed inline with Fourier Transform Infrared (FT-IR, Mettler Toledo, ReactIR 15, DiComp probe), then online with UHPLC (Shimadzu, Nexera X2), by subsampling with a peristaltic pump (Vapourtec, SF-10). Inline FT-IR allowed continuous monitoring of all species in the reaction stream with a high sampling frequency (15 s) compared to that of the UHPLC (3.5 min), thus providing better temporal resolution of the reaction progress. This was particularly important for following changes over time during dynamic experiments.The collected FT-IR data was analyzed using a partial least squares (PLS) regression model.45–50 This was calibrated against steady state samples, which were analyzed offline with gas chromatography-flame ionization detection (GC-FID, Shimadzu, GC-2030). All of the major reaction species (starting material 1, products 2, 3 and 7) could be accurately quantified using this method, with low root mean square error of cross validation (RMSECV) ≤12 mM. This demonstrates a clear benefit of FT-IR quantification over UHPLC, in which saturated products could not be observed due to their lack of chromophore. Models were also built for minor reaction species, but their relative accuracy was poorer. Similarly, UHPLC was calibrated using authentic samples of starting material 1 and aromatic products 2 and 3. Full details of chemometric modeling and calibration can be found in the ESI.†
Initial screening showed that the catalytic hydrogenation presented higher conversion in ethyl acetate, compared to methanol, perhaps due to the higher solubility of hydrogen in ethyl acetate (3 × 10⁻⁴vs. 1 × 10⁻⁴ molar fraction for ethyl acetate and methanol, respectively).51 Two CSMs slurry coated with alumina-supported noble metals (Pd, Pt or Ru) were inserted into one reactor channel. This small number of CSMs was used for reaction screening and understanding, but can easily be numbered up to increase reaction throughput.
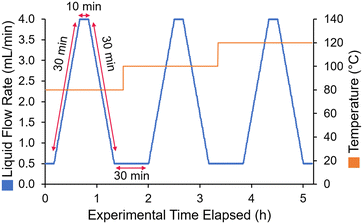
To reproducibly screen a range of different flow rates and temperatures, a dynamic experiment sequence was defined. The liquid flow was ramped from 0.5 to 4 mL min−1 over 30 min, held at 4 mL min−1 for 10 min, then ramped back down to 0.5 mL min−1 over 30 min (Fig. 2). Steady states were also added before and after each ramp, to check the reproducibility of the results. This was repeated for at least three different temperatures (in some cases four temperatures), to fit the activation energy parameters.
The choice of ramp flow rates and hold times was made with attempt to ensure that steady state could be reached in between each flow rate ramp, without requiring excessively long experiments. The calculated residence time at 0.5 mL min−1 was 12.4 min, therefore a hold time of 30 min provided almost 3 residence times to reach steady state. Similarly, at 4 mL min−1 the calculated residence time was only 1.55 min, so the 10 min hold time far exceeded 3 residence times. In practice, the experimental results showed plateaus (particularly at the low flow rate steady state, see ESI† for details), implying that a steady state was indeed reached in between flow rate ramps.
As a comparison to a standard (steady state) method of collecting kinetic data in flow, this approach saved a significant amount of time, and also material. In order to collect samples at 5 flow rates (e.g., 0.5, 1, 2, 3, 4 mL min−1), assuming that each condition would be allowed to equilibrate for 3 residence times, 76 min would be required. To perform this twice at three different residence times would require 7.6 h (compared to 5 h taken here). More importantly, though, it would provide significantly fewer data points, potentially leading to larger error and a poorer kinetic fit.
In previous work, the gas flow rate was found to have no influence on the residence time of the liquid phase, therefore a constant H2 flow rate, representing an excess, was used (36 NmL min−1).34 The assumption of decoupled gas and liquid flow was also tested in the present study and consistent results were obtained (see ESI†). As recently shown in a similar system, good gas–liquid mixing should be achieved under these conditions.52
During the experiments, no notable metal leaching was observed, aside from with Ru/Al2O3 mixers (see ESI†). Slight signs of deactivation were seen at temperatures below 100 °C, as already reported in previous work.35 The use of higher temperatures during experiments minimized this issue.
Reaction network
Through UHPLC, GC-FID and GCMS analyses nine individual species could be identified based on literature precedence,44 authentic samples, individually synthesized compounds and MS analysis. Several of these compounds (most notably major product 7) were present as two diastereomers, which further complicated analysis. Further details on identification can be found in the ESI.† Following the identification of all species, a reaction network was proposed (Fig. 3).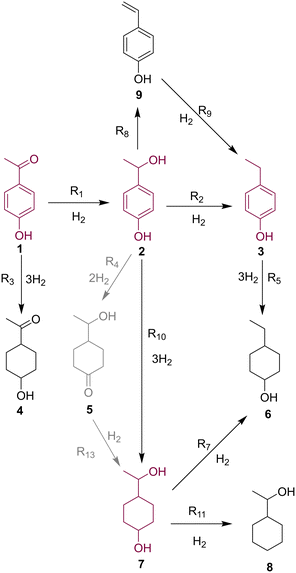 | ||
| Fig. 3 Proposed reaction network for the hydrogenation of 4-hydroxyacetophenone, 1, based on species detected in the reaction mixtures. Major reaction species are highlighted. | ||
Starting material 1 undergoes hydrogenation of either its carbonyl group (leading to benzyl alcohol 2) or its aromatic ring (leading to saturated minor product 4). Formation of 4 was only a minor pathway for all catalysts, due to deactivation by the electron withdrawing ketone functionality.44 Upon reaching intermediate 2, the examined catalysts exhibited very different selectivity in their onward reactions. The major reaction pathway for Pd/Al2O3 proved to be dehydration to ethylbenzene product 3, thought to proceed via vinylphenol 9, which was observed in low levels.
Conversely, Pt/Al2O3 and Ru/Al2O3 appeared to favor the aromatic ring reduction, resulting in saturated diol 7 as the major product. Partially reduced intermediate 5 was observed in reasonable quantities, therefore was postulated to be an intermediate in this pathway. Although onward reactions from 7 to dehydrated species 6 and 8 were postulated, these were only observed in minor quantities.
In order to generate a quantitative model for the reaction under different conditions, two different approaches were taken. First, the system was treated as analogous to a batch reactor, where a residence time (analogous to batch reaction time) was calculated for each experimental point, based on the reactor volume and transient flow rate. In a second approach, the reactor was modeled as a PFR using the method of lines with varying input flow rates and temperatures. Both approaches were used to fit kinetic parameters, based on recorded FTIR data, with a focus on key species, 1, 2, 3 and 7.
Batch-approximated reaction modeling
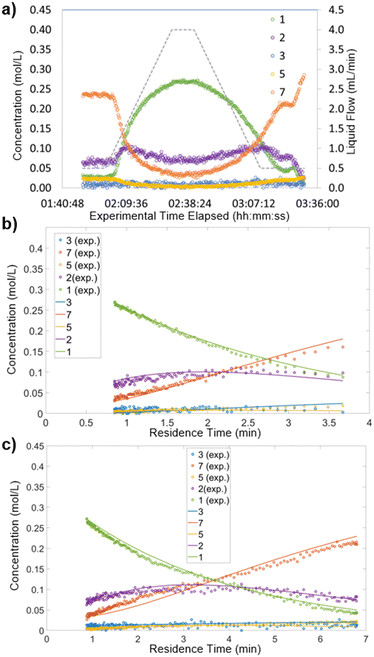
To carry out this analysis, the recorded reaction data were processed to approximate a batch reactor. The experimental time elapsed was converted to provide a residence time for each experimentally-measured point.19,21 Details can be found in the ESI† (section 6). Thus, each ramp of flow rates provided a reaction profile similar to those observed in batch reactions. An example of this data processing step for Pt/Al2O3 at 100 °C is shown below (Fig. 4). The experimentally recorded data (Fig. 4a) were converted to provide a reaction profile for the section in which flow rate was increased over time (Fig. 4b) and for the section in which flow rate was decreased over time (Fig. 4c).As can be observed (Fig. 4bvs. c), the spread of data points differs between the upward and downward flow rate ramps. Increasing the flow rate (ramp up) provided a higher density of data points at shorter residence times, whereas decreasing the flow rate (ramp down) gave a more even spread (see ESI† section 6 for details and mathematical justification). Accordingly, in studies performing only one flow ramp, it would be favorable to perform a ramp down.
The resulting reaction profiles were then modeled using a standard batch reactor kinetic model with the ordinary differential equation (ODE) and minimization suites of MATLAB. The assumption was made that the surface of the catalyst was saturated with hydrogen, which was supported by the consistent reaction performance at different pressures (see ESI† section 5). The fitting of the kinetic constants (k) at different temperatures allowed the determination of the Arrhenius pre-exponential factor (A) and activation energy (Ea), for each metal. The full set of results can be found in the ESI† (section 6.2).
The discrimination of the reaction scheme was based on the Akaike information criterion, as is generally used in such studies.53 With this method, based on the residual error sum of square, the best fitting model could be chosen amongst different possible models. Due to the relatively low quantities of saturated products observed, the mechanism selected for Pd/Al2O3 was far simpler than those for Pt/Al2O3 and Ru/Al2O3.
The activities of the metals in the conversion of 1 followed the order Pt > Pd > Ru. When comparing reactivity at 100 °C, Pt/Al2O3, achieved 50% conversion at ∼2 min residence time, Pd/Al2O3 at ∼5 min residence time and Ru/Al2O3 >6 min. With regards to selectivity, Pd/Al2O3 favored the hydrodeoxygenation of alcohol 2 to yield alkylphenol 3. The dehydration reaction was especially favored at higher temperatures, providing almost complete selectivity at 120 °C. In the kinetic parameter fitting, this was represented by a high activation energy (energy barrier), paired with a high pre-exponential factor. This side reaction may represent an added value route for the production of alkylphenols, important for the surfactants industry.
Pt/Al2O3 and Ru/Al2O3 favored instead the hydrogenation of the aromatic ring to 7. Pt/Al2O3 formed the aryl alcohol (2) in higher amount compared to Ru/Al2O3, although the preferential product remained the fully saturated compound (7). Accordingly, it is clear that selective ketone hydrogenation on systems with electron donating functionality on the aromatic ring is challenging, mostly due to the high reactivity of formed intermediate 2. The conditions at which Pt/Al2O3 demonstrated hydrogenation of the aromatic ring in this substrate were far milder than anticipated (100 °C, 20 bar, <10 min residence time). This may open new possibilities in continuous flow phenol de-aromatization, such as onward processing of lignin de-polymerization products.54
Plug flow reactor modeling
To bypass the laborious process of translating experimental reaction data to residence time profiles, and to provide a through-space representation of the reaction progress, an isothermal PFR approach to kinetic modeling was also explored.55 This was performed using a custom script, written in the Julia programming language, making use of the MethodOfLines toolkit, amongst others (see ESI† section 7 for details). Julia has a significant advantage over other simulation frameworks (e.g., written in python or MATLAB), since its precompiled code results in high performance ODE solvers, for rapid kinetic fitting.56The reactor was discretized into equal compartments (using the method of lines approach),57,58 whereby the composition at the end of the first compartment provides the input composition to the following compartment. Using this method, transport through the reactor was modeled in a simplistic, but sufficiently accurate manner. The number of compartments can be tuned to suit the observed residence time distribution of the system, since a higher number of compartments mimics behavior closer to ideal plug flow.
The reaction data was first imported, simply in the form of flow rate, temperature and concentrations measured over time. The resulting partial differential equations (PDEs) in both space and time were solved numerically. This resulted in concentration predictions for the entire reactor (each discretized compartment), at every time point across the experimental reaction duration.
To fit the kinetic parameters, the main species (1, 2, 3, 7) concentrations at the FTIR measurement point were estimated and compared with the experimentally-measured values. The kinetic parameters were then tuned to minimize the quadratic error using the BOBYQA (bound optimization by quadratic approximation)59 optimization algorithm, from the nonlinear optimization toolbox. Although several optimization algorithms were tested, this provided the best fit of the kinetic parameters and had a very low computational cost.
Kinetic parameters (pre-exponential factor and activation energy) were fitted for all three catalysts (Pd/Al2O3, Pt/Al2O3 and Ru/Al2O3). The resulting simulated concentrations provided a close fit with the recorded data for multi-temperature flow rate ramp experiments. The fit for Pd/Al2O3 (Fig. 5), showed excellent agreement for starting material 1 and major product 3. Intermediate 2 was present in far lower quantities (20–60 mM), resulting in a noisy FTIR trace. In spite of this, the concentrations predicted by the kinetic model were also in good agreement.
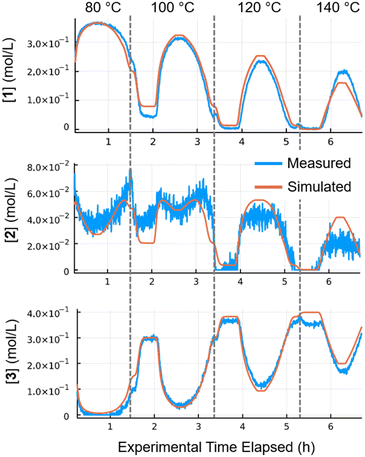 | ||
| Fig. 5 Results for Pd/Al2O3 at 80–140 °C. Simulated (orange) values compared with the measured (blue) values. | ||
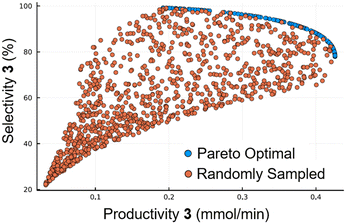
The generated reaction model could then be used for a range of applications for further in silico optimization. As an example of this a pareto front was formed, using the NSGA-II genetic algorithm, to predict the optimal operating points for maximizing selectivity and productivity in the synthesis of 4-ethylphenol 3 (Fig. 6). To validate the pareto optimal front (blue points), 1000 results were generated using random input values (orange points). It can be seen that these points all lie within the boundaries of the pareto front, confirming that it is not possible to access more favorable conditions than those on the front.
Furthermore, with the developed model, it is straightforward to tune the reaction scale to the desired level, by simply increasing the volume of the reactor used (and associated discretization parameters). This would represent the equivalent scaling up of the physical reactor, which can be performed by numbering up reaction channels and CSMs. This must be performed with caution, however, since the heat of reaction will begin to have a higher influence, as the reactor size and flow rates are increased. Increased exotherm influence has previously been observed using this CSM reactor.35
Conclusions
We have demonstrated the use of dynamic flow experiments with real-time analytics to rapidly model the progress and selectivity of a complex heterogeneous hydrogenation reaction. After characterizing a wide range of reaction products and building chemometric models for accurate quantification, a single experiment could be performed to examine catalyst performance at different temperatures. By using three different catalyst materials, different selectivity was uncovered, forming either the dehydrated or the de-aromatized species as the main product.Two different modeling techniques were utilized for building a reaction model: a batch-approximated model, or a plug flow model. Both made use of the dynamic experimentation data, which allowed multiple reaction time courses to be collected, without performing separate flow experiments. Both reaction models provided a good quantitative approximation of the reaction progress, explaining the different selectivity observed with different catalysts. The plug flow model also contains a framework for further in silico reaction optimization and testing. Consolidating this proof-of-concept study for reaction modeling using dynamic experiments, work is underway in further refining and expanding the scope of the approach.
Conflicts of interest
There are no conflicts to declare.Acknowledgements
This work was funded by the Austrian Research Promotion Agency FFG No. 891257, within the program “Produktion der Zukunft”. The Research Center Pharmaceutical Engineering (RCPE) are funded within the framework of COMET – Competence Centers for Excellent Technologies by BMK, BMAW, Land Steiermark and SFG. The COMET program is managed by the FFG.Notes and references
- N. Kockmann, React. Chem. Eng., 2019, 4, 1522–1529 RSC.
- C. J. Taylor, J. A. Manson, G. Clemens, B. A. Taylor, T. W. Chamberlain and R. A. Bourne, React. Chem. Eng., 2022, 7, 1037–1046 RSC.
- C. J. Taylor, A. Pomberger, K. C. Felton, R. Grainger, M. Barecka, T. W. Chamberlain, R. A. Bourne, C. N. Johnson and A. A. Lapkin, Chem. Rev., 2023, 123, 3089–3126 CrossRef CAS.
- C. N. Talicska, E. C. O'Connell, H. W. Ward, A. R. Diaz, M. A. Hardink, D. A. Foley, D. Connolly, K. P. Girard and T. Ljubicic, React. Chem. Eng., 2022, 7, 1419–1428 RSC.
- A. A. Zlota, Org. Process Res. Dev., 2022, 26, 899–914 CrossRef CAS.
- L. X. Yu, Pharm. Res., 2008, 25, 781–791 CrossRef CAS PubMed.
- D. Casas-Orozco, D. Laky, J. Mackey, G. Reklaitis and Z. Nagy, Chem. Eng. Sci., 2023, 275, 118591 CrossRef CAS.
- H. G. Jolliffe and D. I. Gerogiorgis, Chem. Eng. Res. Des., 2015, 97, 175–191 CrossRef CAS.
- C. Armstrong, Y. Miyai, A. Formosa, P. Kaushik, L. Rogers and T. D. Roper, J. Flow Chem., 2023, 13, 275–291 CrossRef.
- M. B. Plutschack, B. Pieber, K. Gilmore and P. H. Seeberger, Chem. Rev., 2017, 117, 11796–11893 CrossRef CAS PubMed.
- J. Britton and C. L. Raston, Chem. Soc. Rev., 2017, 46, 1250–1271 RSC.
- T. Stelzer, S. Y. Wong, J. Chen and A. S. Myerson, Org. Process Res. Dev., 2016, 20, 1431–1438 CrossRef CAS.
- M. A. Morin, W. Zhang, D. Mallik and M. G. Organ, Angew. Chem., Int. Ed., 2021, 60, 20606–20626 CrossRef CAS PubMed.
- M. Rodriguez-Zubiri and F.-X. Felpin, Org. Process Res. Dev., 2022, 26, 1766–1793 CrossRef CAS.
- A. Chanda, A. M. Daly, D. A. Foley, M. A. Lapack, S. Mukherjee, J. D. Orr, G. L. Reid, D. R. Thompson and H. W. Ward, Org. Process Res. Dev., 2015, 19, 63–83 CrossRef CAS.
- B. Zhang, A. Mathoor and T. Junkers, Angew. Chem., Int. Ed., 2023, 62, e202308838 CrossRef CAS.
- J. Van Herck and T. Junkers, Chem.: Methods, 2022, 2, 1–6 Search PubMed.
- C. Waldron, A. Pankajakshan, M. Quaglio, E. Cao, F. Galvanin and A. Gavriilidis, React. Chem. Eng., 2020, 5, 112–123 RSC.
- J. S. Moore and K. F. Jensen, Angew. Chem., Int. Ed., 2014, 53, 470–473 CrossRef CAS.
- B. M. Wyvratt, J. P. McMullen and S. T. Grosser, React. Chem. Eng., 2019, 4, 1637–1645 RSC.
- C. A. Hone, N. Holmes, G. R. Akien, R. A. Bourne and F. L. Muller, React. Chem. Eng., 2017, 2, 103–108 RSC.
- L. Schrecker, J. Dickhaut, C. Holtze, P. Staehle, M. Vranceanu, K. Hellgardt and K. K. Hii, React. Chem. Eng., 2023, 8, 41–46 RSC.
- P. Sagmeister, C. Schiller, P. Weiss, K. Silber, S. Knoll, M. Horn, C. A. Hone, J. Williams and C. O. Kappe, React. Chem. Eng. 10.1039/D3RE00243H.
- K. Silber, P. Sagmeister, C. Schiller, J. D. Williams, C. A. Hone and C. O. Kappe, React. Chem. Eng. 10.1039/D3RE00244F.
- E. Masson, E. M. Maciejewski, K. M. P. Wheelhouse and L. J. Edwards, Org. Process Res. Dev., 2022, 26, 2190–2223 CrossRef CAS.
- Y. Zhu, B. B. M. Sultan, X. Nguyen and C. Hornung, J. Flow Chem., 2021, 11, 515–523 CrossRef CAS.
- C. H. Hornung, X. Nguyen, A. Carafa, J. Gardiner, A. Urban, D. Fraser, M. D. Horne, D. R. Gunasegaram and J. Tsanaktsidis, Org. Process Res. Dev., 2017, 21, 1311–1319 CrossRef CAS.
- X. Nguyen, A. Carafa and C. H. Hornung, Chem. Eng. Process., 2018, 124, 215–221 CrossRef CAS.
- K. Simon, P. Sagmeister, R. Munday, K. Leslie, C. A. Hone and C. O. Kappe, Catal. Sci. Technol., 2022, 12, 1799–1811 RSC.
- A. Avril, C. H. Hornung, A. Urban, D. Fraser, M. Horne, J.-P. Veder, J. Tsanaktsidis, T. Rodopoulos, C. Henry and D. R. Gunasegaram, React. Chem. Eng., 2017, 2, 180–188 RSC.
- M. Kundra, T. Grall, D. Ng, Z. Xie and C. H. Hornung, Ind. Eng. Chem. Res., 2021, 60, 1989–2002 CrossRef CAS.
- J. Gardiner, X. Nguyen, C. Genet, M. D. Horne, C. H. Hornung and J. Tsanaktsidis, Org. Process Res. Dev., 2018, 22, 1448–1452 CrossRef CAS.
- M. Kundra, Y. Zhu, X. Nguyen, D. Fraser, C. H. Hornung and J. Tsanaktsidis, React. Chem. Eng., 2022, 7, 284–296 RSC.
- R. Lebl, Y. Zhu, D. Ng, C. H. Hornung, D. Cantillo and C. O. Kappe, Catal. Today, 2022, 383, 55–63 CrossRef CAS.
- R. Lebl, S. Bachmann, P. Tosatti, J. Sedelmeier, K. Püntener, J. D. Williams and C. O. Kappe, Org. Process Res. Dev., 2021, 25, 1988–1995 CrossRef CAS.
- R. Legg, C. Zhang, M. Bourchier, S. Cole, I. Martinez-Botella, X. Nguyen, Y. Zhu, W. Liew, S. Saubern, J. Tsanaktsidis and C. H. Hornung, Chem. Ing. Tech., 2022, 1017–1023 CrossRef CAS.
- M. Kundra, T. Grall, D. Ng, Z. Xie and C. H. Hornung, Ind. Eng. Chem. Res., 2021, 60, 1989–2002 CrossRef CAS.
- J. Magano and J. R. Dunetz, Org. Process Res. Dev., 2012, 16, 1156–1184 CrossRef CAS.
- M. V. N. De Souza and T. R. A. Vasconcelos, Appl. Organomet. Chem., 2006, 20, 798–810 CrossRef CAS.
- J. Lu and P. H. Toy, Chem. Rev., 2009, 109, 815–838 CrossRef CAS PubMed.
- R. V. Malyala, C. V. Rode, M. Arai, S. G. Hegde and R. V. Chaudhari, Appl. Catal., A, 2000, 193, 71–86 CrossRef CAS.
- J. R. Sounik, G. N. Mott and C. B. Hilton, US5498804A, 1996.
- L. Petitjean, R. Gagne, E. S. Beach, D. Xiao and P. T. Anastas, Green Chem., 2016, 18, 150–156 RSC.
- L. Goclik, L. Offner-Marko, A. Bordet and W. Leitner, Chem. Commun., 2020, 56, 9509–9512 RSC.
- P. Sagmeister, J. Poms, J. D. Williams and C. O. Kappe, React. Chem. Eng., 2020, 5, 677–684 RSC.
- P. Sagmeister, R. Lebl, I. Castillo, J. Rehrl, J. Kruisz, M. Sipek, M. Horn, S. Sacher, D. Cantillo, J. D. Williams and C. O. Kappe, Angew. Chem., Int. Ed., 2021, 60, 8139–8148 CrossRef CAS.
- I. E. Frank and B. R. Kowalski, Anal. Chem., 1982, 54, 232–243 CrossRef.
- S. Wold, M. Sjöström and L. Eriksson, Chemom. Intell. Lab. Syst., 2001, 58, 109–130 CrossRef CAS.
- B. K. Lavine and J. Workman, Anal. Chem., 2013, 85, 705–714 CrossRef CAS.
- K. S. Rao, F. St-Jean and A. Kumar, Org. Process Res. Dev., 2019, 23, 945–951 CrossRef CAS.
- IUPAC Solubility Data Series, ed. C. L. Young, Pergamon Press, 1981, vol. 5 Search PubMed.
- J.-N. Denker, T. Thelen, F. Herbstritt, J. Heck, M. Grünewald and P. Biessey, Ind. Eng. Chem. Res., 2023, 62, 8053–8062 CrossRef CAS.
- C. J. Taylor, H. Seki, F. M. Dannheim, M. J. Willis, G. Clemens, B. A. Taylor, T. W. Chamberlain and R. A. Bourne, React. Chem. Eng., 2021, 6, 1404–1411 RSC.
- Z. Sun, B. Fridrich, A. De Santi, S. Elangovan and K. Barta, Chem. Rev., 2018, 118, 614–678 CrossRef CAS PubMed.
- J. L. Pitarch, M. Rakhshan, M. M. Mardani, M. S. Sadeghi and C. de Prada, IFAC-PapersOnLine, 2016, 49, 87–92 CrossRef.
- J. Bezanson, A. Edelman, S. Karpinski and V. B. Shah, SIAM Rev., 2017, 59, 65–98 CrossRef.
- M. E. Davis, Numerical Methods & Modeling for Chemical Engineers, John Wiley & Sons, Inc., 1984 Search PubMed.
- A. Di Giuliano and E. Pellegrino, Heliyon, 2019, 5, e02040 CrossRef CAS PubMed.
- G. H. Negri, M. S. M. Cavalca, J. de Oliveira, C. J. F. Araújo and L. A. Celiberto, J. Control. Autom. Electr. Syst., 2017, 28, 623–634 CrossRef.
Footnote |
| † Electronic supplementary information (ESI) available: Additional experimental results and modelling details. See DOI: https://doi.org/10.1039/d3re00451a |
| This journal is © The Royal Society of Chemistry 2024 |

