
Not all silicon quantum dots are equal: photostability of silicon quantum dots with and without a thick amorphous shell†
I Teng
Cheong
 a,
LiYifan
Yang Szepesvari
a,
Chuyi
Ni
a,
Cole
Butler
a,
Kevin M.
O'Connor
a,
Riley
Hooper
a,
Alkiviathes
Meldrum
b and
Jonathan G. C.
Veinot
*a
a,
LiYifan
Yang Szepesvari
a,
Chuyi
Ni
a,
Cole
Butler
a,
Kevin M.
O'Connor
a,
Riley
Hooper
a,
Alkiviathes
Meldrum
b and
Jonathan G. C.
Veinot
*a
aDepartment of Chemistry, University of Alberta, Edmonton, Alberta T6G 2G2, Canada. E-mail: jveinot@ualberta.ca
bDepartment of Physics, University of Alberta, Edmonton, Alberta T6G 2E1, Canada
First published on 7th December 2023
Abstract
Luminescent colloidal silicon quantum dots (SiQDs) are sustainable alternatives to metal-based QDs for various optical applications. While the materials are reliant on their photoluminescence efficiency, the relationship between the structure and photostability of SiQDs is yet to be well studied. An amorphous silicon (a-Si) shell was recently discovered in SiQDs prepared by thermally-processed silicon oxides. As a-Si is known as a source of defects upon UV irradiation, the disordered shell could potentially have an adverse effect on the optical properties of nanoparticles. Herein, the photostability of ∼5 nm diameter SiQDs with an amorphous shell was compared with that of over-etched SiQDs of equivalent dimensions that bore an a-Si shell of negligible thickness. An UV-induced degradation study was conducted by subjecting toluene solutions of SiQDs to 365 nm light-emitting diodes (LEDs) under an inert atmosphere for predetermined times up to 72 hours. The structure, composition, and optical responses of the exposed SiQDs were evaluated.
1. Introduction
Quantum dots are nanosized semiconductor particles that have tunable optical and electronic properties. Silicon quantum dots (SiQDs) are a subclass of these materials that exhibit luminescence throughout the visible to infrared spectral regions and tailorable surface functionalities.1–4 The biocompatibility5–7 and abundance of silicon make SiQDs even more attractive as promising alternatives for toxic heavy metals-containing nanoparticles.8–10 Notably, various SiQD-based prototypes such as light-emitting diodes,11–15 solar concentrators,16–19 photodetectors,20,21 biological labels,22–25 and photocatalysts26–28 have emerged. If SiQDs are to realize their full practical utility in these, and other far-reaching applications, it is essential that photoluminescence (PL) maxima tunability, narrow emission bandwidth, and high quantum yield (QY) be achieved while maintaining long-term stability.The photoluminescence maximum of SiQDs is size dependent and is influenced by the confinement of charged carriers in geometric dimensions of the particles (i.e., quantum confinement).1,29–34 Synthesis methods such as thermal pyrolysis of silicon oxides,35–40 nonthermal plasma synthesis from appropriate precursors,41–45 and pulsed laser ablation of silicon percursors46–48 have been developed and all provide some measure of control over the SiQD sizes, and by extension, tailorability of the PL maxima. The corollary to this size-based tuning is the unique opportunity to manipulate SiQD emission maximum through the exploitation of surface-state-mediated relaxation involving surface heteroatoms (e.g., N, O, halides, etc).4,49–51 Single-dot spectroscopy of individual SiQDs also suggests that emission linewidth is affected by the particle surface chemistry and the corresponding interface with their host matrix.52,53 It is an understatement to say the recombination of charge carriers in SiQDs is complex, since it is intimately dependent on the nanoparticle size, shape, structure, and interface.
So-called ‘dangling bonds’ (DBs) – unsaturated Si atoms that can act as nonradiative recombination centers for the carriers54 – are known to adversely impact SiQD PLQY. Introduction of covalently bonded surface species (e.g., alkyl, polymers, oxides, etc.)42,55–63 has been met with differing degrees of success in passivating these defect states, preventing oxidation, and minimizing DB formation. Among the various approaches, alkyl-functionalized SiQDs are convenient systems for evaluating photostability because the functionalization increases solution processibility while imposing negligible effects on the optical band gap of the nanoparticles.64–66 The Kortshagan group studied 1-dodecyl functionalized SiQDs synthesized via plasma decomposition of silane and noted an approximate ∼60% decrease in PLQY after 4 h of UV irradiation that they attributed to the formation of DBs via UV-induced homolytic cleavage of Si–H or Si–Si bonds.57,58 It is well-established that amorphous silicon (a-Si) is susceptible to light-induced degradation known as the Staebler–Wronski effect (SWE) which manifests as a decrease in a-Si photoconductivity after prolonged UV light exposure.67,68 Anthony et al. also observed that increasing structural disorder (i.e., SiQDs with greater amorphous character) in plasma-generated SiQDs leads to decreased PLQY compared to more crystalline SiQDs.69
Recently, our group reported the presence of an ordered crystalline core for SiQDs with d > 6 nm from thermal processing of hydrogen silsesquioxane (HSQ) terminating in an amorphous ‘shell’. We subsequently demonstrated that the amorphous Si (a-Si) layer can be reduced by ‘over-etching’ samples with ethanolic hydrofluoric acid (HF).70,71 With the a-Si (Eg = ∼1.7 eV) shell present, the particles resembled Type-I core–shell QDs due to the comparatively smaller band gap (Eg = ∼1.1 eV) of the nanocrystalline Si core (nc-Si).62,72–74 As such, the wider band gap of the a-Si is expected to provide a barrier to charge carriers (i.e., holes and electrons) migrating to the particle surface resulting in less non-radiative recombination and an increased PLQY. However, questions remain: does the amorphous shell protect the SiQD core and provide access to higher PLQYs? Will the impact of the SWE on the amorphous shell result in decreased photostability and, by extension, lower PLQYs? Herein, we explore the impact of the amorphous shell on the photostability of 1-dodecyl-terminated SiQDs obtained from the reductive thermal processing of HSQ.
2. Experimental section
Reagents and materials
Sulfuric acid (reagent grade, 95–98%) was purchased from Caledon Laboratory Chemicals. Hydrofluoric acid (HF; electronics grade, 48–50%) was purchased from Fisher Scientific. Fuming sulfuric acid (reagent grade, 20% free SO3 bases), trichlorosilane (99%), toluene (HPLC grade), methanol (reagent grade), ethanol (reagent grade), 2,2′-azobis(2-methyl propionitrile) (98%), 1-dodecene (95.0%), and benzene (anhydrous, 99.8%) were purchased from Sigma Aldrich. A PureSolv purification system equipped with N2 as the operating gas was used for preparing dried solvents. All reagents and solvents were used as received unless otherwise specified.Preparation of hydrogen silsesquioxane (HSQ)
HSQ was synthesized using a modified literature procedure.75 Briefly, a mixture of concentrated (15 mL) and fuming (7 mL) sulfuric acid was prepared in a three-neck round bottom flask purged with argon and equipped with an addition funnel and Teflon coated stir bar. Dry toluene (45 mL) was then added to the acids via the addition funnel. A mixture of dry toluene (110 mL) and trichlorosilane (16 mL) was prepared and subsequently added dropwise into the acid-toluene mixture to obtain two-layers. The toluene layer was isolated and washed with an aqueous sulfuric acid (33% v/v) solution. The organic layer was then dried over solid MgSO4 and CaCO3 for 12 hours, after which the solvent volume was removed using rotary evaporation and finally dried in vacuo to yield a white solid.Preparation of SiQDs/SiO2 composite
SiQDs were prepared by way of thermally-induced disproportionation of HSQ using a well-established procedure developed in our laboratory.76 HSQ (5 g) was placed in a standard tube furnace with a flowing 5% H2/Ar atmosphere at 1200 or 1300 °C to yield oxide composites containing ca. 5 or 9 nm inclusions of elemental silicon, respectively. The composite was then mechanically ground using an agate mortar and pestle and shaken with glass beads in ethanol (∼300 mL) to provide a fine powder that was used in subsequent etching procedures.Preparation of hydride-terminated SiQDs
Hydride-terminated SiQDs (H-SiQDs) were liberated from appropriate oxide composites via ethanolic HF-etching of the ground composite.71 Composite (∼500 mg) obtained from processing HSQ at 1200 °C was etched using a solution (16.5 mL) of ethanol![[thin space (1/6-em)]](https://www.rsc.org/images/entities/char_2009.gif) :distilled water:49% HF (1:1:1) in a PET beaker that was equipped with a Teflon coated stir bar for a predetermined time. The liberated freestanding SiQDs were then extracted into a minimum amount of toluene (∼30 mL) and collected with centrifugation before redispersing twice in toluene (∼10 mL) dried over molecular sieves. These two subsequent centrifugations washes remove any residual HF. For convenience in the present discussion, we refer to “normal” H-SiQDs as those obtained from etching “1200 °C composites” for 1 h. “Over-etched” H-SiQDs were prepared similarly by etching composite (∼700 mg) prepared by thermally processing HSQ at 1300 °C with a solution (24 mL) of ethanol:distilled water:HF (1:1:1) for ca. 3.5–4 h until the suspension colour resembles that of the 1hr etch of ‘1200 °C composites’. The H-SiQDs were used immediately in functionalization reactions (vide infra).
:distilled water:49% HF (1:1:1) in a PET beaker that was equipped with a Teflon coated stir bar for a predetermined time. The liberated freestanding SiQDs were then extracted into a minimum amount of toluene (∼30 mL) and collected with centrifugation before redispersing twice in toluene (∼10 mL) dried over molecular sieves. These two subsequent centrifugations washes remove any residual HF. For convenience in the present discussion, we refer to “normal” H-SiQDs as those obtained from etching “1200 °C composites” for 1 h. “Over-etched” H-SiQDs were prepared similarly by etching composite (∼700 mg) prepared by thermally processing HSQ at 1300 °C with a solution (24 mL) of ethanol:distilled water:HF (1:1:1) for ca. 3.5–4 h until the suspension colour resembles that of the 1hr etch of ‘1200 °C composites’. The H-SiQDs were used immediately in functionalization reactions (vide infra).
Preparation of dodecyl-terminated SiQDs
Radical-initiated hydrosilylation was used to functionalize the H-SiQD surfaces and render them solution processible.64 Briefly, ‘normal’ H-SiQDs (∼0.5 g) were dispersed in dry toluene (10 mL), 1-dodecene (6 mL), and AIBN (300 mg) in an Ar-purged Schlenk flask equipped with a Teflon coated stir bar. The reaction mixture was subsequently degassed via three sequential freeze–pump–thaw cycles and placed in an oil bath at 70 °C for 17–19 h under flowing Ar. After cooling to room temperature, surface functionalized SiQDs isolated from the reaction mixture via centrifugation with toluene and methanol. ‘Over-etched’ H-SiQDs (∼0.7 g) were functionalized using the same procedure in dry toluene (14 mL) and 1-dodecene (8.4 mL) with an AIBN (420 mg) initiator. After purification, the wet pellets of SiQDs were dispersed in a minimum amount of benzene (ca. 1 mL), filtered using a 0.45 μm PTFE syringe filter into a pre-weighted vial, and freeze-dried. Solid dodecyl-SiQDs were massed in the vial, transferred into the glovebox, redispersed with dry toluene (∼2 mg ml−1), and stored in subdued light until needed.Photodegradation of dodecyl-terminated SiQDs suspensions
Photodegradation experiments were performed using a custom the Schlenk flask equipped with a quartz insert to facilitate exposure to the emission from a UV light LED source (365 nm, Nichia, model NCSU033A operated at 4.5 V). In an Ar-filled glovebox, the toluene suspension of functionalized SiQDs (i.e., normal or over-etched) was transferred to the Schlenk flask that was already equipped with a pre-dried Teflon stir bar and the quartz insert was affixed. The sealed flask containing the SiQD suspension was then removed from the glovebox and affixed to a standard Schlenk manifold with Ar working gas. The flask was wrapped with aluminum foil and irradiation commenced under flowing Ar while the apparatus was maintained at 10 °C. Aliquots were taken at predefined time intervals using a glass syringe and stored in the glovebox until needed for analyses.Optical characterization
Optical characterization of all SiQD suspensions was performed in a quartz cuvette (1 cm × 1 cm). Photoluminescence (PL) spectra were acquired by exciting samples using the combined 351 and 364 nm lines of an argon ion laser and collecting the emission using an optic fiber connected to an Ocean Optics USB 2000+ Spectrometer. A 425 nm long-pass filter (LPF) was used to eliminate scattered light from the excitation source. The spectral response was calibrated using a blackbody radiator. Time-resolved PL (PL lifetime) measurements were acquired using the same laser (20 mW) interfaced to an acoustic-optic modulator (50 ns response time) operated at a frequency of 100 Hz with a 50% duty cycle. The PL was captured by an optic fiber, sent through a 500 nm long-pass filer, and counted by a Hamamatsu H7422P-50 photomultiplier tube (PMT) interfaced with a Becker-Hickl PMS-400A gated photon counter. The data was collected without wavelength selection and used 1 μs time steps. The mean PL decay lifetimes were found by fitting the data using a log–normal lifetime distribution function.51,77 UV-vis absorption spectra were measured using the Ocean Optics USB 2000+ spectrometer with a MINI-D2T Deuterium Tungsten light source (λex = 200–1000 nm).Absolute PL quantum yield (PLQY) measurements were performed using an integrating sphere with a 365 nm light-emitting diode excitation source. Solutions were diluted to have an absorbance between 0.08 to 0.13 at 400 nm. The PL and excitation intensities were measured through an optical fiber and analyzed with an Ocean Optics 2000+ spectrometer using a NIST-calibrated light source for absolute irradiance measurements. The measurements were done in triplicate.
Fourier transform infrared spectroscopy (FT-IR)
SiQDs were drop-cast onto a silicon wafer from dry toluene suspensions and the toluene was evaporated under ambient conditions. FT-IR spectra were acquired using a Thermo Nicolet 8700 FTIR Spectrometer equipped with a microscope.X-ray photoelectron spectroscopy (XPS)
Samples were prepared by drop-casting toluene suspensions of SiQDs onto copper foil. XP spectra were measured using Kratos Axis 165 Ultra X-ray photoelectron spectrometer with a monochromatic Al Kα source operating at 210 W with an energy ħν = 1486.6 eV. Survey spectra were acquired using an analyzer pass energy of 160 eV and a step size of 0.3 eV. For high-resolution spectra, a pass energy of 20 eV and a step size of 0.1 eV were used. All spectra were calibrated to C 1s (284.4 eV) using CasaXPS (VAMAS) software with a Shirley-type background to remove most of the extrinsic loss structure. The Si 2p region was fit to appropriate spin–orbit splitting with Si 2p3/2 and Si 2p1/2 components – the doublet area ratio fixed at 2:1 and separated spin–orbit splitting fixed at 0.62 eV.
Thermal gravimetric analysis (TGA)
Dried SiQDs were transferred to an appropriate platinum pan that was placed in a Mettler Toledo TGA/DSC 1 star system. The sample weight loss was monitored in a N2 atmosphere over the temperature range of 25 to 700 °C at a temperature ramp rate of 10 °C min−1. Estimation of ligand surface coverage was determined using an established literature procedure.15X-ray diffraction (XRD)
XRD samples were prepared by drop-casting toluene suspensions of SiQDs onto a zero-background Si wafer and measured in a thin film orientation using a Rigaku Ultima IV multipurpose X-ray diffraction system equipped with a Cu Kα source. For thin-film diffraction, a parallel beam was used with a glancing angle of 0.5°. The XRD peaks were analyzed with the Debye-Scherrer equation: , where dxrd is the mean size of the crystalline domain, K is the shape factor (K = 0.94 for spherical crystals with cubic lattice),78λ is the X-ray wavelength (λCuKα = 0.15406 nm), β is the full-width-at-half-maximum (FWHM) of the reflections (rad), and θ is the Bragg angle (rad).
Raman spectroscopy
Samples were prepared by drop-casting toluene suspensions of SiQDs onto a copper foil. Spectra were acquired using a Renishaw Raman microscope InVia upon excitation with a 532 nm laser.Electron paramagnetic resonance (EPR)
EPR samples were prepared in EPR tubes containing a capillary tube with SiQDs toluene suspension (0.2 mL) inside a nitrogen-filled glovebox. The EPR tubes were capped and sealed with Parafilm to minimize exposure to ambient atmosphere throughout the EPR measurement. Spectra were acquired on a Bruker EMX Nano spectrometer at room temperature with X-band microwave (applied frequency of 9.636859 GHz) and a microwave attenuation of 25 dB. The field was centered at 3434 G with a sweep width of 500 G and sweep time of 75 s. A receiver gain of 30 dB and modulated amplitude of 5 G were set. Each spectrum was measured with 2 scans.Transmission electron microscopy (TEM)
TEM samples were prepared by depositing a drop of a dilute toluene suspension of the sample in question onto a holey or ultra-thin carbon-coated copper grid (obtained from Electron Microscopy Inc.). The grid bearing the sample was subsequently transferred to a vacuum chamber at a base pressure of 0.2 bar for at least 24 h prior to data collection. Bright field TEM images were acquired using a JEOL JEM-ARM200CF S/TEM electron microscope with an accelerating voltage of 200 kV. High-resolution (HR) TEM images were processed using Gatan Digital Micrograph software (Version 3.4.1).3. Results and discussion
‘Normal’ (N) SiQDs bearing thick a-Si shell and ‘over-etched’ (O) SiQDs with thin-to-no amorphous layer were subjected to the emission from a 365 nm UV lamp for up to 72 h. The integrity of the SiQDs was evaluated using optical, structural, and compositional analyses before and after exposure. To interrogate the impact of an a-Si shell on the photostability of SiQD optical properties, it was necessary to prepare nanoparticles with the same physical dimensions but different crystallinity (i.e., crystalline core/a-Si shell vs. crystalline). To realize these SiQD classes, we thermally processed HSQ at 1200 and 1300 °C in a slightly reducing atmosphere to yield different oxide composites containing elemental silicon inclusions with dimensions of ca. 5 and ca. 9 nm, respectively (Scheme 1). SiQDs were then liberated from the protective silicon oxide matrix via alcoholic HF etching. Materials prepared in this way comprise a crystalline core and amorphous shell; the majority of the a-Si shell can then be removed with prolonged HF etching.71 For ease of understanding, our present discussion refers to the SiQDs bearing a thicker amorphous shell obtained from the 1200 °C-processed composite and subjected to aqueous ethanolic HF etching for 1 h as ‘normal’. ‘Over-etched’ SiQDs were prepared by prolonged etching (i.e., 3.5–4 h) of the composite processed at 1300 °C. The extended etching simultaneously removes the thick amorphous shell and reduces particle dimensions to align closely with those of the N-SiQDs. Following liberation from the oxide, both classes of SiQDs were surface modified with 1-dodecene via AIBN-initiated radically-induced hydrosilylation to yield solution-stable dodecyl-SiQDs. Four batches of N-SiQDs and five batches of over-etched O-SiQDs were prepared.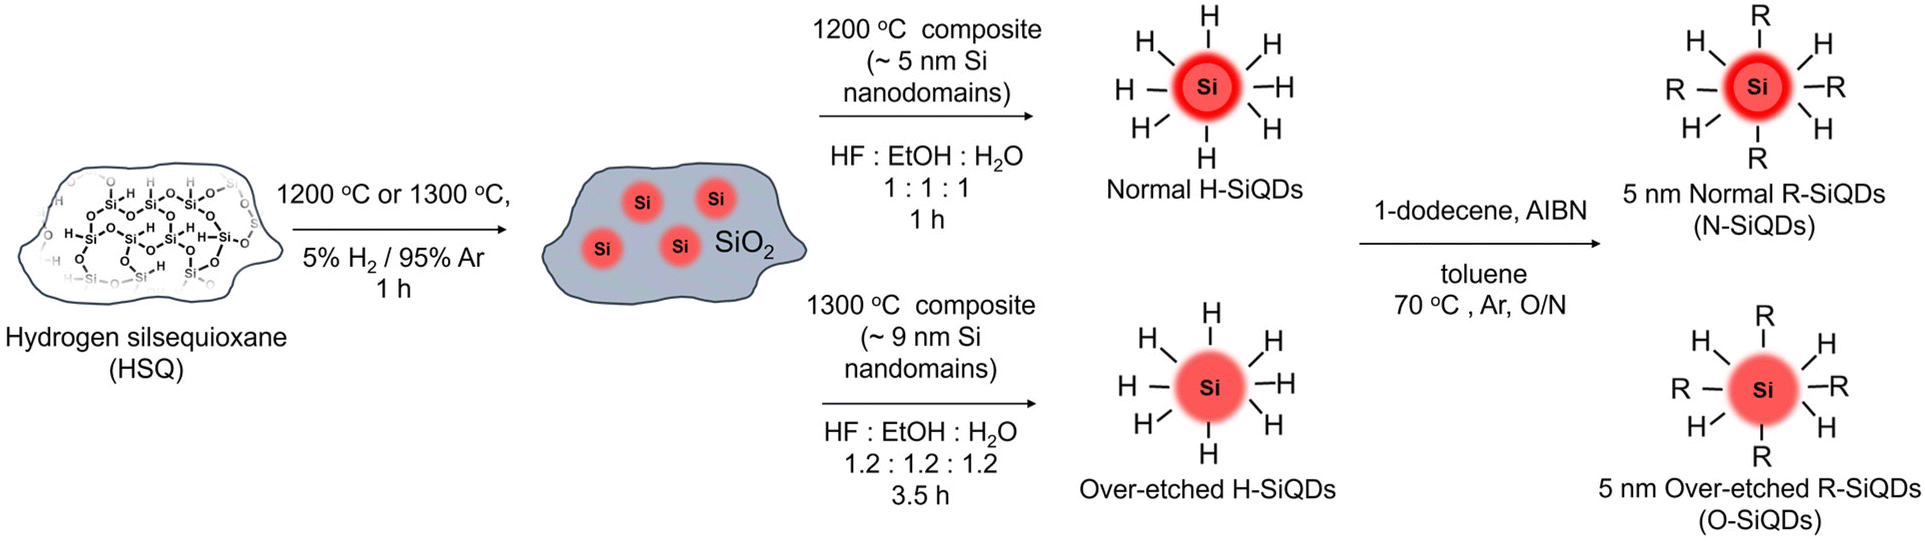 | ||
| Scheme 1 Preparation of ‘normal’ and ‘over-etched’ dodecyl-functionalized SiQDs. Freestanding H-SiQDs were liberated from HF-etching of thermally-processed HSQ, followed by radical-initiated hydrosilylation with 1-dodecene. | ||
Representative bright-field TEM images (Fig. 1a and c) indicate that dodecyl functionalized N-SiQDs and O-SiQDs possessed statistically identical physical dimensions of 5.1 ± 1.2 nm (Fig. 1b) and 5.3 ± 1.1 nm (Fig. 1d), respectively. As expected, corresponding dark-field TEM images (Fig. S1†) also revealed equivalent sizes. In contrast to our TEM analysis, Debye-Scherrer fit of the XRD patterns (Fig. 1e) indicates N-SiQDs possess an XRD crystallite size of ca. 3.5 nm while O-SiQDs exhibit an average XRD crystallite size of ca. 4.9 nm. This observation is expected and consistent with previous studies.71 Raman spectroscopy was used to probe the order/disorder structures present in the nanoparticles. Fig. 1f shows the Raman spectra of both SiQD classes comprising a sharp peak at ca. 512 cm−1 that is attributed to nanocrystalline Si (nc-Si).79,80 In contrast to the single, asymmetric Lorentizan peak observed for O-SiQDs, a broad shoulder at approximately 470 cm−1 is also evident in the spectrum of the N-SiQDs that arises from a-Si.81 The combined TEM, XRD, and Raman analyses, as well as our previous report,70 all point to over-etching being effective in the removal of the amorphous shell from O-SiQDs. FT-IR and XP (Fig. S2†) spectra were measured and suggest the two sets of nanoparticles were of equivalent composition. In addition, a weight loss of ca. 45% noted in TGA (Fig. S2†) for both sets of SiQDs further suggesting a similar degree of surface functionalization (i.e., ca. 55%).
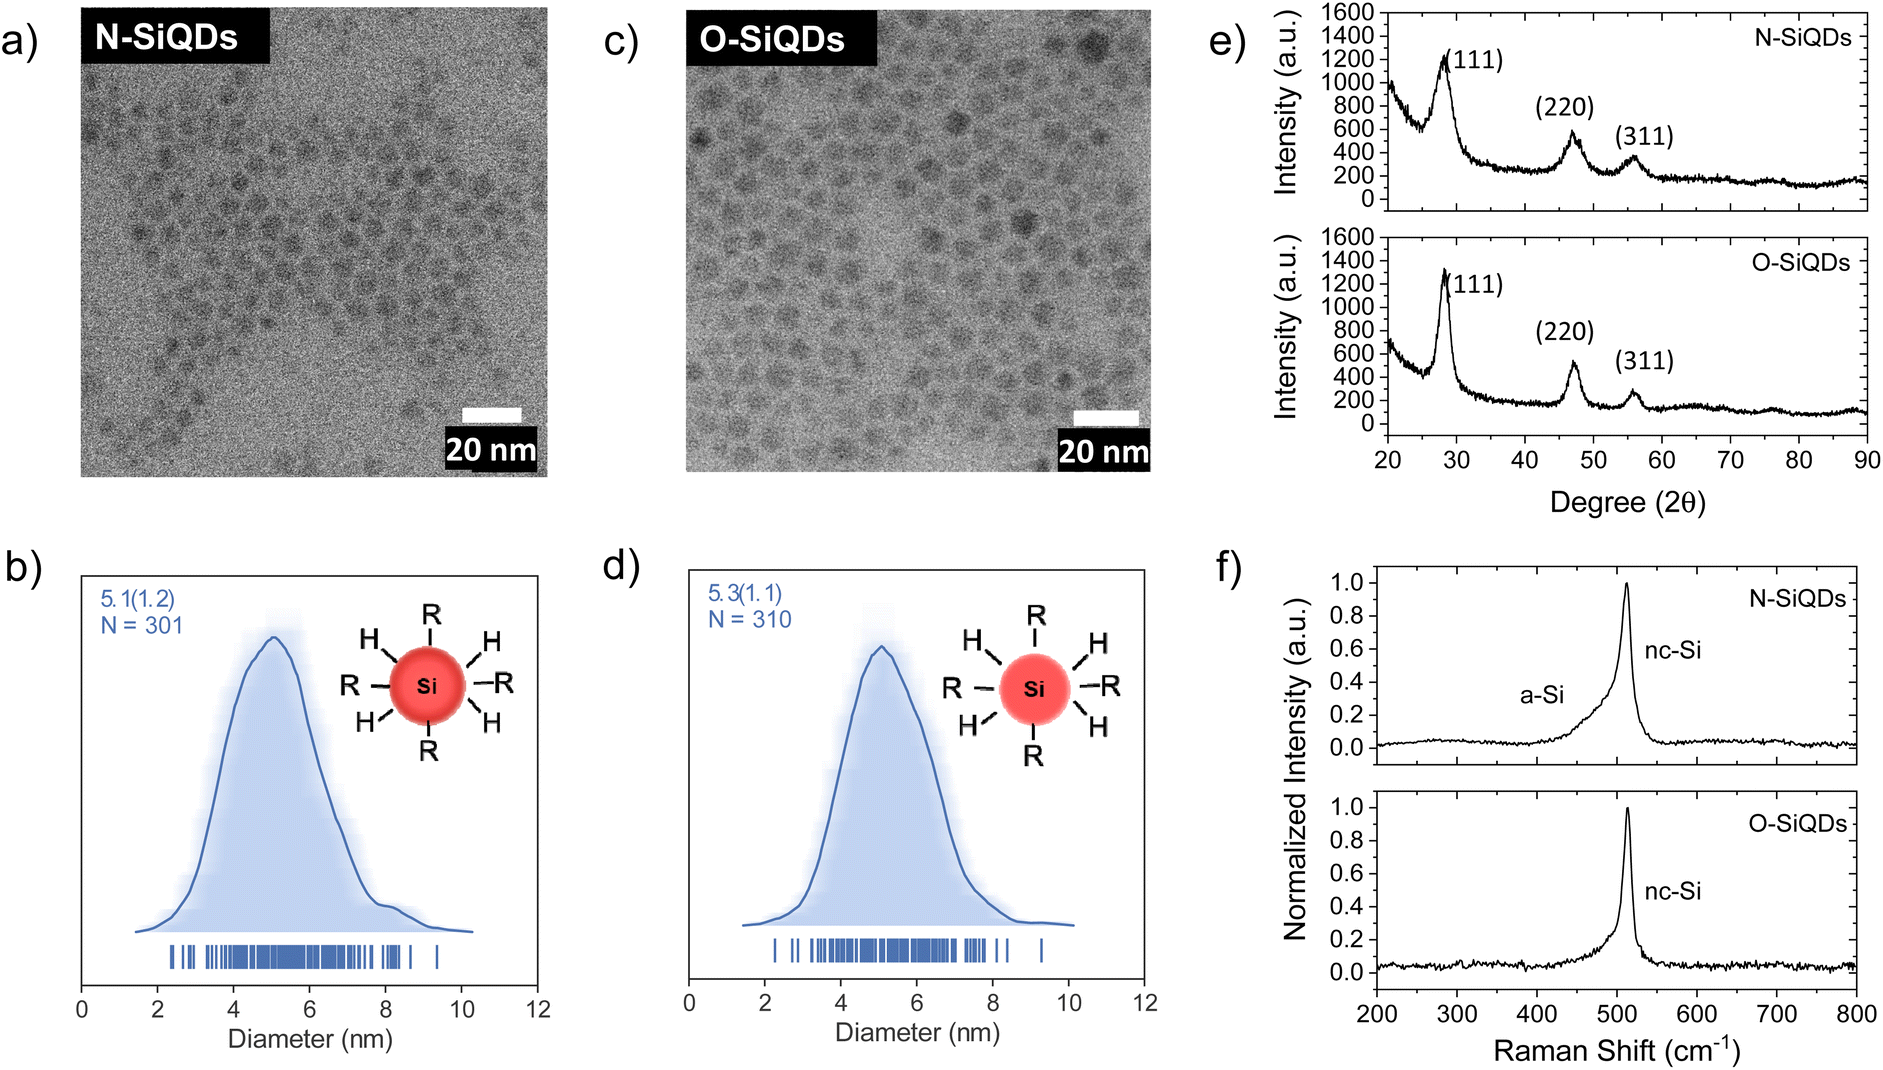 | ||
| Fig. 1 Structural characterization of the SiQDs used in this study. Brightfield TEM images show equivalent physical dimensions of (a) N-SiQDs (5.1 ± 1.2 nm) and (c) O-SiQDs (5.3 ± 1.1 nm). The respective size distributions, (b) and (d), are presented as average-shifted histograms. (e) XRD patterns, and (f) Raman spectra show evidence of greater long-range order in O-SiQDs. | ||
The PL of the as-produced SiQDs is summarized in Table S1† and compared using boxplots (see Fig. 2). Both N- and O-SiQDs exhibited featureless UV-vis absorption spectra (Table S1†). The QDs all emitted near-infrared PL centered in the range of 810 to 940 nm with broad emission bandwidths (full-width-at-half-maximum (FWHM) in the range of ca. 129 to 234 nm; Fig. S3 and S4†). Characteristic S-band Si PL lifetimes of 160 to 400 μs were also observed for both classes of QDs.82 O-SiQDs exhibited similar mean PL maxima and longer mean PL lifetime than the N-SiQDs; however, no statistical differences in these properties were found between the two classes of samples (Fig. 2a and b).
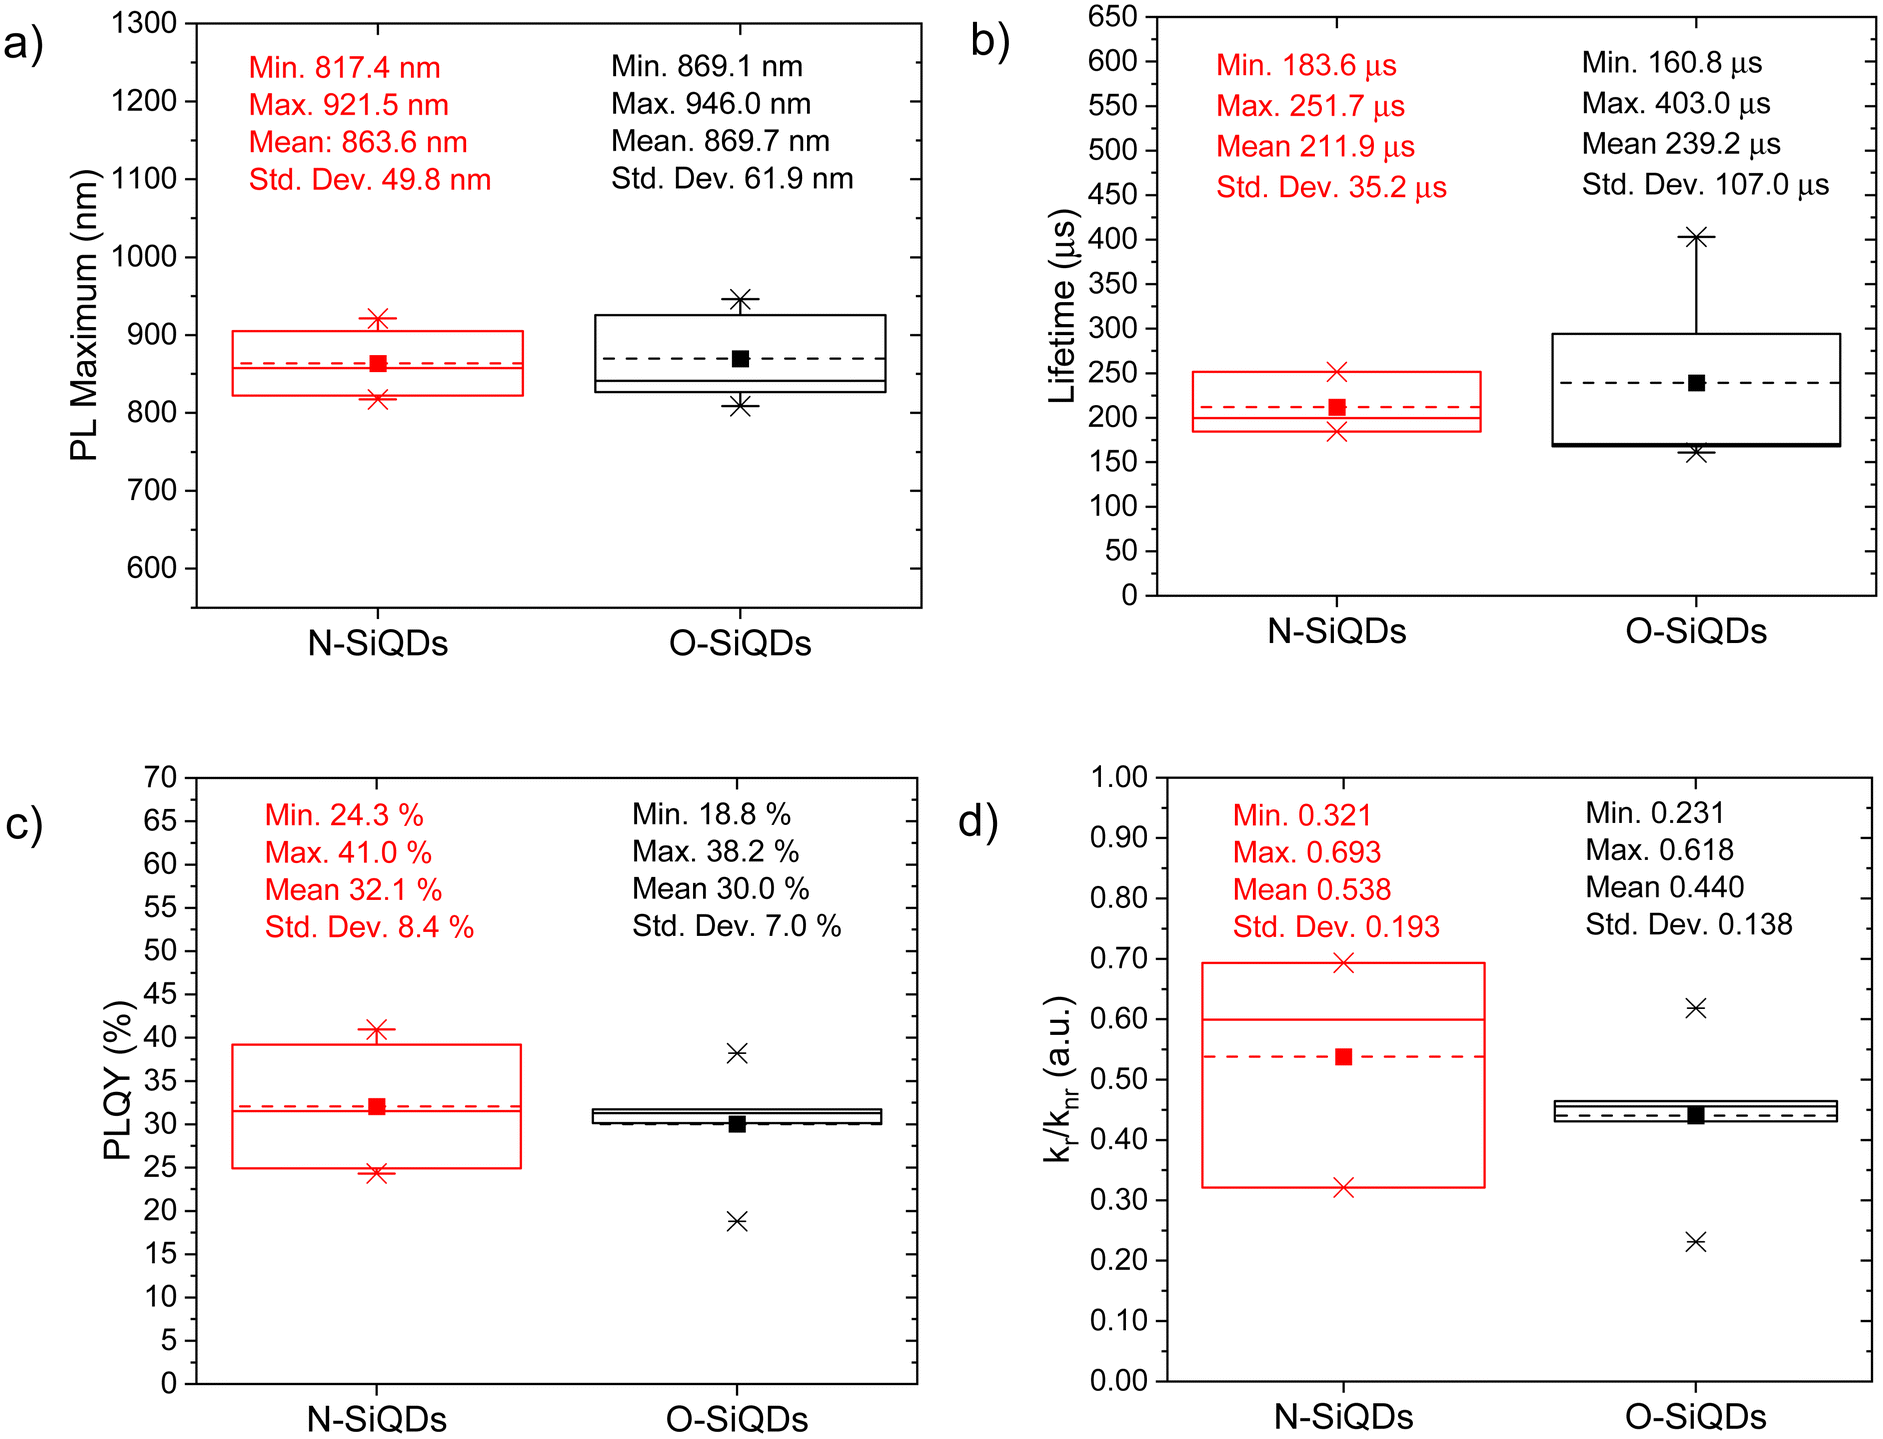 | ||
| Fig. 2 Boxplots comparing the (a) PL max, (b) mean PL lifetime, (c) PLQY, and (d) kr/knr of the as-produced N-SiQDs an5555d O-SiQDs. Mean and median of the distributions are represented by dash and solid lines in the boxes, respectively. | ||
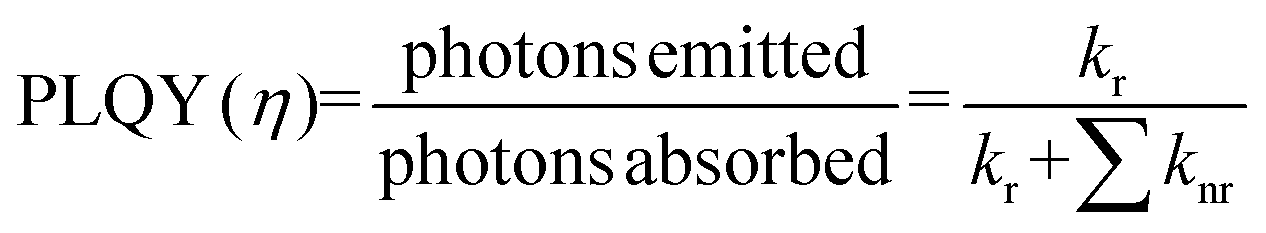
PLQY of the as-produced SiQDs were measured to establish whether the inclusion of an a-Si shell influences the radiative recombination of excitons. Recall, PLQY quantifies the efficiency of QDs in producing emitted photons from absorbed photons and depends upon the specific radiative and all non-radiative processes as summarized in eqn (1) and (2):
 | (1) |
 | (2) |
The bulk band gap of a-Si is larger than that of bulk crystalline silicon (e.g., ca. 1.7 eV73vs. ca. 1.1 eV74). An a-Si shell hence is expected to provide a passivation layer that would confine photo-excited charge carriers to the crystalline core and limit surface state-related non-radiative recombination pathways directly analogous to what is observed from traditional Type-I QDs. However, we note that N-SiQDs have similar PLQY as the O-SiQDs. One must consider that a 1 to 3 nm thick a-Si layer can have a varying number of trap states in the band gap which could lead to electron–hole delocalization at the a-Si:c-Si interface.84 We hypothesize that the positive effects of the large band gap a-Si shell are counteracted by the negative effects of defects introduced by the amorphous structure. The balanced effect therefore showed minimal improvement in the radiative recombination in N-SiQDs. The removal of this a-Si shell, which comes with the loss of corresponding trap states, could lead to the narrower spread of radiation recombination rates observed for O-SiQDs (vide supra). A detailed investigation of the relationship between the thickness and quality of the amorphous layer on the optical properties of the nanoparticles would be of interest to uncover the potential of core–shell structure, however precise control on tuning of the amorphous shell is yet to be explored and is beyond the scope of this study.
To study the photostability of N-SiQDs and O-SiQDs, the materials were suspended in dry toluene and irradiated by 365 nm UV-LEDs at 4.5 V under an Ar atmosphere for 72 h. Aliquots were extracted at predefined time intervals and evaluated by PL, UV-vis absorption, emission lifetime, and PLQY as summarized in Fig. 3. A small shift in PL maximum (<10 nm; Fig. 3a) was occasionally observed that we attribute to trace oxidation occurring during material handling and data acquisition (Fig. S3 and S4†). Of important note, these shifts were negligible compared to previously reported prominent oxidation-induced blue-shift.51,85
 | ||
| Fig. 3 A summary of the optical properties of N-SiQDs (red circles) and O-SiQDs (black squares). (a) PL maxima, (b) PLQY, (c) PL lifetime, and (d) recombination rate ratio as a function of time over a period of 72 h of UV irradiation. Error bars represent the 95% limit of measurement. Representative PL and UV-vis absorption spectra of each sample are plotted in Fig. S3, S4 and summarized in Tables S2, S3.† | ||
The decrease of the PLQY observed for the SiQD suspensions results primarily from the influence of surface defects and/or DBs created as a result of UV irradiation. On average, both classes of SiQDs maintained ca. 90% of their initial PLQYs (Fig. 3b and Tables S2, S3†) during the first 24 h of irradiation. After which, the average PLQY of N-SiQDs continued to decrease to ca. 80% of its original value after 48 h irradiation and finally to ca. 70% after 72 h. O-SiQDs maintained ca. 90% of their initial PLQY for the first 48 h before eventually decreasing to ca. 70% after 72 h. A similar photostability study by Wu et al. observed a plateau in PLQY loss after reaching ca. 20% in SiQDs that were synthesized using non-thermal plasma methods.58 It is unclear if these particles possess an a-Si shell. Regardless, both studies suggest dodecyl-SiQDs reach a steady state of ca. 20–30% decrease from their “as prepared” original PLQY following prolonged UV irradiation. Although the quantum efficiency decreased as a result of irradiation, the PL lifetimes remained fairly consistent (Fig. 3c). Using eqn (1) and (2), the radiative and non-radiative decay rates can be determined independently (Fig. 3d). The trends of recombination rates are fitted with a linear regression (Fig. S5 and Table S4†). In general, for N-SiQDs with amorphous shells, the non-radiative rate increased with a decrease in radiative rate upon irradiation; whereas for the O-SiQDs the radiative and non-radiative rates remained constant. These observations further point to the reduced optical stability of N-SiQDs.
We hypothesize that these observations can be understood in the context of the Staebler–Wronski effect, in which irradiation of a-Si could generate dangling bonds that reduce radiative recombination. A recent STM study reported by Kislitsyn et al. provides a more direct visualization of a-Si generating dangling bonds and deep charge traps by applying electrons to the amorphous shell of SiQDs through the STM tip.81 In addition to the defects formed at the surface of a-Si, the formation of dangling bonds at the amorphous-Si:crystalline-Si interface (a-Si:c-Si) could also lead to a decrease in radiative recombination efficiency. Plagwitz et al. similarly attributed an increase in the surface recombination velocity to defects at the a-Si:c-Si interface.68 A potential mechanism for decreased kr involves charge carrier tunneling from the QD core to the interface, where the charge carriers non-radiatively recombine. In contrast, O-SiQDs exhibit minimal changes in recombination rate under similar conditions; this underscores the unique role of the a-Si shell in modulating radiative recombination dynamics during prolonged illumination.86 Nevertheless, it is important to note that the slope is two to three orders of magnitude (10−5 to 10−6) smaller than the k values (10−3) and the sample size of N-SiQDs is smaller than O-SiQDs. Studies that are beyond the scope of the present paper are ongoing to explore the origin of the decrease. A prospective transient absorption and scanning tunneling spectroscopic81,87,88 study provided insights into the photophysics and electronics of the different SiQDs under illumination.
The creation of dangling bonds through Si–H and Si–Si cleavage will certainly lead to a decrease in PL and conductivity and result in surface species desorption from the nanoparticles in the form of ˙SiH3(g) and ˙H(g).89,90 To account for this, samples of SiQDs with and without 72 h of irradiation were characterized by XPS and FT-IR to probe any changes in their structure and compositions. As expected, XP spectra of the SiQDs were the same (Fig. S5†) showing similar Si species regardless of the degradation, suggesting minimal oxidation. Likewise, both classes of SiQDs show comparable features in their FT-IR spectra, aside from a minor increase in the Si-Ox stretches at ∼1100 cm−1 caused by exposure to oxygen during the measurement (Fig. S6†).
The Si-Hx stretching features in FT-IR spectra (Fig. 4) can be readily deconvoluted into ![[triple bond, length as m-dash]](https://www.rsc.org/images/entities/char_e002.gif) SiH (ν = 2075 cm−1),
SiH (ν = 2075 cm−1), ![[double bond, length as m-dash]](https://www.rsc.org/images/entities/char_e001.gif) SiH2 (ν = 2114 cm−1), and –SiH3 (ν = 2148 cm−1) to probe potential surface changes induced by expires to 365 nm UV (Ehν = 3.4 eV) irradiation.85,91 The as prepared samples that were not exposed to UV irradiation show SiH being the dominant surface species followed by SiH2, and –SiH3 with a peak area ratio of SiH:SiH2:–SiH3 is 58:28: 14 and 46:38:16 for N- and O-SiQDs, respectively. The different ratios of the SiHx species may be attributed to changes in the QD surface morphology upon removal of a-Si shell. The impact of extended HF etching on the surface species is, however, beyond the scope of the study and remains the subject of ongoing investigations. Upon UV exposure, ca. 20% and 6% decrease in Si–Hx stretches are observed for N-SiQDs and O-SiQDs, respectively. This observation is expected as the irradiation can cleave bonds within the SiQDs as summarized in Fig. 5. The deconvoluted FT-IR spectra after irradiation reveal a decrease in the intensity of features associated with −SiH3 and SiH and an increase in those associated with SiH2. The reduction in the –SiH3 abundance (11% for N-SiQDs and 33% for O-SiQDs) is frequently attributed to ˙SiH3(g) desorption from homolytic cleavage of Si–SiH3 (B.E. ∼2.0–2.7 eV).90,92,93 The H–Si bond of SiH2 (B.E. ∼3.2 eV) on the strained SiQD surface is also susceptible to bond cleavage that yields ˙H(g) and ˙SiH(s).89,94,95 Comparatively, the SiH silane bond should be most stable with a B.E. of ∼3.6 eV.89 The decrease in the concentration of monohydrides (i.e., SiH) and increase dihydrides (i.e., SiH2) seem to contradict the relative stabilities estimated from their bond strength but, nonetheless, they can be understood in the context of the complex surface structure of the nanoparticles. While a bulk silicon surface comprises specific crystal planes (e.g., Si(100) containing SiH2; Si(111) containing SiH), the present small SiQDs do not have well-defined facets.96–98 The silicon hydrides on the nanoparticles cannot be said to reside on ordered planes, rather, they are located on a small crystal terraces with numerous steps and edges. Upon release of volatile ˙SiH3(g) and ˙H(g), it is reasonable that the liberated species could further react with neighboring silicon hydrides, resulting in silanes (SiHx(g)) and hydrogen gas (H2(g)).90,99,100 This complex structure together with the reactive radicals could enable SiH2 formation in expense of normally less reactive SiH. The consistent loss of –SiH3 components suggests surface species desorption resulted from SiQDs photodegradation.
SiH2 (ν = 2114 cm−1), and –SiH3 (ν = 2148 cm−1) to probe potential surface changes induced by expires to 365 nm UV (Ehν = 3.4 eV) irradiation.85,91 The as prepared samples that were not exposed to UV irradiation show SiH being the dominant surface species followed by SiH2, and –SiH3 with a peak area ratio of SiH:SiH2:–SiH3 is 58:28: 14 and 46:38:16 for N- and O-SiQDs, respectively. The different ratios of the SiHx species may be attributed to changes in the QD surface morphology upon removal of a-Si shell. The impact of extended HF etching on the surface species is, however, beyond the scope of the study and remains the subject of ongoing investigations. Upon UV exposure, ca. 20% and 6% decrease in Si–Hx stretches are observed for N-SiQDs and O-SiQDs, respectively. This observation is expected as the irradiation can cleave bonds within the SiQDs as summarized in Fig. 5. The deconvoluted FT-IR spectra after irradiation reveal a decrease in the intensity of features associated with −SiH3 and SiH and an increase in those associated with SiH2. The reduction in the –SiH3 abundance (11% for N-SiQDs and 33% for O-SiQDs) is frequently attributed to ˙SiH3(g) desorption from homolytic cleavage of Si–SiH3 (B.E. ∼2.0–2.7 eV).90,92,93 The H–Si bond of SiH2 (B.E. ∼3.2 eV) on the strained SiQD surface is also susceptible to bond cleavage that yields ˙H(g) and ˙SiH(s).89,94,95 Comparatively, the SiH silane bond should be most stable with a B.E. of ∼3.6 eV.89 The decrease in the concentration of monohydrides (i.e., SiH) and increase dihydrides (i.e., SiH2) seem to contradict the relative stabilities estimated from their bond strength but, nonetheless, they can be understood in the context of the complex surface structure of the nanoparticles. While a bulk silicon surface comprises specific crystal planes (e.g., Si(100) containing SiH2; Si(111) containing SiH), the present small SiQDs do not have well-defined facets.96–98 The silicon hydrides on the nanoparticles cannot be said to reside on ordered planes, rather, they are located on a small crystal terraces with numerous steps and edges. Upon release of volatile ˙SiH3(g) and ˙H(g), it is reasonable that the liberated species could further react with neighboring silicon hydrides, resulting in silanes (SiHx(g)) and hydrogen gas (H2(g)).90,99,100 This complex structure together with the reactive radicals could enable SiH2 formation in expense of normally less reactive SiH. The consistent loss of –SiH3 components suggests surface species desorption resulted from SiQDs photodegradation.
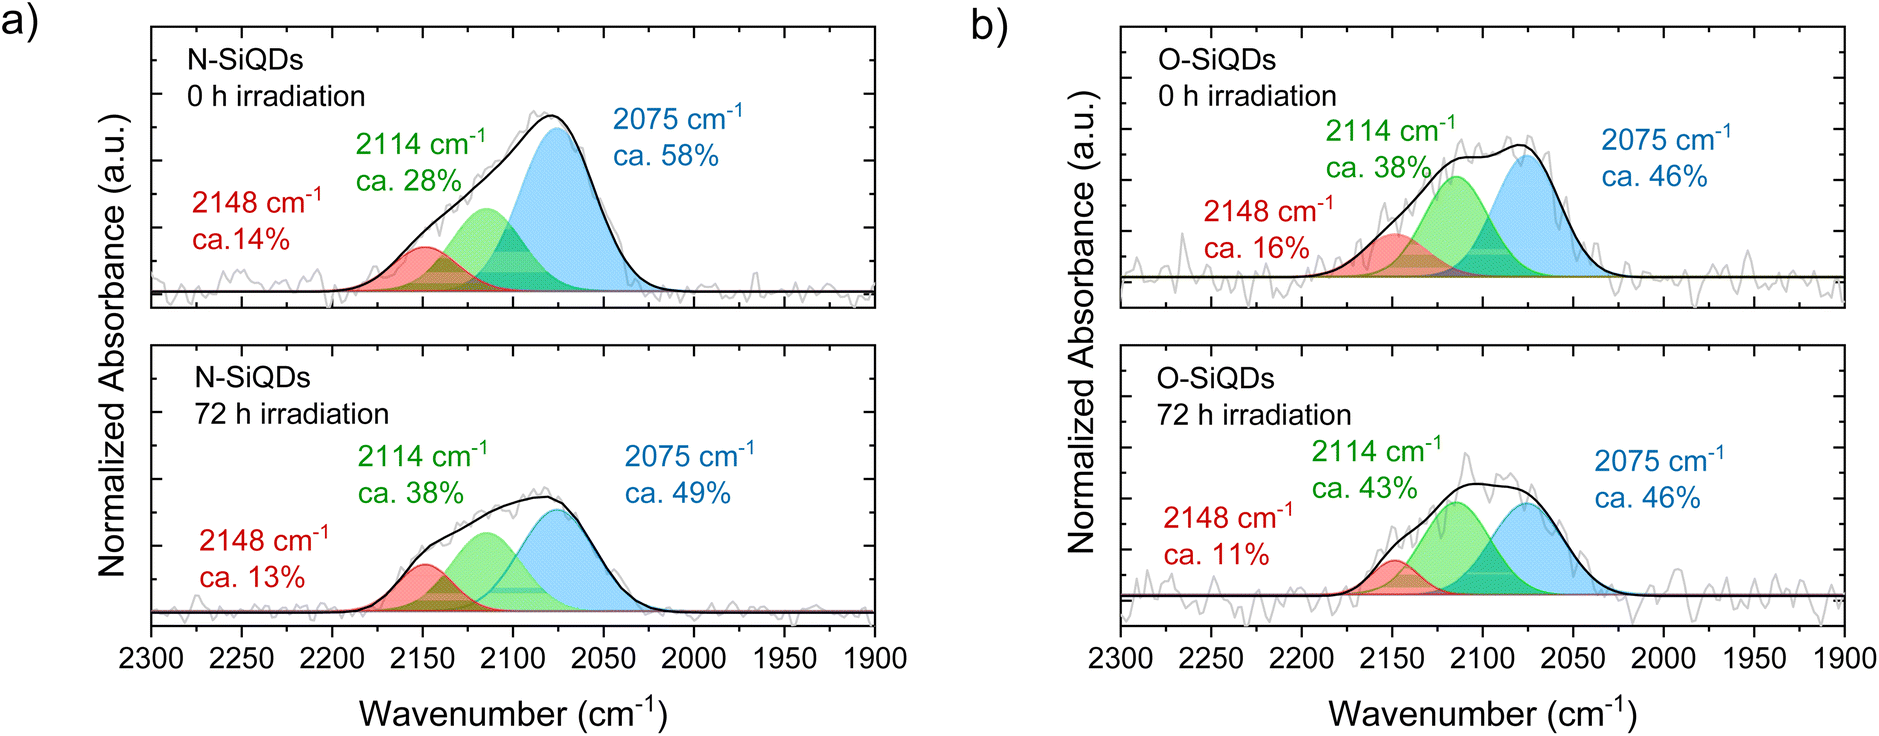 | ||
| Fig. 4 Deconvoluted FT-IR spectra of (a) N-SiQDs and (b) O-SiQDs as prepared (top) and following 72 h UV irradiation (bottom) spanning the SiHx stretching region and deconvoluted to show the contributions from SiH3 (red), SiH2 (green), and SiH (blue) components. In general, a decrease in the SiH3 contribution is noted after irradiation. | ||
 | ||
| Fig. 5 Summary of possible bond breakages in SiQDs upon 365 nm UV irradiation. | ||
The size and shape of the SiQDs after UV irradiation were evaluated by TEM. The corresponding microscopy images (bright-field Fig. 6a and b and dark-field Fig. S7a and b†) revealed the preservation of the spheroidal shapes in both sets of nanoparticles. The size distributions of the corresponding images (Fig. 6c, d and Fig.S7c, d†) indicated a 2% shrinkage in N-SiQDs and a 4% decrease in O-SiQDs consistent with surface atom desorption. However, it is important to note that these changes are within the error of the method and should not be over emphasized. Similarly, the Raman spectra (Fig. 6e) of the irradiated particles similarly remain unchanged from the as-produced nanoparticles. An investigation using in situ TEM101 and solid-state NMR102 could potentially provide additional insight into these structural changes and deepen our understanding of the evolving SiQD surface, however such studies are outside the current capability of our instrumentation.
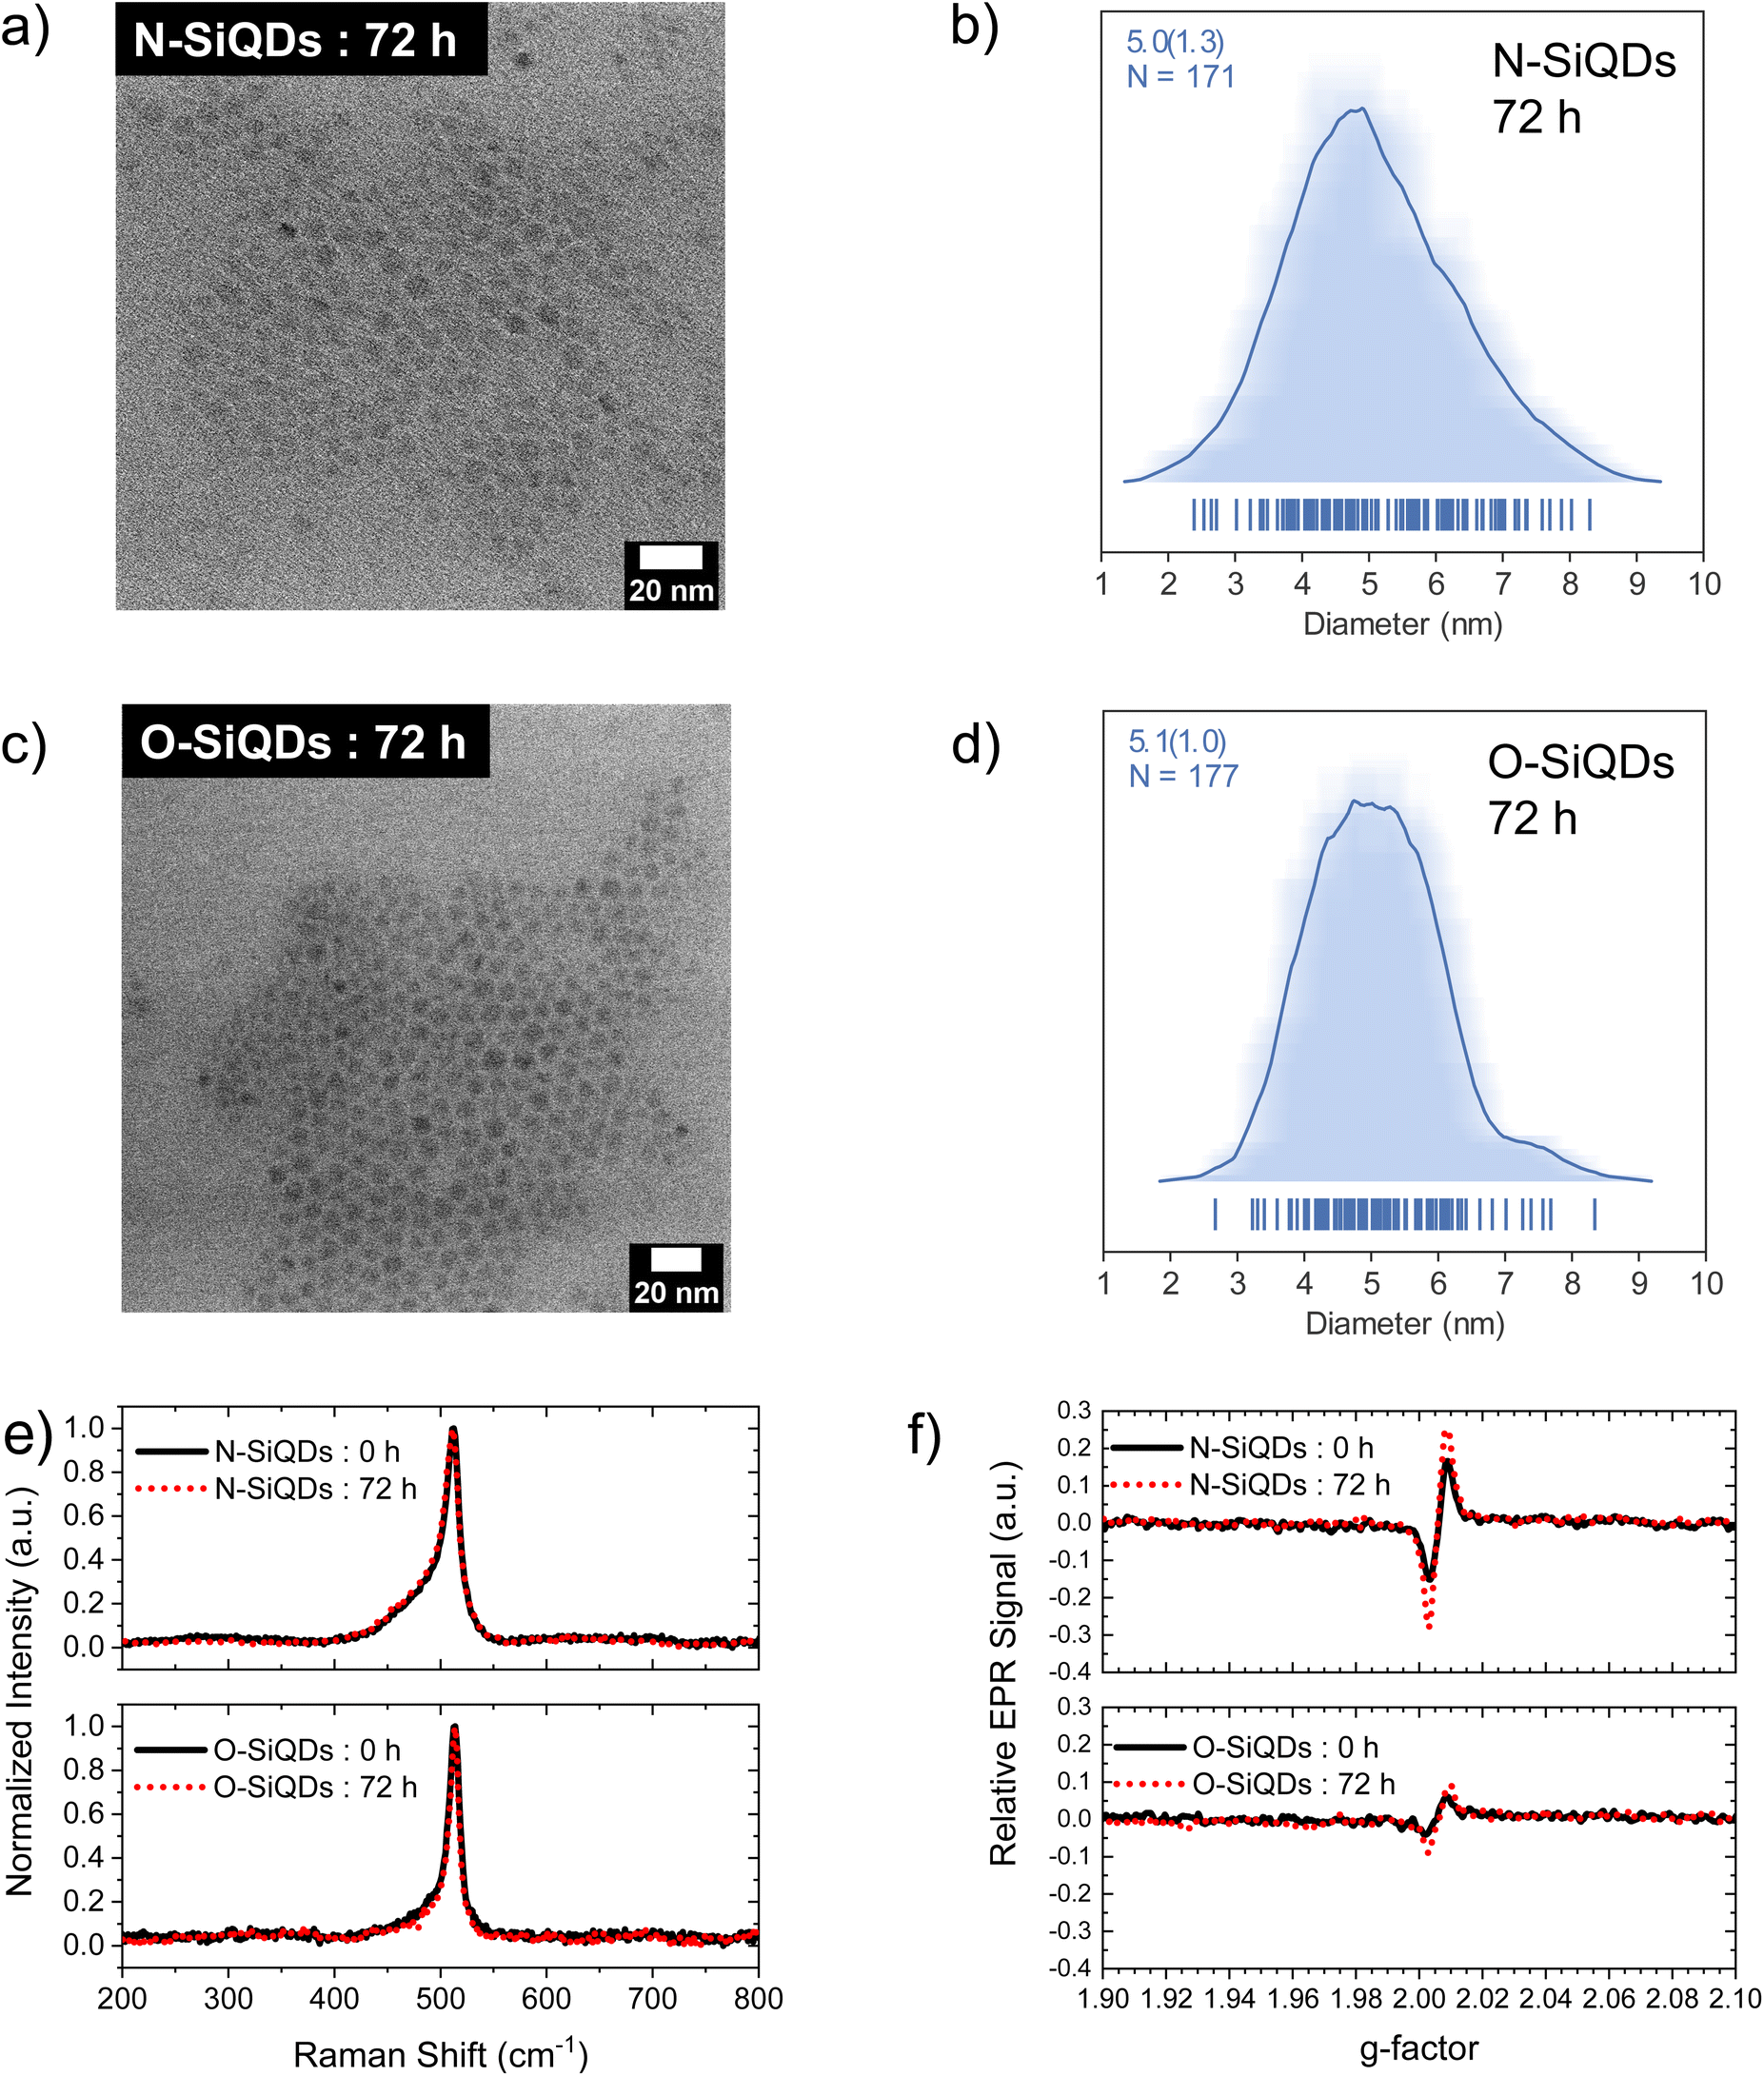 | ||
| Fig. 6 Bright-field TEM images showing equivalent physical sizes of (a) N-SiQDs and (b) O-SiQDs. The respective size distributions, (c) and (d), were plotted as average-shifted histograms. (e) Raman spectra and (f) EPR signals comparing N-SiQDs and O-SiQDs before and after 72 h of irradiation. Black solid lines and red dotted lines indicate data obtained from nanoparticles before and after irradiation, respectively. | ||
With the knowledge that the instability of radiative recombination in SiQDs is a result of the generation of defects at the nanoparticle surfaces, EPR spectroscopy was used to assess the relative densities of unpaired electron spins in the two sets of SiQDs. Toluene solutions of as-prepared and 72-hour-irradiated SiQDs (2 mg mL−1) were evaluated (Fig. 3b). For both systems, the EPR signal appeared in the range of g-factor 2.00 to 2.01 and can be ascribed to dangling bonds on silicon in a disordered environment (gD at ∼2.005) and asymmetric Pb centers at the interface of the Si nanocrystal and its oxide shell (g⊥ at ∼2.008 and g‖ at ∼2.002).80,103 The EPR signal from N-SiQDs was qualitatively more than twice as intense as that from O-SiQDs before and after irradiation; this observation is consistent with our observations of decreased PLQY and kr/knr values. Considering the two sets of nanoparticles had a similar degree of alkyl passivation, the more intense EPR signals of N-SiQDs can reasonably be ascribed to a greater number defects at the a-Si surface and a more disordered Si:SiOx and a-Si:nc-Si interface. This observation aligns with a density functional theory (DFT) study by Bushlanova et al., which indicated that amorphous SinH2m nanoclusters with sizes of ∼1 nm contained dangling bonds at the cluster surface in comparison to their crystalline counterpart.104 Prospective in situ characterization, pump–probe spectroscopy, and STM measurements would be essential to further understand the photophysics and degradation mechanisms between the different nanoparticles and are the subject of future work.
4. Conclusions
In this study, ca. 5 nm dodecyl-functionalized silicon quantum dots, with (N-SiQDs) and without (O-SiQDs) ‘thick’ amorphous shells, were prepared. The presence of amorphous layer did not significantly affect the optical properties (i.e., photoluminescence maxima, lifetime, and photoluminescence yield) of the as-produced nanoparticles. However, the quantum yield of N-SiQDs was less stable to prolonged UV irradiation compared to O-SiQDs. Structural analyses presented here indicate the adverse effects of the amorphous shell can be reasonably attributed to the generation of defects in the disordered SiQD structure. Our study provides valuable insight into the stability of SiQDs and will enable a better understanding of their core–shell structure with the target of stable luminescent systems.Author contributions
Cheong, I. T. was responsible for experimental design, SiQDs synthesis, PL degradation experiments, data collection and analysis, and manuscript preparation. Yang Szepesvari L. assisted with SiQDs synthesis, conducting PL degradation experiments, and PLQY data collection. Ni C. collected the TEM images. Butler C. acquired the XP spectra. O'Connor, K. M. assisted with HF etching training and manuscript editing. Hooper R. assisted with EPR acquisition and manuscript editing. Meldrum, A. assisted with data interpretation and manuscript edits. Veinot, J. G. C. was the supervisory author.Conflicts of interest
There are no conflicts to declare.Acknowledgements
The authors acknowledge the continued generous funding from the ATUMS training program supported by NSERC CREATE (CREATE-463990-2015), the Natural Science and Engineering Research Council (NSERC Discovery Grant program; RGPIN-2015-03896), Alberta Innovates Strategic Projects program, as well as Future Energy System (FES) which is supported by the Canada First Research Excellence Fund (CFREF). Finally, we thank the efforts of all the staff and other authors who have contributed to this work.References
- G. Ledoux, J. Gong, F. Huisken, O. Guillois and C. Reynaud, Appl. Phys. Lett., 2002, 80, 4834–4836 CrossRef CAS.
- R. J. Clark, M. K. Dang and J. G. Veinot, Langmuir, 2010, 26, 15657–15664 CrossRef CAS.
- C. M. Hessel, D. Reid, M. G. Panthani, M. R. Rasch, B. W. Goodfellow, J. Wei, H. Fujii, V. Akhavan and B. A. Korgel, Chem. Mater., 2012, 24, 393–401 CrossRef CAS.
- M. Dasog, G. B. De los Reyes, L. V. Titova, F. A. Hegmann and J. G. C. Veinot, ACS Nano, 2014, 8, 9636–9648 CrossRef CAS PubMed.
- S. Ivanov, S. Zhuravsky, G. Yukina, V. Tomson, D. Korolev and M. Galagudza, Materials, 2012, 5, 1873–1889 CrossRef CAS.
- A. Das and P. T. Snee, ChemPhysChem, 2016, 17, 598–617 CrossRef CAS.
- A. Shiohara, S. Hanada, S. Prabakar, K. Fujioka, T. H. Lim, K. Yamamoto, P. T. Northcote and R. D. Tilley, J. Am. Chem. Soc., 2010, 132, 248–253 CrossRef CAS.
- U.S. Department of Health and Human Services, Toxicity and Carcinogensis Studies of Indium Phosphide, 2001.
- R. Hardman, Environ. Health Perspect., 2006, 114, 165–172 CrossRef.
- J. Sobhanan, J. V. Rival, A. Anas, E. Sidharth Shibu, Y. Takano and V. Biju, Adv. Drug Delivery Rev., 2023, 197, 114830 CrossRef CAS.
- K. Y. Cheng, R. Anthony, U. R. Kortshagen and R. J. Holmes, Nano Lett., 2011, 11, 1952–1956 CrossRef CAS PubMed.
- B. Ghosh, Y. Masuda, Y. Wakayama, Y. Imanaka, J.-I. Inoue, K. Hashi, K. Deguchi, H. Yamada, Y. Sakka, S. Ohki, T. Shimizu and N. Shirahata, Adv. Funct. Mater., 2014, 24, 7151–7160 CrossRef CAS.
- J. Watanabe, H. Yamada, H.-T. Sun, T. Moronaga, Y. Ishii and N. Shirahata, ACS Appl. Nano Mater., 2021, 4, 11651–11660 CrossRef CAS.
- Y. C. Zhang, Z. Y. Yu, X. Y. Xue, F. L. Wang, S. Li, X. Y. Dai, L. Wu, S. Y. Zhang, S. Y. Wang and M. Lu, Opt. Express, 2021, 29, 34126–34134 CrossRef CAS PubMed.
- I. T. Cheong, J. Mock, M. Kallergi, E. Groß, A. Meldrum, B. Rieger, M. Becherer and J. G. C. Veinot, Adv. Opt. Mater., 2022, 11, 2201834 CrossRef.
- F. Meinardi, S. Ehrenberg, L. Dhamo, F. Carulli, M. Mauri, F. Bruni, R. Simonutti, U. Kortshagen and S. Brovelli, Nat. Photonics, 2017, 11, 177–185 CrossRef CAS.
- R. Mazzaro, A. Gradone, S. Angeloni, G. Morselli, P. G. Cozzi, F. Romano, A. Vomiero and P. Ceroni, ACS Photonics, 2019, 6, 2303–2311 CrossRef CAS.
- S. Han, G. Chen, C. Shou, H. Peng, S. Jin and C.-C. Tu, ACS Appl. Mater. Interfaces, 2020, 12, 43771–43777 CrossRef CAS.
- J. Huang, J. Zhou, E. Jungstedt, A. Samanta, J. Linnros, L. A. Berglund and I. Sychugov, ACS Photonics, 2022, 9, 2499–2509 CrossRef CAS.
- T. Lin, X. Liu, B. Zhou, Z. Zhan, A. N. Cartwright and M. T. Swihart, Adv. Funct. Mater., 2014, 24, 6016–6022 CrossRef CAS.
- M. Dutta, L. Thirugnanam, P. V. Trinh and N. Fukata, ACS Nano, 2015, 9, 6891–6899 CrossRef CAS PubMed.
- E. J. Henderson, A. J. Shuhendler, P. Prasad, V. Baumann, F. Maier-Flaig, D. O. Faulkner, U. Lemmer, X. Y. Wu and G. A. Ozin, Small, 2011, 7, 2507–2516 CrossRef CAS PubMed.
- C. J. T. Robidillo, M. A. Islam, M. Aghajamali, A. Faramus, R. Sinelnikov, X. Zhang, J. Boekhoven and J. G. C. Veinot, Langmuir, 2018, 34, 6556–6569 CrossRef CAS.
- Z. F. Li and E. Ruckenstein, Nano Lett., 2004, 4, 1463–1467 CrossRef CAS.
- D. Yang, Z. Cui, Z. Wen, Z. Piao, H. He, X. Wei, L. Wang, S. Mei, W. Zhang and R. Guo, ACS Mater. Lett., 2023, 5, 985–1008 CrossRef CAS.
- Z. Kang, C. H. A. Tsang, N.-B. Wong, Z. Zhang and S.-T. Lee, J. Am. Chem. Soc., 2007, 129, 12090–12091 CrossRef CAS.
- T. Kojima, H. Sugimoto and M. Fujii, J. Phys. Chem. C, 2018, 122, 1874–1880 CrossRef CAS.
- M. Iqbal, T. K. Purkait, G. G. Goss, J. R. Bolton, M. Gamal El-Din and J. G. Veinot, ACS Nano, 2016, 10, 5405–5412 CrossRef CAS PubMed.
- W. L. Wilson, P. Szajowski and L. Brus, Science, 1993, 262, 1242–1244 CrossRef CAS PubMed.
- T. van Buuren, L. N. Dinh, L. L. Chase, W. J. Siekhaus and L. J. Terminello, Phys. Rev. Lett., 1998, 80, 3803–3806 CrossRef CAS.
- J. D. Holmes, K. J. Ziegler, R. C. Doty, L. E. Pell, K. P. Johnston and B. A. Korgel, J. Am. Chem. Soc., 2001, 123, 3743–3748 CrossRef CAS PubMed.
- D. C. Hannah, J. Yang, P. Podsiadlo, M. K. Y. Chan, A. Demortière, D. J. Gosztola, V. B. Prakapenka, G. C. Schatz, U. Kortshagen and R. D. Schaller, Nano Lett., 2012, 12, 4200–4205 CrossRef CAS.
- N. Shirahata, J. Nakamura, J. I. Inoue, B. Ghosh, K. Nemoto, Y. Nemoto, M. Takeguchi, Y. Masuda, M. Tanaka and G. A. Ozin, Nano Lett., 2020, 20, 1491–1498 CrossRef CAS.
- D. S. English, L. E. Pell, Z. Yu, P. F. Barbara and B. A. Korgel, Nano Lett., 2002, 2, 681–685 CrossRef CAS.
- M. Zacharias, J. Heitmann, R. Scholz, U. Kahler, M. Schmidt and J. Bläsing, Appl. Phys. Lett., 2002, 80, 661–663 CrossRef CAS.
- J. G. Veinot, Chem. Commun., 2006, 4160–4168, 10.1039/b607476f.
- S. Godefroo, M. Hayne, M. Jivanescu, A. Stesmans, M. Zacharias, O. I. Lebedev, G. Van Tendeloo and V. V. Moshchalkov, Nat. Nanotechnol., 2008, 3, 174–178 CrossRef CAS PubMed.
- W. Sun, C. Qian, X. Cui, L. Wang, M. Wei, G. Casillas, A. S. Helmy and G. A. Ozin, Nanoscale, 2016, 8(6), 3678–3684 RSC.
- Y. Yu, G. Fan, A. Fermi, R. Mazzaro, V. Morandi, P. Ceroni, D.-M. Smilgies and B. A. Korgel, J. Phys. Chem. C, 2017, 121, 23240–23248 CrossRef CAS.
- J. Zhou, J. Huang, H. Chen, A. Samanta, J. Linnros, Z. Yang and I. Sychugov, J. Phys. Chem. Lett., 2021, 12, 8909–8916 CrossRef CAS PubMed.
- L. Mangolini, E. Thimsen and U. Kortshagen, Nano Lett., 2005, 5, 655–659 CrossRef CAS PubMed.
- A. Gupta, M. T. Swihart and H. Wiggers, Adv. Funct. Mater., 2009, 19, 696–703 CrossRef CAS.
- Z. Li and U. R. Kortshagen, Chem. Mater., 2019, 31, 8451–8458 CrossRef CAS PubMed.
- Y. Ding, R. Yamada, R. Gresback, S. Zhou, X. Pi and T. Nozaki, J. Phys. D: Appl. Phys., 2014, 47, 485202 CrossRef.
- T. A. Pringle, K. I. Hunter, A. Brumberg, K. J. Anderson, J. A. Fagan, S. A. Thomas, R. J. Petersen, M. Sefannaser, Y. Han, S. L. Brown, D. S. Kilin, R. D. Schaller, U. R. Kortshagen, P. R. Boudjouk and E. K. Hobbie, ACS Nano, 2020, 14, 3858–3867 CrossRef CAS.
- T. Orii, M. Hirasawa and T. Seto, Appl. Phys. Lett., 2003, 83, 3395–3397 CrossRef CAS.
- T. Nakamura, Z. Yuan, K. Watanabe and S. Adachi, Appl. Phys. Lett., 2016, 108, 023105 CrossRef.
- A. V. Kabashin, A. Singh, M. T. Swihart, I. N. Zavestovskaya and P. N. Prasad, ACS Nano, 2019, 13, 9841–9867 CrossRef CAS.
- M. Dasog, Z. Yang, S. Regli, T. M. Atkins, A. Faramus, M. P. Singh, E. Muthuswamy, S. M. Kauzlarich, R. D. Tilley and J. G. Veinot, ACS Nano, 2013, 7, 2676–2685 CrossRef CAS PubMed.
- M. Dasog, K. Bader and J. G. C. Veinot, Chem. Mater., 2015, 27, 1153–1156 CrossRef CAS.
- R. Sinelnikov, M. Dasog, J. Beamish, A. Meldrum and J. G. C. Veinot, ACS Photonics, 2017, 4, 1920–1929 CrossRef CAS.
- I. Sychugov, A. Fucikova, F. Pevere, Z. Yang, J. G. C. Veinot and J. Linnros, ACS Photonics, 2014, 1, 998–1005 CrossRef CAS.
- A. Fucikova, I. Sychugov and J. Linnros, Faraday Discuss., 2020, 222, 135–148 RSC.
- E. Cartier, J. H. Stathis and D. A. Buchanan, Appl. Phys. Lett., 1993, 63, 1510–1512 CrossRef CAS.
- M. Rosso-Vasic, E. Spruijt, B. van Lagen, L. De Cola and H. Zuilhof, Small, 2008, 4, 1835–1841 CrossRef CAS.
- K. Sato, N. Fukata, K. Hirakuri, M. Murakami, T. Shimizu and Y. Yamauchi, Chem.– Asian J., 2010, 5, 50–55 CrossRef CAS PubMed.
- J. Yang, R. Liptak, D. Rowe, J. Wu, J. Casey, D. Witker, S. A. Campbell and U. Kortshagen, Appl. Surf. Sci., 2014, 323, 54–58 CrossRef CAS.
- J. J. Wu and U. R. Kortshagen, RSC Adv., 2015, 5, 103822–103828 RSC.
- A. Marinins, R. Zandi Shafagh, W. van der Wijngaart, T. Haraldsson, J. Linnros, J. G. C. Veinot, S. Popov and I. Sychugov, ACS Appl. Mater. Interfaces, 2017, 9, 30267–30272 CrossRef CAS PubMed.
- D. Kajiya and K. I. Saitow, RSC Adv., 2018, 8, 41299–41307 RSC.
- K. Fujimoto, T. Hayakawa, Y. Xu, N. Jingu and K.-I. Saitow, ACS Sustainable Chem. Eng., 2022, 10, 14451–14463 CrossRef CAS.
- K. Q. Loh, H. P. Andaraarachchi, V. E. Ferry and U. R. Kortshagen, ACS Appl. Nano Mater., 2023, 6, 6444–6453 CrossRef CAS.
- X. Li, Y. He and M. T. Swihart, Langmuir, 2004, 20, 4720–4727 CrossRef CAS.
- Z. Yang, C. M. Gonzalez, T. K. Purkait, M. Iqbal, A. Meldrum and J. G. Veinot, Langmuir, 2015, 31, 10540–10548 CrossRef CAS.
- F. A. Reboredo and G. Galli, J. Phys. Chem. B, 2005, 109, 1072–1078 CrossRef CAS PubMed.
- O. Wolf, M. Dasog, Z. Yang, I. Balberg, J. G. C. Veinot and O. Millo, Nano Lett., 2013, 13, 2516–2521 CrossRef CAS PubMed.
- D. L. Staebler and C. R. Wronski, Appl. Phys. Lett., 1977, 31, 292–294 CrossRef CAS.
- H. Plagwitz, B. Terheiden and R. Brendel, J. Appl. Phys., 2008, 103, 094506 CrossRef.
- R. Anthony and U. Kortshagen, Phys. Rev. B: Condens. Matter Mater. Phys., 2009, 80, 115407 CrossRef.
- A. N. Thiessen, M. Ha, R. W. Hooper, H. Yu, A. O. Oliynyk, J. G. C. Veinot and V. K. Michaelis, Chem. Mater., 2019, 31, 678–688 CrossRef.
- A. N. Thiessen, L. Zhang, A. O. Oliynyk, H. Yu, K. M. O'Connor, A. Meldrum and J. G. C. Veinot, Chem. Mater., 2020, 32, 6838–6846 CrossRef CAS.
- R. A. Street, Adv. Phys., 2006, 30, 593–676 CrossRef.
- G. D. Cody, T. Tiedje, B. Abeles, B. Brooks and Y. Goldstein, Phys. Rev. Lett., 1981, 47, 1480–1483 CrossRef CAS.
- W. Bludau, A. Onton and W. Heinke, J. Appl. Phys., 2003, 45, 1846–1848 CrossRef.
- I. T. Cheong, W. Morrish, W. Sheard, H. Yu, B. T. Luppi, L. Milburn, A. Meldrum and J. G. C. Veinot, ACS Appl. Mater. Interfaces, 2021, 13, 27149–27158 CrossRef CAS.
- C. M. Hessel, E. J. Henderson and J. G. Veinot, Chem. Mater., 2006, 18, 6139–6146 CrossRef CAS.
- A. F. van Driel, I. S. Nikolaev, P. Vergeer, P. Lodahl, D. Vanmaekelbergh and W. L. Vos, Phys. Rev. B: Condens. Matter Mater. Phys., 2007, 75, 035329 CrossRef.
- J. I. Langford and A. J. C. Wilson, J. Appl. Crystallogr., 1978, 11, 102–113 CrossRef CAS.
- P. Yogi, M. Tanwar, S. K. Saxena, S. Mishra, D. K. Pathak, A. Chaudhary, P. R. Sagdeo and R. Kumar, Anal. Chem., 2018, 90, 8123–8129 CrossRef CAS.
- B. P. Falcão, J. P. Leitão, M. R. Soares, L. Ricardo, H. Águas, R. Martins and R. N. Pereira, Phys. Rev. Appl., 2019, 11, 024054 CrossRef.
- D. A. Kislitsyn, J. M. Mills, S. K. Chiu, B. N. Taber, J. D. Barnes, C. F. Gervasi, A. M. Goforth and G. V. Nazin, J. Phys. Chem. Lett., 2018, 9, 710–716 CrossRef CAS PubMed.
- L. Canham, Faraday Discuss., 2020, 222, 10–81 RSC.
- M. L. Mastronardi, F. Maier-Flaig, D. Faulkner, E. J. Henderson, C. Kubel, U. Lemmer and G. A. Ozin, Nano Lett., 2012, 12, 337–342 CrossRef CAS PubMed.
- M. Nolan, M. Legesse and G. Fagas, Phys. Chem. Chem. Phys., 2012, 14, 15173–15179 RSC.
- X. D. Pi, L. Mangolini, S. A. Campbell and U. Kortshagen, Phys. Rev. B: Condens. Matter Mater. Phys., 2007, 75, 085423 CrossRef.
- X. Liu, Y. Zhang, T. Yu, X. Qiao, R. Gresback, X. Pi and D. Yang, Part. Part. Syst. Charact., 2016, 33, 44–52 CrossRef CAS.
- T. L. Cocker, V. Jelic, M. Gupta, S. J. Molesky, J. A. J. Burgess, G. D. L. Reyes, L. V. Titova, Y. Y. Tsui, M. R. Freeman and F. A. Hegmann, Nat. Photonics, 2013, 7, 620–625 CrossRef CAS.
- T. M. Atkins, A. Thibert, D. S. Larsen, S. Dey, N. D. Browning and S. M. Kauzlarich, J. Am. Chem. Soc., 2011, 133, 20664–20667 CrossRef CAS.
- P. Gupta, V. L. Colvin and S. M. George, Phys. Rev. B: Condens. Matter Mater. Phys., 1988, 37, 8234–8243 CrossRef CAS.
- P. Martín, J. F. Fernández and C. R. Sánchez, Phys. Status Solidi A, 2000, 182, 255–260 CrossRef.
- B. N. Jariwala, N. J. Kramer, M. C. Petcu, D. C. Bobela, M. C. M. van de Sanden, P. Stradins, C. V. Ciobanu and S. Agarwal, J. Phys. Chem. C, 2011, 115, 20375–20379 CrossRef CAS.
- R. Walsh, Acc. Chem. Res., 1981, 14, 246–252 CrossRef CAS.
- R. T. Sanderson, J. Am. Chem. Soc., 1983, 105, 2259–2261 CrossRef CAS.
- T. M. Hafshejani, J. Wohlgemuth and P. Thissen, J. Phys. Chem. C, 2021, 125, 19811–19820 CrossRef CAS.
- Y. Shu, U. R. Kortshagen, B. G. Levine and R. J. Anthony, J. Phys. Chem. C, 2015, 119, 26683–26691 CrossRef CAS.
- Y. Q. Wang, R. Smirani and G. G. Ross, Nano Lett., 2004, 4, 2041–2045 CrossRef CAS.
- G. Hadjisavvas, I. N. Remediakis and P. C. Kelires, Phys. Rev. B: Condens. Matter Mater. Phys., 2006, 74, 165419 CrossRef.
- H. F. Wilson and A. S. Barnard, J. Phys. Chem. C, 2014, 118, 2580–2586 CrossRef CAS.
- S. M. Gates, R. R. Kunz and C. M. Greenlief, Surf. Sci., 1989, 207, 364–384 CrossRef CAS.
- M. Suemitsu, H. Nakazawa and N. Miyamoto, Surf. Sci., 1996, 357, 555–559 CrossRef.
- A. M. Żak, Nano Lett., 2022, 22, 9219–9226 CrossRef PubMed.
- M. P. Hanrahan, E. L. Fought, T. L. Windus, L. M. Wheeler, N. C. Anderson, N. R. Neale and A. J. Rossini, Chem. Mater., 2017, 29, 10339–10351 CrossRef CAS.
- R. N. Pereira, D. J. Rowe, R. J. Anthony and U. Kortshagen, Phys. Rev. B: Condens. Matter Mater. Phys., 2012, 86, 085449 CrossRef.
- N. Bushlanova, V. Baturin, S. Lepeshkin and Y. Uspenskii, Nanoscale, 2021, 13, 19181–19189 RSC.
Footnote |
| † Electronic supplementary information (ESI) available. See DOI: https://doi.org/10.1039/d3nr04478e |
| This journal is © The Royal Society of Chemistry 2024 |