
 Open Access Article
 This Open Access Article is licensed under a Creative Commons Attribution-Non Commercial 3.0 Unported Licence
Chronic full-band recordings with graphene microtransistors as neural interfaces for discrimination of brain states†
A.
Camassa
 a,
A.
Barbero-Castillo
a,
M.
Bosch
a,
M.
Dasilva
a,
E.
Masvidal-Codina
bc,
R.
Villa
bc,
A.
Guimerà-Brunet
bc and
M. V.
Sanchez-Vives
*ad
a,
A.
Barbero-Castillo
a,
M.
Bosch
a,
M.
Dasilva
a,
E.
Masvidal-Codina
bc,
R.
Villa
bc,
A.
Guimerà-Brunet
bc and
M. V.
Sanchez-Vives
*ad
aInstitut d’Investigacions Biomèdiques August Pi i Sunyer (IDIBAPS), Barcelona, Spain
bInstituto de Microelectrónica de Barcelona (IMB-CNM, CSIC), Spain
cCentro de Investigación Biomédica en Red de Bioingeniería, Biomateriales y Nanomedicina, Instituto de Salud Carlos III, Spain
dICREA, Barcelona, Spain
First published on 8th February 2024
Abstract
Brain states such as sleep, anesthesia, wakefulness, or coma are characterized by specific patterns of cortical activity dynamics, from local circuits to full-brain emergent properties. We previously demonstrated that full-spectrum signals, including the infraslow component (DC, direct current-coupled), can be recorded acutely in multiple sites using flexible arrays of graphene solution-gated field-effect transistors (gSGFETs). Here, we performed chronic implantation of 16-channel gSGFET arrays over the rat cerebral cortex and recorded full-band neuronal activity with two objectives: (1) to test the long-term stability of implanted devices; and (2) to investigate full-band activity during the transition across different levels of anesthesia. First, we demonstrate it is possible to record full-band signals with stability, fidelity, and spatiotemporal resolution for up to 5.5 months using chronic epicortical gSGFET implants. Second, brain states generated by progressive variation of levels of anesthesia could be identified as traditionally using the high-pass filtered (AC, alternating current-coupled) spectrogram: from synchronous slow oscillations in deep anesthesia through to asynchronous activity in the awake state. However, the DC signal introduced a highly significant improvement for brain-state discrimination: the DC band provided an almost linear information prediction of the depth of anesthesia, with about 85% precision, using a trained algorithm. This prediction rose to about 95% precision when the full-band (AC + DC) spectrogram was taken into account. We conclude that recording infraslow activity using gSGFET interfaces is superior for the identification of brain states, and further supports the preclinical and clinical use of graphene neural interfaces for long-term recordings of cortical activity.
New conceptsWe have demonstrated that graphene solution-gated field-effect transistors (gSGFETs) implanted on the surface of the brain can remain functional and stable for at least 5.5 months, a longer duration than the 10-week period previously reported. During this time, they enable the recording of full-band brain activity, from infraslow components (<0.5 Hz) to neuronal spikes. Validating these devices for chronic implants is crucial for potential future clinical applications, including conditions such as disorders of consciousness, brain lesions, intra-surgical monitoring, or epilepsy studies. The chronic brain recordings presented here were obtained during periods of induced anesthesia, followed by the return to wakefulness and re-induction of anesthesia. For the first time, we report a strong correlation between the infraslow component and the level of anesthesia. In fact, we can algorithmically predict the anesthesia level based on the infraslow component with 85% precision. When incorporating information from higher frequencies, our precision increases to up to 95%. These results strongly suggest that full-band recordings are highly valuable for quantifying brain states and have broad implications in various areas of neuroscience, ranging from fundamental research to clinical applications. gSGFET full-band recordings provide informative insights into extracellular changes associated with variations in brain activity patterns and open doors to clinical applications that can benefit from full-band brain activity monitoring. |
Introduction
Graphene solution-gated field-effect transistors (gSGFETs) have recently emerged as valuable additions to the arsenal of electrophysiological tools for recording the spatiotemporal patterns of cerebral cortex activity.1–4 One notable advantage of this flexible electronics technology is its capability for full-band recording of neural activity. This includes the recording of infraslow components (direct current (DC)-coupled) as well as higher-frequency components (alternating current (AC)-coupled) that range from slow oscillations (0.3–2 Hz) to multiunit neuronal firing. These properties have been identified as promising candidates for clinical applications.5In the present study, we investigated some critical aspects pertinent to this endeavor. We aimed to assess the potential of these devices for long-term chronic epicortical implants, with a focus on evaluating both the stability of the devices themselves and that of the neural interface they constitute. To achieve this, we examined brain activity across various levels of anesthesia.6–8 The manipulation of anesthesia levels induces progressive shifts in brain activity, leading to distinct brain states characterized by markedly different functional properties.9 The extended duration of recordings made possible with gSGFETs allowed us to analyze the DC and AC10 variations associated with varying levels of anesthesia. Moreover, we explored the feasibility of predicting anesthesia levels based on the combined analysis of both frequency components.
The results that we present here are relevant from different perspectives. Firstly, the characterization and validation of gSGFETs for long-term use. Secondly, the identification of the unique capability that gSGFETs provide to identify brain states, an open problem in brain science. In our case, we demonstrate this progress by identifying the anesthesia levels based on the combination of AC- and DC-coupled components, achieving 95% accuracy, a significant and innovative application of this technology.
This study reports progress in the contribution of gSGFET nanotechnology to the study of brain dynamics and its potential applications within the clinical domain.
Methods
Chronic recordings with implanted microtransistor arrays
All the following experiments were performed in agreement with the Directive 2010/63/EU of the European Parliament and of the council of 22 September 2010 and were approved by the ethics committee of the University of Barcelona.Adult male Wistar rats (n = 3, 250–275 g and ages between 8 and 9 weeks old) were placed in a tightly closed box with O2 flux for about 10 min. When the animal was relaxed, the flux of oxygen was mixed with 4% concentration of isoflurane for about 3–4 min to induce anesthesia. After this initial induction, the animal was placed in a stereotaxic frame and 2% isoflurane concentration was administered and maintained with a double tube (exhalation/aspiration) ending in a small mask adapted to the animal snout for the entire surgery. All pressure points and tissues to be incised were infiltrated with lidocaine before surgery. Atropine (0.05 mg kg−1) and methylprednisolone (10 mg kg−1) were administered by subcutaneous injection to prevent respiratory secretion and inflammation, respectively. Body temperature, measured with a rectal thermometer, was maintained at 37 °C with a water-circulating heat pad. The surgery was performed under sterile conditions. The dorsal surface of the head was shaved. The skin was then cleaned with betadine solution (10% iodine) painted over the surface of the skin up to the edge of the fur. From the anterior to the frontal part of the skull between the eyes, a midline incision was made and cleaned using peroxide hydrogen (3% H2O2). Then 4–5 holes for screws in the contralateral area were made. These metal screws (stainless steel, blunt tip) held the head cap in place and also provided a common electrical ground. Then a craniotomy of 4 × 4 mm was made at 1.0–5.0 mm ML, −5 to −9 mm AP with respect to bregma. The whole surgical area was covered with dental cement (Kemdent, Swindon, UK) and before finishing, the fix post was placed and covered with more dental cement. Finally, the area was disinfected with 3% hydrogen peroxide (H2O2), the cutting edges were softened, and the posterior and anterior surgical area was closed. Betadine solution (10% iodine) was applied to the stitches and saline was injected subcutaneously. The rat was then transferred from the stereotaxic frame to a warmed recovery cage until fully mobile, walking, grooming, eating, and drinking of its own volition. Post-surgical analgesics (buprenorphine (0.06 mg kg−1)) and antibiotics (enrofloxacin (25 mg kg−1)) were administered every 8 h daily for a minimum of 5 days. Recordings started 1 month after the surgery (all subjects were 3 months old) and were performed weekly.
Anesthesia levels
As a common anesthetic widely used in the field, isoflurane was chosen for the induction and maintenance of general anesthesia in rats. Being a gas anesthetic, isoflurane allowed us to rapidly adjust the level of anesthesia with greater precision compared with injectable anesthetics. Furthermore, it induces muscle relaxation and decreases pain sensitivity, which was desirable.Full-bandwidth recordings with 16-channel graphene arrays of microtransistors (gSGFETs)
Full-bandwidth electrophysiological recordings were performed using flexible neural probes containing an array of 16 gSGFETs (4 × 4 array, 400 μm separation; see Fig. S1 for dimensions, ESI†), connected to an amplifier through a printed circuit board including a zero-insertion force connector. Whereas most currently available electrodes are passive, gSGFETs are active devices that transduce local voltage changes to current, enabling full-bandwidth electrophysiological recordings.2 Neural probes were fabricated at the clean room facilities of IMB-CNM as reported by Hébert et al.1 A custom g.HIamp biosignal amplifier, (g.RAPHENE, g.tec medical engineering GmbH, Schiedlberg, Austria) was used for signal acquisition at 9600 kHz and 24 bit. The system enables simultaneous recording in two frequency bands with different gains preventing amplifier saturation; low-pass filtered (LPF) (<0.16 Hz, 104 gain) and band-pass filtered (BPF) (0.16 Hz < f < 160 kHz, 106 gain) (Fig. 1A). The recorded signals are post-processed to recompose the full-band signal by the linear addition of both signals after applying the respective gain corrections. Finally, the recorded current is converted into voltage by using the transistor transfer curve, which was acquired for each transistor of the array prior to the recording session.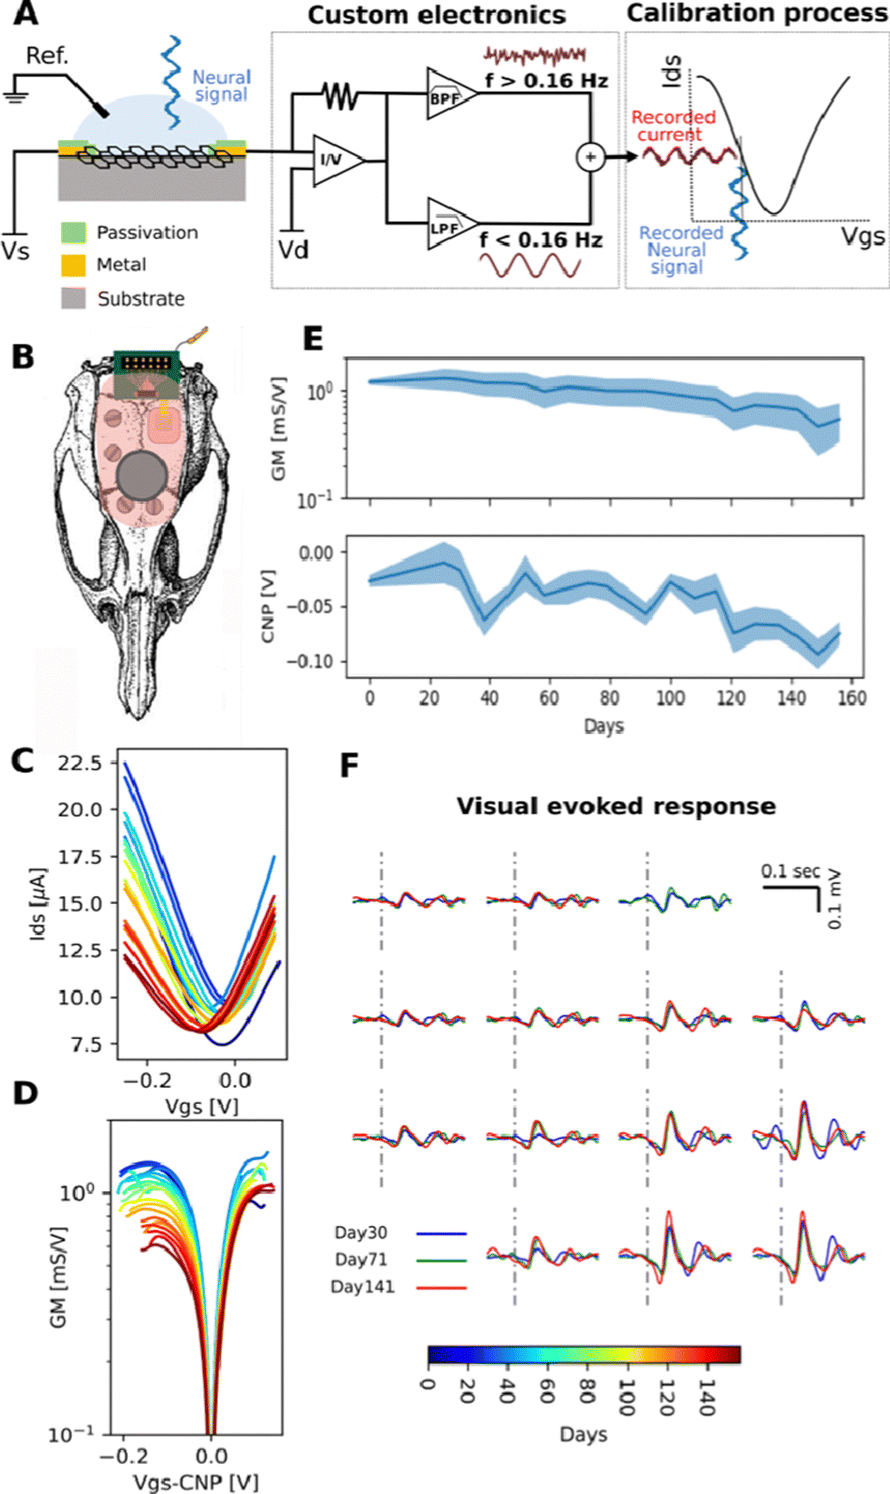 | ||
| Fig. 1 Chronic stability evaluation of gSGFETs. (A) Schematic of the gSGFET recording setup and signal postprocessing methodology. (B) Schematic of a rat skull depicting the location of the gSGFET array for chronic recordings. (C) and (D) Evolution of the electrical characteristics of the implanted array (C shows the transfer curve and D the transconductance). Lines represent the mean value of all transistors in the array and colors indicate implanted days. (E) Time evolution of the transconductance and CNP after implantation. Solid lines show the mean value of all transistors of the implant and shadows show the standard deviation. (F) Evolution of recorded visual evoked response at different days after implantation (averaged response for each experiment), demonstrating that the capability for recording responses remains constant over 5.5 months. | ||
Data analysis
The first analysis step of this work consisted in studying the full-band raw signal recorded with our array of gSGFET transistors. We analyzed the dynamical evolution of the cortical recordings during the anesthesia modulation experiment repeated multiple times in a 5.5-month window. The spectral components of the brain signal were extracted to show the consistency of this experimental protocol across different subjects and over time in the same subject. To do so, we computed the spectrogram of each signal using the Wavelet method with windows of 2 s and 50% overlap, in the frequency range between 0.1 Hz and 40 Hz. We performed a principal component analysis (PCA) on the data matrix composed by the raw signal recorded over time using the 16 gSGFETs transistors and projected the data onto the space defined by the first three principal components, accounting for almost 99% of the variance of the data. In this way, we were able to reconstruct the trajectory described by the system in the 3D state space as the anesthesia modulation goes on. For the second step of data analysis, we considered two signals derived from each recording set: (1) the full band raw signal (DC + AC) recorded with the array of gSGFETs transistors, comprising infraslow frequencies (<0.1 Hz) together with the typical local field potential bandwidth; and (2) its high-pass filtered version where we removed the infraslow component to make it equivalent to the AC-coupled signals recorded with the classical passive electrodes commonly used in electrophysiology. The AC signal was obtained by high-pass filtering the raw signal above 0.5 Hz with a third-order Butterworth filter.To assess the advantages derived by the recording of a full-band signal with gSGFET transistors, we adopted a statistical approach, fitting a linear regression model to predict the level of anesthesia from the cortical activity data and validating it using a random permutation cross-validation technique. It is well known that the spectral components of the signal can be used to discriminate between different brain states.11 Accordingly, we fitted a linear regression model to explain the relationship between the anesthesia level, expressed here as isoflurane concentration [% in O2] delivered to the animal, and the spectral content of the signal in five frequency bands defined as follow: delta [0.5–4] Hz, theta [4–7] Hz, alpha [7–15] Hz, beta [15–30] Hz and gamma [30–100] Hz. We computed the power spectral density (PSD) of subsequent 3-s segments derived from the raw signal using Welch's method with Hanning windows. We then averaged the PSD within each of the five selected frequency bands to obtain a single value for each frequency band and each recording channel (i.e., 5 frequency bands × 16 gSGFETs = 80 values for each 3 s window). These values constituted the predictors of our model. Each 3 s window was associated, as an outcome value, with the corresponding isoflurane % in O2 delivered to the animal in that time period; that is, one of the following values: 0%, 0.25%, 0.5%, 0.75%, 1%, 1.5% and 2%.
The random permutation cross-validation technique12 allowed us to split the dataset in N folds, each of them further divided into a training set (10% of the fold data) and a test set (the remaining 90% of the data). We used N = 10 folds and obtained a prediction score for each of them. In this first step of the analysis, we did not take into account the infraslow components since the lowest frequency that we used was 0.5 Hz. Then, to demonstrate that the infraslow values provide an almost linear information of the depth of anesthesia, we fitted another linear regression model, separately on the full band (DC + AC) and on the AC-filtered signal, in which we used as regressors the statistical properties of the signals, namely the mean and standard deviation computed on subsequent 3-s time windows with no overlap. Again, we used the random permutation cross-validation technique and obtained score values for the prediction of the anesthesia level performed using the full band signal (DC + AC), to be compared with the ones obtained when the prediction was performed using the corresponding high-pass filtered signal (AC).
Results
Chronically implanted graphene microtransistor interfaces allow in vivo stable full-band recording of cortical activity for over 5.5 months
We previously demonstrated the unique properties of the gSGFET as a transducer for recording neuronal activity in a wide range of frequency oscillations (full-band): from very low frequencies (infraslow, <0.1 Hz, or so called DC-signal, nominally at ∼0 Hz) up to the higher frequencies in the typical local field potential (LFP) bandwidth (0.1–30 kHz).2 However, these recordings were obtained in acute conditions, and chronic and acute recordings differ in their duration and methodology. Acute recordings typically involve a single session lasting a few hours (2–6 h) following a craniotomy. In contrast, chronic recordings involve implanting the array, closing the craniotomy and the skin, and allowing the animal to resume normal activities in its cage while regular recording sessions are conducted over an extended period. In the present study, our primary goal was to assess the stability of chronic recordings, considering both the performance of the gSGFET arrays and the quality of the recordings over time. To this end, we performed chronic implants of gSGFET neural interfaces in adult rats. Flexible 16 channel (4 × 4) arrays (Fig. 1A and B) were epicortically implanted in the left hemisphere over the occipital cortex (Fig. 1C). We found that the transconductance of gSGFETs remained stable at a very wide range of frequency values, including infraslow frequencies (0–100 Hz, Fig. 1C), thus enabling the simultaneous in vivo recording of DC signal (<0.1 Hz), together with the mid to high frequencies of the LFP signal (0.1–100 Hz). We recorded in two frequency bands: a low-pass filtered band (DC signal, ≈0–0.16 Hz) and a band-pass filtered band (BPF or LPF, 0.16 Hz–10 kHz) with different gains (104 and 106 respectively).The array performance was evaluated every week in terms of temporal stability as well as spatial reproducibility. Of the three rats that received implants, all three maintained their implants intact for over 1 month, two rats retained them for more than 3 months, and one rat successfully recorded functional data for up to 5.5 months. The termination of these recordings was due to physical instability of the implant due to animal movements rather than any device malfunction, demonstrating that all implants maintained their functionality throughout the entire duration of implantation. The characterization consisted in measuring the transfer curve, drain current (Ids) versus gate–source voltage (Vgs), of all gSGFETs in each array with a fixed drain–source voltage (Vds). The small dispersion of the charge neutrality point obtained (CNP = 243.6 ± 6.1 mV), which is defined as the Vgs voltage associated with the minimum current value of the transfer curve, indicates the homogeneity of the transistors and their functionality for over 5.5 months (Fig. 1C). There was a slight decrease in transconductance measured over several months (Fig. 1D). Since the device transfer curve can be obtained in vivo, this decrease in transconductance can be corrected in the calibration process in each recording session. A shift in the Charge Neutrality Point (CNP) can also be observed over time (Fig. 1E), which is tentatively attributed to charged molecules adsorbed on the graphene surface from the biological environment. This adsorption process could also lead to a decrease in coupling capacitance and therefore explain the observed decrease in transconductance.
In addition to the temporal stability, we also observed a high degree of spatial reproducibility: the majority of the 16 transistors of each implanted gSGFET array gave an excellent performance and retained their electrical properties over the entire period. Occasionally, one or two of the transistors in each array ceased functioning. Overall, 87.5% of all transistors retained a very high degree of performance. Since the devices were implanted in the visual cortex, we could test the spatial resolution and the temporal stability of all transistors by recording the neuronal responses evoked by visual stimuli. Anesthetized animals were visually stimulated with flashes of LED light and the cortical evoked responses were recorded in full-band with the 16 transistors. The temporal (signal-to-noise ratio) and the spatial (map of the 16 recording sites) resolution were maintained constant over the entire period of implantation (up to 5.5 months in one animal; Fig. 1F).
Full-band recording of cortical activity during transitions through different levels of anesthesia
Brain states are characterized by distinct patterns of cortical dynamics and neural network complexity.9,13–15 It is possible to transition from one brain state to another by modulating the levels of anesthesia.6,16,17 We previously showed that reducing the anesthesia level from deep to light results in an increase in network complexity within the bistable regime of slow oscillations. This change in complexity is associated with changes in network excitability, in the spatiotemporal patterns of wave propagation and in the spectral content of the signal.8,18–20 The majority of the existing studies, however, use AC-coupled passive electrodes that filter out the DC component of the signal.2Here, we aimed to investigate whether the full-band recordings achievable with arrays of gSGFETs would reveal novel information about brain states and levels of anesthesia that may be lost in traditional high-pass recordings. Chronically implanted gSGFET devices allowed us to perform repeated recordings while modulating levels of anesthesia. Implanted rats were deeply anesthetized with 2% isoflurane (ISO) in O2, and then we progressively reduced ISO levels (1.5%, 1%, 0.75%, 0.5%, 0.25%) to bring the animal to lighter states of anesthesia all the way to the awake state (0%, ISO off). We finally re-administered 2% ISO to induce a sharp transition to deep sleep (Fig. 2). We repeated these anesthesia transitions every week for the entire period of implantation (a total of 24 times for one of the rats). Fig. 2A illustrates the full-band (AC-DC) raw signal recorded from one gSGFET transistor during an experiment of isoflurane anesthesia modulation. Notice how the DC component varies with the anesthesia level, remaining in a plateau at its highest value during the awake state, as we further quantify below. As previously reported,7 we could also detect variations in anesthesia levels in the synchrony of the AC-recorded patterns and frequency of the slow oscillations (<4 Hz) (Fig. 2B), such that in deeper anesthesia levels, the frequency of events is lower, increasing with lighter levels of anesthesia.8 While slow wave sleep and deep anesthesia are characterized by network synchronization, the awake state is characterized by the desynchronization of the activity.21,22 This is illustrated in Fig. 2B and further, in Fig. S2 (ESI†), where in the awake state the correlation across channels decays and as does the Kuramoto Order Parameter (KOP), a measure of synchronization.
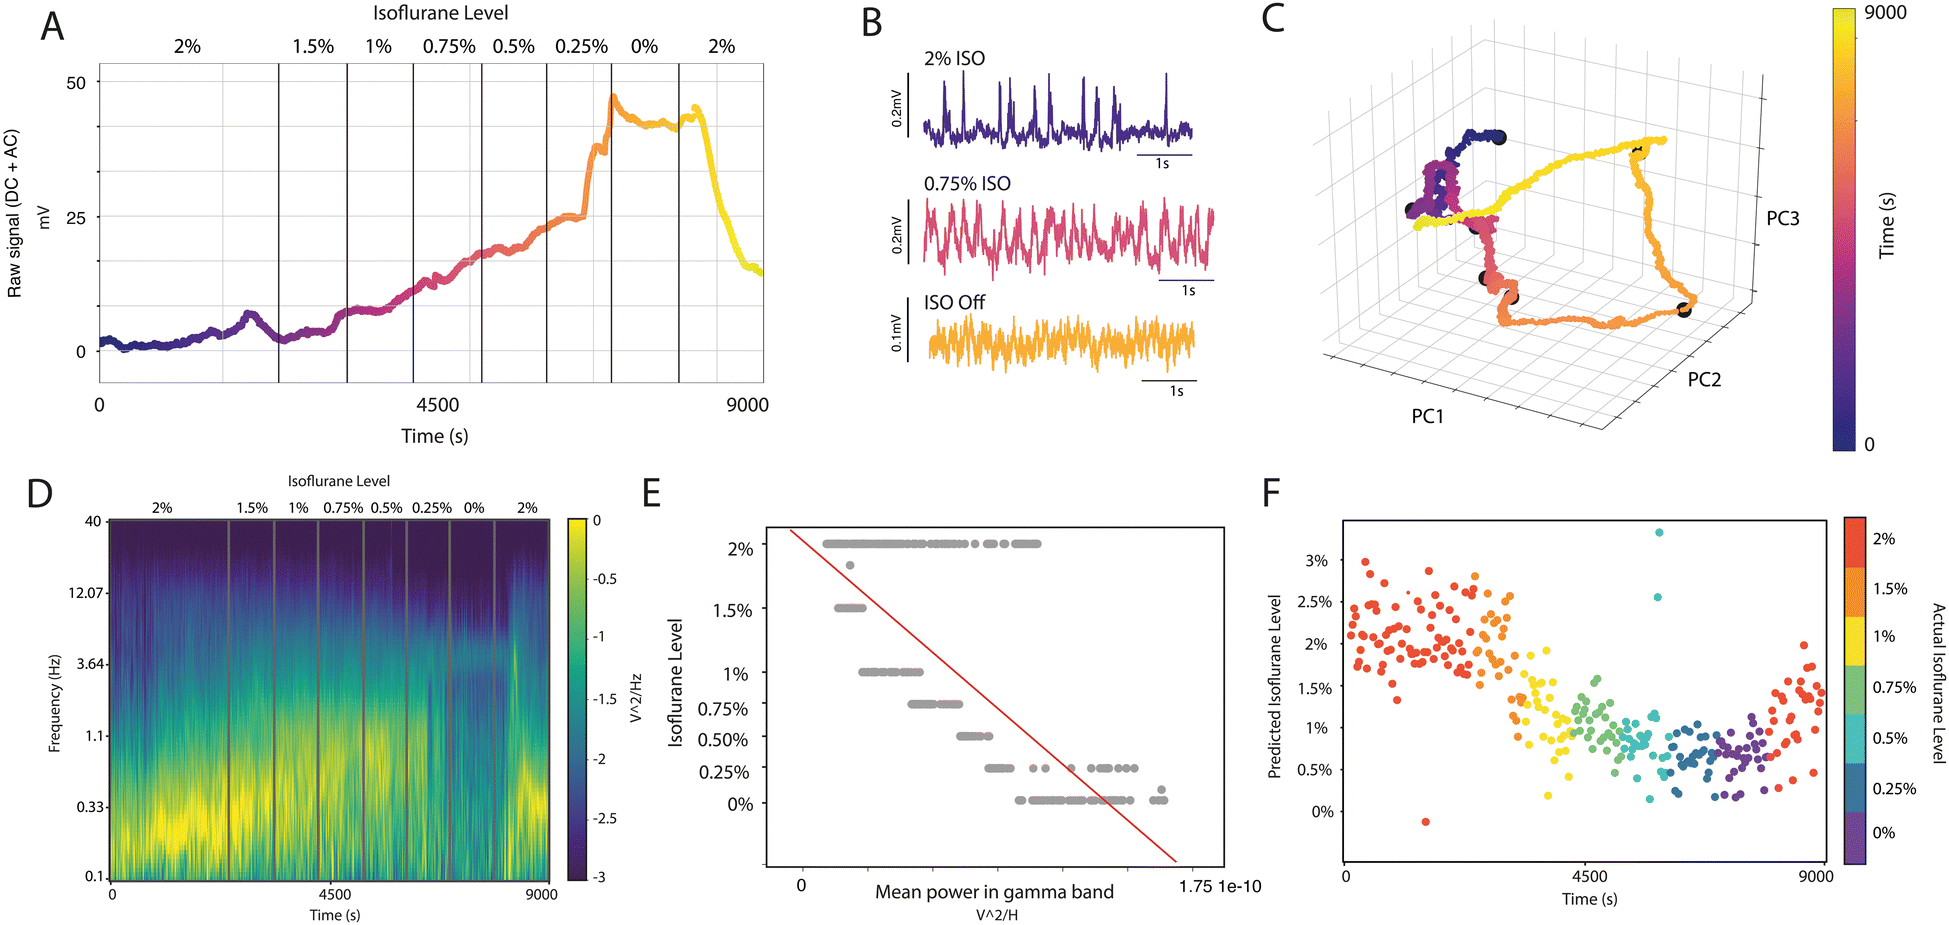 | ||
| Fig. 2 AC and DC variations with different levels of anesthesia and prediction of anesthesia levels based on AC-features. (A) Raw signal recorded from one gSGFET transistor during an experiment of isoflurane anesthesia modulation. The vertical bars indicate the points in time in which the isoflurane concentration was changed to the level indicated on the top of the plot. (B) Magnification of the signal in three different time steps of the experiment, coded by color. The purple segment corresponds to the cortical activity under 2% isoflurane anesthesia, the pink one corresponds to the cortical activity under 0.75% isoflurane anesthesia, and the orange one to the activity when the isoflurane delivery was turned off (0%). For the purpose of visualization the signal was band-pass filtered between 0.5 and 100 Hz. (C) Projection of the raw signal on the space of the first three principal components, showing the dynamical trajectory described by the system over the entire experiment of anesthesia modulation. Colors code the time as indicated in the colorbar. (D) Spectrogram of the whole anesthesia modulation experiment computed on the signal recorded by one gSGFET transistor, band-pass filtered between 0.5 and 300 Hz and standardized. We used the wavelet method with Hanning windows of 0.5 s and 50% overlap. The vertical bars indicate points in time at which the isoflurane concentration was changed to the level indicated on the top of the plot. (E) Predicted isoflurane level obtained using the linear regression on the spectral component of the signal, using only the mean power in gamma. Each point corresponds to a time window of 3 s over which the power spectral density was computed to obtain the mean gamma power. The prediction score in this case was 0.6. (F) Example of predicted isoflurane level over time, the prediction was obtained using a linear regression model trained on the spectral content of the signal; that is, using five spectral features for each channel, which are the mean power in delta, theta, alpha, beta and gamma. The actual isoflurane levels labelled during the experiment are color-coded, each point corresponding to a time window of 3 s over which the power spectral density was computed and averaged in five frequency bands to train the model. | ||
A principal component analysis (PCA) of the entire matrix of full-band recording data from each of the transistors yielded a reduced dimensionality of three principal components that account for ∼99% of the total variance of the data (Fig. 2C). When projected onto the space of these principal components, our data describes a clear trajectory over time that reflects the impact of anesthesia levels (Fig. 2C). This is a cyclic trajectory, where the system moves progressively in one direction as anesthesia is reduced and comes back close to the initial point when anesthesia is reinstated. The AC-coupled spectrogram of the signal reveals changes in the oscillatory pattern of cortical activity at different frequencies during the variations of anesthesia levels, and thus of brain states (Fig. 2D). Several parameters of the spectral content are correlated with anesthesia levels and are characteristic of each brain state. For example, deep anesthesia states were characterized by high levels of slow-wave activity (Fig. 2D), and increased magnitude in the gamma band (Fig. 2E). These oscillations are progressively reduced as the anesthesia levels are decreased (Fig. 2E), and a more asynchronous pattern of cortical activity can be recorded as the anesthesia wears off (Fig. 2B and D). Several of these correlated parameters, such as the gamma band power (Fig. 2E), can be used using a trained algorithm to generate predictions of the brain state or anesthesia levels based on the spectral parameters (Fig. 2F). Using a linear regression model fitted with the magnitude of specific AC spectral bands (mean power spectrum density (PSD) in δ, θ, α, β and γ bands; Fig. 2E depicts one of these regressors: the γ band), we obtained a prediction score of the anesthesia levels of 0.48 ± 0.14 with the random permutation cross-validation technique,12 displayed in Fig. 2F.
The DC-coupled signal recorded using chronic gSGFET devices represents an additional dimension that we can now include in our spectral information. Firstly, we found an inverse correlation between the amplitude of the full-band signal, including the infraslow component, and the concentration of anesthesia (Fig. 2A). This pattern of full-band signal, dominated by the infraslow signal, was consistent for the three implanted animals across the transition through different levels of anesthesia. In Fig. 3A–C, the raw signal displaying largely the DC component is represented over the spectrogram for three different subjects in a full cycle of anesthesia. These panels illustrate the reliability of the spectrogram content as well as that of the infraslow component across anesthesia levels and subjects. The infraslow band consistently increases from deep anesthesia towards wakefulness, decreasing again for a new anesthesia increase.
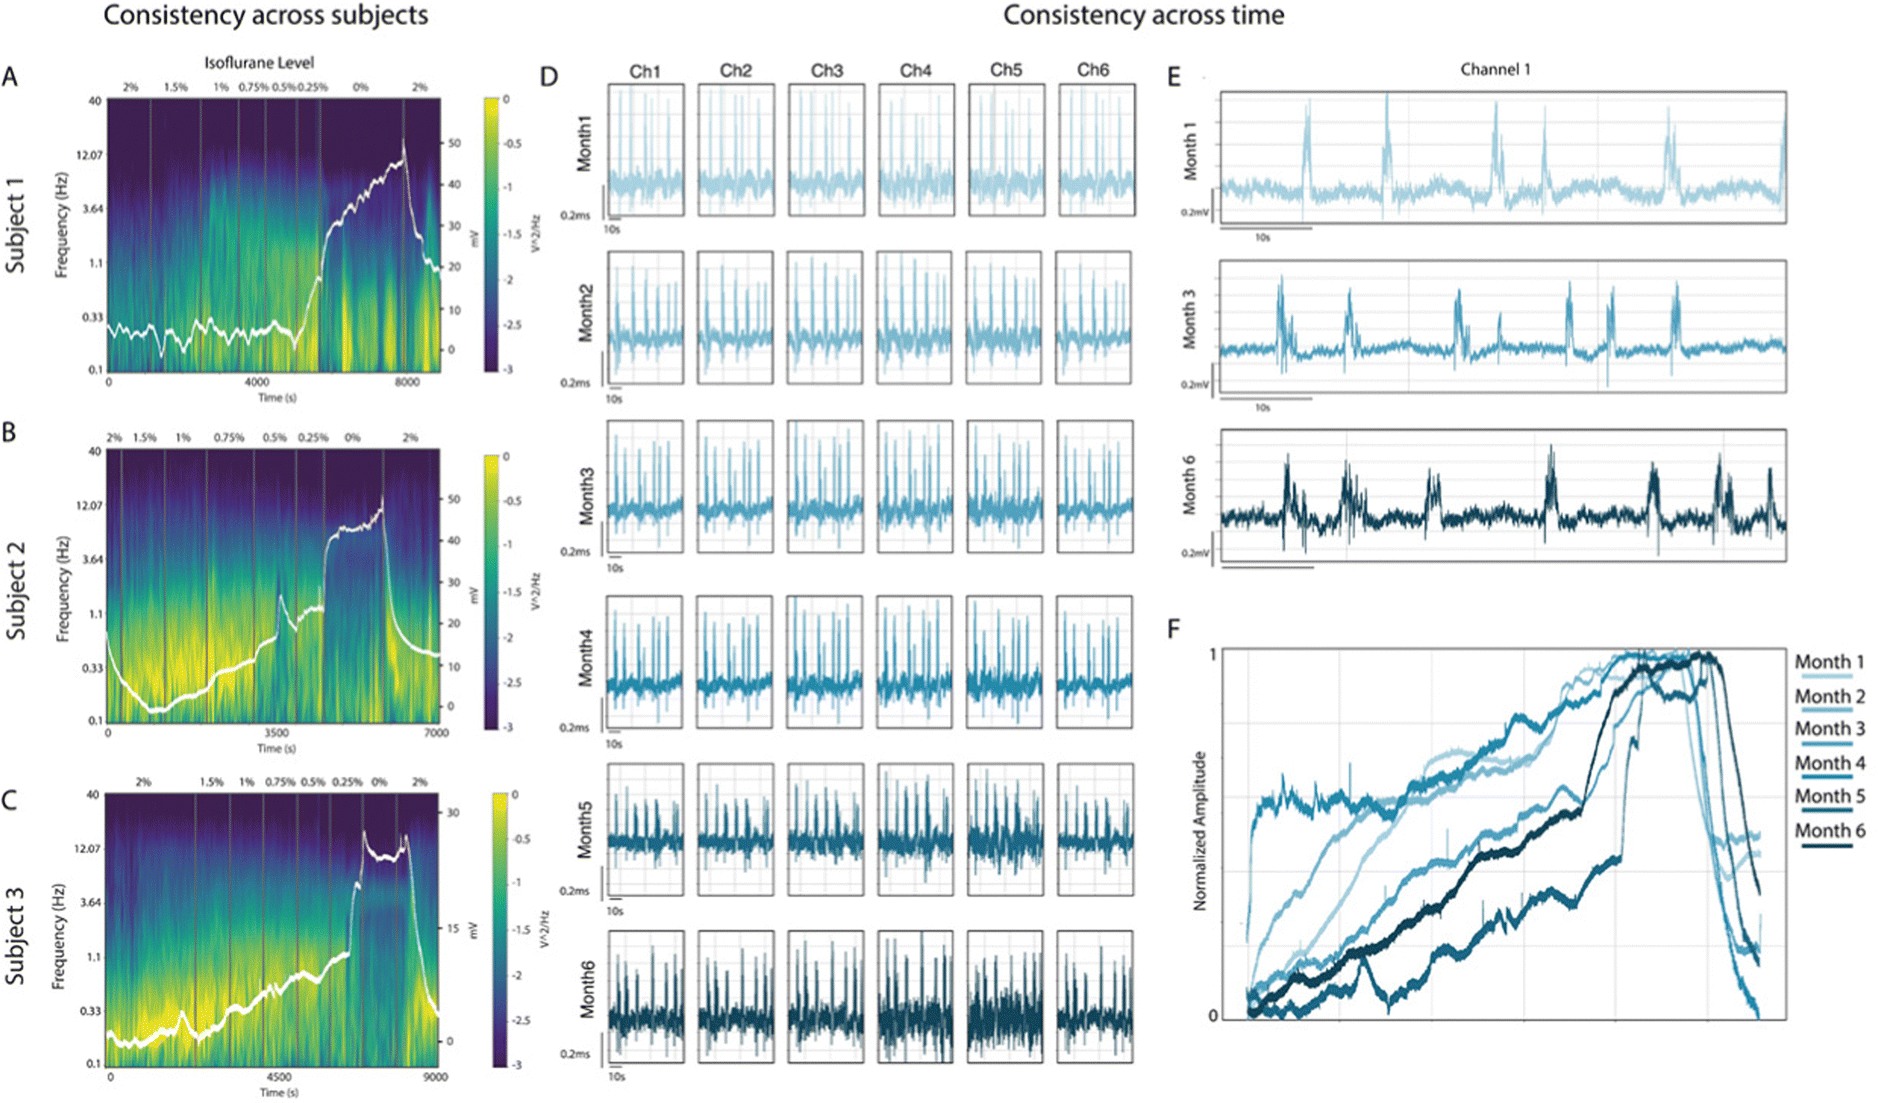 | ||
| Fig. 3 AC–DC variation with anesthesia levels across subjects and time (5.5 months). (A), (B) and (C) Spectrogram of the signal recorded during an anesthesia modulation experiment in three different subjects. The white trace in the raw signal recorded by the gSGFET transistor is used to compute the spectrogram; its scale is indicated on the right verticle axis. The vertical bars indicate the points in time at which the isoflurane concentration was changed to the level indicated on the top of the plot. (D) Slow wave activity as recorded in 6 of the 16 available gSGFET transistors, showing in each row a different point in time over the 5.5 months for which the device was implanted. For the purpose of the visualization the signal was band-bass filtered between 0.5 and 100 Hz. (E) Magnification of the slow wave activity recorded by one gSGFET transistor after 1, 3 and 5.5 months of implantation. (F) Normalized raw signal recorded from one gSGFET transistor during six different experiment of anesthesia modulation performed in one subject over 5.5 months of implantation. | ||
This profile was also consistently obtained across time, specifically during the 5.5 months of recording sessions (Fig. 3D–F). The reproducibility and quality of both AC- and DC-coupled recordings was maintained in most of the individual transistors over the entire period of implantation. We were able to record AC-coupled LFP signal, showing the typical slow wave activity during high anesthesia states in different locations of the visual cortex (Fig. 3D and E), together with DC-coupled signal (Fig. 3F), with similar signal-to-noise ratio, for up to 5.5 months—the maximum time period tested. The slow oscillations are displayed in Fig. 3D as recorded in the same six microtransistors for 5.5 months. Both the amplitude and frequency of the events were similar along the 5.5 months for deep anesthesia, suggesting that both the tissue and the gSGFETs remained fairly stable across time.
We have shown that the levels of anesthesia and their associated brain states can be predicted from the spectral components of the AC signals using a linear regression model (Fig. 2F). Since we observed a very high correlation between the DC signal amplitude and the levels of anesthesia (Fig. 2A), we next aimed to assess whether the inclusion of the DC component would improve the prediction success rate. We used an alternative regression model, not based on spectral components but on statistical properties. This model is much simpler than the one based on spectral components and usually possesses less prediction power. Accordingly, the prediction score obtained by a trained algorithm from the mean and standard deviation (SD) of the AC signal (high-pass filtered above 0.5 Hz) was 0.24 ± 0.95 (Fig. 4A). This score was worse than that obtained from the spectral components (0.48 ± 0.14, Fig. 2F). However, the same linear regression model using the mean and SD of the full-band signal (AC + DC) yielded a much-improved prediction score of 0.83 ± 0.08 (Fig. 4B and C). These results demonstrate that the simultaneous recording of DC and AC components significantly improves the performance of prediction of the anesthesia levels based on a linear regression of the statistical properties of the signal.
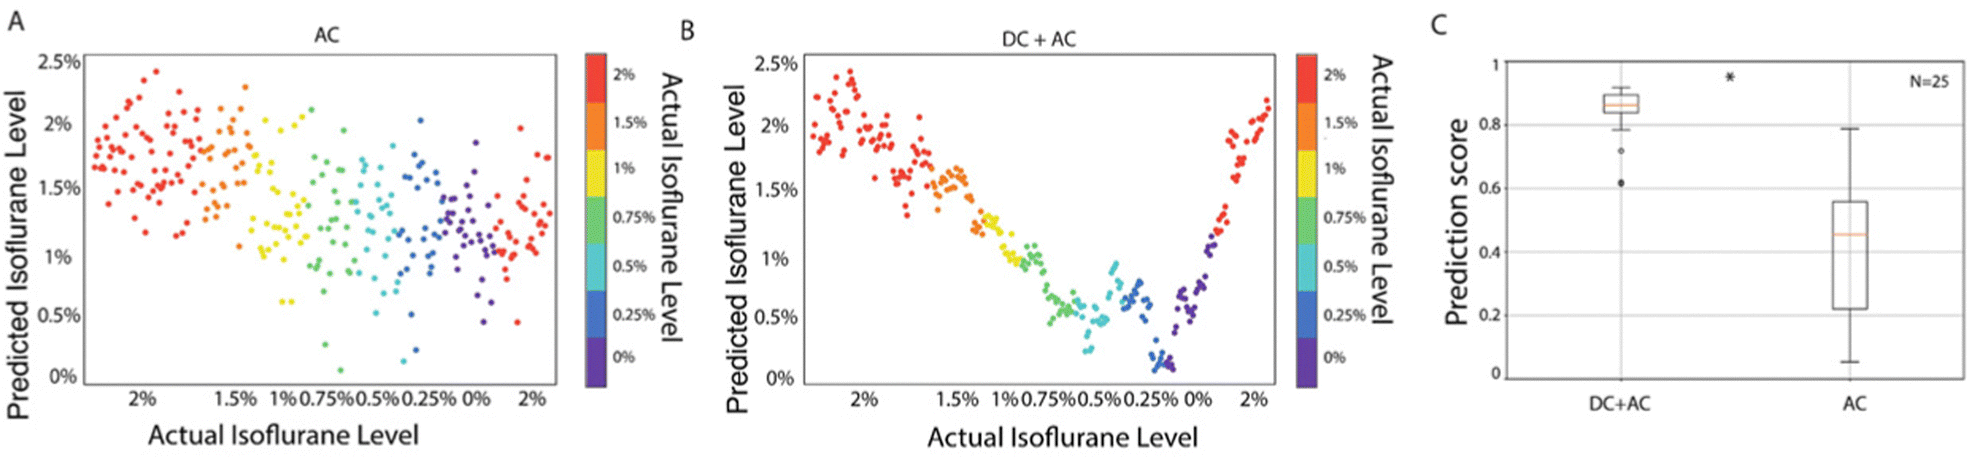 | ||
| Fig. 4 High precision prediction of anesthesia level based on the AC–DC components. (A) Example of predicted isoflurane level over time. The prediction was obtained using a linear regression model trained on the mean and SD of the signal high-pass filtered above 0.5 Hz (AC). The actual isoflurane level labelled during the experiment are color coded, each point corresponding to the time window of 3 s over which the statistical variables were computed. (B) Example of predicted isoflurane level over time. The prediction was obtained using a linear regression model trained on the mean and SD of the raw signal (DC + AC). The actual isoflurane level labelled during the experiment is color coded, each point corresponding to the time window of 3 s over which the statistical variables were computed. (C) Boxplot of the prediction score obtained from a linear regression model trained with the statistical properties (mean and SD) of the raw signal (DC + AC) and of the signal high-pass filtered above 0.5 Hz (AC) in 25 anesthesia modulation experiments performed in three different subjects. *p<0.05. | ||
The presence of infraslow components adds enough information to the signal to allow us to use a simpler method to predict the anesthesia levels from the signal, with no need to perform a more sophisticated spectral analysis. We conclude that the acquisition of the full-band recording signal, which includes the infraslow components of the spectrum, allows a much better discrimination of the brain states associated with different levels of anesthesia. This full-band information can only be obtained in a chronic long-term way and in multiple recording sites using the graphene microtransistor neural interface technology.
Discussion
Neural probes with gSGFET technology provide full-bandwidth recording of neural activity over a long period of time. Previously, the stability of these devices in chronic recording of one animal has been reported for up to 4 weeks.3 In this study, we validated gSGFET arrays for long-term recording of neural activity, spanning a duration of up to 5.5 months. Our investigation conclusively established the consistency of the recording properties of the graphene microtransistor arrays over this extended period. This included the inherent properties of the gSGFETs while interfaced with brain tissue—such as transconductance—and the quality and sensitivity of the recordings. The amplitude of the recorded signals, including slow oscillations, was sustained for the whole period, indicating that (1) the brain tissue remained functional and was not adversely affected by the array, as estimated from a functional perspective; and (2) the interface was stable. Moreover, the infraslow component detected during changes in anesthesia levels also demonstrated consistent stability over time. This consistent stability was observed across all three recorded subjects. These findings support the potential long-term use of these devices, marking another step toward their clinical application.The brain activity that we have studied includes different brain states reached by means of varying anesthesia levels. Varying anesthesia levels is an experimental strategy that allows a very gradual change in brain state, from highly synchronized in deep anesthesia to asynchronous activity in awake states.6–8,23–25 The identification of brain states is an important and highly debated topic, both in preclinical and clinical neuroscience, and a wide variety of methods have been suggested. The reason for this lack of consensus is that different brain states imply differences in both temporal and spatial patterns and relationships across areas. For example, differences in functional complexity,8,26 in wave propagation,27 in spectral exponent,28 in perturbational complexity index,29 or in reversibility,30 have been proposed as measures of characterization. Here we report that the full-band recordings of brain activity, unique to gSGFET arrays, provide a valuable signal for the identification of anesthesia level, and indirectly, for the characterization of brain states. Our repeated induction and recovery from anesthesia consistently found an almost linear variation of the infraslow component with the level of anesthesia, such that it increases towards wakefulness and decreases towards deep anesthesia. Training an algorithm on this linear regression allows a prediction of anesthesia levels with 85% precision that improves to 95% precision if we include faster frequencies.
The DC component of the cerebral cortex activity has seldom been studied. The existence of DC offsets and low-frequency drifts at the electrode-tissue interface led to the standarized use of high-pass filter commercial amplifiers for extracellular recordings. However, changes in DC have been reported to precede the occurrence of seizures31 and are thought to be an electrophysiological correlate of infarction in human cerebral cortex.32 DC-shifts associated with epileptic discharges have also been described in the first recordings in vivo with graphene arrays.1,2 Chronic in vivo studies have also identified DC changes in physiological states such as sleep and the awake state.3 More recent in vitro reports have described DC-shifts not only associated with spreading depression and epileptiform discharges, but also with physiological activity such as individual slow waves occurring during sleep.2,4 This is highly suggestive that even small changes in activity can induce noticeable changes in DC. Varying anesthesia levels induces changes in global firing,8 such that volatile anesthetics depressed spontaneous action potential firing of neocortical neurons in a concentration-dependent manner.33 We can hypothesize that the infraslow component is providing information about the average levels of neuronal activity, an important element of the brain state. Obviously, to obtain information about the temporal patterns of this activity, we need to resort to the higher frequency components. Regarding the precise mechanisms that determine the DC, this is still an open question, with extracellular potassium levels34 and neurovascular components35 being relevant candidates, in addition to other possibilities. Local variations in DC components may create voltage differences across different areas, contributing to the endogenous electric fields, that modulate neuronal firing,36,37 therefore creating a feedback loop between brain activity and its own modulation.
Conclusions
The significance of considering the combined DC and AC components of brain activity provided by gSGFET arrays extends beyond merely assessing anesthesia levels. It is highly valuable for the characterization and identification of different brain states, an issue which is relevant both in basic and clinical neuroscience. This perspective addresses important issues that connect the physiological mechanisms behind infraslow brain components and the potential benefits of utilizing gSGFET arrays in neurological conditions where local or global brain states are altered, such as disorders of consciousness38 or localized brain lesions.32 The findings from our current study also confirm the feasibility of long-term brain recordings using gSGFET devices, opening up promising avenues for clinical applications in the future.Author contributions
AC: data analysis, interpretation, and writing; ABC, MD and EM: experiments; AGB and RV: development of transistors and data analysis; MB: paper writing; MVSV: experimental design, supervision, analysis, paper writing and funding acquisition.Conflicts of interest
There are no conflicts to declare.Acknowledgements
This research has been funded by the European Union's Horizon 2020 research and innovation programme under Grant Agreement No. 881603 (GrapheneCore3) and No. 785219 (GrapheneCore2) to all teams. The IDIBAPS team was also funded by CORTICOMOD PID2020-112947RB-I00 funded by MCIN/AEI/10.13039/501100011033 and by Departament de Recerca i Universitats de la Generalitat de Catalunya (AGAUR 2021-SGR-01165). IDIBAPS is funded by the CERCA program (Generalitat de Catalunya). The fabrication of the graphene-based solution-gated field-effect transistors (gSGFETs) arrays has made use of the Spanish ICTS Network MICRONANOFABS, partially supported by MICINN and the ICTS NANBIOSIS, specifically by the Micro-NanoTechnology Unit U8 of the CIBER-BBN. C. N. M. also acknowledge funding from the Departament de Recerca i Universitats de la Generalitat de Catalunya (2021SGR00495), by the Spanish MICIN PID2021-126117NA-I00, and by CIBER-BBN (CB06/01/0049). The authors acknowledge the financial support provided by CIBER-BBN and the Instituto de Salud Carlos III with assistance from the European Regional Development. Thanks to Amin Samipour for comments and to Tony Donegan for language editing.References
- C. Hébert, E. Masvidal-Codina, A. Suarez-Perez, A. B. Calia, G. Piret, R. Garcia-Cortadella, X. Illa, E. Del Corro Garcia, J. M. De la Cruz Sanchez, D. V. Casals, E. Prats-Alfonso, J. Bousquet, P. Godignon, B. Yvert, R. Villa, M. V. Sanchez-Vives, A. Guimerà-Brunet and J. A. Garrido, Adv. Funct. Mater., 2017, 1703976 Search PubMed.
- E. Masvidal-Codina, X. Illa, M. Dasilva, A. B. Calia, T. Dragojevic, E. E. Vidal-Rosas, E. Prats-Alfonso, J. Martinez-Aguilar, J. M. De la Cruz, R. Garcia-Cortadella, P. Godignon, G. Rius, A. Camassa, E. Del Corro, J. Bousquet, C. Hebert, T. Durduran, R. Villa, M. V. Sanchez-Vives, J. A. Garrido and A. Guimera-Brunet, Nat. Mater., 2019, 18, 280–288 CrossRef CAS PubMed.
- R. Garcia-Cortadella, G. Schwesig, C. Jeschke, X. Illa, A. L. Gray, S. Savage, E. Stamatidou, I. Schiessl, E. Masvidal-Codina, K. Kostarelos, A. Guimerà-Brunet, A. Sirota and J. A. Garrido, Nat. Commun., 2021, 12, 1–17 CrossRef PubMed.
- N. Cancino-Fuentes, A. Manasanch, J. Covelo, A. Suarez-Perez, E. Fernandez, S. Matsoukis, C. Guger, X. Illa, A. Guimera-Brunet and M. V. Sanchez Vives, Nanoscale, 2024, 16, 664–677 RSC.
- R. C. Wykes, E. Masvidal-Codina, A. Guimerà-Brunet and J. A. Garrido, Clin. Transl. Med., 2022, 12, e968 CrossRef PubMed.
- E. N. Brown, P. L. Purdon and C. J. Van Dort, Annu. Rev. Neurosci., 2011, 34, 601–628 CrossRef CAS PubMed.
- N. Tort-Colet, C. Capone, M. V. Sanchez-Vives and M. Mattia, Cell Rep., 2021, 35, 109270 CrossRef CAS PubMed.
- M. Dasilva, A. Camassa, A. Navarro-Guzman, A. Pazienti, L. Perez-Mendez, G. Zamora-López, M. Mattia and M. V. Sanchez-Vives, NeuroImage, 2021, 224, 117415 CrossRef PubMed.
- D. A. McCormick, D. B. Nestvogel and B. J. He, Annu. Rev. Neurosci., 2020, 43, 391–415 CrossRef CAS PubMed.
- A. Suarez-Perez, G. Gabriel, B. Rebollo, X. Illa, A. Guimera-Brunet, J. Hernandez-Ferrer, M. T. Martinez, R. Villa and M. V. Sanchez-Vives, Front. Neurosci., 2018, 12, 862 CrossRef PubMed.
- I. Stitt, K. J. Hollensteiner, E. Galindo-Leon, F. Pieper, E. Fiedler, T. Stieglitz, G. Engler, G. Nolte and A. K. Engel, Sci. Rep., 2017, 7, 8797 CrossRef PubMed.
- F. Pedregosa, G. Varoquaux, A. Gramfort, V. Michel, B. Thirion, O. Grisel, M. Blondel, P. Prettenhofer, R. Weiss, V. Dubourg, J. Vanderplas, A. Passos, D. Cournapeau, M. Brucher, M. Perrot and É. Duchesnay, J. Mach. Learn. Res., 2011, 12, 2825–2830 Search PubMed.
- A. S. Greene, C. Horien, D. Barson, D. Scheinost and R. T. Constable, Trends Neurosci., 2023, 46, 508–524 CrossRef CAS PubMed.
- M. L. Kringelbach and G. Deco, Cell Rep., 2020, 32, 108128 CrossRef CAS PubMed.
- O. Sporns, Trends Cognit. Sci., 2022, 26, 1066–1067 CrossRef PubMed.
- A. B. Barrett, M. Murphy, M.-A. Bruno, Q. Noirhomme, M. Boly, S. Laureys and A. K. Seth, PLoS One, 2012, 7, e29072 CrossRef CAS PubMed.
- S. Hagihira, Br. J. Anaesth., 2015, 115, i27–i31 CrossRef PubMed.
- A. Camassa, M. Mattia and M. V. Sanchez-Vives, 43rd Annual International Conference of the IEEE Engineering in Medicine & Biology Society (EMBC), IEEE, 2021.
- G. Deco, D. Martí, A. Ledberg, R. Reig and M. V. Sanchez Vives, PLoS Comput. Biol., 2009, 5, e1000587 CrossRef PubMed.
- S. Sarasso, M. Boly, M. Napolitani, O. Gosseries, V. Charland-Verville, S. Casarotto, M. Rosanova, A. G. Casali, J. F. Brichant, P. Boveroux, S. Rex, G. Tononi, S. Laureys and M. Massimini, Curr. Biol., 2015, 25, 3099–3105 CrossRef CAS PubMed.
- A. S. Ecker, P. Berens, G. A. Keliris, M. Bethge, N. K. Logothetis and A. S. Tolias, Science, 2010, 327, 584–587 CrossRef CAS PubMed.
- M. J. McGinley, M. Vinck, J. Reimer, R. Batista-Brito, E. Zagha, C. R. Cadwell, A. S. Tolias, J. A. Cardin and D. A. McCormick, Neuron, 2015, 87, 1143–1161 CrossRef CAS PubMed.
- R. G. Bettinardi, N. N. Tort-Colet, M. Ruiz-Mejias, M. V. Sanchez-Vives and G. Deco, NeuroImage, 2015, 114, 185–198 CrossRef PubMed.
- A. Cimenser, P. L. Purdon, E. T. Pierce, J. L. Walsh, A. F. Salazar-Gomez, P. G. Harrell, C. Tavares-Stoeckel, K. Habeeb and E. N. Brown, Proc. Natl. Acad. Sci. U. S. A., 2011, 108, 8832–8837 CrossRef CAS PubMed.
- A. G. Hudetz, Brain Connectivity, 2012, 2, 291 CrossRef PubMed.
- G. Zamora-López, Y. Chen, G. Deco, M. L. Kringelbach and C. Zhou, Sci. Rep., 2016, 6, 38424 CrossRef PubMed.
- A. Pazienti, A. Galluzzi, M. Dasilva, M. V. Sanchez-Vives and M. Mattia, iScience, 2022, 25, 103918 CrossRef CAS PubMed.
- M. A. Colombo, M. Napolitani, M. Boly, O. Gosseries, S. Casarotto, M. Rosanova, J.-F. Brichant, P. Boveroux, S. Rex, S. Laureys, M. Massimini, A. Chieregato and S. Sarasso, NeuroImage, 2019, 189, 631–644 CrossRef CAS PubMed.
- S. Casarotto, A. Comanducci, M. Rosanova, S. Sarasso, M. Fecchio, M. Napolitani, A. Pigorini, A. G. Casali, P. D. Trimarchi, M. Boly, O. Gosseries, O. Bodart, F. Curto, C. Landi, M. Mariotti, G. Devalle, S. Laureys, G. Tononi and M. Massimini, Ann. Neurol., 2016, 80, 718–729 CrossRef PubMed.
- G. Deco, Y. Sanz Perl, H. Bocaccio, E. Tagliazucchi and M. L. Kringelbach, Commun. Biol., 2022, 5, 1–13 CrossRef PubMed.
- A. Ikeda, H. Takeyama, C. Bernard, M. Nakatani, A. Shimotake, M. Daifu, M. Matsuhashi, T. Kikuchi, T. Kunieda, R. Matsumoto, T. Kobayashi and K. Sato, Neurosci. Res. Lett., 2020, 156, 95–101 CrossRef PubMed.
- J. Lückl, C. L. Lemale, V. Kola, V. Horst, U. Khojasteh, A. I. Oliveira-Ferreira, S. Major, M. K. L. Winkler, E.-J. Kang, K. Schoknecht, P. Martus, J. A. Hartings, J. Woitzik and J. P. Dreier, Brain, 2018, 141, 1734–1752 CrossRef PubMed.
- B. Antkowiak and C. Helfrich-Förster, Anesthesiology, 1998, 88, 1592–1605 CrossRef CAS PubMed.
- G. P. Krishnan, O. C. González and M. Bazhenov, Proc. Natl. Acad. Sci. U. S. A., 2018, 115, 6858–6863 CrossRef CAS PubMed.
- W.-J. Pan, G. J. Thompson, M. E. Magnuson, D. Jaeger and S. Keilholz, NeuroImage, 2013, 74, 288–297 CrossRef PubMed.
- F. Frohlich and D. A. McCormick, Neuron, 2010, 67, 129–143 CrossRef CAS PubMed.
- B. Rebollo, B. Telenczuk, A. Navarro-Guzman, A. Destexhe and M. V. Sanchez-Vives, Sci. Adv., 2021, 7, eabc7772 CrossRef PubMed.
- A. Comanducci, M. Boly, J. Claassen, M. D. Lucia, R. M. Gibson, E. Juan, S. Laureys, L. Naccache, A. M. Owen, M. Rosanova, A. O. Rossetti, C. Schnakers, J. D. Sitt, N. D. Schiff and M. Massimini, Clin. Neurophysiol., 2020, 131, 2736–2765 CrossRef CAS PubMed.
Footnote |
| † Electronic supplementary information (ESI) available. See DOI: https://doi.org/10.1039/d3nh00440f |
| This journal is © The Royal Society of Chemistry 2024 |