 Open Access Article
Photoelectrochemical performance of a nanostructured BiVO4/NiOOH/FeOOH–Cu2O/CuO/TiO2 tandem cell for unassisted solar water splitting†
S. R.
Sitaaraman
ab,
A. Nirmala
Grace
 a,
Jiefang
Zhu
 c and
Raja
Sellappan
 *a
*a
aCentre for Nanotechnology Research, Vellore Institute of Technology, Vellore, India-632014. E-mail: raja.sellappan@vit.ac.in
bDepartment of Electrical and Electronics Engineering, SRM Institute of Science and Technology, Ramapuram, Chennai, India-600089
cDepartment of Chemistry – Ångström Laboratory, Uppsala University, 75121 Uppsala, Sweden
First published on 19th March 2024
Abstract
An unassisted solar water splitting tandem cell is fabricated using FeOOH/NiOOH-coated BiVO4 nanostructures as a photoanode and a TiO2-protected heterojunction Cu2O/CuO thin film as a photocathode. The individual photoelectrochemical (PEC) performance of the nanostructured BiVO4/NiOOH/FeOOH photoanode produces a photocurrent of 2.05 mA cm−2 at 1.23 V vs. RHE, while the Cu2O/CuO/TiO2 photocathode delivers −1.61 mA cm−2 at 0 V vs. RHE under an AM 1.5 filtered illumination of 100 mW cm−2. The operating point of tandem cell photocurrent is found to be 0.273 mA cm−2 at 0.56 V vs. RHE. From two-electrode linear sweep voltammetry, the tandem cell (BiVO4/NiOOH/FeOOH–Cu2O/CuO/TiO2) delivers an unassisted current density of 0.201 mA cm−2 at 0 V. The chronoamperometry test further demonstrates the stable nature of the tandem cell, which retains a current density of 0.187 mA cm−2 during a testing duration of 3000 seconds. The proposed tandem cell provides optimized solutions to designing a cost-effective and stable solar water splitting system for the fulfillment of the future energy needs.
1. Introduction
The production of solar hydrogen using semiconductor photoelectrode materials is considered a potential strategy to provide clean and green energy with zero carbon footprint without substantially modifying the existing infrastructure. A single-electrode semiconductor photoelectrochemical (PEC) system has yet to find a way to achieve a practical efficiency of 10% since the pioneering work of Fujishima and Honda in 1972.1 The tandem integration of solar cells along with the PEC system2 is advantageous when state-of-the-art solar cells are constructed with semiconductor materials for solar water splitting. Recent research studies examined such an approach by combining photovoltaic devices, such as dye sensitized solar cells3 and perovskite solar cells,4 with a PEC device consisting of a single semiconductor electrode and found that it produces a higher solar-to-hydrogen (STH) conversion efficiency (13.8%).5 However, the overall complexity of the system and photocorrosion of narrow bandgap semiconductors are critical issues in commercializing such approaches. Compared to the PV-integrated PEC approach, a tandem PEC cell consisting of an n-type photoanode and p-type photocathode6 is a viable approach in terms of feasibility and practicality. Certain basic requirements should be met for the construction of efficient tandem PEC cells. First, the bandgap of semiconductors used in tandem cells should be complementary to each other and should be chosen as per the proposed contour plot7 to achieve the maximum theoretical efficiency. The implementation of complementary bandgap semiconductors enables harvesting a significant portion of the incoming solar spectrum.8 Second, the valence band edge position of the semiconductor should be more positive than the water oxidation potential (1.23 V vs. RHE at pH = 0) for photoanodes, and the conduction band edge of the semiconductor should be more negative than the water reduction potential (0 V vs. RHE at pH = 0) for photocathodes.9 The difference in the Fermi level of the photoanode and photocathode determines the bias required for solar water splitting.Among various semiconductors, bandgap tunable ternary metal oxides are suitable candidates for photoanodes.10 BiVO4 fulfills several requirements of being an efficient photoanode in a tandem cell. With a bandgap of 2.4 eV (ref. 11) and favorable band edge positions, BiVO4 can be used for the water oxidation reaction. However, BiVO4 suffers from surface recombination, a high onset potential and poor water oxidation kinetics.12 These hurdles significantly reduce the current density of BiVO4 compared to the theoretical current density of 7.5 mA cm−2.13 Approaches, such as the addition of dopants, heterojunction formation, incorporating an interlayer14 and increasing the surface area by morphology control, can improve its PEC properties. BiVO4 porous nanostructures help in aiding the charge separation and surface-to-volume ratio due to its hollow network. Sutripto Majumder et al.15 studied the effect of ZnFe2O4 on BiVO4 nanostructure photoanodes, which produced a photocurrent density of 0.73 mA cm−2 at 1.23 V vs. RHE. This photocurrent density value is higher than that for the thin film counterpart.16 In order to obtain unassisted tandem cell operation, the onset potential could be reduced or the current density should be increased in the lower applied potential region.17 To achieve this, the co-catalyst can be loaded onto the surface of the photoanode. The loading of the oxygen evolution reaction (OER) co-catalysts provides active sites for the interfacial reaction, in addition to reducing the overpotential. The OER catalysts also improve the stability by effectively transferring the photogenerated carriers from the bulk of the photoanode to the surface due to the favorable band alignment. Several inexpensive transition metal oxyhydroxides such as FeOOH and NiOOH have been extensively used as co-catalysts for the BiVO4 photoanode. Dong Ki Lee et al.18 analyzed the effect of BiVO4 using dual oxyhydroxides, which produced a remarkable current density of ∼5 mA cm−2 at 1.23 V vs. RHE.
Among various photocathode materials, cuprous oxide (Cu2O) fulfills many requirements, such as a narrow bandgap, ease of fabrication and suitable band edge positions. The narrow bandgap of 2.1 eV is capable of boosting the efficiency of the tandem cells. On the other hand, Cu2O suffers from higher recombination, owing to the short diffusion length of the minority charge carriers and photocorrosion in the presence of an aqueous medium. The film thickness of 1 μm is required for effective absorption, but the achieved diffusion length ranges from 20 to 200 nm based on the synthesis process.19 Charge separation is also a crucial parameter to maximize the performance of the photocathode in the tandem cell. Cupric oxide (CuO) is comparatively more stable than Cu2O. Appropriate band matching of Cu2O and CuO boosts the performance of the photocathode.20 The heterojunction of Cu2O and CuO showed promising PEC performance in terms of the stability, charge separation and efficiency. Pan Wang et al.21 constructed a Pt-loaded Cu2O/CuO heterojunction photocathode, which produced a current density of −1.99 mA cm−2 at the water reduction potential. The increase in the current density was attributed to improved charge separation due to in situ formation of the CuO layer. The addition of the CuO layer reduced the charge transfer barrier at the surface. To prevent photocorrosion, various protective layers, such as TiO2 and carbon,22 can be deposited. Yuanbin Wang et al. demonstrated a TiO2 protective layer on the Cu2O photocathode using the atomic layer deposition method (ALD), which generated a current density of −3.71 mA cm−2 at 0 V vs. RHE. A band alignment of Cu2O/CuO provides stable protection with better charge separation and transport.23
In this work, we constructed a model tandem system consisting of a nanostructured BiVO4/NiOOH/FeOOH photoanode and Cu2O/CuO/TiO2 photocathode towards enhancing the PEC performance of the cell for unassisted solar water splitting. The novelty of this tandem cell is the employment of earth-abundant oxide semiconductor materials, which is chemically more stable than non-oxide elemental semiconductors. The combination of the photoelectrodes and inexpensive co-catalysts has rarely been reported in the literature in terms of the nanostructured photoanode and heterojunction photocathodes with a protective layer. We anticipate that the tandem cell will simultaneously improve the optical absorption, charge transport, and interfacial charge transfer for unbiased solar water splitting. The nanostructured photoanode enhanced the surface area, and the NiOOH/FeOOH dual layer co-catalysts minimized the overpotential and improved the charge transfer resistance. The performance of the photocathode was improved through heterojunction formation with stable CuO on Cu2O. The photocathode was further deposited by a spin-coated TiO2 layer to protect it from photocorrosion. The constructed BiVO4/NiOOH/FeOOH photoanode-Cu2O/CuO/TiO2 photocathode produced a positive current density in the unassisted PEC tests. The non-zero operating points provided the possibility of the operation of a tandem cell without an external bias.
2. Experimental methods
2.1 Materials
Bismuth nitrate pentahydrate, p-benzoquinone, copper sulphate pentahydrate, FTO substrates, iron sulphate, and potassium iodide were purchased from Sigma Aldrich. Lactic acid and vanadyl acetylacetonate were purchased from Avra chemicals. Nickel sulphate hexahydrate and sodium hydroxide were purchased from SDFCL limited. Sodium sulphate was purchased from Alfa Aesar. All of the chemicals used in the study were of analytical grade, and used without further purification.2.2 Preparation of BiVO4 nanostructures
FTO substrates were separately ultrasonically cleaned with acetone, isopropanol and ethanol. The BiVO4 photoanodes were prepared through the electrodeposition of BiOI on FTO substrates, followed by the conversion of BiOI into BiVO4 using the drop-casting of a vanadium precursor solution and subsequent annealing in air.242.3 Deposition of FeOOH and NiOOH co-catalysts
The dual co-catalysts were deposited using an electrodeposition method.25,26 The electrodeposition procedure was carried out in a three-electrode system, in which the BiVO4 photoanode, Ag/AgCl saturated KCl, and Pt wire were the working electrode, reference electrode, and counter electrode, respectively. Briefly, 0.1 M of iron sulphate solution was prepared and a constant potential of 1.2 V was applied for 5 minutes. The photoanode was rinsed with DI water and dried at room temperature. Similarly, for NiOOH deposition, 0.1 M nickel sulphate solution was prepared and a constant potential of 1.2 V was applied for 5 minutes. Finally, the photoanode was rinsed with DI water and dried at room temperature.2.4 Preparation of the Cu2O and Cu2O/CuO photocathodes
The Cu2O photocathode was prepared using an electrodeposition method.27 The Cu2O plating solution consisted of 0.4 M copper sulphate pentahydrate in 3 M lactic acid. A constant potential of −0.4 V vs. Ag/AgCl was applied to deposit Cu2O on the FTO substrate for an hour. Finally, Cu2O deposited on the FTO substrates was rinsed with a copious amount of DI water and dried at room temperature.For the in situ growth of CuO on Cu2O, the prepared Cu2O photocathode was annealed at 300 °C, 400 °C and 500 °C for 30 minutes in an air environment using a muffle furnace.28
2.5 Preparation of the TiO2 protective layer
The deposition of TiO2 was performed using a spin-coating technique.29 The TiO2 precursor sol was prepared by mixing titanium isopropoxide in isopropanol (1![[thin space (1/6-em)]](https://www.rsc.org/images/entities/char_2009.gif) :
:![[thin space (1/6-em)]](https://www.rsc.org/images/entities/char_2009.gif) 50 volume ratio). The prepared sol was spin-coated at 1000 rpm for 30 seconds. The TiO2-coated Cu2O/CuO photocathode (Cu2O/CuO/TiO2) was annealed at 200 °C for 1 hour in ambient air.
50 volume ratio). The prepared sol was spin-coated at 1000 rpm for 30 seconds. The TiO2-coated Cu2O/CuO photocathode (Cu2O/CuO/TiO2) was annealed at 200 °C for 1 hour in ambient air.
2.6 Material characterization
The structural characterization was performed using an X-ray diffractometer, D8 Advanced, Bruker with Cu-Kα radiation (λ = 1.5418 Å). Vibrational characterization was carried out using the Raman microscope, Horiba XploRA™ plus with the 532 nm green laser as a source (25% laser power). The morphology of the photoanode was analysed using a field emission scanning electron microscope (FESEM), FEI Quanta 250 FEG. Optical characterization was carried out using a UV-vis spectrometer, Specord Plus in the visible range.2.7 Photoelectrochemical characterization
All of the photoelectrochemical (PEC) characterization was carried out in a 3-electrode setup with the photoanode/photocathode as the working electrode, Ag/AgCl saturated KCl as the reference electrode, and Pt wire as the counter electrode. The PEC characterization was recorded in the AMETEK PARSTAT electrochemical workstation. The illumination source was 300 W ozone-free xenon lamp (Ushio, Japan) from Holmarc, India. The illumination source was adjusted to a power intensity of 100 mW cm−2 using a Newport AM 1.5 G filter. The active area of all photoanodes/photocathode was 1 cm2. All PEC measurements were performed in 0.1 M Na2SO4 (pH 6). The electrolyte was purged with nitrogen gas for 30 minutes prior to the testing. All of the PEC measurements were recorded with backside illumination. Linear sweep voltammetry (LSV), chronoamperometry (j vs. t), and electrochemical impedance spectroscopy (EIS) and Mott–Schottky analysis were performed to characterize the PEC performance of the photoelectrodes. LSV scans were performed at the scan rate of 20 mV s−1. Current vs. time (j vs. t) measurements were performed at 1.23 V vs. RHE and 0 V vs. RHE for the photoanodes and photocathodes, respectively. EIS was performed in the frequency range of 105 Hz to 1 Hz using an AC signal with 10 mV amplitude. The Mott–Schottky plot was obtained at a scan range near the reported flat band potential. The potential of the working electrode was converted to a reversible hydrogen electrode (RHE) using the formula, , where
  is the standard potential of the Ag/AgCl saturated KCl reference electrode, which is 0.197 V. All of the potential in the PEC measurement was reported in the RHE scale.
2.8 Tandem cell PEC measurements
A tandem PEC cell was constructed with BiVO4 nanostructure photoanodes as the top cell and Cu2O/CuO/TiO2 as the bottom cell. The tandem measurements were performed in 0.1 M Na2SO4 (pH 6) electrolyte. The electrolyte was purged with nitrogen for 30 minutes prior to the experiments. The active area of the photoanode/photocathode was 1 cm2. Electrochemical analysis, such as linear sweep voltammetry (LSV) and unassisted stability tests (j vs. t), was performed.3. Results and discussion
3.1 Characterization of the photoelectrode materials
Fig. 1(a) and (b) shows the FESEM micrograph of the BiVO4 nanostructured photoanodes with and without co-catalysts. BiVO4 exhibited a 3D porous network that was formed by small nanoworm-like particles. No significant changes in the morphology was observed after the deposition of NiOOH and FeOOH. Nevertheless, the co-catalyst deposition was confirmed by EDAX elemental analysis (see ESI, Fig. S2†). The electrodeposited Cu2O in Fig. 1(c) exhibits a dense compact structure. After annealing, the top layer Cu2O was converted into CuO, and its morphology revealed a slightly bigger dense structure (Fig. 1(f)). As the annealing time (45 minutes) was increased, the Cu2O layers became completely converted to CuO. Hence, the annealing time was limited to 30 minutes to obtain an optimum Cu2O/CuO heterojunction, as shown in Fig. 1(d). The cross-sectional FESEM micrograph of the BiVO4/NiOOH/FeOOH nanostructures (2.9 μm thick) and Cu2O/CuO/TiO2 (1.176 μm thick) are shown in Fig. S1 (a) and (b) in the ESI,† respectively. Fig. 1(e) shows the protective layer coating of TiO2 on Cu2O. It was observed that TiO2 was conformally coated on top of Cu2O/CuO (Fig. 1(e)). The corresponding EDS mapping of the BiVO4 nanostructure photoanodes and Cu2O photocathodes are shown in Fig. S2 and S3 in the ESI,† respectively.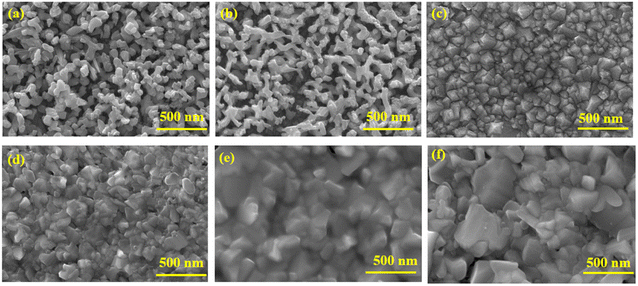 | ||
| Fig. 1 FESEM image of (a) BiVO4, (b) BiVO4/NiOOH/FeOOH nanostructured photoanodes, (c) pure Cu2O, (d) Cu2O/CuO, (e) Cu2O/CuO/TiO2 and (f) CuO photocathode. | ||
X-Ray Diffraction (XRD) was used to analyze the crystallinity of the photoelectrodes. The XRD pattern of BiVO4 and the modified BiVO4 photoanodes are shown in Fig. 2(a). The peaks at 18.9° and 28.9° confirmed the presence of the monoclinic scheelite structures of BiVO4. The obtained diffraction peaks are well indexed with JCPDS card no. 14-06888.30 The peaks of the FTO substrate were denoted as ‘*’ since some of the uncoated areas of the substrate were also exposed during the characterization. The remaining XRD peaks in Fig. 2(a) indicated the formation of monoclinic BiVO4. No diffraction peaks were obtained for FeOOH and NiOOH because of the low content and the amorphous nature of the co-catalysts. The XRD patterns of Cu2O, Cu2O/CuO and Cu2O/CuO/TiO2 are shown in Fig. 2(b). The obtained peaks at 29.8° and 38° are attributed to the formation of cubic Cu2O. Annealing of the Cu2O film in air at 400 °C initiated the formation of CuO. The formation of CuO was confirmed by the peaks at 35.5° (002). The annealing duration of 30 minutes indicated a successful formation of Cu2O to CuO. The XRD pattern obtained with a mixture of Cu2O and CuO reflects the formation of cubic CuO (indicated in Fig. 2(b), blue line pattern). The obtained XRD pattern was well indexed with the JCPDS card no. 03-0898 (ref. 20) for Cu2O and 48-1548 for CuO.31 No diffraction peak of TiO2 was obtained for the photocathode because of the low content of the TiO2 protective layer.
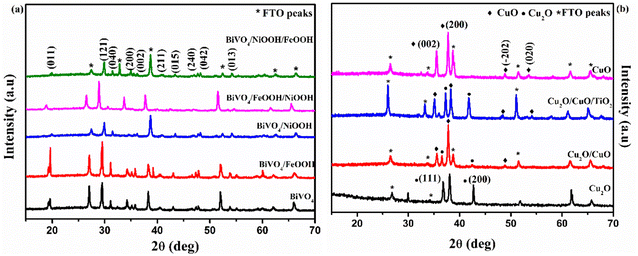 | ||
| Fig. 2 XRD pattern of (a) BiVO4, BiVO4/FeOOH, BiVO4/NiOOH, BiVO4/FeOOH/NiOOH and BiVO4/NiOOH/FeOOH nanostructured photoanodes and (b) Cu2O, Cu2O/CuO, Cu2O/CuO/TiO2 and CuO photocathodes. | ||
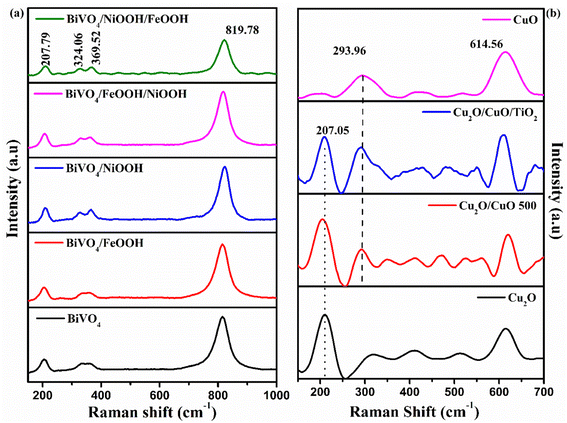
The Raman spectra shown in Fig. 3(a) further confirmed the formation of the BiVO4 photoanode and Cu2O photocathode. The Raman spectra of the BiVO4 nanostructures proved the formation of the monoclinic scheelite BiVO4 exhibiting the external mode vibration, symmetric and asymmetric deformation of VO43− and symmetric stretch mode of V–O at 207.79 cm−1, 324.06 cm−1, 369.52 cm−1 and 819.78 cm−1, respectively.32 The deposition of FeOOH and NiOOH has no effect on the Raman spectra because of the low content of the dual layer co-catalysts. Similarly, Fig. 3(b) proved the formation of Cu2O photocathodes and the mixed phase formation of Cu2O/CuO. The second order Raman peak of cubic Cu2O was ascertained by the sharp peak at 207.05 cm−1. The peak at 293.96 cm−1 confirmed the presence of CuO in the Cu2O/CuO and Cu2O/CuO/TiO2 photocathodes. The sharp peak at 207.05 cm−1 (peak of Cu2O) was absent for the pure CuO sample.33 The significance of the peaks of the BiVO4 photoanode and Cu2O photocathodes are summarized in Table S1 in the ESI.†
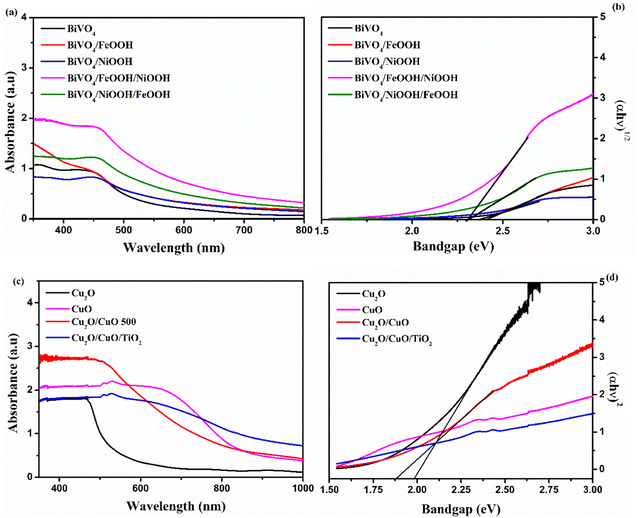
Optical absorption properties are essential in understanding the electronic structure of photocatalysts, which further determines the bandgap of materials. In order to evaluate the optoelectronic properties, UV-vis absorption spectra were measured. Fig. 4(a) shows the absorbance spectra of the BiVO4 nanostructured photoanode. The absorption edge of the photoanodes started at around 550 nm. The absorption edge of Cu2O was observed at around 700 nm, shown in Fig. 4(c). Upon the formation of CuO on Cu2O after annealing, the formed heterojunction red-shifted the absorption edge to around 850 nm due to the presence of CuO on the top surface. After thermal oxidation, the top surface of the photocathode was changed from reddish yellow to black, which implies the formation of CuO. The color of the Cu2O layer was still visible, when the photocathode was viewed from the back side of the conducting substrate. The bandgap was calculated using the absorption spectra from the Tauc's plot shown in Fig. 4(b) and (d). The values of the absorption edge and the band gap of the BiVO4 photoanodes and Cu2O photocathodes are summarized in Table S2 in the ESI.†
3.2 Photoelectrochemical (PEC) properties
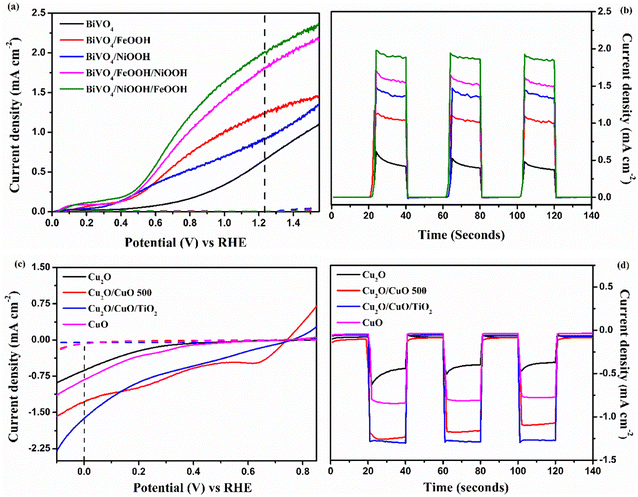
The individual PEC performance of the photoelectrodes were analyzed using a three-electrode setup in 0.1 M Na2SO4 electrolyte (pH = 6) under AM 1.5 G illumination, and the results are shown in Fig. 5. From Fig. 5(a), the bare BiVO4 nanostructured photoanode provided an anodic response upon illumination, and produced a photocurrent density of 0.65 mA cm−2 at 1.23 V vs. RHE. The onset potential of the bare BiVO4 nanostructure photoanode was 0.45 V vs. RHE. The BiVO4/FeOOH and BiVO4/NiOOH photoanode achieved an improved photocurrent density of 1.24 and 0.91 mA cm−2 at 1.23 V vs. RHE, and exhibited a considerable cathodic shift in the onset potential (0.41 V vs. RHE). The cathodic shift in the onset potential was ascribed to the reduced surface recombination and accelerated oxygen evolution reaction. The result verifies that the FeOOH and NiOOH co-catalysts effectively collect the photogenerated charge carriers for the water oxidation reaction. The combination of both FeOOH and NiOOH co-catalysts on BiVO4 significantly boosted the photocurrent density compared to the individual co-catalyst. The significant enhancement in the photocurrent density and the reduction in the onset potential could be due to the synergic effect of the dual layer co-catalyst configuration. The BiVO4/NiOOH interface minimizes the recombination, while the FeOOH/electrolyte interface enables the surface charge to be more favorable for improving the water oxidation reaction. Chronoamperometry (j vs. t) measurements of the BiVO4 nanostructured photoanodes shown in Fig. 5(b) were performed at 1.23 V vs. RHE for 140 seconds, and the illumination was chopped for every 20 seconds. The BiVO4/NiOOH/FeOOH photoanode produced a stable photocurrent density of 1.90 mA cm−2 for the entire 140 seconds duration.The PEC performance of the photocathode is shown in Fig. 5(c). As seen from the figure, all photocathodes produced a cathodic response upon illumination, indicating the intrinsic p-type nature of the photoelectrodes. In our previous works, we chose Cu2O as photocathodes with protective layers in the tandem structure, which produced a decent photocurrent density.34,35 In this work, a heterojunction of Cu2O/CuO has been chosen with the TiO2 protective layer to improve the charge separation and minimize the photocorrosion. The bare Cu2O and CuO photocathode produced photocurrent densities of −0.62 and −0.81 mA cm−2 at 0 V vs. RHE, respectively. On the other hand, the Cu2O/CuO thin film heterojunction structure produced an enhanced photocurrent density of −1.26 mA cm−2 at 0 V vs. RHE, which is higher than the bare Cu2O and CuO thin films. The results proved that the heterojunction structure helped in facilitating charge separation due to favorable band alignment at the interface of Cu2O/CuO and electrolyte. As a result, an improved photocurrent was achieved for this structure. The heterojunction structure was further protected with a thin TiO2 layer, and the representative Cu2O/CuO/TiO2 thin film photocathode achieved the highest photocurrent density of −1.61 mA cm−2 at 0 V vs. RHE among all prepared photocathodes. The increased onset potential and enhanced photocurrent density were attributed to protection of TiO2 and the charge separation by the heterojunction structure. The j vs. t measurement of the Cu2O photocathode was performed at 0 V vs. RHE for 140 seconds, as shown in Fig. 5(d). It is clearly visible that the Cu2O/CuO/TiO2 photocathode produced a stable current density of 1.60 mA cm−2 for the entire measurement duration. Table 1 presents the summarized PEC results of the photoelectrodes.
| Photoanode | Current density at 1.23 V vs. RHE (mA cm−2) | Onset potential (V vs. RHE) | Charge transfer resistance Rct (Ω) |
|---|---|---|---|
| BiVO4 | 0.65 mA cm−2 | 0.46 V | 1531 Ω |
| BiVO4/FeOOH | 1.24 mA cm−2 | 0.43 V | 1115 Ω |
| BiVO4/NiOOH | 0.91 mA cm−2 | 0.42 V | 1032 Ω |
| BiVO4/FeOOH/NiOOH | 1.81 mA cm−2 | 0.45 V | 876.9 Ω |
| BiVO4/NiOOH/FeOOH | 2.05 mA cm−2 | 0.40 V | 627 Ω |
| Photocathode | Current density at 0 V vs. RHE (mA cm−2) | Onset potential (V vs. RHE) | Charge transfer resistance Rct (Ω) |
|---|---|---|---|
| Cu2O | −0.62 mA cm−2 | 0.37 V | 1280 Ω |
| CuO | −0.81 mA cm−2 | 0.44 V | 935.8 Ω |
| Cu2O/CuO | −1.26 mA cm−2 | 0.73 V | 848.5 Ω |
| Cu2O/CuO/TiO2 | −1.61 mA cm−2 | 0.75 V | 407.5 Ω |
The photostability of the BiVO4vs. BiVO4/NiOOH/FeOOH photoanode and Cu2O vs. Cu2O/CuO/TiO2 photocathode was measured at 1.23 V vs. RHE and 0 V vs. RHE, respectively, for 2000 seconds. From Fig. S5 (a),† it was observed that the addition of the dual-layered electrocatalyst produced a stable current density of ∼2 mA cm−2 throughout the test without any significant degradation. Similarly, the Cu2O/CuO/TiO2 photocathode was stable throughout the measurement and retained the current density of −1.59 mA cm−2. On the other hand, the bare Cu2O photocathode was unstable in the photostability measurement test, as shown in Fig. S5(b).†
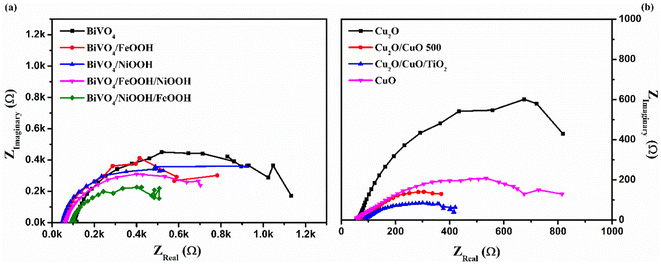
To further understand the kinetics of the PEC water splitting and the performance of the photoelectrodes, an electrochemical impedance spectroscopy (EIS) analysis was performed in a three-electrode configuration under illumination. The EIS analysis in Fig. 6 is shown in the form of a Nyquist plot from which the equivalent circuit can be constructed, which provides insights into the electrode and electrolyte interface. The Randles–Ershel fitting model was used in this study in which Rs is the series resistance, CPE is the constant phase element accounted for the capacitance of the Helmholtz layer from the electrode and electrolyte interface, and Rct is the charge transfer resistance across the interface.
Fig. 6(a) shows the EIS plot of BiVO4 and co-catalyst-loaded BiVO4 nanostructured photoanodes measured at 1.23 V vs. RHE. In the EIS spectra, the smaller semicircle corresponds to Rs and the larger semicircle corresponds to Rct. Upon addition of the co-catalysts, a significant reduction in the charge transfer resistance was observed. The smaller Rct value signifies an efficient charge transfer between the semiconductor–electrolyte interfaces. It was also observed that Rct further decreases for the dual-cocatalyst loaded BiVO4 nanostructured photoanode, compared to the mono co-catalyst counterpart. The BiVO4/NiOOH/FeOOH photoanode exhibited the Rct value of 627 Ω, which is lower than that for the bare BiVO4 (1531 Ω). The result proved that the first layer co-catalyst aids in minimizing the surface defects and recombination, and the second layer co-catalyst helps in boosting the kinetics of OER. On the other hand, the EIS spectra of Cu2O and the Cu2O-modified photocathodes are shown in Fig. 6(b), which was measured at 0 V vs. RHE. The value of Rct decreased in the order of Cu2O > CuO > Cu2O/CuO > Cu2O/CuO/TiO2. The extracted EIS spectra values also support the photocurrent density values observed from the LSV response. The TiO2-protected Cu2O/CuO photocathode has the lowest charge transfer resistance of 407.5 Ω, which is lower than that of the bare Cu2O (1280 Ω). The constructed equivalent circuit of the photoanode and photocathode is shown in Fig. S4 in the ESI.†
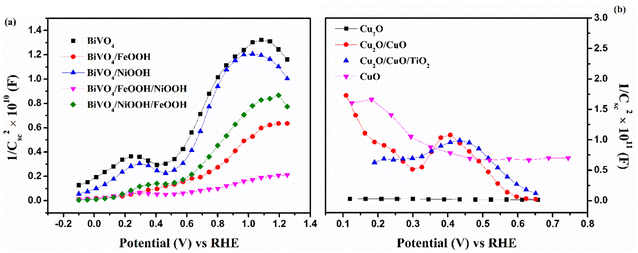
Furthermore, Mott–Schottky (MS) analysis was carried for BiVO4 and Cu2O photoelectrodes under dark condition at 1 kHz frequency. The MS plots are used to calculate the flat band potential (EFB) and carrier density. Fig. 7(a) shows the MS plots of the BiVO4 nanostructured photoanodes, which exhibit positive slopes, indicating the intrinsic nature of the n-type behavior. The EFB value of the bare BiVO4 and BiVO4/NiOOH/FeOOH photoanode was estimated to be 0.40 V and 0.41 V vs. RHE, respectively. The cathodic shift of EFB for the latter is correlated to the significant reduction in the overpotential of OER caused by the FeOOH and NiOOH co-catalysts. The carrier density was extracted using the slope of the obtained MS plots and the values are summarized in Table 2. The higher carrier concentration means the photoanode/photocathode requires a low overpotential to initiate the charge transfer reaction, which is evident from the low charge transfer resistance obtained in the EIS spectra and the highest current density of the BiVO4/NiOOH/FeOOH photoanode and Cu2O/CuO/TiO2 photocathode obtained in the LSV spectra. Fig. 7(b) shows the MS plot of the Cu2O photocathodes, which shows the typical p-type behavior manifested as the negative slope. The MS result of the bare Cu2O yielded the EFB value of 0.51 V vs. RHE. The EFB of 0.64 V vs. RHE was obtained for the Cu2O/CuO/TiO2 photocathode, which is more anodic than the bare Cu2O, implying the potential of the heterojunction and protective layer in minimizing the surface defects.
| Photoanode | Flat band potential (EFB) (V vs. RHE) | Carrier density (cm−3) |
|---|---|---|
| BiVO4 | 0.40 V | 6.129 × 10²⁰ |
| BiVO4/FeOOH | 0.44 V | 1.327 × 10²¹ |
| BiVO4/NiOOH | 0.43 V | 5.249 × 10²¹ |
| BiVO4/FeOOH/NiOOH | 0.42 V | 6.025 × 10²¹ |
| BiVO4/NiOOH/FeOOH | 0.41 V | 8.561 × 10²¹ |
| Photocathode | Flat band potential (EFB) (V vs. RHE) | Carrier density (cm−3) |
|---|---|---|
| Cu2O | 0.51 V | −1.218 × 10²⁰ |
| CuO | 0.57 V | −1.067 × 10²⁰ |
| Cu2O/CuO | 0.62 V | −3.129 × 10²⁰ |
| Cu2O/CuO/TiO2 | 0.64 V | −8.122 × 10²⁰ |
3.3 Tandem PEC cell analysis
In order to analyze the viability of the proposed tandem cell, the absolute LSV responses of the BiVO4 photoanodes and Cu2O photocathodes are plotted to find the intersecting point, which provides the operating voltage and current density based on the PEC activity of the individual photoelectrodes. Fig. 8 shows the overlay plot of the absolute LSV responses of the BiVO4/NiOOH/FeOOH vs. Cu2O/CuO/TiO2 tandem PEC cells. The overlay curve provided the operating photocurrent density of 0.344 mA cm−2 at the operating voltage of 0.51 V vs. RHE for the BiVO4/NiOOH/FeOOH vs. Cu2O/CuO/TiO2 tandem cell. In the tandem cell measurement, the photoanode was placed on top of the photocathode for which a slight reduction in the operating current was identified as 0.202 mA cm−2 at 0.42 V vs. RHE for BiVO4/NiOOH/FeOOH filtered with the Cu2O/CuO/TiO2 tandem cell. The tabulation of the operating points of the constructed tandem cell is provided in Table S3 in the ESI.† This intersection point provides us with the actual maximum limit of the proposed tandem PEC cell. The non-zero operating current density hints at the possibility of unassisted operation of the tandem PEC cell. The calculated solar-to-hydrogen (STH) conversion efficiency for the BiVO4/NiOOH/FeOOH–Cu2O/CuO/TiO2 tandem cell was 0.27% using eqn (1.1) in the ESI.†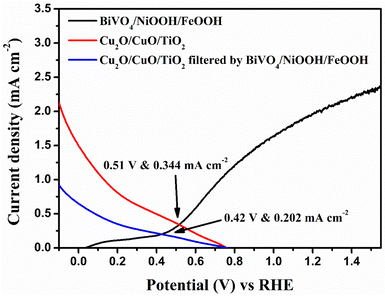 | ||
| Fig. 8 Overlay of the absolute LSV responses of BiVO4, BiVO4/NiOOH/FeOOH, Cu2O and Cu2O/CuO/TiO2 to find the operating point of the tandem cell. | ||
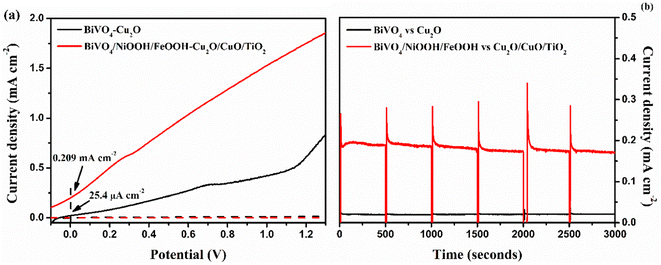
The tandem cell was constructed using BiVO4 as the top and Cu2O as the bottom, as shown in Fig. S6 in the ESI.† We compared the performance of BiVO4vs. Cu2O and BiVO4/NiOOH/FeOOH vs. Cu2O/CuO/TiO2 tandem cells using two-electrode LSV analysis. Fig. 9(a) shows the LSV response under the AM1.5 G equipped illumination source with a power intensity of 100 mW cm−2. The representative BiVO4/NiOOH/FeOOH vs. Cu2O/CuO/TiO2 tandem cell produced an unassisted photocurrent density of 0.201 mA cm−2 at zero bias, whereas the bare BiVO4vs. Cu2O produced a photocurrent density of 25.4 μA cm−2 at zero bias. The result suggested the potential of the co-catalyst loading in the photoanode side and heterojunction formation in the photocathode side upon enhancement of the PEC performance. Finally, the unassisted photostability tests were performed for both tandem cell structures for 3000 seconds, as shown in Fig. 9(b). The bare tandem cells provided negligible current density under illumination. This is due to the sluggish water splitting reaction kinetics and photocorrosion of the photocathode. For the BiVO4/NiOOH/FeOOH vs. Cu2O/CuO/TiO2 tandem cell, the current density spiked to 0.32 mA cm−2 and the current density became constant after 50 seconds, with a stable current density of 0.187 mA cm−2. The synergic effect of NiOOH/FeOOH on lowering the overpotential of the BiVO4 nanostructure and the double protection of Cu2O by CuO/TiO2 enhanced the unassisted current density and ensured the stable operation of the tandem cell. The comparison of the tandem PEC cell with our previous works and the recent literature are tabulated in Table 3.
| Photoanode | Photocathode | Electrolyte | pH | Current density of the tandem cell | References |
|---|---|---|---|---|---|
| BiVO4/Co-Pi | Cu2O/Al:ZnO/TiO2/RuOx | 0.5 M Na2SO4 + 0.09 KH2PO4 + K2HPO4 | 6 | 0.25 mA cm−2 | 36 |
| BiVO4/TiO2/FeOOH | Cu2O | 0.2 M phosphate buffer | 8 | 0.12 mA cm−2 | 24 |
| W–BiVO4/Co-Pi | CuBi2O4/CdS/TiO2/RuOx | 0.3 M K2SO4 + 0.2 M phosphate buffer | 6.8 | 0.1 mA cm−2 | 37 |
| BiVO4/Co–Bi | CuBi2O4/Co–Bi | 0.5 M borate buffer | 9.2 | 0.036 mA cm−2 | 38 |
| BiVO4 | Au/Cu2O/H:Ti3C3Tx | 1 M Na2SO4 | 5 | −0.45 mA cm−2 | 39 |
| Mo–BiVO4/Co-Pi | CuBi2O4/Pt | 0.1 M potassium phosphate buffer | 7 | 0.15 mA cm−2 | 40 |
| Mo–BiVO4/TiO2/FeOOH | Cu2O/TiO2/MoS2 | 0.1 M Na2SO4 | 6 | 0.0653 mA cm−2 | 34 |
| Mo–BiVO4/C/FeOOH | Cu2O/C/MoS2 | 0.1 M Na2SO4 | 6 | 0.107 mA cm−2 | 35 |
| BiVO4/NiOOH/FeOOH | Cu2O/CuO/TiO2 | 0.1 M Na2SO4 | 6 | 0.187 mA cm−2 | This work |
3.4 Post-PEC test characterization
XRD patterns of the photoanode and photocathode after the PEC test are shown in Fig. 10. The XRD patterns were recorded after the tandem PEC cell measurements, such as LSV and stability test. The XRD patterns of the BiVO4/NiOOH/FeOOH photoanode were well indexed with JCPDS card no. 014-06888, as shown in Fig. 10(a), both before and after the PEC test. No shift in the peaks or appearance of new peaks was found for the photoanode after the PEC tests, demonstrating the high stability of the BiVO4/NiOOH/FeOOH photoanode. There was only a minor decrease in the intensity of the XRD pattern obtained after PEC testing, which could be due to different amounts used in the sample preparation. Similarly, the XRD patterns of the Cu2O/CuO/TiO2 photocathode obtained before and after PEC measurements are shown in Fig. 10(b). There is no significant change in the XRD peak positions and no new peaks appeared after the PEC test, which implied the stable nature of the photocathodes as a result of the CuO and TiO2 protective layers.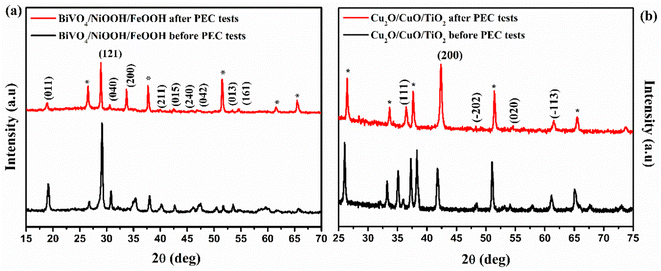 | ||
| Fig. 10 XRD pattern obtained before and after PEC measurements of the (a) BiVO4/NiOOH/FeOOH photoanode and (b) Cu2O/CuO/TiO2 photocathode. | ||
Raman spectra were obtained for the BiVO4/NiOOH/FeOOH photoanode and Cu2O/CuO/TiO2 photocathodes, and are illustrated in Fig. 11(a) and (b), respectively. The Raman spectra of the photoanode showed that no significant change in peak position or appearance of new peaks occurred after PEC measurement. Similarly, in the Raman spectra of the photocathode before and after PEC testing, the photocathode exhibited two major characteristic peaks of Cu2O and CuO at 208.57 cm−1 and 285.86 cm−1, respectively. The major peak at 208.57 cm−1 was the characteristic second order Raman peak of cubic Cu2O, and the peak at 285.86 cm−1 was the characteristic peak of CuO. The Raman result also confirmed the stable nature of the photoelectrodes after the PEC tests.
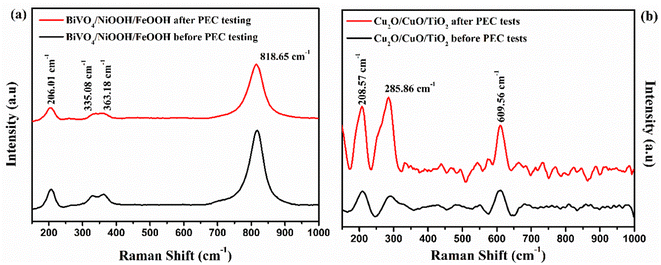 | ||
| Fig. 11 Raman spectra obtained before and after PEC testing of (a) the BiVO4/NiOOH/FeOOH photoanode and (b) Cu2O/CuO/TiO2 photocathode. | ||
4. Conclusion
A simple and economical strategy for boosting the PEC performance of the BiVO4 and Cu2O tandem cell was reported. The tandem cell consisted of the nanostructured BiVO4/NiOOH/FeOOH photoanode and heterojunction Cu2O/CuO/TiO2 photocathode, which exhibited improved PEC performance compared to reference tandem structures with single component counterparts. The formation of the BiVO4 nanostructures increased the surface active area. The co-catalyst NiOOH facilitated the separation of charge carriers from BiVO4, and FeOOH facilitated the transfer of charge carriers to the surface of the photoelectrode. The representative photoanode and photocathode produced a photocurrent density of 2.05 mA cm−2 at 1.23 V vs. RHE and 1.61 mA cm−2 at 0 V vs. RHE, respectively. The thermal oxidation of Cu2O in situ formed a Cu2O/CuO heterojunction, which efficiently separated the photogenerated charges due to favorable downward band bending. The BiVO4/NiOOH/FeOOH vs. Cu2O/CuO/TiO2 model tandem cell produced an unassisted current density of 0.185 mA cm−2, which is equivalent to 0.22% STH efficiency. The tandem cell was stable during the testing duration of 3000 second, and the post-XRD and Raman characterizations showed negligible structural changes in the photoelectrodes.Author contributions
Sitaaraman S. R.: methodology, writing – original draft. Nirmala Grace A.: funding acquisition, validation. Jiefang Zhu: revising draft, validation. Raja Sellappan: methodology, writing – original draft, funding acquisition, validation.Conflicts of interest
The authors declare that they have no known competing financial interests or personal relationships that could have appeared to influence the work reported in this paper.Acknowledgements
This work was supported by DST – SERB, Government of India. The authors are grateful to DST – SERB project EMR/2017/001185 for the financial support.References
- A. Fujishima and K. Honda, Nature, 1972, 238, 37–38 CrossRef CAS PubMed.
- P. Chatterjee, M. S. K. Ambati, A. K. Chakraborty, S. Chakrabortty, S. Biring, S. Ramakrishna, T. K. S. Wong, A. Kumar, R. Lawaniya and G. K. Dalapati, Energy Convers. Manag., 2022, 261, 115648 CrossRef CAS.
- B. D. Sherman, M. V. Sheridan, K. R. Wee, S. L. Marquard, D. Wang, L. Alibabaei, D. L. Ashford and T. J. Meyer, J. Am. Chem. Soc., 2016, 138, 16745–16753 CrossRef CAS PubMed.
- Gurudayal, D. Sabba, M. H. Kumar, L. H. Wong, J. Barber, M. Grätzel and N. Mathews, Nano Lett., 2015, 15, 3833–3839 CrossRef CAS PubMed.
- A. M. K. Fehr, A. Agrawal, F. Mandani, C. L. Conrad, Q. Jiang, S. Y. Park, O. Alley, B. Li, S. Sidhik, I. Metcalf, C. Botello, J. L. Young, J. Even, J. C. Blancon, T. G. Deutsch, K. Zhu, S. Albrecht, F. M. Toma, M. Wong and A. D. Mohite, Nat. Commun., 2023, 14, 1–12 Search PubMed.
- Q. Chen, G. Fan, H. Fu, Z. Li and Z. Zou, Adv. Phys.: X, 2018, 3, 863–884 Search PubMed.
- M. S. Prévot and K. Sivula, J. Phys. Chem. C, 2013, 117, 17879–17893 CrossRef.
- C. Jiang, S. J. A. Moniz, A. Wang, T. Zhang and J. Tang, Chem. Soc. Rev., 2017, 46, 4645–4660 RSC.
- K. Zhang, M. Ma, P. Li, D. H. Wang and J. H. Park, Adv. Energy Mater., 2016, 6, 1600602 CrossRef.
- Y. Liu, W. Qiu, G. He, K. Wang, Y. Wang, L. Chen, Q. Wu, W. Li and J. Li, J. Phys. Chem. C, 2022, 126, 15596–15605 CrossRef CAS.
- L. Wang, Z. Liu, X. Xu, Y. Jia, Q. Mei, F. Ding, J. Peng and Q. Wang, ACS Appl. Energy Mater., 2022, 5, 6383–6392 CrossRef CAS.
- K. Chen, R. Wang, Q. Mei, F. Ding, H. Liu, G. Yang, B. Bai and Q. Wang, Applied Catalysis B: Environment and Energy, 2024, 344, 123670 CrossRef CAS.
- J. Zhang, X. Wei, J. Zhao, Y. Zhang, L. Wang, J. Huang and H. She, Chem. Eng. J., 2023, 454, 140081 CrossRef CAS.
- X. Wei, J. Zhang, L. Wang, Y. Bai, J. Huang, H. She and Q. Wang, Chem. Eng. J., 2024, 482, 149114 CrossRef CAS.
- S. Majumder, N. D. Quang, T. T. Hien, N. D. Chinh, N. M. Hung, H. Yang, C. Kim and D. Kim, Appl. Surf. Sci., 2021, 546, 149033 CrossRef CAS.
- S. S. Kalanur and H. Seo, J. Catal., 2022, 410, 144–155 CrossRef CAS.
- Y. Liu, B. R. Wygant, O. Mabayoje, J. Lin, K. Kawashima, J. H. Kim, W. Li, J. Li and C. Buddie Mullins, ACS Appl. Mater. Interfaces, 2018, 10, 12639–12650 CrossRef CAS PubMed.
- D. K. Lee and K. S. Choi, Nat. Energy, 2018, 3, 53–60 CrossRef CAS.
- D. Jeong, W. Jo, J. Jeong, T. Kim, S. Han, M. K. Son and H. Jung, RSC Adv., 2022, 12, 2632–2640 RSC.
- Y. Yang, D. Xu, Q. Wu and P. Diao, Sci. Rep., 2016, 6, 35138 CrossRef PubMed.
- P. Wang, Z. Liu, C. Han, X. Ma, Z. Tong and B. Tan, J. Nanopart. Res., 2021, 23, 268 CrossRef CAS.
- C. Y. Toe, J. Scott, R. Amal and Y. H. Ng, J. Photochem. Photobiol., C, 2019, 40, 191–211 CrossRef CAS.
- Y. Wang, S. Cao, Y. Huan, T. Nie, Z. Ji, Z. Bai, X. Cheng, J. Xi and X. Yan, Appl. Surf. Sci., 2020, 526, 146700 CrossRef CAS.
- X. Yin, Q. Liu, Y. Yang, Y. Liu, K. Wang, Y. Li, D. Li, X. Qiu, W. Li and J. Li, Int. J. Hydrogen Energy, 2019, 44, 594–604 CrossRef CAS.
- W. Zhang, J. Ma, L. Xiong, H. Y. Jiang and J. Tang, ACS Appl. Energy Mater., 2020, 3, 5927–5936 CrossRef CAS.
- J. Wei, C. Zhou, Y. Xin, X. Li, L. Zhao and Z. Liu, New J. Chem., 2018, 42, 19415–19422 RSC.
- I. R. Hamdani and A. N. Bhaskarwar, Sol. Energy Mater. Sol. Cells, 2022, 240, 111719 CrossRef CAS.
- P. P. Kunturu and J. Huskens, ACS Appl. Energy Mater., 2019, 2, 7850–7860 CrossRef CAS.
- X. Deng, G. C. Wilkes, A. Z. Chen, N. S. Prasad, M. C. Gupta and J. J. Choi, J. Phys. Chem. Lett., 2017, 8, 3206–3210 CrossRef CAS PubMed.
- H. Luo, C. Liu, Y. Xu, C. Zhang, W. Wang and Z. Chen, Int. J. Hydrogen Energy, 2019, 44, 30160–30170 CrossRef CAS.
- H. L. S. Santos, P. G. Corradini, M. A. S. Andrade and L. H. Mascaro, J. Solid State Electrochem., 2020, 24, 1899–1908 CrossRef CAS.
- A. Galembeck and O. L. Alves, Thin Solid Films, 2000, 365, 90–93 CrossRef CAS.
- M. Balık, V. Bulut and I. Y. Erdogan, Int. J. Hydrogen Energy, 2019, 44, 18744–18755 CrossRef.
- S. R. Sitaaraman, A. Nirmala Grace and R. Sellappan, RSC Adv., 2022, 12, 31380–31391 RSC.
- S. Srinivasa, R. Raghavan, N. G. Andrews and R. Sellappan, Catalysts, 2023, 13, 1–15 Search PubMed.
- P. Bornoz, F. F. Abdi, S. D. Tilley, B. Dam, R. Van De Krol, M. Graetzel and K. Sivula, J. Phys. Chem. C, 2014, 118, 16959–16966 CrossRef CAS.
- A. Song, P. Bogdanoff, A. Esau, I. Y. Ahmet, I. Levine, T. Dittrich, T. Unold, R. Van De Krol and S. P. Berglund, ACS Appl. Mater. Interfaces, 2020, 12, 13959–13970 CrossRef CAS PubMed.
- Y. H. Lai, K. C. Lin, C. Y. Yen and B. J. Jiang, Faraday Discuss., 2019, 215, 297–312 RSC.
- X. Fu, H. Chang, Z. Shang, P. Liu, J. Liu and H. Luo, Chem. Eng. J., 2020, 381, 122001 CrossRef CAS.
- J. H. Kim, A. Adishev, J. Kim, Y. S. Kim, S. Cho and J. S. Lee, ACS Appl. Energy Mater., 2018, 1, 6694–6699 CrossRef CAS.
Footnote |
| † Electronic supplementary information (ESI) available. See DOI: https://doi.org/10.1039/d4na00088a |
| This journal is © The Royal Society of Chemistry 2024 |

