 Open Access Article
In vitro profiling and molecular dynamics simulation studies of berberine loaded MCM-41 mesoporous silica nanoparticles to prevent neuronal apoptosis†
Anurag Kumar
Singh‡
 a,
Snigdha
Singh‡
a,
Tarun
Minocha
b,
Sanjeev Kumar
Yadav
b,
Reema
Narayan
c,
Usha Yogendra
Nayak
c,
Santosh Kumar
Singh
*a and
Rajendra
Awasthi
a,
Snigdha
Singh‡
a,
Tarun
Minocha
b,
Sanjeev Kumar
Yadav
b,
Reema
Narayan
c,
Usha Yogendra
Nayak
c,
Santosh Kumar
Singh
*a and
Rajendra
Awasthi
 *d
*d
aCentre of Experimental Medicine & Surgery, Institute of Medical Sciences, Banaras Hindu University, Varanasi 221005, Uttar Pradesh, India. E-mail: singhsk71@yahoo.com; Tel: +91-9415389046
bDepartment of Zoology, Institute of Science, Banaras Hindu University, Varanasi 221005, India
cDepartment of Pharmaceutics, Manipal College of Pharmaceutical Sciences, Manipal Academy of Higher Education, Manipal, 576104, Karnataka, India
dDepartment of Pharmaceutical Sciences, School of Health Sciences & Technology, UPES University, Dehradun 248007, Uttarakhand, India. E-mail: rajendra.awasthi@ddn.upes.ac.in; awasthi02@gmail.com; Tel: +91-9495234530
First published on 4th April 2024
Abstract
Neuronal loss in Alzheimer's disease has been reported to display features of apoptosis, pyroptosis (programmed necrosis), or necroptosis. This study thoroughly examines the production and characterization of MCM-41 based berberine (BBR)-loaded porous silica nanoparticles (MSNs) by a modified Stöber method, focusing on their possible role in inhibiting the apoptotic process. Particle size, polydispersity index, morphology, drug loading, zeta potential, entrapment efficiency, and drug release were examined. The formulation was analyzed using various spectroscopic techniques. The surface area was computed by the Brunauer–Emmett–Teller plot. Computational models were developed for molecular dynamics simulation studies. A small PDI value indicated an even distribution of particles at nanoscale sizes (80–100 nm). Results from XRD and SEAD experiments confirmed the amorphous nature of BBR in nanoparticles. Nanoparticles had high entrapment (75.21 ± 1.55%) and drug loading (28.16 ± 2.5%) efficiencies. A negative zeta potential value (−36.861.1 mV) indicates the presence of silanol groups on the surface of silica. AFM findings reveal bumps due to the surface drug that contributed to the improved roughness of the MSNs–BBR surface. Thermal gravimetric analysis confirmed the presence of BBR in MSNs. Drug release was controlled by simple diffusion or quasi-diffusion. Molecular dynamics simulations confirmed the existence of diffused drug molecules. Cellular studies using SH-SY-5Y cells revealed dose-dependent growth inhibition. Fragmented cell nuclei and nuclear apoptotic bodies in DAPI-stained cells exposed to nanoparticles showed an increase in apoptotic cells. Flow cytometry analysis demonstrated a lower red-to-green ratio in SH-SY-5Y cells treated with nanoparticles. This suggests improved mitochondrial health, cellular viability restoration, and prevention of the apoptotic process. This study provides essential data on the synthesis and potential of MSNs loaded with BBR, which may serve as a viable therapeutic intervention for conditions associated with apoptosis.
1 Introduction
Dementia has affected more than 55 million individuals worldwide in different ways, depending on the underlying causes and other health conditions. Dementia is the seventh-leading cause of death.1 It is anticipated that after cardiovascular diseases, neurodegenerative disorders are projected to become the primary cause of death, surpassing cancer.2,3 The estimated annual cost of neurodegenerative disorder treatment in the U.S.A. is >800 billion US dollars.4 Lack of diagnostic biomarkers and challenging identification of drug targets are the major hurdles to effective management of neurodegenerative diseases.4 The endothelium of brain capillaries creates an epithelial-like barrier known as the blood–brain barrier that limits drug diffusion throughout the brain.5Formulation scientists are paying close attention to nanoparticle development because of their large and tunable pore size, and enhanced cellular transport for site-specific administration, which results in superior therapeutic intervention over traditional treatments.6,7 In recent years, substantial advancements have been observed in several therapeutic carrier systems. Mobil Crystalline Material No. 41 (MCM-41) mesoporous silica nanoparticles (MSNs) are gaining significant interest in drug delivery. The Stöber method is regarded as the most efficient technique for producing monodisperse silica spheres when compared to traditional methods such as the flame synthesis and micro-emulsion methods. The Stöber method offers a versatile chemical pathway that yields compounds that are well-dispersed, highly pure, and chemically reactive. The condensation and hydrolysis can be carried out at lower temperatures than in traditional methods.8 MSNs excel as nanocarriers due to tunable pore characteristics, high drug loading, chemical stability, biocompatibility, facile surface functionalization, controlled release, cargo versatility, multimodal imaging potential, ease of production, and prolonged circulation time, making them promising for diverse biomedical applications.9 MSNs are promising for blood storage due to their antioxidant properties, however their large surface area may cause protein adsorption and impact biocompatibility.10 Silica nanoparticles, such as MSNs, function as permeation enhancers, especially in overcoming biological barriers like tight junctions in the gut. The surface roughness of nanoparticles is vital in determining their interaction with barriers like the blood–brain barrier, affecting adhesion and protein interactions.11 We previously described the synthesis of silica nanoparticles loaded with berberine in our research. The nanoparticles showed a significant inhibitory effect on acetylcholinesterase in mice stimulated with scopolamine.3 Expanding on these findings, our current study investigates the therapeutic efficacy of the developed formulation. Through in vitro analysis, we focus on the toxicity profile, mitochondrial health, cellular viability restoration, and potential prevention of the apoptotic process.
Berberine, an isoquinoline alkaloid, inhibits the Jun amino-terminal kinases pathway and apoptotic signaling pathway/Akt/2 survival/ERK1/GSK3β/caspase-3 activity. It is obtained from the stem and root of the Berberis species. The neuroprotective effect of BBR is associated with suppression of the Akt/ERK1/2 survival/apoptotic signaling pathway/GSK3/caspase-3 and Jun aminoterminal kinase pathways.12 Its low oral bioavailability (0.36% in humans and 0.68% in animal models) is caused by rapid hepatic clearance13,14 or the interaction of BBR with P-glycoprotein pumps.15 The development of MSNs loaded with BBR holds significant importance for advancing drug delivery systems. This approach enhances the bioavailability and stability of BBR through controlled release from MSNs. The significance lies in achieving enhanced solubility and stability of BBR, optimizing therapeutic efficacy and the biocompatibility of silica.
Systemic safety of the developed therapeutic system includes the biocompatibility of the delivery system and safety of the drug dispersed throughout the body.16 BBR was passively loaded into MSNs synthesized by the Stöber process (MSNs–BBR). MSNs–BBR were characterized for zeta potential, polydispersity index, particle size, entrapment efficiency, morphology, drug loading, specific surface area, porosity, and drug release using various spectroscopic techniques. Molecular dynamics studies were conducted to calculate the diffusion coefficient of BBR for analyzing its release profile. To ascertain the cytotoxic behaviour of synthesised MSNs–BBR, measurements of cell viability, apoptosis, and neuronal-health were performed using the neuroblastoma cell line SH-SY-5Y. After drug therapy, morphological changes were observed in the 4′,6-diamidino-2-phenylindole (DAPI) stained nucleus.
2 Materials and methods
2.1. Materials
Indian Herbs Extractions (Uttarakhand, India) provided BBR. Hydrochloric acid (37%) and dimethyl sulfoxide (DMSO) were purchased from S.D. Fine Chem, India. Tetraethylorthosilicate (TEOS 99%) and hexadecyl trimethyl ammonium bromide (CTAB ≥99%) were obtained from SRL Chemicals, India. CF300-Cu carbon-coated TEM grids were obtained from EMS (Hatfield, Pennsylvania, USA). Acetic acid, sodium dihydrogen phosphate, ammonium chloride, disodium hydrogen phosphate, and potassium chloride were received from Sisco Research Labs, Mumbai, India. Streptomycin, penicillin, trypsin-EDTA, and foetal bovine serum (FBS) were purchased from Gibco (USA). MTT was procured from Sisco Research Laboratory, India. DAPI was obtained from Himedia, Mumbai, India. Methanol, acetone, DMSO, and JC-1 were procured from Sigma-Aldrich, St. Louis, USA. An Alexa Fluor 488 Annexin V/dead cell apoptosis kit was procured from ThermoFisher Scientific, MA, USA. Cell culture flasks (T-25) and cell culture plates of various dimensions (6, 12, and 96 wells) were purchased from Genetix Biotech Asia (New Delhi, India).2.2. Methods
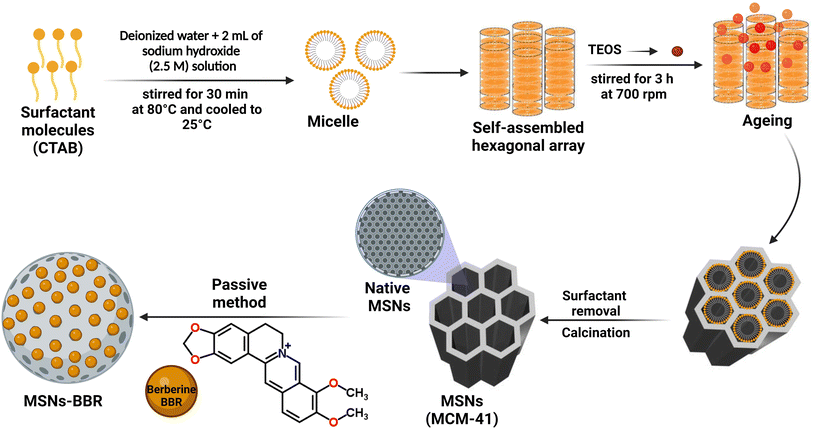
![[thin space (1/6-em)]](https://www.rsc.org/images/entities/char_2009.gif) 000 rpm. The particles were collected, dried, and then refluxed in an acidified ethanolic solution for 6 h. Organic compounds and surfactants were removed following 6 h calcination at 550 °C. For passive drug loading, MCM-41 (1 mg) was added to 1 mL of BBR solution (1 mg mL−1) and stirred for 4 h at 25 ± 1 °C and 350 rpm using a magnetic stirrer. Centrifugation was done at 5000 rpm for 30 min. BBR loaded particles (MSNs–BBR) were collected, rinsed twice with distilled water to remove the free drug, and dried in a desiccator.3
000 rpm. The particles were collected, dried, and then refluxed in an acidified ethanolic solution for 6 h. Organic compounds and surfactants were removed following 6 h calcination at 550 °C. For passive drug loading, MCM-41 (1 mg) was added to 1 mL of BBR solution (1 mg mL−1) and stirred for 4 h at 25 ± 1 °C and 350 rpm using a magnetic stirrer. Centrifugation was done at 5000 rpm for 30 min. BBR loaded particles (MSNs–BBR) were collected, rinsed twice with distilled water to remove the free drug, and dried in a desiccator.3
2.2.2.1. Particle size, zeta potential, polydispersity index, entrapment, and drug loading efficiency. The hydrodynamic diameter, polydispersity index (PDI), and zeta potential of MSNs–BBR and MCM-41 were determined using dynamic light scattering (DLS) measurements using a Zetasizer (NanoZS, Malvern Instruments, Malvern, United Kingdom). Sample dispersion was prepared using Milli-Q water. A scattering angle of 45° to 150° with 8° intervals and a refractive index of 1.10 were used to carry out DLS analysis. Sample sonication was done in a probe sonicator. The hydrodynamic diameter of particles was recorded based on the cumulated intensity distribution. Zeta potential was measured following laser doppler velocimetry (5 measurements per sample in duplicate). The investigation of the size distribution was carried out with the assistance of a Zetasizer that had a diode laser that was set to run at 659 nm. Three independent measurements were taken of each variable.3
To calculate the fraction of loaded BBR, the quantity of free BBR in the supernatant was analyzed. A sample containing 5 mg of MSNs–BBR was diluted to 5 mL with Milli-Q water and centrifuged at 8000 rpm for 30 minutes. The supernatant was analyzed at 345 nm using a Labtronics UV spectrophotometer (LT-2800) to determine the amount of free BBR. The percentage of drug loading and entrapment were calculated using the following equations:3,19
2.2.2.2. Morphological characterization. MSNs–-BBR and MCM-41 particles were analyzed using a high-resolution nova nano scanning electron microscope (HRSEM) (SEM 450, FEI, USA), a transmission electron microscope (TEM) (G2 T20 Technai, USA), and a NTEGRA prima atomic force microscope (AFM, NT-MDT Service & Logistics Ltd, Ireland). Gold-coated samples were air-dried before placed on a silica wafer for SEM analysis and images were captured at 8–10 kV. Working distance and spot size were 4.4 mm and 200 μ, respectively. For TEM imaging, particles were put into water (1 mg mL−1) and sonicated for 30 minutes. Sample dispersion (5 mL) was transferred to the TEM grids, dried at 40 °C for 12 h, and examined at 200 kV. Images were captured by a 135 mm CCD camera (charge-coupled device) at 200 kV. A spin coater was used to evenly spread a drop of sample dispersion across a thin glass slide for AFM analysis. Images were captured at 256 × 256 pixels resolution, a nominal force constant of 40 N m−1, 300 kHz cantilever frequency, and at room temperature.3 A TEAM Pegasus integrated energy dispersive spectroscopy system was used for sample analyses with a Nova Nano SEM 450 (FEI, P.T.E., Singapore). The samples were dried at 40 °C for 20 min. The gold coating of the samples was done using a SEM sputter coater. The images were captured by a CCD camera at 200 kV.
2.2.2.3. Infra-red spectroscopy. An Attenuated Total Reflectance spectrophotometer (L160000A, ATR, PerkinElmer, USA) was used to record infrared spectra from 4000 cm−1 to 400 cm−1 with a resolution of 4 cm−1.
2.2.2.4. Powder X-ray diffraction analysis. X-ray diffraction (XRD) study of BBR, MCM-41 (low angle), MSNs–BBR, and BBR: MCM-41 physical mixture (1
![[thin space (1/6-em)]](https://www.rsc.org/images/entities/char_2009.gif) :
:![[thin space (1/6-em)]](https://www.rsc.org/images/entities/char_2009.gif) 1 w/w ratio) was done using an X-ray powder diffractometer (D/max-2550, Rigaku Co., Tokyo, Japan). Samples were analyzed using CuKα radiation at 40 kV voltage, 200 mA current, and 1.54 Å wavelength. The sample analysis was done from 0 to 80° of 2θ angles.18,20
1 w/w ratio) was done using an X-ray powder diffractometer (D/max-2550, Rigaku Co., Tokyo, Japan). Samples were analyzed using CuKα radiation at 40 kV voltage, 200 mA current, and 1.54 Å wavelength. The sample analysis was done from 0 to 80° of 2θ angles.18,20
2.2.2.5. X-ray photoelectron spectroscopy analysis. A PHI 5000 Versa Probe III from ULVAC-PHI Inc., Japan, fitted with a monochromatic Al K radiation source, was used for X-ray photoelectron spectroscopy (XPS). XPS spectra of MCM-41, BBR, and MSNs–BBR were recorded. Calibration was done by using the C 1s peak at 284.5 eV as an internal standard to identify the characteristic binding energies of elements on the BBR loaded silica nanoparticle. The XPS scanning was conducted for important elements such as C, N, O, and Si.21
2.2.2.6. Thermogravimetric analysis. A thermogravimetric analyzer was used to measure the 5 mg sample's weight loss (TGA-50, Shimadzu, Japan). The temperature range of 25 to 700 °C was measured at a rate of 10 °C per min.
2.2.2.7. Porosity and specific surface area of MSNs. A Micromeritics Tristar II system (Tristar 3020, Micromeritics-II, Norcross, GA, USA) was used at 196 °C to measure nitrogen physisorption–desorption isotherms. Helium was used to calibrate the dead volume in the sample cell, and nitrogen was used as an adsorbate. Before analysis, MSNs were outgassed (at 120 °C for 12 h) to remove any possible moisture in their pores. Utilizing the Brunauer–Emmett–Teller equation, the specific surface area was determined. Pore size distribution was calculated using the Barrett–Joyner–Halenda method.22 The amount of N2 adsorbed at a relative pressure (P/P0) of 0.99 was used to calculate the total pore volume.
2.2.2.8. In vitro drug release study. Methanolic BBR solution (equivalent to 1000 μg of BBR) was filled in dialysis bags (capacity 1.61 mL cm−1, cut off molecular weight 5000 Dalton, −50Av. flat, width 22.54 mm, diameter 14.3 mm; Himedia, Mumbai, India). Ten milligrams of the formulation (≈1000 μg BBR) was incubated in dissolution fluid (1 mL) and filled in the dialysis bag. Release studies were carried out using 100 mL each of acidic (pH 4.0) and neutral media (phosphate buffer saline: PBS pH 7.4) separately. Samples (1 mL) were collected at specified intervals, and the sink condition was maintained by the addition of an equal amount of fresh dissolution medium immediately after each sample withdrawal. At 345 nm, the sample was analyzed using a Nanodrop ND1000 Thermo Scientific, UV-visible spectrophotometer (Wilmington, USA). The release profile of BBR from pure BBR solution was also estimated.3
The kinetics of drug release was studied using zero and first-order plots. The kinetics of release was further confirmed by Higuchi's model. Korsmeyer-Peppas' model was used to confirm whether the drug diffusion is Fickian or non-Fickian.23
2.3. In vitro studies
![[thin space (1/6-em)]](https://www.rsc.org/images/entities/char_2009.gif) 000 events per sample.
000 events per sample.
![[thin space (1/6-em)]](https://www.rsc.org/images/entities/char_2009.gif) 000 events per sample.
000 events per sample.
2.4. Statistical analysis
Microsoft Excel (version 2013; Microsoft Corporation, Washington, United States) was used for statistical analysis of in vitro drug release data.3 Results and discussion
3.1. Nanoparticle characterization
The results of nanoparticle characterization are presented in Table 1. Samples were analyzed for PDI to determine the width of unimodal size distributions. A PDI value less than 0.7 is considered acceptable.32 The PDI value should be <0.1 and >1, respectively, for monodisperse and polydisperse size distribution of particles.33 The PDI value of drug-loaded nanoparticles (0.281 ± 0.03) was higher than that of the MCM-41 particles (0.230 ± 0.01) (Table 1). For good dispersion homogeneity, the PDI value should be small. The MSNs–BBR particles showed a 22 nm increase in particle size (137.1 ± 2.4 nm) in comparison to the MCM-41 particles (115.5 ± 2.0 nm). An increase in particle size may result from the drug being loaded into the particles' pores and the presence of the drug on the surface. These findings are supported by previous studies in which the nanoparticle size increased following drug loading.34–36 By comparing the data from DLS and TEM studies, it is possible to determine the particle aggregation. Aggregated suspension shows comparatively smaller particles in TEM analysis than DLS.33 A larger particle size in DLS than in the TEM analysis could be due to the aggregation of particles.37 The size of prepared MSN–BBR was in the range of 90–110 nm. TEM micrographs of MCM-41 and MSNs–BBR are shown in Fig. 2A and B, respectively. The presence of diffused rings in selected area electron diffraction pattern (SAED) images is indicative of the crystalline nature of the material. The absence of diffused rings in SEAD images confirms the amorphous form of the material (Fig. 2C and 2D).| Sample code | Particle size (nm) | Zeta potential (mV) | Poly dispersity index (PDI) | Entrapment efficiency (%) | Drug loading (%) |
|---|---|---|---|---|---|
| MCM-41 | 115.5 ± 2.0 | −35.18 ± 2.1 | 0.230 ± 0.01 | — | — |
| MSNs–BBR | 137.1 ± 2.4 | −38.52 ± 2.2 | 0.281 ± 0.03 | 85.23 ± 3.11 | 33.22 ± 2.6 |
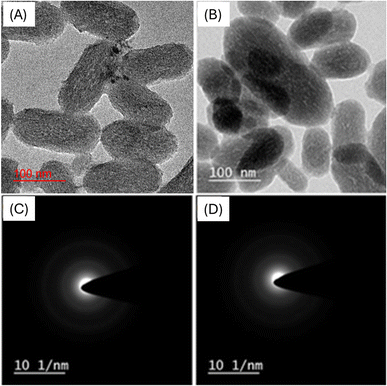 | ||
| Fig. 2 HRTEM images of (A) MCM-41 and (B) MSNs–BBR at 100 nm, and SAED micrographs of (C) MCM-41 and (D) MSNs–BBR. | ||
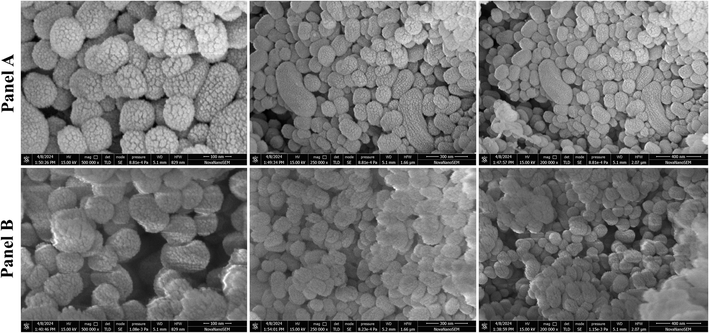
The percentage of drug entrapment and loading efficiency were 85.23 ± 3.11% and 33.22 ± 2.6%, respectively (Table 1). The electrostatic interaction and hydrogen bonding between BBR and MSNs and the highly porous nature of MCM-41 resulted in high drug loading. The surface charge (–35.18 ± 2.1 mV) of MCM-41 was attributed to the silanol groups on the silica surface.38 A zeta potential value of −38.52 ± 2.2 mV was recorded after BBR loading into MCM-41. The Zeta potential value reflects the degree of repulsion between particles with the same charge in a dispersion system. When particles have high positive or negative zeta potential values, they repel each other, preventing aggregation. Particles with zeta potentials between ±30 mV are often stable.39 Nanoparticles with high zeta potential can significantly impact BBB toxicity.40 Studies have shown that nanoparticles intended for brain delivery typically have negative zeta potentials ranging from −15 to −45 mV.41,42 SEM images of rod-shaped homogenously distributed MCM-41 and drug loaded nanoparticles are shown in Fig. 3.
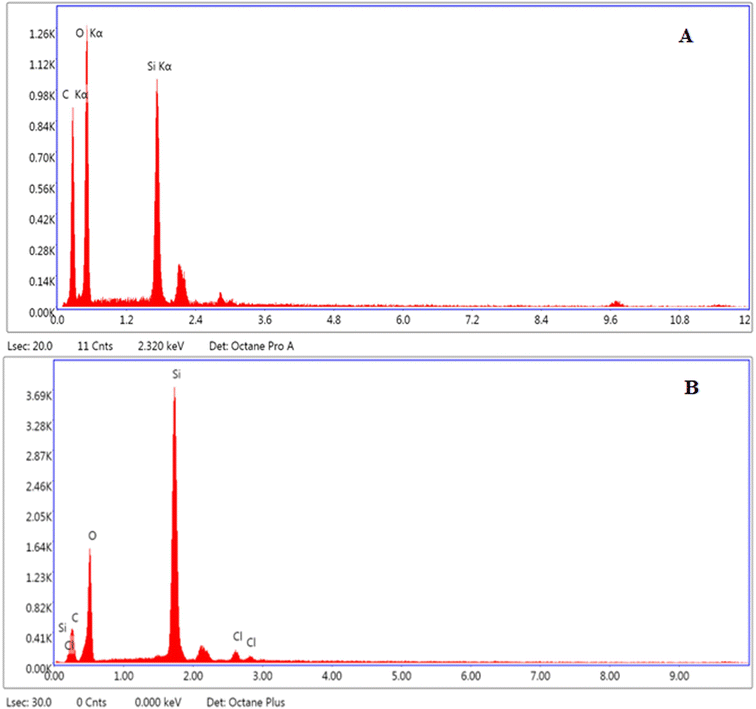
Elemental analysis of MCM-41 and drug loaded nanoparticles was carried out to find out the elemental composition, presence of environmental impurities, if any, and weight percentage. Results showed that O, C, and Si were present in all the tested samples. The elemental relative weight percentage obtained was 87.19% C and 12.81% Si (Fig. 4A), and 30.80% O, 18.22% C, 3.07% Cl, and 47.91% Si in MCM-41 and MSNs–BBR, respectively (Fig. 4B).
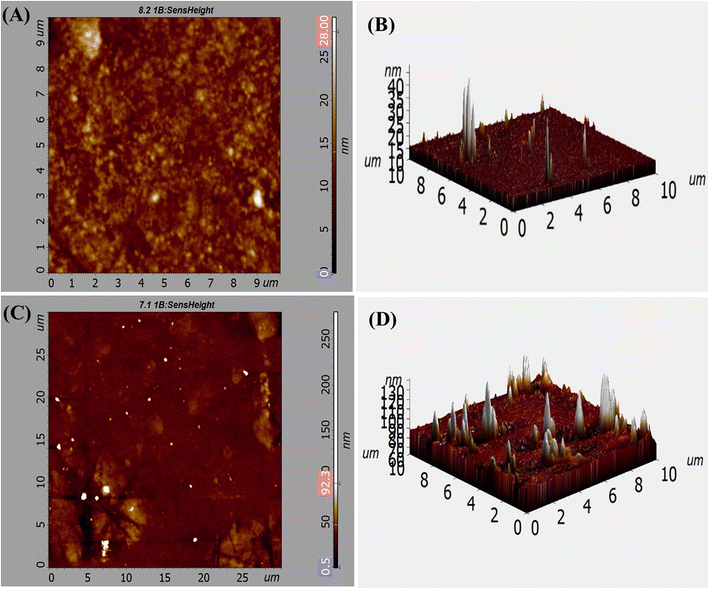
AFM studies were carried out for the three-dimensional morphological examination of MCM-41 and drug loaded nanoparticles. The mean roughness value (Ra) is determined by taking the arithmetic average of the peak and valley depths from a mean line. The height distribution in relation to the mean line is known as the root mean square roughness (Rq).43Ra and Rq of the road-shaped MCM-41 particles were 4.235 nm and 6.076 nm (2D), respectively (Fig. 5A). The root mean square roughness (Sq) and average roughness (Sa) of MCM-41 particles were 86.253 and 98.208 (3D), respectively (Fig. 5B). Smooth surface and high homogeneity were noticed in MCM-41 particles. 2D images showed that the homogeneous MSNs–BBR particles had root mean square (Ra) and roughness average (Rq) values of 10.333 nm and 16.848 nm, respectively (Fig. 5C). The root mean square roughness (Sq) and average roughness (Sa) values of MSNs–BBR were 90.236 nm and 99.686 nm, respectively (3D) (Fig. 5D). The average 2D surface roughness (Rq) of MCM-41 increased from 6.076 nm to 16.848 nm after drug loading in MSNs–BBR. Higher surface roughness suggests the presence of surface drug and effective drug loading.44
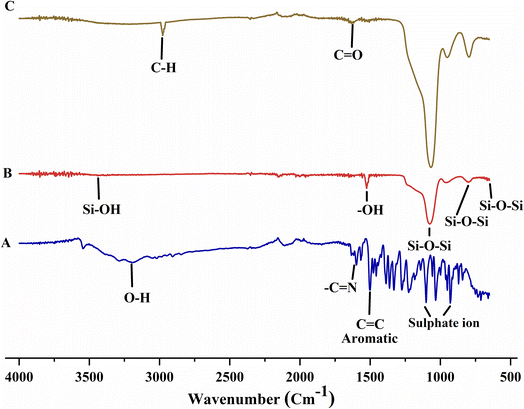
Absorption bands near 460 cm−1, 802 cm−1, and 1095 cm−1 in the FTIR spectrum of MCM-41 reflected Si–O–Si bending, Si–O–Si asymmetric stretching, and Si–O–Si symmetric stretching, respectively. The peak at 1647 cm−1 confirmed the presence of –OH bending vibration of physiosorbed water molecules in silica. The peak of Si–OH stretching was recorded near 3400 cm−1 (Fig. 6A). Absorption bands around 1107–1227 cm−1, 1505 cm1, 1602 cm−1, and 3360 cm−1 in the FTIR spectrum of BBR are attributed to the presence of sulfate ions, aromatic C![[double bond, length as m-dash]](https://www.rsc.org/images/entities/char_e001.gif) C vibrations, –C
C vibrations, –C![[double bond, length as m-dash]](https://www.rsc.org/images/entities/char_e001.gif) N stretching, and O–H stretching, respectively (Fig. 6B).45 The structure of MCM-41 was retained after BBR loading. In MSNs–BBR, the peak position was slightly shifted with a minor decrease in intensity between 2000 and 1000 cm−1. Further, the BBR peak at 3360 cm−1 was shifted to 3423 cm−1 in the spectrum of MSNs–BBR (Fig. 6C).46
N stretching, and O–H stretching, respectively (Fig. 6B).45 The structure of MCM-41 was retained after BBR loading. In MSNs–BBR, the peak position was slightly shifted with a minor decrease in intensity between 2000 and 1000 cm−1. Further, the BBR peak at 3360 cm−1 was shifted to 3423 cm−1 in the spectrum of MSNs–BBR (Fig. 6C).46
The solubility of a chemical in its amorphous form is greater than in its crystalline form due to the larger Gibbs free energy. XRD analysis determines whether the tested material is crystalline or amorphous. Sharp peaks suggest a crystalline structure, while the absence of sharp peaks implies an amorphous surface.47 Peaks at 2θ of 7.5, 9.1, 12.9, 16.2, 20.9, 25.4, and 30.1 in the XRD spectrum of BBR confirm its crystalline nature (Fig. 7A). MCM-41 showed diffractions at 2θ of 3.80, 4.43, and 5.72 (Fig. 7B). The disappearance of BBR peaks in the formulation spectrum shows amorphous dispersion of payload within the MCM-41 hexagonal channels (Fig. 7C). However, BBR peaks were not suppressed in 1![[thin space (1/6-em)]](https://www.rsc.org/images/entities/char_2009.gif) :
:![[thin space (1/6-em)]](https://www.rsc.org/images/entities/char_2009.gif) 1 w/w physically mixed BBR and MCM-41 (Fig. 7D).
1 w/w physically mixed BBR and MCM-41 (Fig. 7D).
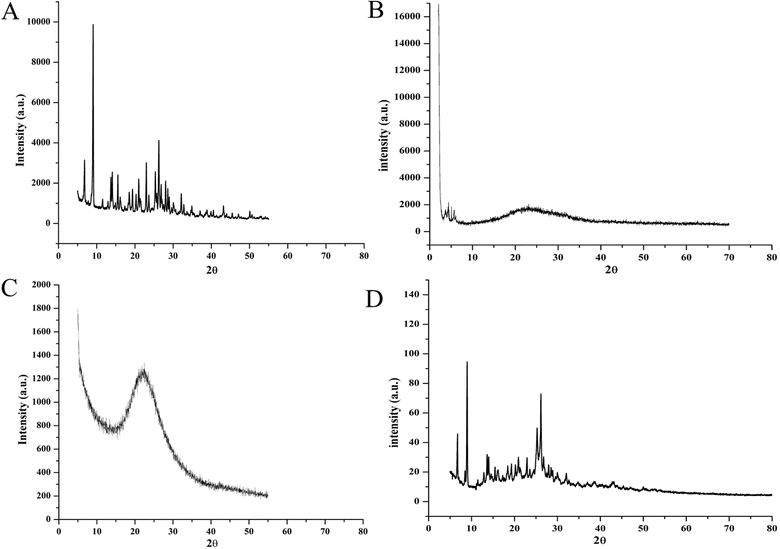 | ||
Fig. 7 X-ray diffractograms of (A) pure BBR, (B) MCM-41 (low angle), (C) MSNs–BBR, and (D) 1![[thin space (1/6-em)]](https://www.rsc.org/images/entities/char_2009.gif) : :![[thin space (1/6-em)]](https://www.rsc.org/images/entities/char_2009.gif) 1 w/w physically mixed MCM-41 and BBR. 1 w/w physically mixed MCM-41 and BBR. | ||
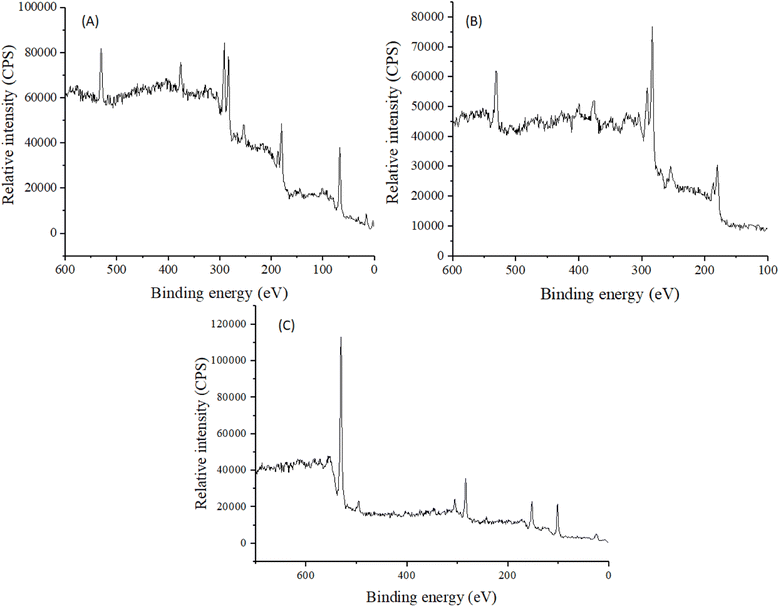
XPS analysis was done to make sure that BBR was loaded into MSNs and to find the desired elements in MCM-41, BBR, and MSNs–BBR. The O 1s and Si 2p spectra contained a single peak centred at 533.0 eV and 104.0 eV, respectively, indicating the presence of silicates.48 N 1s spectra had a single peak centred at 399.0 eV, indicating the presence of basic nitrogen atoms.49 Signals of Si, C, N, and O were detected in the survey spectrum of MSNs–BBR, indicating successful loading of BBR in MCM-41. XPS survey spectra for MCM-41, BBR, and MSNs–BBR are shown in Fig. 8. Individual characteristic peaks are shown in Fig. S1–S3 (ESI).†
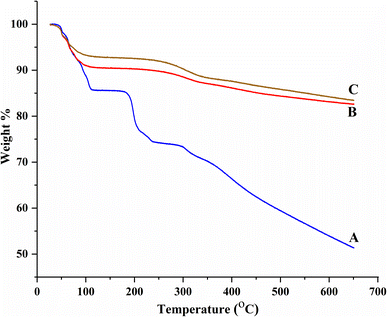
BBR loading in MSNs was further evaluated by TGA. MCM-41 showed two weight loss regions between 24 °C and 148 °C, and 354 °C and 649 °C due to the loss of moisture from the silica surface and silanol condensation, respectively (Fig. 9A).34 BBR showed four decomposition phases between 230 and 648 °C with 25.00% weight loss (destruction of the skeleton structure of BBR), at 230 °C with 11.55% weight loss (decomposition of BBR), between 105 °C and 175 °C with 0.45% weight loss (melting of BBR), and at 105 °C with 14.21% weight loss (loss of moisture) (Fig. 9B). MSNs–BBR showed weight loss regions between 24 °C and 205 °C (moisture loss and melting of BBR) and 205 °C and 649 °C (loss of the silanol group) (Fig. 9C). A 5.50% and 0.95% increase in weight loss was recorded in MSNs–BBR at 105 °C and between 325 and 448, respectively, indicating BBR loading. The rate of decomposition of pure BBR is fast as compared to the MCM-41 and MSNs–BBR. This demonstrates that the integration of BBR in MCM-41 can increase its thermal stability.
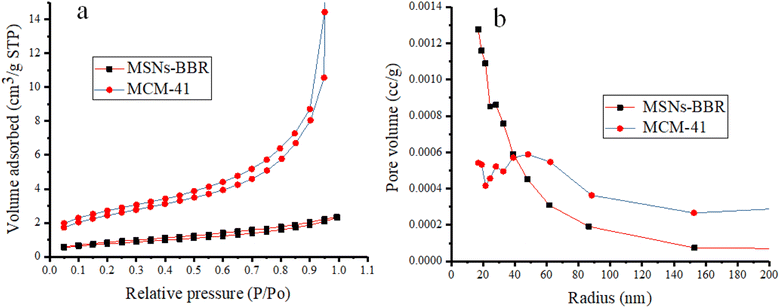
Nitrogen adsorption–desorption isotherms were measured to estimate the surface area and average pore diameter of MCM-41. This also helped in BBR loading confirmation and mesoporous structure characterization. MCM-41 samples displayed a type IV isotherm, which is a distinctive pattern of mesoporous materials according to the categorization of the IUPAC. This isotherm is characterized by a prominent capillary condensation step.50 The results demonstrated uniform mesoporous channels and narrow pore size distribution. The pore volume and surface area of MCM-41 were 0.945 cm3 g−1 and 49.780 m2 g−1, respectively. However, the pore volume and surface area of MSNs–BBR were 0.054 cm3 g−1 and 23.845 m2 g−1, respectively (Fig. 10). The Barrett–Joyner–Halenda (BJH) method confirmed an average pore radius of 19.103 Å and 17.040 Å, respectively for MCM-41 and MSNs–BBR. The results indicated that the BBR loading decreased these mesoporosity parameters. This reducing tendency is attributed to BBR loading on the MCM-41.51–53
3.2. In vitro release
The in vitro release profile of BBR from pure BBR solution and MSNs–BBR formulation was estimated using the membrane-dialysis technique at pH 4.0 and pH 7.4 to simulate the pH of brain hippocampus and CSF, respectively (Fig. 11). MSNs–BBR showed a prolonged BBR release profile in both media. The dissolution profile showed a two-stage release profile. An initial fast BBR release was followed by a slow release up to 72 h. Initial fast release was due to the dissolution of the surface drug. Complete BBR was released from pure solution within 5 h of dissolution study. However, BBR release from MSNs–BBR prolonged till 72 h under both acidic and alkaline conditions suggesting stabilization of the drug in the polymer matrix.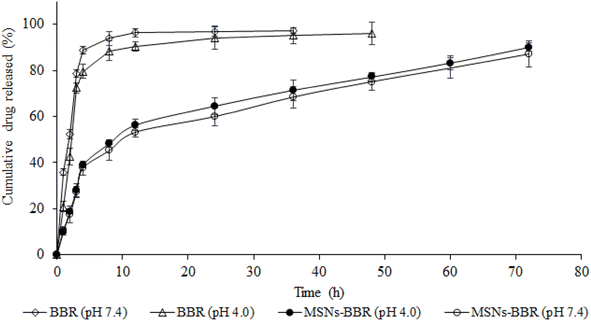 | ||
| Fig. 11 BBR release from its pure solution (empty diamonds and empty triangles) and MSNs–BBR (filled circles and empty circles) at pH 4.0 and pH 7.4 at 37 ± 0.5 °C (mean ± SD, n = 3). | ||
For kinetic estimation, dissolution data were split into two stages, i.e., (i) stage I (<8 h) and (ii) stage II (>8 h), and the best fit was selected based on the highest correlation coefficient (r2) (Table 2). The r2 value is a measure of how well the experimental in vitro drug release data fit the mathematical model, and higher r2 values indicate a better fit. The BBR release from MSNs–BBR followed zero-order kinetics in both stages (r2 values 0.9993, 0.9968 and 0.9979, 0.9977, respectively in both media). In Higuchi's model, the relationship between the cumulative amount of drug released and the square root of time (Q = k √t) is expected to be linear. Higuchi's plots of BBR loaded nanoparticles showed linearity (r2 values 0.9991, 0.9966 and 0.9978, 0.9976, respectively in APB (pH 4.0) and PBS (pH 7.4) for stage I and stage II). The Higuchi plots show that the experimental data points are very close to the expected linear relationship. This means that Fickian diffusion is mainly responsible for the controlled release of BBR from the nanoparticles. If the slope (n) value in Korsmeyer-Peppas' model lies between 0.43 and 0.85, the release profile follows a non-Fickian anomalous diffusion mechanism, and if the n value is >0.85, the release profile follows a swelling-controlled diffusion process. A super case II mode is followed if the n value is >1. Linearity of Korsmeyer-Peppas' plots confirmed BBR diffusion from MSNs–BBR (r2 0.9600 to 0.9682 with slope values 0.1692 to 0.1604) for <8 h, indicating a simple or quasi-diffusion-controlled mechanism of drug release (Table 2). In a simple or quasi-diffusion-controlled mechanism, the drug molecules move through the matrix or core of the delivery system from areas of higher concentration to areas of lower concentration, following Fick's laws of diffusion. For quasi-diffusion-controlled release, the slope of the release curve is expected to follow Fick's law of diffusion. In mathematical terms, for quasi-diffusion-controlled release:
| pH 4.0 | pH 7.4 | |||||||||
|---|---|---|---|---|---|---|---|---|---|---|
| Zero order | First order | Higuchi's model | Korsmeyer-Peppas’ model | Zero order | First order | Higuchi's model | Korsmeyer-Peppas' model | |||
| r 2 | r 2 | r 2 | r 2 | n | r 2 | r 2 | r 2 | r 2 | n | |
| Stage I (<8 h) | 0.9993 | 0.9872 | 0.9991 | 0.9600 | 0.1692 | 0.9979 | 0.9911 | 0.9978 | 0.9682 | 0.1604 |
| Stage II (>8 h) | 0.9968 | 0.9622 | 0.9966 | 0.9853 | 0.0396 | 0.9977 | 0.9691 | 0.9976 | 0.9880 | 0.0437 |
The significance of this mechanism lies in its ability to provide controlled, sustained, and predictable drug release, leading to improved therapeutic outcomes. A similar pattern was observed after 8 h (stage II) of the dissolution study (r2 0.9853–0.9880 with slope values between 0.0396 and 0.0437).
3.3. Analysis of diffusion of BBR molecules from the MCM-41 surfaces
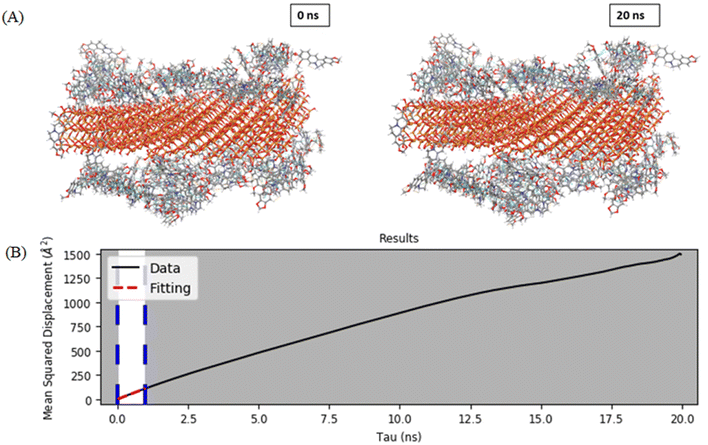
A flat silica system was generated using alpha quartz structure by extending on both sides to give a small structure-like representation of silica slab. The first adsorbed drug layer was considered after MD simulation, as during the loading only the first adsorbed drug layer gets retained as it is tightly bound to the MCM-41 surface, whereas the rest of the molecules may be washed out. To the first adsorbed layer, water and salts were added to mimic the media. The drug release behavior from the MSNs–BBR particle surface can be assessed by analyzing the diffusion coefficient of BBR molecules. Fig. 12A and B show the pictorial visualization of the initial and final frame at 20 ns of BBR release from the plain MCM-41. To assess BBR release from the two surfaces, we calculated the diffusion coefficient, which demonstrated a relatively slower diffusion of BBR molecules from the plain MCM-41 surface.24 The selection of a framework can exert a substantial influence on the loading and delivery of BBR. The impact of steric hindrance on the diffusion process of BBR molecules can explain the observed phenomenon.54,55 Steric hindrance of the payload due to limited pore and channel sizes is likely to be highest in MCM-41. The greatest sphere diameter for channel diffusion is 19.103 Å, which is the average pore radius. Additionally, the BBR molecule experiences a relatively tight fit with limited movement allowed within the channels. In phosphate buffer, BBR release is slower than in an acidic medium. This suggests that the intensity of BBR-framework interactions is pH-dependent, possibly because of pH affecting the framework's charge, the BBR molecule's charge, water molecules, or a combination of all three. The diffusion coefficient of BBR molecules from the plain MCM-41 surface was found to be 1.863 × 10⁻¹⁰ m2 s−1.3.4. Hemolytic toxicity
The percentage of hemolysis in each sample was compared to distilled water (standard for 100% hemolysis). The hemocompatibility experiment revealed no statistically significant hemolysis when blood cells were exposed to the MSNs–BBR, pure BBR, and MCM-41 suspension (Fig. S4 – ESI file†). The hemolysis percentages were found to be 4.98 ± 0.10%, 1.90 ± 0.18%, and 4.30 ± 0.21%, respectively. Hemolysis percentages below 5% suggest the safety of the substance for drug delivery.9,36,56 Based on these findings, it can be inferred that the developed system may become a potential candidate for drug delivery applications.3.5. Effect of BBR and MSNs–BBR on SH-SY-5Y cell proliferation
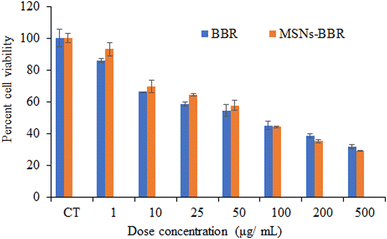
Cell viability assay was carried out to determine the cytotoxic effect of BBR and MSNs–BBR on SH-SY-5Y cells following 24 h of drug exposure. BBR and MSNs–BBR inhibited SH-SY-5Y cell proliferation in a dose-dependent manner. Cell viability decreased with an increase in BBR and MSNs–BBR concentrations. The cells exposed to 50 μg mL−1 of pure BBR and MSNs–BBR for 24 h showed reduced cell viability of ≈55.00% and 60.00%, respectively. This shows that BBR is more toxic than MSNs–BBR (Fig. 13).3.6. Effect of BBR and MSNs–BBR on morphological changes in SH-SY-5Y cells
Phase-contrast microscopic images revealed that the BBR treatment initiated morphological changes in cells compared to the control. An increase in apoptotic cells and a decrease in viable cells were recorded after treatment with BBR and MSNs–BBR (Fig. 14).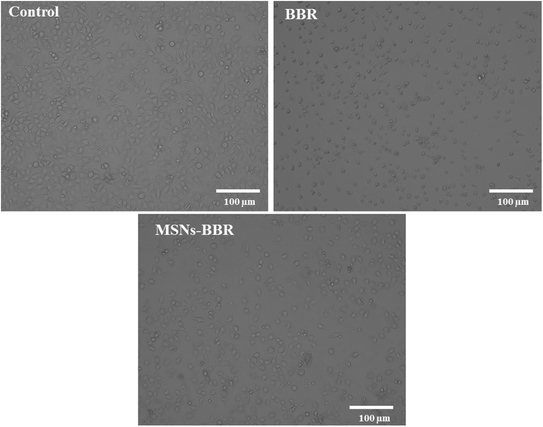 | ||
| Fig. 14 Phase contrast microscopy images at 10× magnification showing morphological appearance of the neuroblastoma cell line (SH-SY-5Y cells), 24 h post-treatment with BBR and MSNs–BBR. | ||
3.7. Effect of BBR and MSNs–BBR on nuclear changes in SH-SY-5Y cells
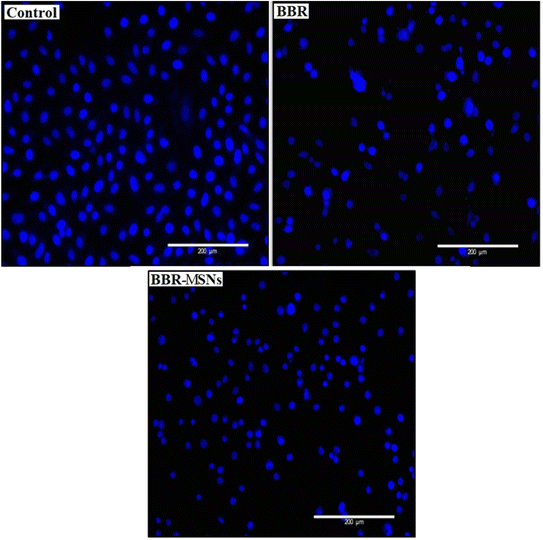
Nuclear staining was carried out to observe the nuclear changes after treatment with BBR and MSNs–BBR. Round or oval nuclei were observed in control. However, fragmented cell nuclei and nuclear apoptotic bodies were observed in the cases of BBR and MSNs–BBR treated cells (Fig. 15).3.8. Effect of BBR and MSNs–BBR on apoptosis in SH-SY-5Y cells
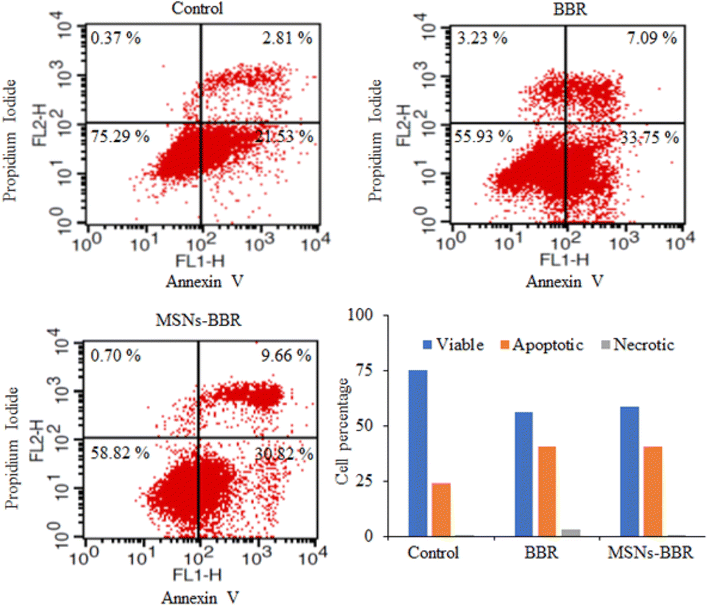
Flow cytometry was used to quantify the rate of viable, apoptotic, and necrotic cells. In control, the percentage of live and apoptotic cells was found to be 75.29% and 24.34%, respectively. BBR treatment reduced the percentage of live and apoptotic cells to 55.93% and 40.84%, respectively. MSNs–BBR increased the percentage of live cells from 55.93% to 58.82% and decreased the percentage of apoptotic cells from 40.84% to 40.48%. It indicated the potential of MSNs–BBR in preventing apoptotic processes and restoring cellular viability (Fig. 16).3.9. Effect of BBR and MSNs–BBR on mitochondrial membrane potential in SH-SY-5Y cells
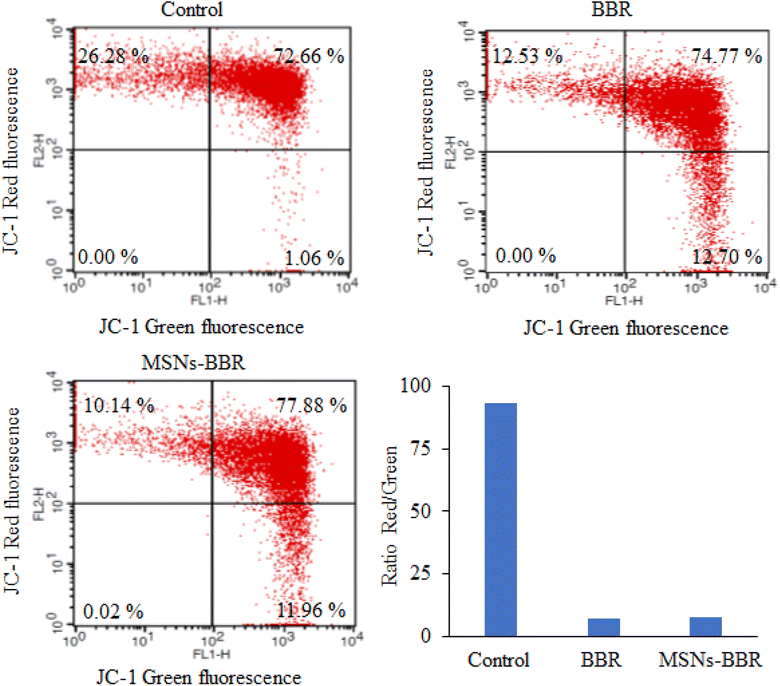
We investigated the impact of BBR and MSNs–BBR treatment on ΔΨ by assessing mitochondrial activity in treated and untreated cells using the fluorochrome JC-1, which accumulates in the mitochondria based on its membrane potential. When the membrane potential is low, the JC-1 monomer emits green fluorescence. Healthy mitochondria contain JC-1 in their aggregated form, resulting in red to orange fluorescence. The control cells displayed red fluorescence, while an enhancement in green fluorescence intensity was noted following treatment with BBR and MSNs–BBR. BBR causes depolarization of the ΔΨ, indicated by increased JC-1 green fluorescence compared to control cells. In contrast, MSNs–BBR reduced depolarization of the ΔΨ, represented by higher JC-1 red fluorescence compared to BBR treated cells. The data indicate that MSNs–BBR reduce the depolarization of mitochondria more effectively than BBR, hence preventing apoptosis and restoring the ΔΨ (Fig. 17).4 Conclusions
Nanoparticles had a high BBR loading and entrapment efficiency despite their small size. Prolonged BBR release following the diffusion process was confirmed by molecular dynamics simulation study. TGA analysis confirmed BBR loading. Increased apoptotic cells and decreased viable cells were noticed in phase-contrast microscopic images. Fragmented cell nuclei and nuclear apoptotic bodies were recorded in SH-SY-5Y cells stained with DAPI. Flow cytometric analysis of formulation treated SH-SY-5Y cells showed restoration of cellular viability, membrane potential and improvement of neuronal health.Author contributions
Anurag Kumar Singh: methodology, data curation, validation, formal analysis, investigation, writing – original draft, visualization. Snigdha Singh: methodology, data curation, validation, formal analysis, investigation, writing – original draft, visualization. Tarun Minocha: methodology, software, investigation, writing – original draft Sanjeev Kumar Yadav: validation, writing – review & editing, visualization. Reema Narayan: conceptualization, software, writing – review & editing, visualization. Usha Yogendra Nayak: conceptualization, software, validation, writing – review & editing, visualization. Rajendra Awasthi: methodology, validation, investigation, writing – original draft, writing – review & editing, supervision Santosh Kumar Singh: conceptualization, methodology, validation, writing – review & editing, supervision.Conflicts of interest
There are no conflicts to declare.Acknowledgements
The authors are thankful to the Institute of Eminence (IOE), Banaras Hindu University, Center of Experimental Medicine and Surgery, Institute of Medical Sciences, Banaras Hindu University, Varanasi, Central Discovery Centre (CDC), Banaras Hindu University, Varanasi and Central Instrument Facility Center, Indian Institute of Technology, Banaras Hindu University, Varanasi for providing research facilities.References
- D. W. Coon and A. Gómez-Morales, Modifiable Risk Factors for Brain Health and Dementia and Opportunities for Intervention: A Brief Review, Clin. Gerontol., 2023, 46(2), 143–154 CrossRef PubMed.
- V. L. Feigin, E. Nichols, T. Alam, M. S. Bannick, E. Beghi, N. Blake, W. J. Culpepper, E. R. Dorsey, A. Elbaz, R. G. Ellenbogen and J. L. Fisher, Global, regional, and national burden of neurological disorders, 1990–2016: a systematic analysis for the Global Burden of Disease Study 2016, Lancet Neurol., 2019, 18(5), 459–480 CrossRef PubMed.
- A. K. Singh, S. S. Singh, A. S. Rathore, S. P. Singh, G. Mishra, R. Awasthi, S. K. Mishra, V. Gautam and S. K. Singh, Lipid-coated MCM-41 mesoporous silica nanoparticles loaded with berberine improved inhibition of acetylcholine esterase and amyloid formation, ACS Biomater. Sci. Eng., 2021, 7(8), 3737–3753 CrossRef CAS PubMed.
- S. Mendiratta, M. Hussein, H. A. Nasser and A. A. Ali, Multidisciplinary role of mesoporous silica nanoparticles in brain regeneration and cancers: From crossing the blood–brain barrier to treatment, Part. Part. Syst. Charact., 2019, 36(9), 1900195 CrossRef CAS.
- G. C. Terstappen, A. H. Meyer, R. D. Bell and W. Zhang, Strategies for delivering therapeutics across the blood–brain barrier, Nat. Rev. Drug Discovery, 2021, 20(5), 362–383 CrossRef CAS PubMed.
- M. J. Mitchell, M. M. Billingsley, R. M. Haley, M. E. Wechsler, N. A. Peppas and R. Langer, Engineering precision nanoparticles for drug delivery, Nat. Rev. Drug Discovery, 2021, 20(2), 101–124 CrossRef CAS PubMed.
- Y. Wang, Q. Zhao, N. Han, L. Bai, J. Li, J. Liu, E. Che, L. Hu, Q. Zhang, T. Jiang and S. Wang, Mesoporous silica nanoparticles in drug delivery and biomedical applications, Nanomed. Nanotechnol. Biol. Med., 2015, 11(2), 313–327 CrossRef CAS PubMed.
- X. Jiang, X. Tang, L. Tang, B. Zhang and H. Mao, Synthesis and formation mechanism of amorphous silica particles via sol–gel process with tetraethylorthosilicate, Ceram. Int., 2019, 45(6), 7673–7680 CrossRef CAS.
- A. E. LaBauve, T. E. Rinker, A. Noureddine, R. E. Serda, J. Y. Howe, M. B. Sherman, A. Rasley, C. J. Brinker, D. Y. Sasaki and O. A. Negrete, Lipid-coated mesoporous silica nanoparticles for the delivery of the ML336 antiviral to inhibit encephalitic alphavirus infection, Sci. Rep., 2018, 8(1), 13990 CrossRef PubMed.
- S. P. Fortis, A. Batrinou, H. T. Georgatzakou, I. Tsamesidis, G. Alvanidis, E. G. Papageorgiou, K. Stamoulis, D. Gkiliopoulos, G. K. Pouroutzidou, A. Theocharidou and E. Kontonasaki, Effect of silica-based mesoporous nanomaterials on human blood cells, Chem.-Biol. Interact., 2024, 387, 110784 CrossRef CAS PubMed.
- Y. Feng, Y. Cao, Z. Qu, T. I. Janjua and A. Popat, Virus-like silica nanoparticles improve permeability of macromolecules across the blood–brain barrier in vitro, Pharmaceutics, 2023, 15(9), 2239 CrossRef CAS PubMed.
- G. Mishra, R. Awasthi, A. K. Singh, S. Singh, S. K. Mishra, S. K. Singh and M. K. Nandi, Intranasally Co-administered Berberine and Curcumin Loaded in Transfersomal Vesicles Improved Inhibition of Amyloid Formation and BACE-1, ACS Omega, 2022, 7(47), 43290–43305 CrossRef CAS PubMed.
- Y. T. Liu, H. P. Hao, H. G. Xie, L. Lai, Q. Wang, C. X. Liu and G. J. Wang, Extensive intestinal first-pass elimination and predominant hepatic distribution of berberine explain its low plasma levels in rats, Drug Metab. Dispos., 2010, 38(10), 1779–1784 CrossRef CAS PubMed.
- W. Chen, Y. Q. Miao, D. J. Fan, S. S. Yang, X. Lin, L. K. Meng and X. Tang, Bioavailability study of berberine and the enhancing effects of TPGS on intestinal absorption in rats, AAPS PharmSciTech, 2011, 12, 705–711 CrossRef CAS PubMed.
- A. T. Nies, E. Herrmann, M. Brom and D. Keppler, Vectorial transport of the plant alkaloid berberine by double-transfected cells expressing the human organic cation transporter 1 (OCT1, SLC22A1) and the efflux pump MDR1 P-glycoprotein (ABCB1), Naunyn-Schmiedeberg's Arch. Pharmacol., 2008, 376, 449–461 CrossRef CAS PubMed.
- D. S. Kohane and R. Langer, Biocompatibility and drug delivery systems, Chem. Sci., 2010, 1(4), 441–446 RSC.
- W. Stöber, A. Fink and E. Bohn, Controlled growth of monodisperse silica spheres in the micron size range, J. Colloid Interface Sci., 1968, 26(1), 62–69 CrossRef.
- Y. Yang, W. Song, A. Wang, P. Zhu, J. Fei and J. Li, Lipid coated mesoporous silica nanoparticles as photosensitive drug carriers, Phys. Chem. Chem. Phys., 2010, 12(17), 4418–4422 RSC.
- Y. Shi, A. Wan, Y. Shi, Y. Zhang and Y. Chen, Experimental and mathematical studies on the drug release properties of aspirin loaded chitosan nanoparticles, BioMed Res. Int., 2014, 2014, 613619 Search PubMed.
- S. Zhang, M. Perez-Page, K. Guan, E. Yu, J. Tringe, R. H. Castro, R. Faller and P. Stroeve, Response to extreme temperatures of mesoporous silica MCM-41: porous structure transformation simulation and modification of gas adsorption properties, Langmuir, 2016, 32(44), 11422–11431 CrossRef CAS PubMed.
- A. Olejnik and J. Goscianska, On the importance of physicochemical parameters of copper and aminosilane functionalized mesoporous silica for hydroxychloroquine release, Mater. Sci. Eng. C, 2021, 130, 112438 CrossRef CAS PubMed.
- H. Ohkawa, N. Ohishi and K. Yagi, Assay for lipid peroxides in animal tissues by thiobarbituric acid reaction, Anal. Biochem., 1979, 95(2), 351–358 CrossRef CAS PubMed.
- V. R. Malipeddi, K. Dua and R. Awasthi, Development and characterization of solid dispersion-microsphere controlled release system for poorly water-soluble drug, Drug Delivery Transl. Res., 2016, 6, 540–550 CrossRef CAS PubMed.
- R. Narayan, S. Gadag, S. Garg and U. Y. Nayak, Understanding the effect of functionalization on loading capacity and release of drug from mesoporous silica nanoparticles: a computationally driven study, ACS Omega, 2022, 7(10), 8229–8245 CrossRef CAS PubMed.
- A. K. Singh, A. Gothwal, S. Rani, M. Rana, A. K. Sharma, A. K. Yadav and U. Gupta, Dendrimer donepezil conjugates for improved brain delivery and better in vivo pharmacokinetics, ACS Omega, 2019, 4(3), 4519–4529 CrossRef CAS.
- A. K. Singh, S. K. Mishra, G. Mishra, A. Maurya, R. Awasthi, M. K. Yadav, N. Atri, P. K. Pandey and S. K. Singh, Inorganic clay nanocomposite system for improved cholinesterase inhibition and brain pharmacokinetics of donepezil, Drug Dev. Ind. Pharm., 2020, 46(1), 8–19 CrossRef CAS PubMed.
- T. Minocha, M. Das, V. Rai, S. S. Verma, N. Awasthee, S. C. Gupta, C. Haldar and S. K. Yadav, Melatonin induces apoptosis and cell cycle arrest in cervical cancer cells via inhibition of NF-κB pathway, Inflammopharmacol., 2022, 30, 1411–1429 CrossRef CAS PubMed.
- D. Moutinho, S. Veiga and J. R. Requena, Human VGF-derived antidepressant neuropeptide TLQP62 promotes SH-SY5Y neurite outgrowth, J. Mol. Neurosci., 2020, 70, 1293–1302 CrossRef CAS PubMed.
- G. Yordanov, R. Skrobanska and M. Petkova, Poly (butyl cyanoacrylate) nanoparticles stabilised with poloxamer 188: particle size control and cytotoxic effects in cervical carcinoma (HeLa) cells, Chem. Pap., 2016, 70(3), 365–374 CAS.
- V. Rai, S. K. Aggarwal, S. S. Verma, N. Awasthee, A. Dhasmana, S. Aggarwal, S. N. Das, M. S. Nair, S. Yadav and S. C. Gupta, Epoxyazadiradione exhibit activities in head and neck squamous cell carcinoma by targeting multiple pathways, Apoptosis, 2020, 25, 763–782 CrossRef PubMed.
- S. S. Verma, V. Rai, N. Awasthee, A. Dhasmana, D. S. Rajalaksmi, M. S. Nair and S. C. Gupta, Isodeoxyelephantopin, a sesquiterpene lactone induces ROS generation, suppresses NF-κB activation, modulates LncRNA expression and exhibit activities against breast cancer, Sci. Rep., 2019, 9(1), 17980 CrossRef PubMed.
- H. Refai, D. Hassan and R. Abdelmonem, Development and characterization of polymer-coated liposomes for vaginal delivery of sildenafil citrate, Drug Delivery, 2017, 24(1), 278–288 CrossRef CAS PubMed.
- N. Raval, R. Maheshwari, D. Kalyane, S. R. Youngren-Ortiz, M. B. Chougule and R. K. Tekade, Importance of physicochemical characterization of nanoparticles in pharmaceutical product development, In.Basic fundamentals of drug delivery, Academic Press, 2019, vol. 1, pp. 369–400 Search PubMed.
- S. Saroj and S. J. Rajput, Etoposide encapsulated functionalized mesoporous silica nanoparticles: Synthesis, characterization and effect of functionalization on dissolution kinetics in simulated and biorelevant media, J. Drug Delivery Sci. Technol., 2018, 44, 27–40 CrossRef CAS.
- T. Govender, S. Stolnik, M. C. Garnett, L. Illum and S. S. Davis, PLGA nanoparticles prepared by nanoprecipitation: drug loading and release studies of a water soluble drug, J. Controlled Release, 1999, 57(2), 171–185 CrossRef CAS PubMed.
- P. K. Pandey, A. K. Sharma, S. Rani, G. Mishra, G. Kandasamy, A. K. Patra, M. Rana, A. K. Sharma, A. K. Yadav and U. Gupta, MCM-41 nanoparticles for brain delivery: better choline-esterase and amyloid formation inhibition with improved kinetics, ACS Biomater. Sci. Eng., 2018, 4(8), 2860–2869 CrossRef CAS PubMed.
- Z. Li, Y. Zhang, K. Zhang, Z. Wu and N. Feng, Biotinylated-lipid bilayer coated mesoporous silica nanoparticles for improving the bioavailability and anti-leukaemia activity of Tanshinone IIA, Artif. Cells, Nanomed., Biotechnol., 2018, 46(1), 578–587 CrossRef CAS PubMed.
- N. Ž. Knežević and J. O. Durand, Targeted treatment of cancer with nanotherapeutics based on mesoporous silica nanoparticles, ChemPlusChem, 2015, 80(1), 26–36 CrossRef.
- I. M. Joni, R. Balgis, T. Ogi, T. Iwaki and K. Okuyama, Surface functionalization for dispersing and stabilizing hexagonal boron nitride nanoparticle by bead milling, Colloids Surf., A, 2011, 388(1–3), 49–58 CrossRef CAS.
- P. R. Lockman, J. M. Koziara, R. J. Mumper and D. D. Allen, Nanoparticle surface charges alter blood–brain barrier integrity and permeability, J. Drug Targeting, 2004, 12(9–10), 635–641 CrossRef CAS PubMed.
- P. Decuzzi, B. Godin, T. Tanaka, S. Y. Lee, C. Chiappini, X. Liu and M. J. Ferrari, Size and shape effects in the biodistribution of intravascularly injected particles, J. Controlled Release, 2010, 141(3), 320–327 CrossRef CAS PubMed.
- J. Kreuter, T. Hekmatara, S. Dreis, T. Vogel, S. Gelperina and K. Langer, Covalent attachment of apolipoprotein AI and apolipoprotein B-100 to albumin nanoparticles enables drug transport into the brain, J. Controlled Release, 2007, 118(1), 54–58 CrossRef CAS PubMed.
- N. Alharbi, S. Teerakanok, J. D. Satterthwaite, R. Giordano and N. Silikas, Quantitative nano-mechanical mapping AFM-based method for elastic modulus and surface roughness measurements of model polymer infiltrated ceramics, Dent. Mater., 2022, 38(6), 935–945 CrossRef CAS PubMed.
- U. Maver, T. Velnar, M. Gaberšček, O. Planinšek and M. Finšgar, Recent progressive use of atomic force microscopy in biomedical applications, TrAC, Trends Anal. Chem., 2016, 80, 96–111 CrossRef CAS.
- R. Solanki, K. Patel and S. Patel, Bovine serum albumin nanoparticles for the efficient delivery of berberine: Preparation, characterization and in vitro biological studies, Colloids Surf., A, 2021, 608, 125501 CrossRef CAS.
- S. K. Battu, M. A. Repka, S. Maddineni, A. G. Chittiboyina, M. A. Avery and S. Majumdar, Physicochemical characterization of berberine chloride: a perspective in the development of a solution dosage form for oral delivery, AAPS PharmSciTech, 2010, 11, 1466–1475 CrossRef CAS PubMed.
- S. A. Ghodke, U. Maheshwari, S. Gupta, S. H. Sonawane and B. A. Bhanvase, Nanomaterials for adsorption of pollutants and heavy metals: Introduction, mechanism, and challenges, In.Handbook of Nanomaterials for Wastewater Treatment, Elsevier, 2021, pp. 343–366 Search PubMed.
- S. Shen, J. Chen, R. T. Koodali, Y. Hu, Q. Xiao, J. Zhou, X. Wang and L. Guo, Activation of MCM-41 mesoporous silica by transition-metal incorporation for photocatalytic hydrogen production, Appl. Catal., B, 2014, 150, 138–146 CrossRef.
- F. Zhang, M. Zhang, X. Zheng, S. Tao, Z. Zhang, M. Sun, Y. Song, J. Zhang, D. Shao, K. He and J. Li, Berberine-based carbon dots for selective and safe cancer theranostics, RSC Adv., 2018, 8(3), 1168–1173 RSC.
- M. S. Salam, M. A. Betiha, S. A. Shaban, A. M. Elsabagh and R. M. Abd El-Aal, Synthesis and characterization of MCM-41-supported nano zirconia catalysts, Egypt. J. Pet., 2015, 24(1), 49–57 CrossRef.
- J. Yue, Z. Wang, D. Shao, Z. Chang, R. Hu, L. Li, S. Z. Luo and W. F. Dong, Cancer cell membrane-modified biodegradable mesoporous silica nanocarriers for berberine therapy of liver cancer, RSC Adv., 2018, 8(70), 40288–40297 RSC.
- G. Kuang, Q. Zhang, S. He and Y. Liu, Curcumin-loaded PEGylated mesoporous silica nanoparticles for effective photodynamic therapy, RSC Adv., 2020, 10(41), 24624–24630 RSC.
- L. Usgodaarachchi, C. Thambiliyagodage, R. Wijesekera and M. G. Bakker, Synthesis of mesoporous silica nanoparticles derived from rice husk and surface-controlled amine functionalization for efficient adsorption of methylene blue from aqueous solution, Curr. Res. Green Sustainable Chem., 2021, 4, 100116 CrossRef CAS.
- A. J. Wise, J. S. Sefy, E. Barbu, A. J. O'Malley, S. M. van der Merwe and P. A. Cox, Zero-order and prolonged release of atenolol from microporous FAU and BEA zeolites, and mesoporous MCM-41: Experimental and theoretical investigations, J. Controlled Release, 2020, 327, 140–149 CrossRef CAS PubMed.
- A. Datt, I. El-Maazawi and S. C. Larsen, Aspirin loading and release from MCM-41 functionalized with aminopropyl groups via co-condensation or postsynthesis modification methods, J. Phys. Chem. C, 2012, 116(34), 18358–18366 CrossRef CAS.
- K. Amin and R. M. Dannenfelser, In vitro hemolysis: guidance for the pharmaceutical scientist, J. Pharm. Sci., 2006, 95(6), 1173–1176 CrossRef CAS PubMed.
Footnotes |
| † Electronic supplementary information (ESI) available. See DOI: https://doi.org/10.1039/d3na01142a |
| ‡ These authors contributed equally. |
| This journal is © The Royal Society of Chemistry 2024 |

