
 Open Access Article
 This Open Access Article is licensed under a
 Creative Commons Attribution 3.0 Unported Licence
Augmenting the performance of thermally deoxygenated graphite oxide supercapacitor electrodes using 6 M KOH electrolyte with K3Fe(CN)6 redox additive†
Arsha
M S
 and
Biju
V
*
and
Biju
V
*
Department of Physics, University of Kerala, Kariavattom, Thiruvananthapuram, Kerala Pin – 695 581, India. E-mail: bijunano@gmail.com
First published on 26th February 2024
Abstract
This study focuses on enhancing the performance of thermally deoxygenated graphite oxide (TDGO) supercapacitor electrodes by incorporating a redox additive viz., 0.03 M K3Fe(CN)6 in 6 M KOH. Characterization of the prepared TDGO was conducted through XRD, Raman, XPS, FESEM and BET surface area analysis, revealing incomplete deoxygenation and the presence of oxygen functional groups. TDGO exhibits a maximum significant surface area of 288.3 m2 g−1 with an average pore diameter of 2.4 nm. The ID/IG ratio of 0.98 suggests the prevalence of structural defects dominating the sp2 graphitic structure. FESEM images reveal exfoliated irregular layers in TDGO. In a three-electrode configuration, the optimized system achieves an areal specific capacitance (Csp) of 817 F cm−2 at 1 A g−1, a 2.5-fold increase compared to 6 M KOH alone. The [Fe(CN)6]3−/[Fe(CN)6]4− redox couple in the electrolyte alters the charge storage mechanism from surface-controlled to diffusion-controlled pseudocapacitance. A symmetric TDGO300 supercapacitor in the KOH/K3Fe(CN)6 redox electrolyte system exhibits a Csp of 414.6 F cm−2, delivering an energy density of 17.4 W h kg−1 at a power density of 235 W kg−1. Notably, the TDGO300 supercapacitor retains 97.4% of its initial capacitance after 2000 continuous charge–discharge cycles. This work establishes a straightforward strategy to significantly improve the capacitive performance of TDGO supercapacitors by leveraging redox additives, showcasing their potential for advanced energy storage applications.
1 Introduction
Reduced graphite oxide (rGO) is counted among the potential electrode materials for supercapacitor (SC) applications and is valued for its exceptional safety, sustainability, and customizable electrical properties.1 Several types of rGO-based active materials with suitable surface modification and their composites with metal oxides, metal hydroxides, conducting polymers etc., have been used to improve the energy storage performance. The charge storage in rGO electrodes is predominantly surface controlled in aqueous electrolytes via electric double layer capacitor (EDLC) formation, resulting from electrostatic accumulation of electrolyte ions. Low specific capacitance (Csp) of rGO active materials in conventional aqueous electrolytes is primarily attributed to the prevalence of this surface controlled charge storage. On the other hand, contributions from surface functional groups can result in pseudocapacitance in rGO active materials through the quick faradaic redox reactions.2 Pseudocapacitance, rooted in redox processes within the electrode material/at the electrode–electrolyte interface offers a pathway to augment the specific capacitance of rGO supercapacitors instead of relying on composites. Inspired by the pseudocapacitive electrodes with rich redox reactions near the surface of the electrodes that can provide additional capacitance, we designed a thermally deoxygenated rGO (TDGO) supercapacitor in combination with a redox additive aqueous electrolyte. The purpose of the current study is to appraise two fundamental issues inherent in rGO supercapacitors viz., low specific capacitance (Csp) and low energy density (E).The strategy of employing redox additives to improve the electrochemical performance of rGO has been widely explored.3–5 In most of these studies, composites with rGO were prepared, followed by the optimization of a redox additive electrolyte to enhance the overall performance. Ahmed Galal et al. investigated the impact of a redox electrolyte (0.08 M KI − 1 M NaNO3) on the specific capacitance of SrRuO3−reduced graphene oxide nanocomposites.5 The addition of KI to the NaNO3 solution led to a remarkable 21.6-fold increase in specific capacitance. Adam Moyseowicz et al. demonstrated the superior electrochemical performance of the polypyrrole/reduced graphene oxide (PPy/rGO-HT) composite electrode in an aqueous electrolyte containing hydroquinone redox-active species.3 Sankar et al., conducted a study on the electrochemical performance of hydrothermally reduced graphene oxide (rGO) in a KOH + KI redox additive electrolyte, resulting in superior specific capacitance and energy density.4 The optimized 1 M KOH + 0.05 M KI electrolyte yielded a specific capacitance of 500 F g−1 with an energy density of 44 W h kg−1 at 0.83 A g−1. This stands as the sole study attempting to modify the electrochemical properties of rGO using a redox additive. However, no report has yet appeared in the literature where redox additives were added to electrolytes to boost the energy storage ability of thermally deoxygenated graphene oxide (TDGO) electrodes.
Different reduction techniques have been employed to obtain reduced graphite oxide (rGO) from graphite oxide (GO), including chemical reduction, photo-assisted methods, microwave routes, thermal deoxygenation etc.6 Among the reduction techniques, chemical reduction stands out as the widely used method, primarily due to the quality of the end product. Chemical reduction of GO can be effectively done by using a wide range of reducing agents such as hydrazine,7 alcohol,8 sodium/potassium hydroxide,9 sodium borohydride,10 hydriodic acid,11 acetic acid,12 and iron/aluminum powder.13 However, envisioning the use of chemical reduction at a large-scale poses challenges because the commonly used reductants are unsuitable, given their safety concerns and high cost. For example, the instability and carcinogenic nature of hydrazine, a widely used reductant, and the reactivity and harmful effects of sodium borohydride limit their practicality.14 Moreover, the exfoliation process using organic solvents is often hindered by the difficulty of eliminating the solvent due to their high boiling points.15 In chemical reductions, the reduction level of rGO cannot be easily controlled and the conductivity of rGO is relatively low when compared with graphite or graphene.13 In this context, the direct thermal treatment/deoxygenation of graphite oxide (GO) is a highly desirable approach for synthesizing large scale, porous reduced graphene oxides (rGOs) for energy storage applications. The process relies on the energetic thermal exfoliation of GO's lamellar structure during heating. We prefer to use the term “thermal deoxygenation” rather than the commonly used “thermal reduction”, because the latter requires the use of a reducing agent, a chemical compound that readily donates electrons.16 One significant advantage of thermal deoxygenation is its ability to simultaneously achieve both exfoliation and deoxygenation without introducing impurities from heteroatoms.
The present work reports a simple, straightforward method to enhance the Csp of TDGO supercapacitors. We designed a supercapacitor system with a TDGO electrode and a redox-electrolyte, 6 M KOH + 0.03 M potassium ferricyanide (K3Fe(CN)6), which combines two kinds of charge storage mechanism, viz., surface controlled, and diffusion controlled pseudocapacitance. The [Fe(CN)6]3−/[Fe(CN)6]4− redox couple present in the redox additive electrolyte system entirely alters the charge storage mechanism of the supercapacitor. The charge storage became controlled by diffusion, whereas previously, it was limited to the surface in the 6 M KOH electrolyte. In the redox additive electrolyte, we obtained capacitance values of 817 F cm−2 in the redox-electrolyte and 316 F cm−2 in the 6 M KOH electrolyte. This significant improvement in capacitance is attributed to the additional redox reactions near the electrode interface via the constituent ions of the KOH/K3Fe(CN)6 redox electrolyte.
2 Materials and methods
2.1 Materials
In this study, analytical grade chemicals were used without further purification. The chemicals employed included graphite powder (<50 μm, extra pure 99.0% carbon basis, Merck, Germany), sulfuric acid (H2SO4, 95.0–98.0%, Sigma Aldrich, USA), potassium permanganate (KMnO4, ≥99.0% Sigma Aldrich, USA), hydrogen peroxide 30% (H2O2, 29.0–32.0%, Sigma Aldrich, USA), hydrochloric acid (HCl, 36.5–38.0%, Sigma Aldrich, USA), potassium hydroxide pellets (KOH, ≥ 84%, Sigma Aldrich, USA), polyvinylidene fluoride (PVDF, Alpha Aesar, CAS:9002-84-0), and N-methyl-2-pyrrolidone (NMP, TCI, Japan, M3055). Deionized water and ethanol were obtained from Sigma Aldrich USA, while nickel (Ni) foam (1.6 mm thickness, 95% porosity, 20 pores cm−1) was purchased from Goodfellow Cambridge Limited, England.2.2 Experimental
Graphite oxide (GO) was prepared by a modified Hummers’ method based on Chen et al.‘s previous report.17 Details of the synthesis of GO are included in the ESI.† The resulting GO powder was subjected to thermal deoxygenation in a preheated muffle furnace at different temperatures, viz., 100, 200, 300 and 400 °C. The selection of the deoxygenation temperature was based on the thermal decomposition profile of graphite oxide. The TGA curve of GO under a nitrogen atmosphere is presented in Fig. S1 (ESI†). At each temperature, GO was maintained for a period of 2 hours each, followed by cooling to room temperature. The resulting samples were named TDGO100, TDGO200, TDO300, and TDGO400, respectively.2.3 Physicochemical characterization
Thermogravimetric analysis of GO was conducted using a PerkinElmer STA 8000 TG-DTA/DSC analyzer under a N2 atmosphere. X-ray diffraction (XRD) patterns of the samples were recorded using a Bruker D8 Advance diffractometer equipped with Cu Kα (λ = 1.5406 Å) radiation. Raman spectral measurements were carried out using a HORIBA LabRAM HR Evolution spectrometer with a 532 nm DPSS laser as the excitation source. Field emission scanning electron microscopy (FESEM) images were recorded using a Nova Nano SEM 450 Field emission scanning electron microscope and JEOL JSM -7600 FEG-SEM instrument. The specific surface area and porosity of the samples were determined via the Brunauer–Emmett–Teller (BET) method using a NOVA TOUCH Quantachrome instrument. Prior to measurement, the samples were degasified at 80 °C for 10 hours. The surface elemental compositions of the samples were obtained using X-ray photoelectron spectroscopy (XPS) using an ESCALAB XI + A1528 instrument equipped with an Al Kα (1486.6 eV) source.2.4 Preparation of TDGO electrodes
For the preparation of working electrodes, firstly, PVDF binder was dissolved in NMP via ultrasonication. Then, acetylene black (conductive additive) and the TDGO active material were added to the binder solution step by step and thoroughly mixed. The mass ratio of TDGO active material, acetylene black, and PVDF was maintained as 80![[thin space (1/6-em)]](https://www.rsc.org/images/entities/char_2009.gif) :15:5, respectively. This resulted in a uniform slurry, which was used to coat Ni foam pieces for electrochemical measurements. Prior to coating, Ni foam was cleaned using 6 M HCl to remove the oxide layer to obtain a clear surface and it was then washed successively with acetone, ethanol, and deionised water for 15 minutes each by ultrasonication. The electrodes were vacuum dried overnight at 80 °C.
:15:5, respectively. This resulted in a uniform slurry, which was used to coat Ni foam pieces for electrochemical measurements. Prior to coating, Ni foam was cleaned using 6 M HCl to remove the oxide layer to obtain a clear surface and it was then washed successively with acetone, ethanol, and deionised water for 15 minutes each by ultrasonication. The electrodes were vacuum dried overnight at 80 °C.
2.5 Cell assembly and electrochemical characterization
For three electrode measurements, the working electrode, Pt wire counter electrode and Ag/AgCl reference electrode were assembled in a microcell kit (ESI,† Fig. S2(a)). All electrodes are submerged in electrolyte solution to be at a level with each other. For two-electrode measurement, a Swagelok cell assembly was employed. In the Swagelok cell assembly, two Ni foam electrode discs were sandwiched using a filter paper separator, which was soaked with a few drops of the electrolyte (ESI,† Fig. S2(b)). For both cases, electrochemical characterization was conducted through cyclic voltammetry (CV), galvanostatic charge–discharge studies (GCD), electrochemical impedance spectroscopy (EIS), and cycling stability studies. All these electrochemical measurements were performed using an IVIUM VERTEX electrochemical workstation.3 Results and discussion
Fig. 1 depicts the XRD pattern of TDGO together with those of graphite (GR) and graphite oxide (GO). For GR, a strong basal reflection (002) peak is observed at 2θ = 26.3°, with an interlayer distance of d002 = 0.34 nm.18 This intense crystalline peak is a characteristic of hexagonal graphite planes. After oxidation, this peak shifts to a lower angle at 2θ = 10.9°. This shift is a result of reflection from the (001) planes, with a d-spacing of 0.81 nm, indicating complete oxidation.19 An increase in interlayer spacing is attributed to the intercalation of water molecules and the presence of oxygen functionalities such as epoxide (C–O–C) and hydroxyl (O–H) groups, which populate on the basal plane of the carbon network.20 Notably, the sharp and distinct (001) peak in GO is attributed to the preserved and ordered stacking along the c-axis.21 After thermal deoxygenation, the intensity of this peak in GO decreases and a broad, non-symmetric peak appears at around 15–37° instead of the sharp (002) diffraction peak. In the case of TDGO100, a weak (001) peak can still be observed at 2θ = 10.9°, corresponding to d001 = 0.81 nm, denoting the coexistence of TDGO and GO indicating incomplete deoxygenation of GO,20 while for other samples the (001) peak is absent indicating a higher degree of deoxygenation. In the XRD patterns of all TDGO samples, the peak position of the (002) peak remained consistent, while the shape of the peak varied with processing temperature. The broad peak suggests the breakdown of long range order of (002) reflection planes compared to GR as well as the presence of functional groups within the hexagonal carbon network.22 The deconvolution of the (002) peak in the TDGO samples provides further insights into the number of deoxygenated layers as shown in Fig. S3(a) to (d) (ESI†). The results of deconvolution of the (002) peak are given in Table S1(ESI†). The observed batches with a d-spacing range from 0.22 to 0.46 nm confirmed the presence of varied layer spacing within the samples.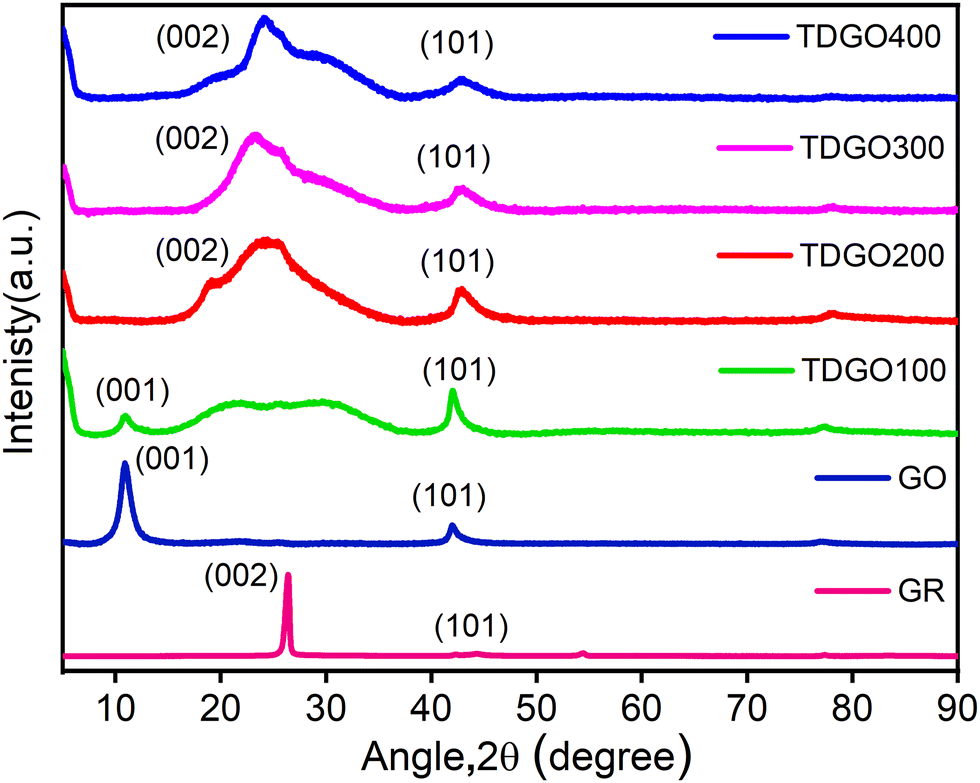 | ||
| Fig. 1 XRD patterns of graphite (GR), graphite oxide (GO), and TDGO100, TDGO200, TDGO300 and TDGO400 active materials. | ||
Fig. 2 shows the Raman spectra of the TDGO samples alongside the spectra of GR and GO. In both the GO and TDGO samples, D and G bands are present as in the case of GR, although with variations in position and intensity. The spectrum of graphite displays a strong band at 1575 cm−1 (G band) and a weak band at 1344 cm−1 (D band), which is typical in polycrystalline samples.23 Additionally, GR exhibits a second harmonic of the D band, the G′ band, around 2700 cm−1. In the Raman spectrum of GO, the D band is at 1355 cm−1, and the G band is at 1594 cm−1, with comparable intensity, resulting in an ID/IG ratio of 0.84. For TDGO samples, the positions of the G and D bands appear at the same positions as in GO with variations in the ID/IG ratio. The ID/IG ratios are 1.03, 0.87, 0.98 and 0.96 for TDGO100, TDGO200, TDGO300, and TDGO400, respectively. The ID/IG ratio is inversely proportional to the in plane crystalline size.21 Notably, in the spectra of TDGO300 and TDGO400, the intensity of the D band is almost equal to that of the G band, indicating a prevalence of structural defects dominating the sp2 graphitic structure. These defects may involve misarranged C atoms or missing atoms.16 In contrast, for TDGO200 the intensity of the G band is higher, suggesting a lower degree of structural distortion.
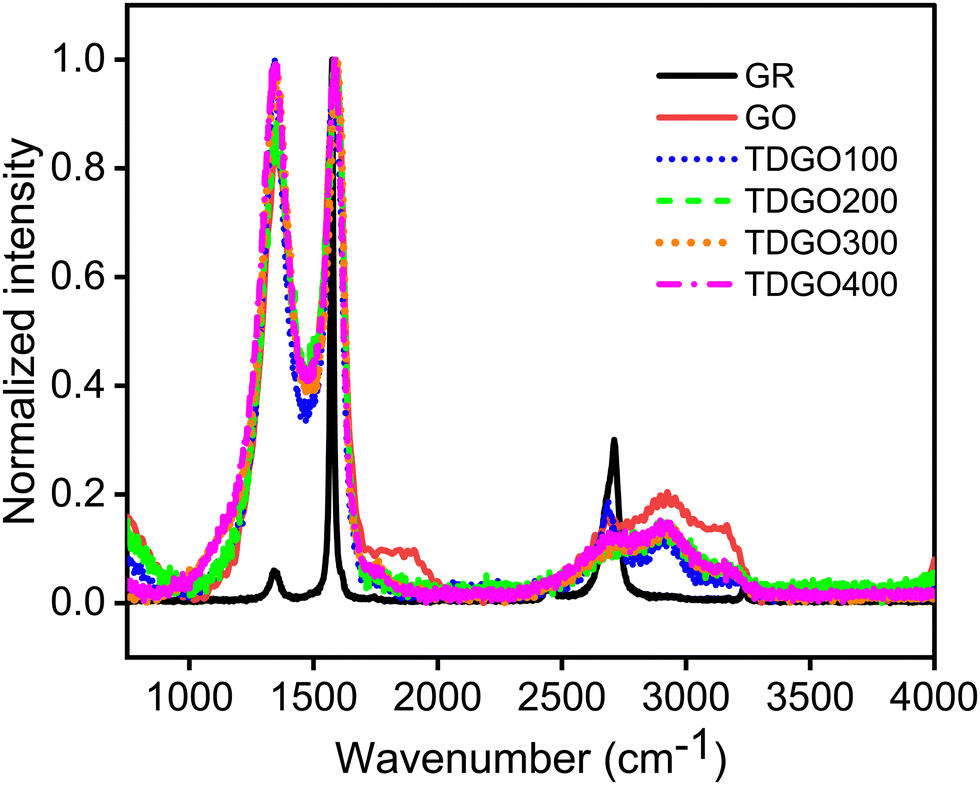 | ||
| Fig. 2 Raman spectral analysis of graphite (GR), graphite oxide (GO), and TDGO100, TDGO200, TDGO300 and TDGO400 active materials. | ||
Additionally, a broad second-order band centred at ∼2930 cm−1 is present in the spectra of the GO and TDGO samples. To assign the spectral features in the second-order region, the spectra were fitted to three Lorentzian peaks (ESI,† Fig. S4). The bands appearing at about 2690, 2930 and 3190 cm−1 were assigned to the 2D, D + D′ (combination band) and 2 D′ (overtone band) band, respectively.24 In addition to these a peak marked as the C peak in TDGO100 corresponds to the C–H stretching mode of aromatic C.25 The 2D and 2D′ bands originate from processes in which momentum conservation is satisfied by two phonons with opposite wave vectors and they do not require defects for activation. In contrast, the D + D′ band is the combination of phonons with different moments and therefore requires defects for its activation.24
To investigate the surface morphology, FESEM images were obtained. The FESEM images of TDGO samples are displayed in Fig. 3(a) to (d). The microstructure changed significantly on thermal deoxygenation. TDGO100 and TDGO200 contain closely stacked layers of rough, wrinkled, and irregular graphene sheets as shown in Fig. 3(a) and (b). While TDGO300 and TDGO400 sheets exhibit exfoliated graphene sheets as depicted in Fig. 3(c) and (d). The separation between layers is evident for TDGO300 and TDGO400, resulting in a large surface area.26
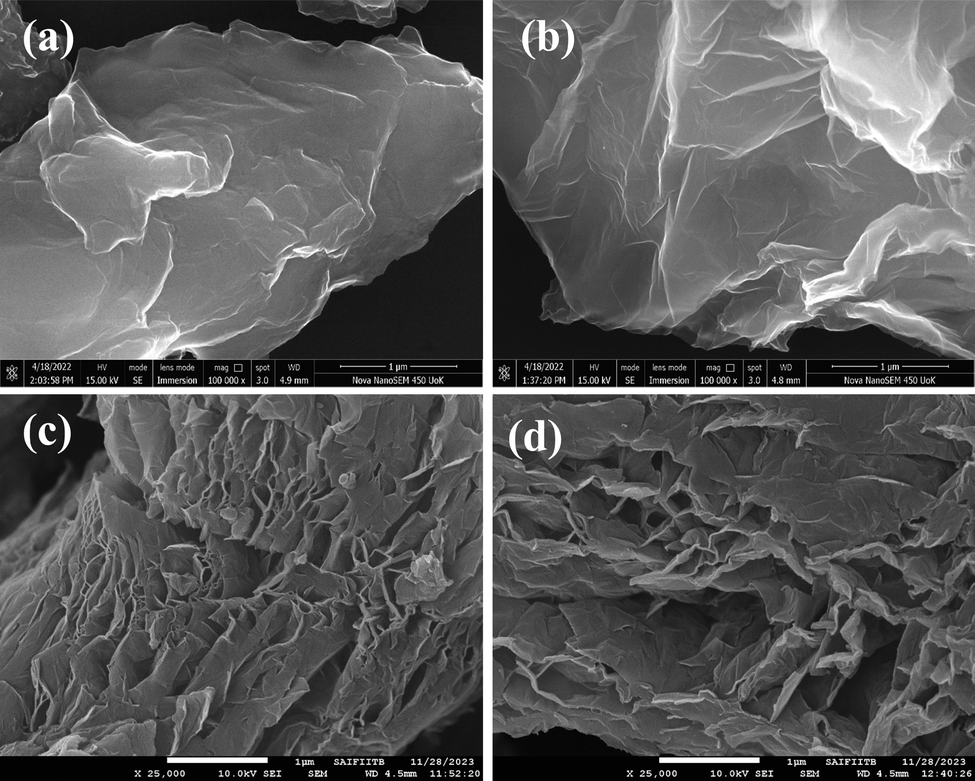 | ||
| Fig. 3 FESEM images of (a) TDGO100, (b) TDGO200, (c) TDGO300 and (d) TDGO400 samples. | ||
The surface areas of the TDGO samples were analyzed using the Brunauer–Emmett–Teller (BET) method based on nitrogen adsorption–desorption isotherms at 77 K. The results, illustrated in Fig. 4 analysis, revealed a typical type IV isotherm with an H3 hysteresis loop for all samples, indicating mesoporous nature.27 Pore size distribution analysis using the Barrett–Joyner–Halenda (BJH) method further confirmed a mesoporous structure, with average pore diameters of 3.8, 9.8, 2.4, and 10.2 nm for TDGO100, TDGO200, TDGO300, and TDGO400, respectively. At a relative pressure above 0.4, a distinct hysteresis loop suggests capillary condensation in mesopores across all samples.28 The specific surface areas were calculated as 66.1, 120.3, 288.3, and 229.6 m2 g−1 for TDGO100, TDGO200, TDGO300, and TDGO400, respectively. The specific surface area increased with deoxygenation temperature up to 300 °C, with TDGO300 exhibiting the highest value. Beyond 300 °C, an increase in temperature led to a decrease in the surface area, which was attributed to restructuring and significant carbon atom loss. During thermal deoxygenation, carbon atoms in the GO structure with an oxidation state of +1 transform into elemental carbon (oxidation state 0) and carbon dioxide (CO2, with an oxidation state of +4). The elimination of carbon atoms as carbon monoxide (CO) and CO2 results in vacancy defects.16 The redox reactions for these transformations are detailed in the ESI† (see section ‘Redox reactions during thermal deoxygenation and vacancy defects’).
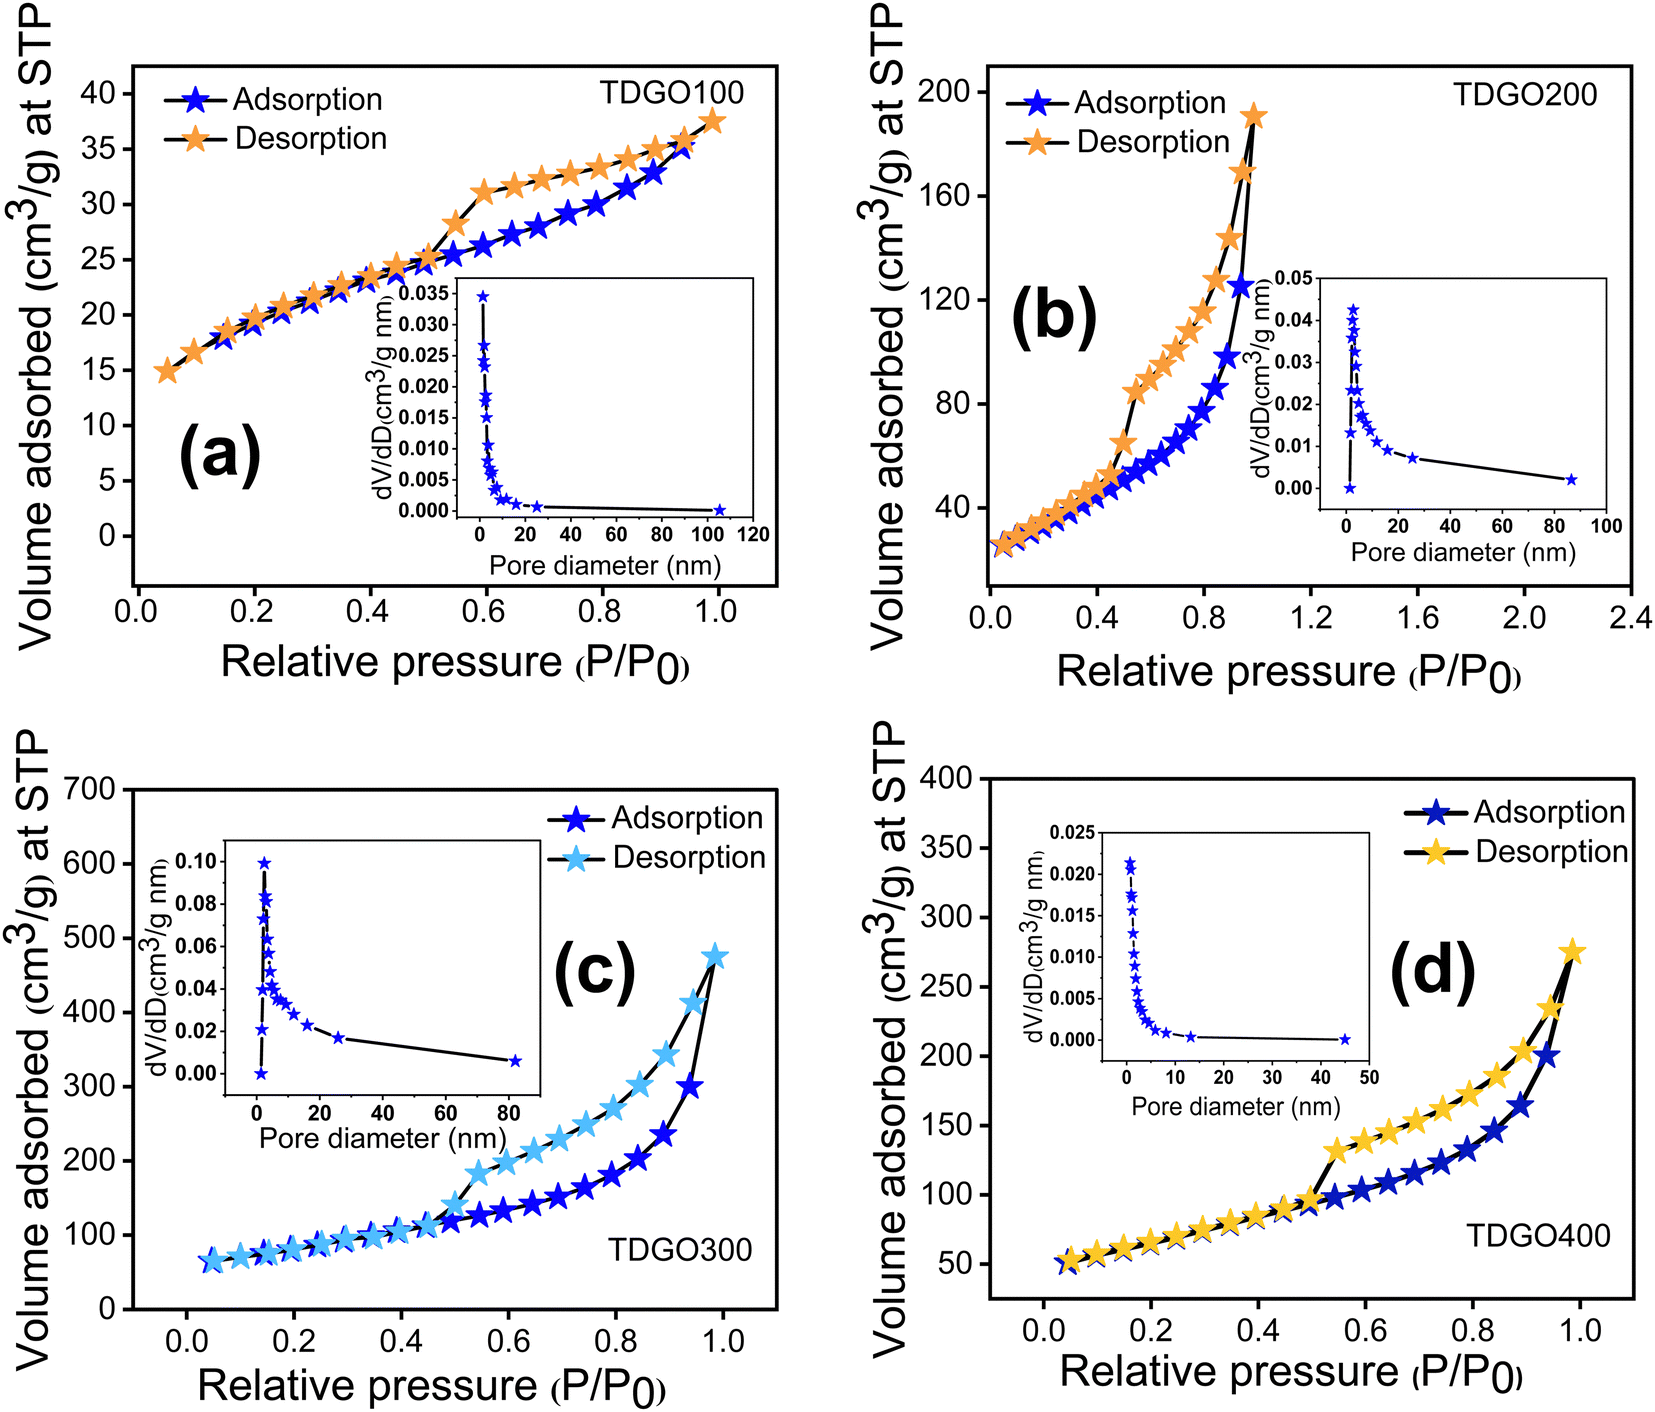 | ||
| Fig. 4 Nitrogen adsorption desorption isotherms and pore size distributions of (a) TDGO100, (b) TDGO200, (c) TDGO300 and (d) TDGO400 active materials. | ||
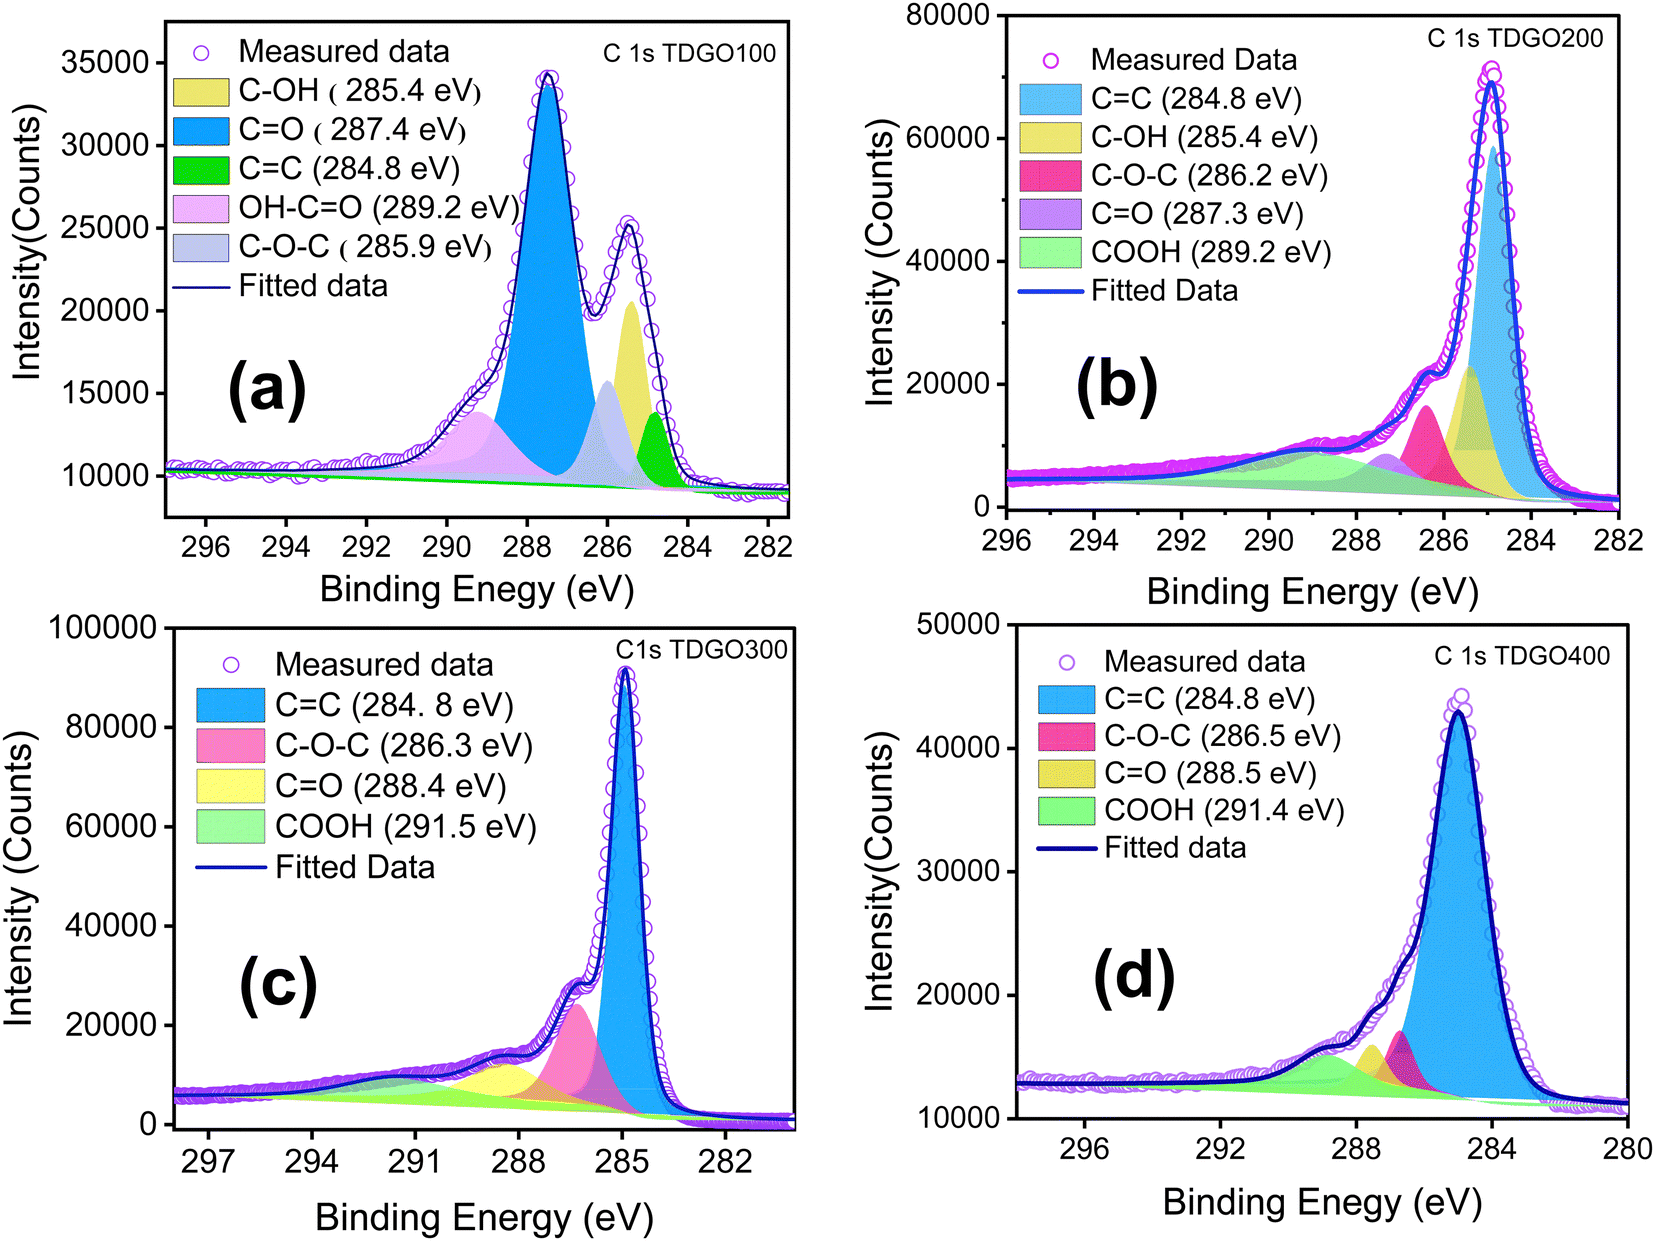
XPS analyses were conducted to quantitatively assess the oxygen functional groups present in each TDGO sample. During the thermal deoxygenation of graphene oxide (GO), the elimination of hydroxyl (O–H) and epoxy (C–O–C) groups, as well as carbonyl (–C![[double bond, length as m-dash]](https://www.rsc.org/images/entities/char_e001.gif) O) and carboxylic (–COOH) groups, takes place. Deconvolution of the XPS C1s spectrum of each TDGO sample was performed to provide a detailed analysis of the evolution of these functional groups with temperature, as illustrated in Fig. 5. In GO, hydroxyl and epoxide groups are attached to the basal plane, while carboxyl groups are located on the edges.29 According to a previous report by Gao et al., hydroxyl groups attached to the inner part are less stable and more easily removed compared to those attached at the edges.30 Upon deconvolution, the relative atomic percentage of hydroxyl groups decreases with increased temperature. For TDGO100 and TDGO200, 23.6% and 13.91% of hydroxyl groups are retained, respectively, while in the rest of the samples, these groups are eliminated. In TDGO100, hydroxyl groups within the inner planes are removed, and some still persist in TDGO, as evidenced by the small (001) peak on the lower 2 theta side of XRD (Fig. 1).
O) and carboxylic (–COOH) groups, takes place. Deconvolution of the XPS C1s spectrum of each TDGO sample was performed to provide a detailed analysis of the evolution of these functional groups with temperature, as illustrated in Fig. 5. In GO, hydroxyl and epoxide groups are attached to the basal plane, while carboxyl groups are located on the edges.29 According to a previous report by Gao et al., hydroxyl groups attached to the inner part are less stable and more easily removed compared to those attached at the edges.30 Upon deconvolution, the relative atomic percentage of hydroxyl groups decreases with increased temperature. For TDGO100 and TDGO200, 23.6% and 13.91% of hydroxyl groups are retained, respectively, while in the rest of the samples, these groups are eliminated. In TDGO100, hydroxyl groups within the inner planes are removed, and some still persist in TDGO, as evidenced by the small (001) peak on the lower 2 theta side of XRD (Fig. 1).
 | ||
| Fig. 5 Deconvoluted C 1s XPS narrow scans of (a) TDGO100, (b) TDGO200, (c) TDGO300 and (d) TDGO400 active materials. | ||
For TDGO300 and TDGO400, the percentage of other functional groups varies, as indicated in Table 1. The only consistent trend among these TDGO samples is the increase in the CC bond with deoxygenation temperature.
| Functional groups | TDGO100 | TDGO200 | TDGO 300 | TDGO400 | ||||
|---|---|---|---|---|---|---|---|---|
| Binding energy (eV) | Relative atomic percentage (%) | Binding energy (eV) | Relative atomic percentage (%) | Binding energy (eV) | Relative atomic percentage (%) | Binding energy (eV) | Relative atomic percentage (%) | |
| CC |
284.8 | 14.81 | 284.6 | 44.72 | 284.9 | 57.25 | 284.8 | 64.68 |
| C–OH | 285.4 | 23.60 | 285.5 | 13.91 | — | — | — | — |
| C–O–C | 285.9 | 18.20 | 286.4 | 11.31 | 286.3 | 21.38 | 286.3 | 11.50 |
| CO |
287.4 | 30.51 | 287.4 | 14.60 | 288.4 | 12.41 | 287.4 | 16.46 |
| COOH | 289.2 | 12.80 | 289.2 | 15.46 | 291.5 | 8.96 | 289.4 | 7.36 |
Initial electrochemical studies were carried out in a three-electrode system, with platinum (Pt) wire, Ag/AgCl, and 6 M KOH solution as the counter electrode, reference electrode, and electrolyte, respectively. Fig. S5(a) to (d) (ESI†) depict the CV curves recoded by varying the scan rate (ν) from 50 to 100 mV s−1 for TDGO100, TDGO200, TDGO300 and TDGO400, respectively. The response current (i) to an applied scan rate varies depending on whether the charge storage kinetics is diffusion controlled, or surface controlled (capacitive). The general relationship between the peak current (ip) and the scan rate (ν) can be written as follows, as suggested by Dunn's method:31
| ip = k1ν + k2ν0.5 | (1) |
For a diffusion-controlled reaction, ip ∝ ν0.5, while ip ∝ ν represents a surface controlled reaction. The anode peak current (ip) values of TDGO100, TDGO200, TDGO300 and TDGO400 active materials fit well to the scan rates ν1.1, ν0.74, ν1.2, and ν0.53, respectively (ESI,† Fig. S6(a) to (d)). This suggests that the charge storage mechanisms in TDGO100 and TDGO300 are predominantly governed by surface-controlled kinetics, while TDGO400 exhibits diffusion controlled charge storage and TDGO200 experiences a combination of both surface-controlled kinetics and diffusion.
The areal specific capacitance (Csp) of these TDGO electrodes was calculated from the GCD curves using the following equation:
 | (2) |
 and ΔV(V) represent the areal specific capacitance, current density, area of the discharge curve, area of the TDGO electrode, and potential window for the electrochemical measurements, respectively.
Fig. S7(a) to (d) (ESI†) show the GCD curves of the TDGO active materials with the current density varying from 0.5 to 1 A g−1. The Csp values of these active materials were 9.4, 51, 316, and 126 F cm−2 for TDGO100, TDGO200, TDGO300 and TDGO400, respectively, at 1 A g−1. Based on the GCD curves, the energy density, E (W h kg−1) and power density, P (W kg−1) were calculated using eqn 3 and 4 given below:
 | (3) |
 | (4) |
The energy density values were remarkably low, 0.39, 2.14, 13.27 and 5.29 W h kg−1, respectively, for TDGO100, TDGO200, TDGO300 and TDGO400 with a consistent power density of 275 W kg−1 at 1 A g−1. Considering the notable specific capacitance and energy density of TDGO300, further studies were focused on this active material and the results of GCD measurements are given in Table S2 (ESI†). In order to optimize the redox additive for enhanced performance, we have examined the compatibility of various redox additives such as potassium ferricyanide (K3Fe(CN)6), potassium ferrocyanide (K4Fe(CN)6), and potassium bromide (KBr) with 6 M KOH electrolyte as shown in Fig. S8 (ESI†). Among these, 6 M KOH with 0.03 M K3Fe(CN)6, in conjunction with TDGO300, exhibited the best current response in cyclic voltammetry (CV) studies, as shown in Fig. S8(a) (ESI†). This optimal redox additive combination was selected for further electrochemical characterizations.
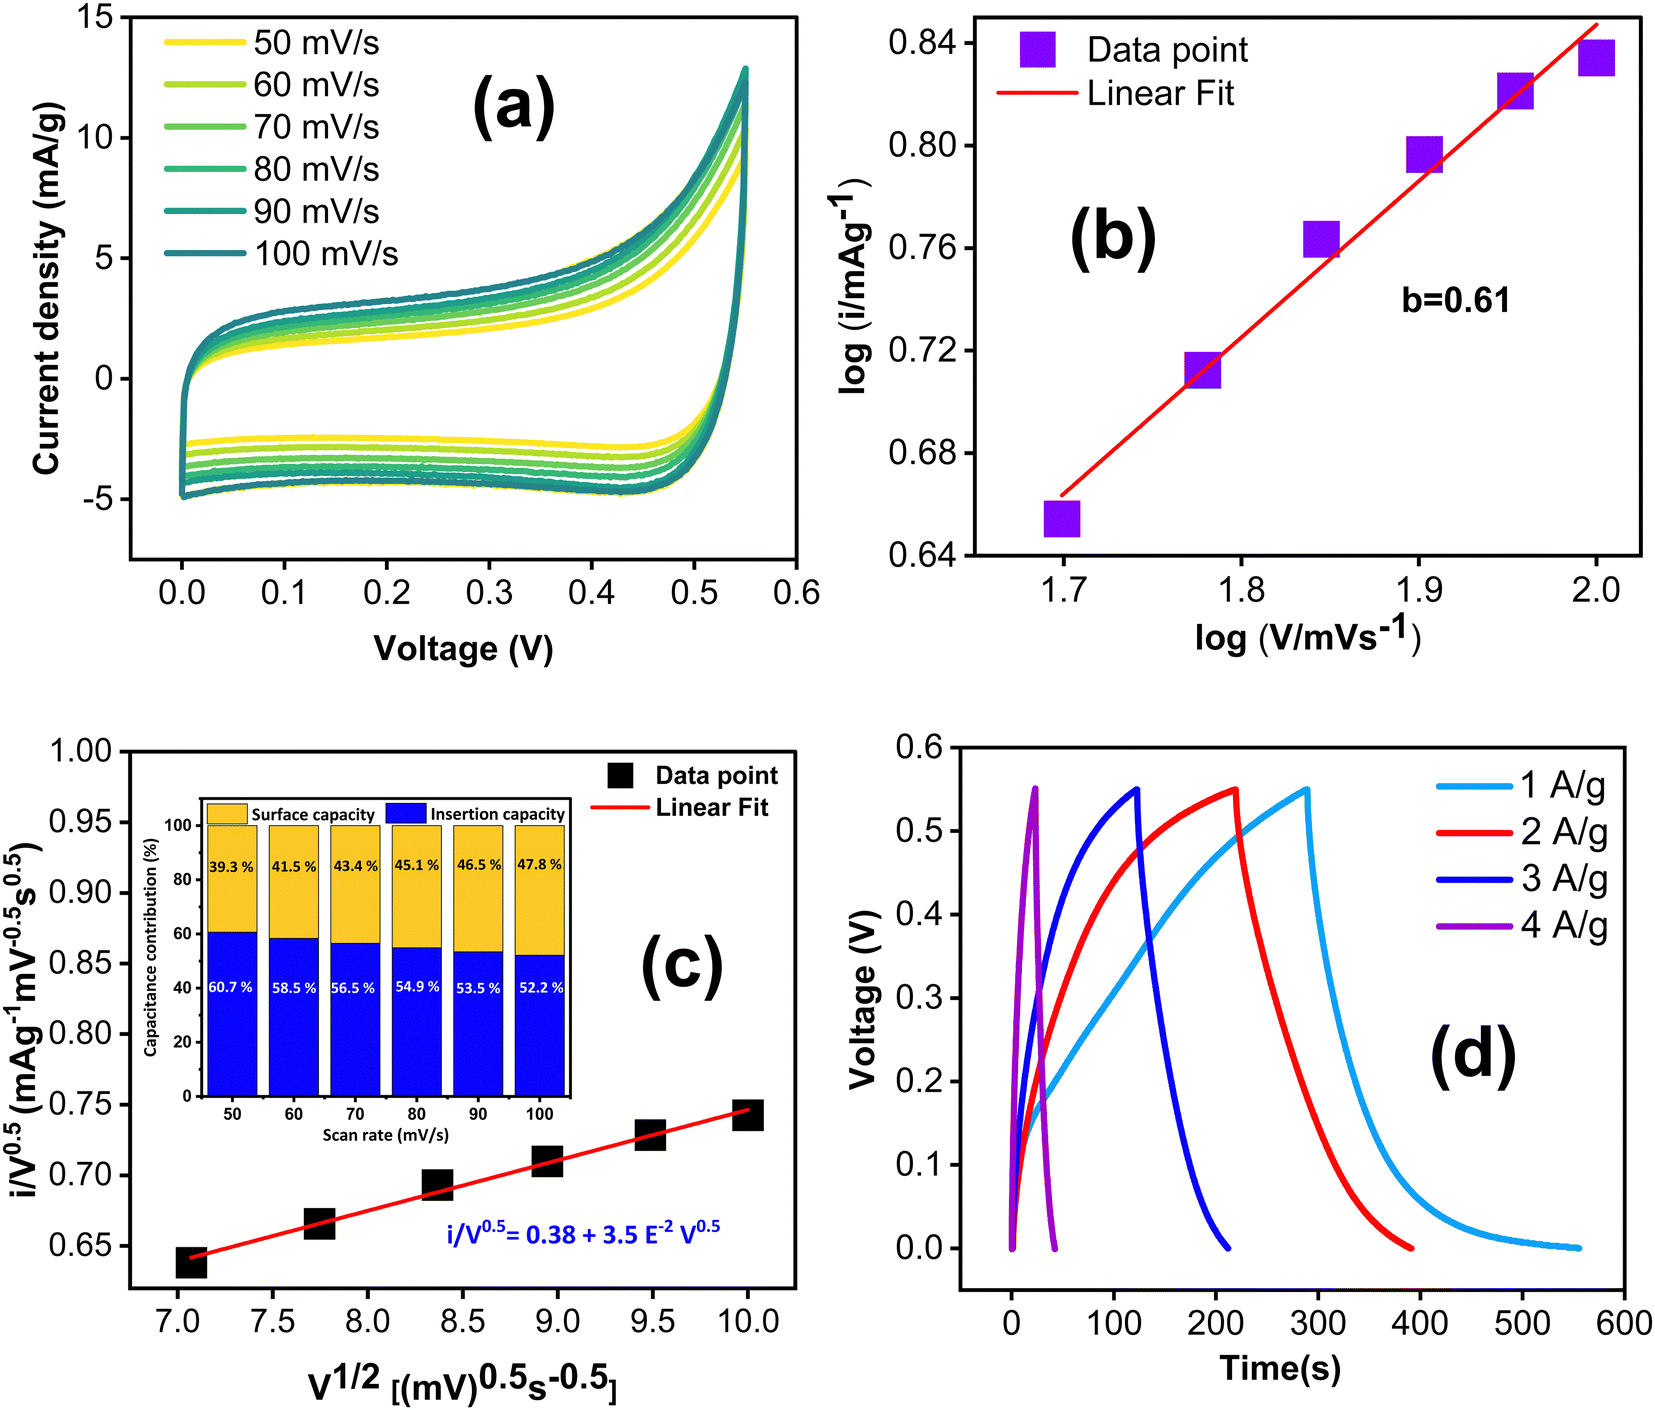
Fig. 6a displays the CV curves of TDGO300 electrodes at various scan rates ranging from 50 to 100 mV s−1. The response current increases as the scan rate rises from 50 to 100 mV s−1. At lower scan rates, a thick diffusion layer forms on the electrode surface, impeding the flow of electrolyte towards the electrode resulting in a lower current.32 Conversely, at higher scan rates, the limited time available prevents the formation of a thick diffusion layer and consequently, the electrolyte can readily access the electrode, leading to an increase in the response current.33
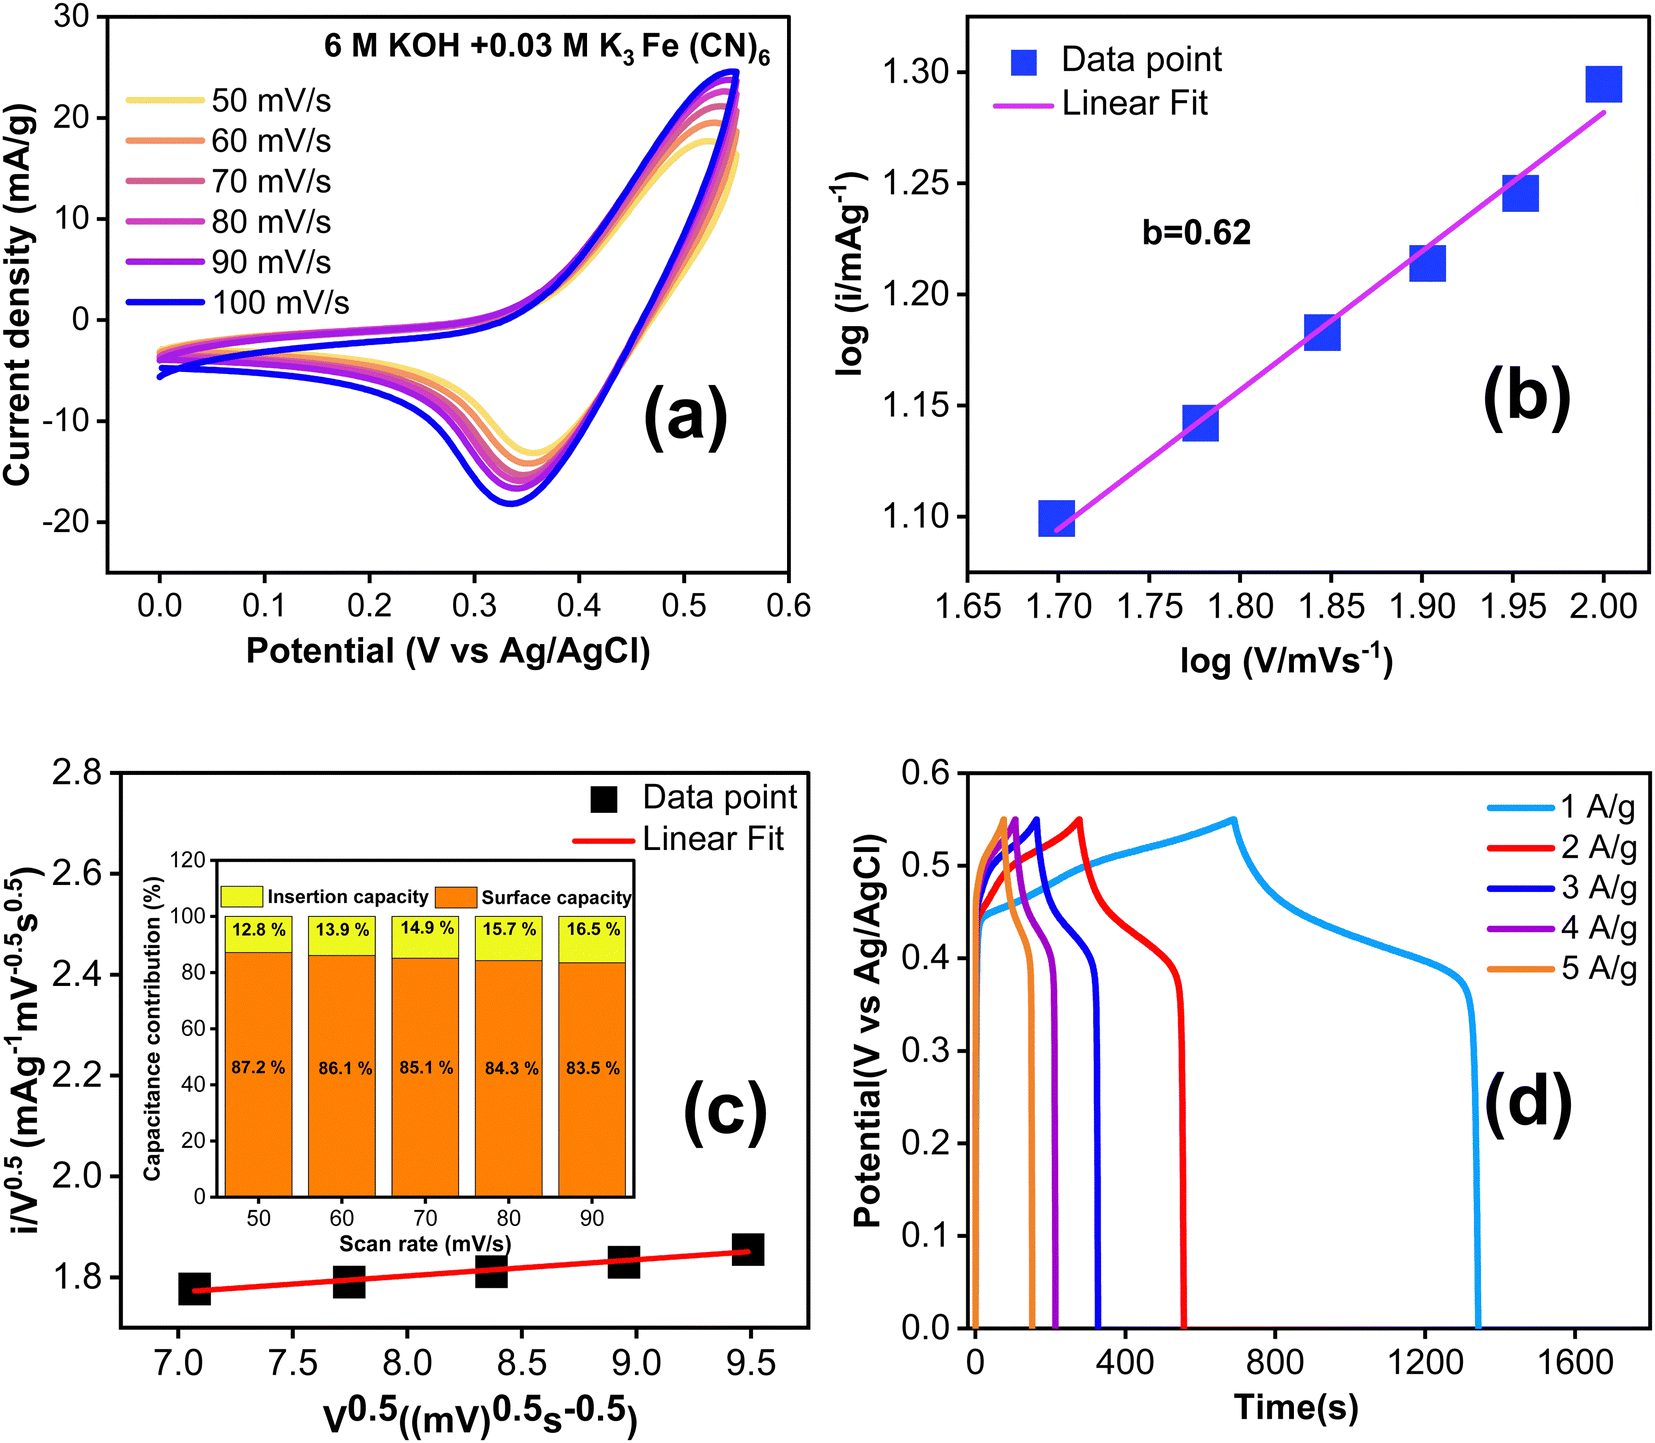 | ||
| Fig. 6 (a) Cyclic voltammograms of a TDGO300 electrode in 6 M KOH + 0.03 M K3Fe(CN)6 redox additive electrolyte at different scan rates under a three electrode configuration, (b) log V vs. logi plot at different scan rates, (c) i(V)/v1/2vs. v1/2 plot using cathodic peak current and (d) GCD curves of the TDGO300 electrode at different current densities ranging from 1 to 5 A g−1. | ||
Fig. 6b shows the dependence of the anode peak current “ip”on the scan rate “ν”. The best fit of the data to the power law dependence yields ip ∝ ν0.62. The power-law dependence ip ∝ ν0.62 suggests that the charge storage mechanism of TDGO300 in KOH/K3Fe(CN)6 redox additive electrolyte involves the combined contributions from diffusion-controlled and surface-controlled reactions. The index 0.62 (close to 0.5) signifies the predominant contribution of diffusion- over surface-controlled reactions. Fig. 6c further distinguishes the fractions of current contributions by determining the factors k1 and k2 in eqn (1) at a specific potential of 0.45 V (vs. Ag/AgCl). It is noted that the diffusion contribution dominates over the other at all scan rates, and this dominance eventually decreases at high scan rates. The diffusion-controlled capacitance varies from 87.2 to 83.5% as the scan rate increases from 50 to 90 mV s−1. This observation validates the high response current at high scan rates.
The following surface redox reactions can describe the pseudocapacitive contribution of the TDGO300 electrode.2,34
| >C–OH ⇌ >CO + H+ + e− | (5) |
| –COOH ⇌ –COO + H+ + e− | (6) |
| >CO + e− ⇌ >C–O− | (7) |
The above reactions represent the surface redox reactions from the oxygen functional groups in TDGO300, while the contribution of the redox-electrolyte can be described by the following equation:35
| [Fe(CN)6]3− + e− ↔ Fe(CN)64− | (8) |
During charging, Fe(CN)63− is reduced to Fe(CN)64− ions at the cathode, similarly during discharging Fe(CN)64− ions get oxidised to Fe(CN)63− ions at the anode side.
Fig. 6d shows the GCD curves with current density ranging from 1 to 5 A g−1. The nonlinear GCD curves confirm the redox contribution from the electrode as well as the electrolyte side during the charge/discharge. The specific capacitance in this system is contributed by both the TDGO300 electrode and KOH/K3 Fe(CN)6 electrolyte together.36 To evaluate the gravimetric capacitance (F g−1), it is essential to know the weight of all K3 Fe(CN)6 ions participating in the charge transfer process. However, not all K3 Fe(CN)6 ions in the electrolyte take part in the charge transfer process. Given this situation, instead of reporting gravimetric capacitance, it is more reliable to express the areal specific capacitance (Csp in F cm−2).35 The reaction described in eqn (8) takes place at the surface of the electrode. Consequently, the redox dependent areal specific capacitance can be determined from the GCD curve using eqn (2) mentioned earlier.
The calculated specific capacitance is 817 F cm−2 at 1 A g−1, and when the current density is increased to 2, 3, 4, and 5 A g−1, the specific capacity is decreased to 732, 680, 601 and 564 F cm−2, respectively. To gain a better understanding of the enhanced electrochemical performance of TDGO300 in a redox additive electrolyte, we compared the performance of the TDGO300 electrode in 6 M KOH alone. In Fig. S5(c) (ESI†), the CV curves in 6 M KOH over a scan rate from 60 to 100 mV s−1 are depicted. The characteristic CV shape is not significantly influenced as the scan rate is increased. The power law dependence of ip ∝ ν1.2 (shown in ESI,† Fig. S6(c)), shows that the charge storage kinetics of the TDGO300 electrode is primarily surface controlled in 6 M KOH. The visible redox peaks in CV and plateau regions in the GCD curves (ESI,† Fig. S7(c)) indicate the surface redox reactions from the oxygen functional groups. The linearity between ip and ν indicates the reversible charge transfer process from the oxygen functional groups. The charging process corresponds to the oxidation of oxygen functional groups, while the discharging process corresponds to their reduction. Meanwhile in the case of KOH/K3 Fe(CN)6 redox electrolyte there is a noticeable shift in the reduction peak towards a lower potential (Fig. 6(a)). This signifies the irreversibility of the redox couple Fe(CN)63−/Fe(CN)64−.35 The specific capacitance (Csp) of TDGO300 was 316 F cm−2 at 1 A g−1 in 6 M KOH electrolyte. The Csp shows an approximately 2.5-fold increase with the addition of 0.03 M K3Fe(CN)6 at 1 A g−1. The electron transfer between the redox species [Fe(CN)6]3− and [Fe(CN)6]4− is responsible for the enhanced charge storage capacity in the KOH/K3Fe(CN)6 redox additive electrolyte. Based on the GCD curves, the energy and power densities were calculated using eqn 3 and 4 and are shown in Table S2 (ESI†).
The energy power densities of TDGO300 with redox additives are significantly higher than those without redox additives (ESI,† Table S3). In the KOH/K3Fe(CN)6 redox additive system, TDGO300 exhibited an energy density of 34.3 W h kg−1 and a power density of 189.2 W kg−1 at a current density of 1 A g−1. In contrast, the energy density of TDGO300 in 6 M KOH alone is much lower at 13.3 W h kg−1, with a power density of 275 W kg−1.
A cycling stability test in KOH/K3Fe(CN)6 redox additive electrolyte was performed to further assess the electrochemical properties of the TDGO300 electrode as depicted in Fig. 7a. Notably, there is a fluctuation in specific capacitance compared to the case of 6 M KOH alone (Fig. 7b). The TDGO300 electrode exhibits capacitance retention of 93% in the presence of redox additive after 2000 charge–discharge cycles, whereas it achieves 98% in the absence of the redox additive. The reason behind the lower specific capacitance retention of TDGO300 in the redox additive system can be explained as follows. Initially, in the redox additive system, the electrolyte consists of only [Fe(CN)6]3− ions. After the initial electrochemical reaction, the [Fe(CN)6]3− ions get reduced to [Fe(CN)6]4− ions. As the reaction proceeds, more redox species get adsorbed on the TDGO300 electrode surface. This results in larger diffusion resistance for other ions in the electrolyte such as K+ and OH−. Consequently, there is a gradual decrease in specific capacitance, observed over 750 continuous charge–discharge cycles (Fig. 7a). As the cycling number increases, the redox couple shuttles between 3− and 4− oxidation states, leading to an eventual increase in capacitance retention. The fluctuation in specific capacitance retention is attributed to the competition between the diffusion effect and redox transition of [Fe(CN)6 ]3−/[Fe(CN)6]4− ions.35 Finally, after 2000 charge–discharge cycles 93% of the initial capacitance is retained.
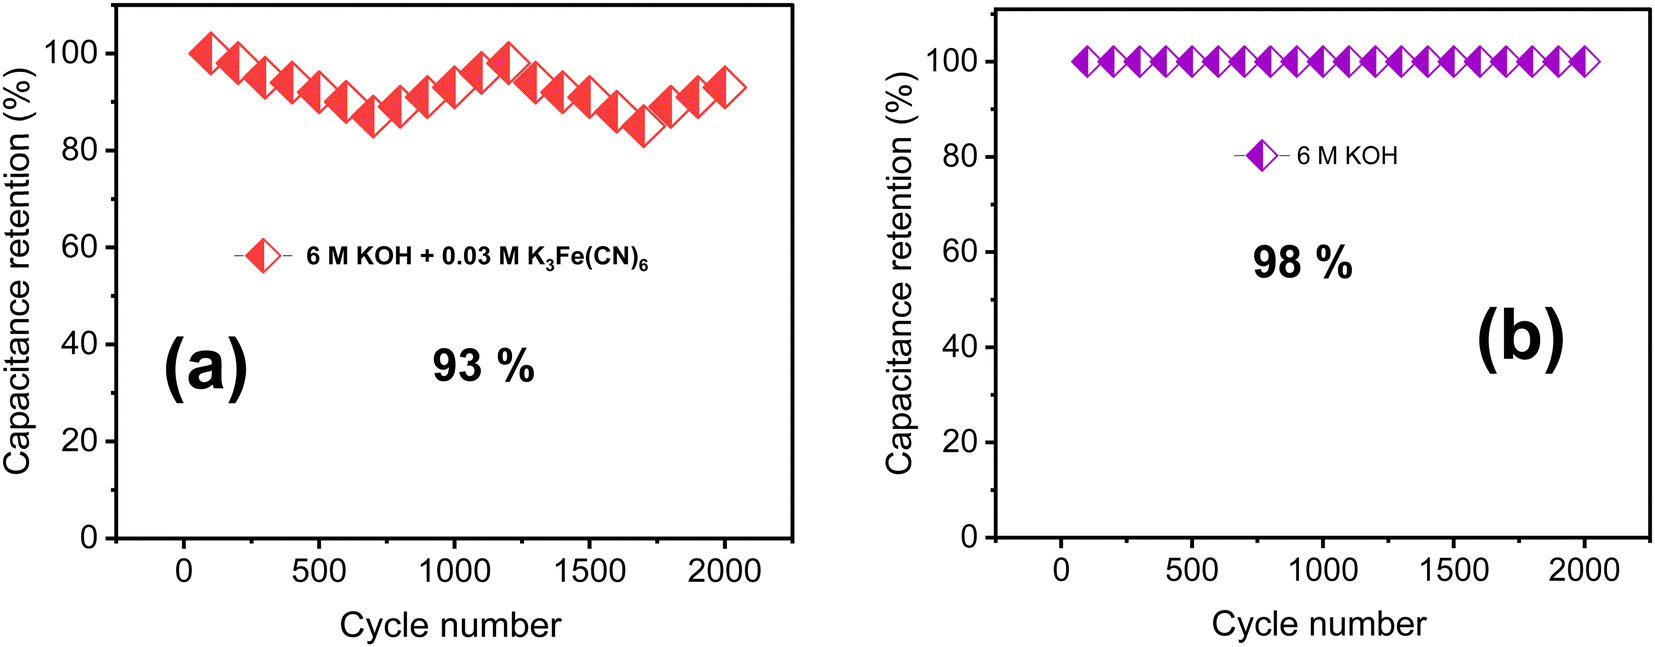 | ||
| Fig. 7 The results of cycling stability tests of (a) 6 M KOH + 0.03 M redox additive electrolyte and (b) 6 M KOH alone. | ||
The electrochemical impedance spectroscopy (EIS) results are presented in Fig. 8. In Fig. 8(a), the EIS of the redox additive system is depicted, while Fig. 8(b) corresponds to 6 M KOH alone. The Nyquist plot can be fitted by a circuit equivalent to that present in the inset of the figure. The charge transfer resistance and reaction kinetics were analysed using EIS, consisting of a semicircle and a straight line region. The interfacial charge transfer resistance (Rct) was calculated from the span of the semicircle along the real axis of the spectrum from the high to low frequency region. The equivalent series resistance (Rs) is obtained from the intersecting point of the spectrum with the real axis in the high frequency limit. Here, Rs represents the sum of ionic resistance of the electrolyte, the intrinsic resistance of the electrode material and the contact resistance at the electrode electrolyte interface.37 The figure indicates that the redox additive system has a smaller Rct (1.26 × 10² Ω) and Rs (1.39 Ω) compared to others (Rct = 3.24 × 10² Ω, Rs = 2.21 Ω). The transition from the semicircle to a slopped tail in the low frequency region can be described by the Warburg element (W), which is a result of the frequency dependence of ion diffusion/transport in the electrolyte to the electrode surface. The higher W element (1.59 × 10⁻²) of the redox additive system compared to other (1.86 × 10⁻³) signifies dominant diffusion-controlled charge storage kinetics of TDGO300 in the redox system. This also suggests that redox additives can facilitate faster ion diffusion/transport to the electrode surface.
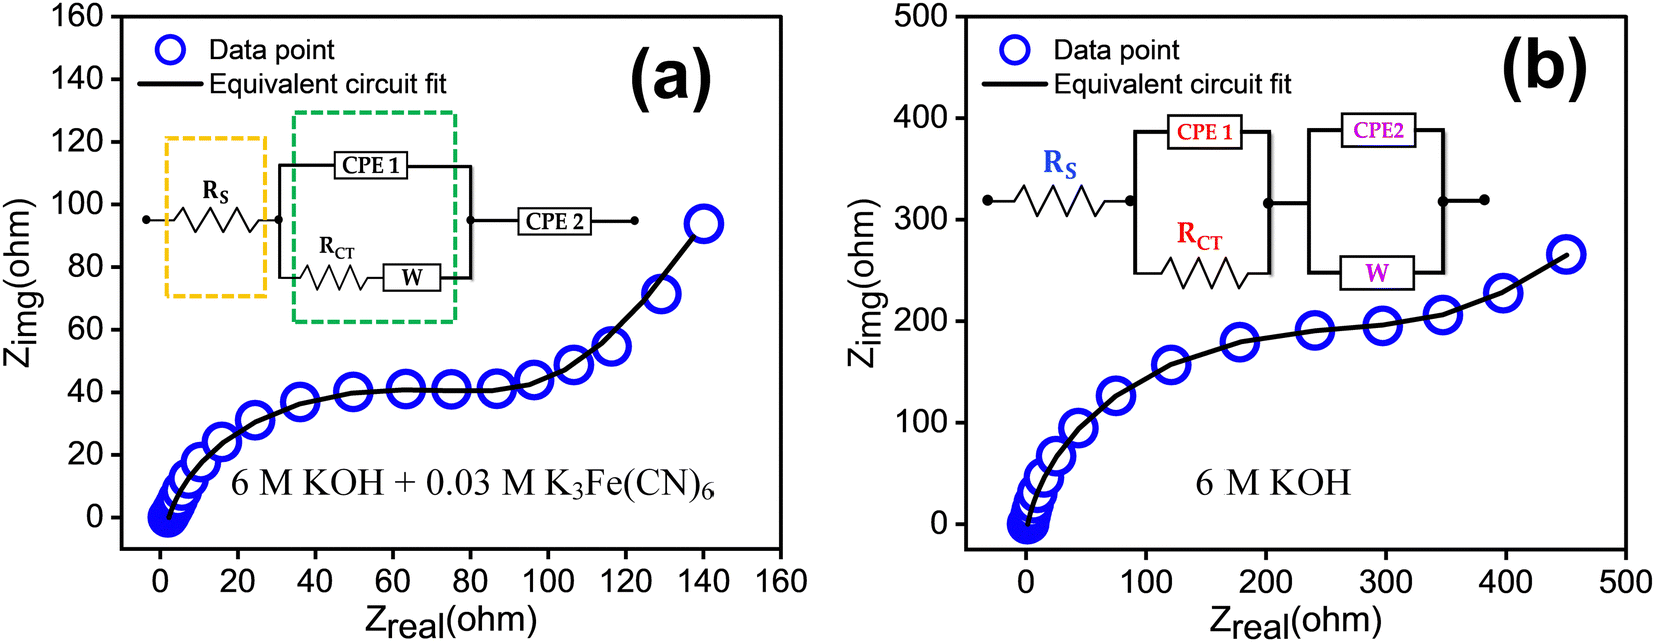 | ||
| Fig. 8 EIS measurements in the frequency range of 0.1 to 105 Hz with the equivalent circuit for the TDGO300 electrode in (a) 6 M KOH + 0.03 M K3Fe(CN)6 redox additive system, and (b) 6 M KOH. | ||
In addition to the three electrode cell characterization, we conducted symmetric two electrode measurements using a Swagelok cell assembly with KOH/K3Fe(CN)6 redox additive electrolyte. Electrochemical performance was assessed through CV, GCD, EIS and cycle stability studies. The electrodes were tested in the same voltage window, viz. 0.55 V. The CV curves, recorded at different scan rates ranging from 50 to 100 mV s−1 (Fig. 9(a)), exhibit quasi-rectangular shapes. Notably, this quasi-rectangular CV profile persists even at a high scan rate of 100 mV s−1, with a b value of 0.61 confirming the predominant contribution of diffusion-controlled charge storage kinetics as shown in Fig. 9(b). This observation was further verified by the cyclic voltammetry data, showing that the surface capacitive contribution varies from 60.7% to 52.2% as the scan rate increases from 50 to 100 mV s−1 shown in Fig. 9(c).
 | ||
| Fig. 9 (a) Cyclic voltammograms of the TDGO300 electrode in 6 M KOH + 0.03 M K3Fe(CN)6 redox additive electrolyte at different scan rates in the 2 electrode configuration, (b) logV vs. logi plot at different scan rates, (c) i(V)/v1/2 vs. v1/2 plot using cathodic peak current and (d) GCD curves of the TDGO300 electrode at different current densities ranging from 1 to 5 A g−1. | ||
The GCD curves, recorded at various current densities from 1 to 4 A g−1 (Fig. 9(c)), demonstrate a nonlinear response, confirming the prevalence of surface redox capacitive behaviour. However, it is worth noting that the GCD profile does not exhibit any plateau region compared to three-electrode measurements. The difference in the shape of the GCD curves between three-electrode and two-electrode characterizations could be attributed to several factors. One potential reason is that the three-electrode characterization method is more sensitive to the impedance of the redox electrolyte and the contact resistance between the electrode and redox electrolyte. Additionally, redox transitions are more pronounced in the three-electrode configuration, resulting in plateau regions in the GCD curves. In contrast, the two-electrode method is less sensitive to these factors, hence yielding a different shape for the GCD curves as shown in Fig. 9(c). The specific capacitance values were calculated from the GCD curves using the equation:
 | (9) |
The specific capacitance values were obtained as 414.6, 331.4, 254.4, 168.2 F cm−2, respectively, at 1, 2, 3, and 4 A g−1. The symmetric system delivers an energy density of 17.4 W h kg−1 at a power density of 235 W kg−1 (ESI,† Table S4).
Fig. 10(a) depicts the EIS spectrum together with the equivalent circuit. The faradaic charge transfer resistance Rct is 23.67 Ω, which is responsible for the electron transfer kinetics of redox reactions at the electrode–electrolyte interface. The combined effect of ionic resistance of the electrolyte and interfacial system resistance results in a series resistance of Rs = 2.55 Ω. In addition to this, the EIS plot exhibits a Warburg impedance W of 4.90 × 10⁻², appearing as a 45° inclined line. The cycling stability of the supercapacitor was examined at a current density of 5 A g−1 for up to 5000 charge–discharge cycles as shown in Fig. 10(b). The TDGO300 supercapacitor retained 96.8% of its initial capacitance in the redox additive electrolyte.
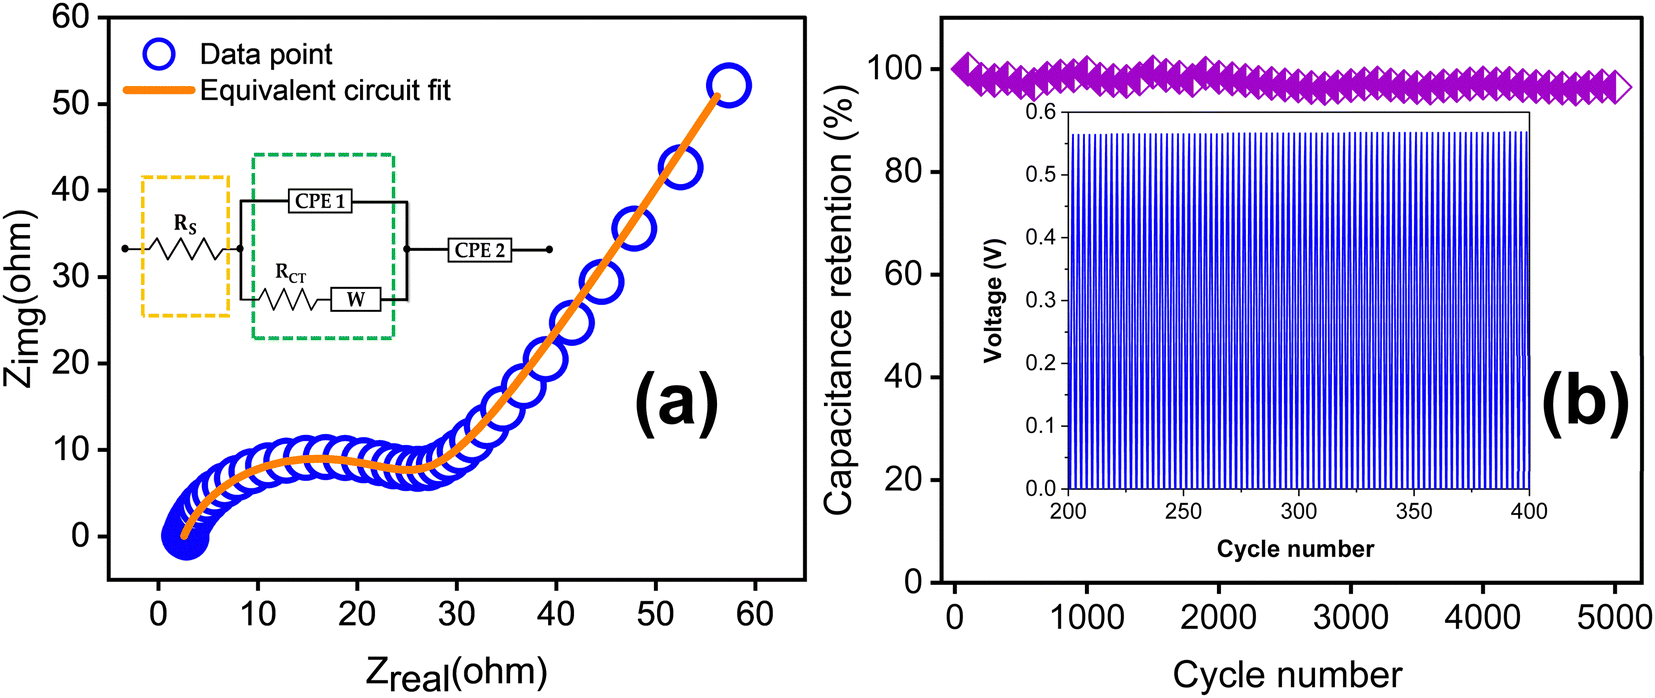 | ||
| Fig. 10 (a) EIS spectra of TDGO300 in a redox additive electrolyte with equivalent circuit and (b) result of the cycling stability test for up to 5000 charge–discharge cycles. | ||
The specific capacitance, energy density, and power density values obtained for the TDGO300 supercapacitor in the redox additive electrolyte are comparable with the values reported for other carbon materials, including activated carbon, carbon nanotubes, and reduced graphene oxide. Table 2 compares the electrochemical performance of carbon materials with KOH electrolyte with that of the present study. Additionally, reports of composites of rGO with redox-mediated KOH electrolyte are also included. We have also compared the results of the present study with some advanced electrode materials such as perovskites, bimetallic carbide, metal oxides, and transition metal oxides in KOH electrolyte.38–42 It can be noted that the results of the present study are commendable.
| Electrode material | Redox additive electrolyte | Specific capacitance, Csp (F g−1), current density (A g−1) | Energy density, E (W h kg−1) | Power density, P (W kg−1) | Ref. | |
|---|---|---|---|---|---|---|
| Co–Al layered double hydroxide | KOH + K4Fe(CN)6 | 317 F g−1 at 2 A g−1 | — | — | 43 | |
| KOH + K3Fe(CN)6 | 712 F g−1 at 2 A g−1 | |||||
| Manganese dioxide, MnO2 | KOH + p-phenylenediamine | 325.24 F g−1 at 1 A g−1 | 10.12 | — | 44 | |
| Activated carbon | KOH + p-phenylenediamine | 605.22 F g−1 at 1 A g−1 | 19.86 | 16.99 k | 45 | |
| Single walled carbon nanotube, SWCNT | KOH + p-phenylenediamine | 162.66 F g−1 at 1 A g−1 | 4.23 | — | 46 | |
| MWCNTs | KOH + m-phenylenediamine | 78 F g−1 at 0.5 A g−1 | 9.99 | 5.78 k | 47 | |
| SrRuO3 | Hydroquinone + (H3PO4) | 62.4 F g−1 | 5 | |||
| Hydroquinone + (NaNO3) | 101 F g−1 | |||||
| Polypyrrole/reduced graphene oxide | 1 M H2SO4 + 0.2 M hydroquinone (HQ) | 60 F g−1 | 6.5 | 80 | 3 | |
| Reduced graphene oxide | 1 M KOH + 0.05 M KI | 500 F g−1 at 0.83 A g−1 | 44 | — | 4 | |
| N,P-doped carbon microsphere/reduced graphene oxide nanocomposites | H2SO4 + KI | 654 F g−1 at 2 A g−1 | 14.53 | 40.2 | 48 | |
| Activated carbon (3E) | 1 M H2SO4 + 0.08 KI | 912 F g−1 at 2 mA cm−2 | 19.04 | 224.43 | 44 | |
| Polypyrrole-modified SrFeO3−δ perovskite | PVA-KOH | 421 F g−1 at 1 A g−1 | 24.5 | 909 | 42 | |
| SrCo0.9Fe0.1O3-δ@CC | — | 91.8 F g−1 at 1 A g−1 | 7.6 | 800 | 41 | |
| Fe3Mo3C/Mo2C@CNTs | 1 M KOH | 202.3 F g−1 at 1 A g−1 | 39.9 | 18000 |
40 | |
| CoO@Co2V2O7 | — | 7.58 F cm−2 | 0.45 mWh cm−2 | 1.60 mW cm−2 | 39 | |
| 2 mA cm−2 | ||||||
| Copper molybdenum sulfide Cu2MoS4 | 1 M KOH | 33.9 mA h g−1 at 1 A g−1 | 16.8 | 800 | 38 | |
| Thermally deoxygenated graphite oxide (TDGO) | 3 E | 6 M KOH | 817 F cm−2 at 1 A g−1 | 34.3 W h kg−1 | 189.2 W kg−1 | Present Work |
| 6 M KOH + 0.03 M K3Fe(CN)6 | 316 F cm−2 at 1 A g−1 | 13.3 W h kg−1 | 275 W kg−1 | |||
| 2 E | 6 M KOH + 0.03 M K3Fe(CN)6 | 414.6 F cm−2 | 17.4 W h kg−1 | 235 W kg−1 | ||
Conclusions
We optimized a suitable redox additive viz., 0.03 M K3Fe(CN)6 to explore the capacitive properties of thermally reduced graphene oxide (TDGO) in a 6 M KOH electrolyte. The selection of the 0.3 M K3Fe(CN)6 redox additive, among others, ensured the best current response, entirely altering the reaction mechanism of the TDGO300 supercapacitor from surface-controlled to a diffusion-controlled pseudocapacitance. The system exhibited an areal specific capacitance of 817 F cm−2 in the KOH/K3Fe(CN)6 redox electrolyte at 1 A g−1, whereas it was only 316 F cm−2 in 6 M KOH alone in a three-electrode configuration for the same current. A 2.5-fold increase in specific capacitance was achieved from the additional redox reactions of the [Fe(CN)6]3−/[Fe(CN)6]4− redox couple. The symmetric TDGO300 supercapacitors in the KOH/K3Fe(CN)6 redox electrolyte system exhibited a Csp of 414.6 F cm−2. This symmetric system delivered an energy density of 17.4 W h kg−1 at a power density of 235 W kg−1. The TDGO300 supercapacitor retained 96.8% of its initial capacitance in the redox additive electrolyte after 5000 continuous charge–discharge cycles.Author contributions
M S Arsha: conceptualization, methodology, investigation, formal analysis, and writing original draft. V. Biju: conceptualization, correction of original draft, validation, supervision.Conflicts of interest
There are no conflicts to declare.Acknowledgements
Financial support from the Kerala State Council for Science Technology and Environment (KSCSTE), Kerala, India (Junior Research Fellowship Grant No. 001/FSHP/MAIN/2017/KSCSTE), and experimental support from Central Laboratory and Instrumentation Facility (CLIF), University of Kerala for XRD, XPS and BET measurements are highly appreciated. The authors are grateful to the Department of Optoelectronics, University of Kerala and Indian Institute of Technology, Mumbai, India for FESEM analysis.References
- A. Razaq, F. Bibi, X. Zheng, R. Papadakis, S. H. M. Jafri and H. Li, Materials, 2022, 15 Search PubMed.
- Y. J. Oh, J. J. Yoo, Y. Il Kim, J. K. Yoon, H. N. Yoon, J.-H. Kim and S. Bin Park, Electrochim. Acta, 2014, 116, 118–128 CrossRef CAS.
- A. Moyseowicz and G. Gryglewicz, Electrochim. Acta, 2020, 354, 136661 CrossRef CAS.
- K. V. Sankar and R. Kalai Selvan, Carbon, 2015, 90, 260–273 CrossRef CAS.
- A. Galal, H. K. Hassan, N. F. Atta and T. Jacob, J. Phys. Chem. C, 2018, 122, 11641–11650 CrossRef CAS.
- V. Agarwal and P. B. Zetterlund, Chem. Eng. J., 2021, 405, 127018 CrossRef CAS.
- S. Park, J. An, I. Jung, R. D. Piner, S. J. An, X. Li, A. Velamakanni and R. S. Ruoff, Nano Lett., 2009, 9, 1593–1597 CrossRef CAS PubMed.
- X. Dong, Q. Long, J. Wang, M. B. Chan-Park, Y. Huang, W. Huang and P. Chen, Nanoscale, 2011, 3, 5156–5160 RSC.
- S. Park, J. An, R. D. Piner, I. Jung, D. Yang, A. Velamakanni, S. B. T. Nguyen and R. S. Ruoff, Chem. Mater., 2008, 20, 6592–6594 CrossRef CAS.
- W. Gao, L. B. Alemany, L. Ci and P. M. Ajayan, Nat. Chem., 2009, 1, 403–408 CrossRef CAS PubMed.
- I. K. Moon, J. Lee, R. S. Ruoff and H. Lee, Nat. Commun., 2010, 1, 1–6 Search PubMed.
- S. Pei, J. Zhao, J. Du, W. Ren and H. M. Cheng, Carbon, 2010, 48, 4466–4474 CrossRef CAS.
- S. Mao, H. Pu and J. Chen, RSC Adv., 2012, 2, 2643 RSC.
- S. Pei and H.-M. Cheng, Carbon, 2012, 50, 3210–3228 CrossRef CAS.
- C. Zhang, W. Lv, X. Xie, D. Tang, C. Liu and Q.-H. Yang, Carbon, 2013, 62, 11–24 CrossRef CAS.
- A. M. Dimiev and S. Eigler, Graphene Oxide Fundamentals and Applications, 2017 Search PubMed.
- J. Chen, B. Yao, C. Li and G. Shi, Carbon, 2013, 64, 225–229 CrossRef CAS.
- H. H. Huang, K. K. H. De Silva, G. R. A. Kumara and M. Yoshimura, Sci. Rep., 2018, 8, 6849 CrossRef PubMed.
- K. Muthoosamy, R. Geetha Bai, I. B. Abubakar, S. M. Sudheer, H. N. Lim, H. S. Loh, N. M. Huang, C. H. Chia and S. Manickam, Int. J. Nanomed., 2015, 10, 1505–1519 CAS.
- I. Maity, K. Ghosh, H. Rahaman and P. Bhattacharyya, IEEE Trans. Device Mater. Reliab., 2017, 17, 738–745 CAS.
- L. G. Cançado, K. Takai, T. Enoki, M. Endo, Y. A. Kim, H. Mizusaki, N. L. Speziali, A. Jorio and M. A. Pimenta, Carbon, 2008, 46, 272–275 CrossRef.
- B. K. Saikia, R. K. Boruah and P. K. Gogoi, A X-ray diffraction analysis on graphene layers of Assam coal, J. Che. Sci., 2009, 121, 103–106 CrossRef CAS.
- J. Ribeiro-Soares, M. E. Oliveros, C. Garin, M. V. David, L. G. P. Martins, C. A. Almeida, E. H. Martins-Ferreira, K. Takai, T. Enoki, R. Magalhães-Paniago, A. Malachias, A. Jorio, B. S. Archanjo, C. A. Achete and L. G. Cançado, Carbon, 2015, 95, 646–652 CrossRef CAS.
- D. López-Díaz, M. López Holgado, J. L. García-Fierro and M. M. Velázquez, J. Phys. Chem. C, 2017, 121, 20489–20497 CrossRef.
- X. Díez-Betriu, S. Álvarez-García, C. Botas, P. Álvarez, J. Sánchez-Marcos, C. Prieto, R. Menéndez and A. De Andrés, J. Mater. Chem. C, 2013, 1, 6905–6912 RSC.
- S. B. Singh and M. De, J. Porous Mater., 2021, 28, 875–888 CrossRef CAS.
- H. Wang, Q. Gao and L. Jiang, Small, 2011, 7, 2454–2459 CrossRef CAS PubMed.
- R. Bardestani, G. S. Patience and S. Kaliaguine, Can. J. Chem. Eng., 2019, 97, 2781–2791 CrossRef CAS.
- H. Yang, J.-S. Li and X. Zeng, ACS Appl. Nano Mater., 2018, 1, 2763–2773 CrossRef CAS.
- I. Sengupta, S. Chakraborty, M. Talukdar, S. K. Pal and S. Chakraborty, J. Mater. Res., 2018, 33, 4113–4122 CrossRef CAS.
- Y. Jiang and J. Liu, Energy Environ. Mater., 2019, 2, 30–37 CrossRef.
- H. Huo, Y. Zhao and C. Xu, J. Mater. Chem. A, 2014, 2, 15111 RSC.
- A. Nashim, S. Pany and K. M. Parida, J. Energy Storage, 2021, 42, 103145 CrossRef.
- H. Cao, X. Peng, M. Zhao, P. Liu, B. Xu and J. Guo, RSC Adv., 2018, 8, 2858–2865 RSC.
- K. Chen, F. Liu, D. Xue and S. Komarneni, Nanoscale, 2015, 7, 432–439 RSC.
- W. Qin, N. Zhou, C. Wu, M. Xie, H. Sun, Y. Guo and L. Pan, ACS Omega, 2020, 5, 3801–3808 CrossRef CAS PubMed.
- R. Srinivasan and F. Fasmin, An introduction to electrochemical impedance spectroscopy, CRC Press, Boca Raton, 2021 Search PubMed.
- R. H. Xu, P. P. Ma, G. F. Liu, Y. Qiao, R. Y. Hu, L. Y. Liu, M. Demir and G. H. Jiang, Energy Fuels, 2023, 37, 6158–6167 CrossRef CAS.
- Z. Jiao, Y. Chen, M. Du, M. Demir, F. Yan, Y. Zhang, C. Wang, M. Gu, X. Zhang and J. Zou, J. Alloys Compd., 2023, 958, 170489 CrossRef CAS.
- R. Y. Hu, L. Y. Liu, J. H. He, Y. Zhou, S. B. Wu, M. X. Zheng, M. Demir and P. P. Ma, J. Energy Storage, 2023, 72, 108656 CrossRef.
- L. Liu, G. Liu, S. Wu, J. He, Y. Zhou, M. Demir, R. Huang, Z. Ruan, G. Jiang and P. Ma, Ceram. Int., 2024, 50, 1970–1980 CrossRef CAS.
- Y. Qiao, J. He, Y. Zhou, S. Wu, X. Li, G. Jiang, G. Jiang, M. Demir and P. Ma, ACS Appl. Mater. Interfaces, 2023, 15, 52381–52391 CrossRef CAS PubMed.
- L.-H. Su, X.-G. Zhang, C.-H. Mi, B. Gao and Y. Liu, Phys. Chem. Chem. Phys., 2009, 11, 2195 RSC.
- S. T. Senthilkumar, R. K. Selvan, Y. S. Lee and J. S. Melo, J. Mater. Chem. A, 2012, 1, 1086–1095 RSC.
- J. Wu, H. Yu, L. Fan, G. Luo, J. Lin and M. Huang, J. Mater. Chem., 2012, 22, 19025 RSC.
- H. Yu, J. Wu, J. Lin, L. Fan, M. Huang, Y. Lin, Y. Li, F. Yu and Z. Qiu, Chem. Phys. Chem., 2013, 14, 394–399 CrossRef CAS PubMed.
- H. Yu, L. Fan, J. Wu, Y. Lin, M. Huang, J. Lin and Z. Lan, RSC Adv., 2012, 2, 6736 RSC.
- Q. Sun, Y. Li and T. He, J. Mater. Sci., 2019, 54, 7665–7678 CrossRef CAS.
Footnote |
| † Electronic supplementary information (ESI) available. See DOI: https://doi.org/10.1039/d3ma01188g |
| This journal is © The Royal Society of Chemistry 2024 |