 Open Access Article
A hierarchically modified fibre-reinforced polymer composite laminate with graphene nanotube coatings operating as an efficient thermoelectric generator†
Christos K.
Mytafides
 *a,
Lazaros
Tzounis
*a,
Kyriaki
Tsirka
*a,
Lazaros
Tzounis
*a,
Kyriaki
Tsirka
 a,
George
Karalis
a,
Marco
Liebscher
b,
Eleftherios
Lambrou
a,
George
Karalis
a,
Marco
Liebscher
b,
Eleftherios
Lambrou
 a,
Leonidas N.
Gergidis
 a and
Alkiviadis S.
Paipetis
 *a
*a
aComposites and Smart Materials Laboratory, Materials Science & Engineering Department, University of Ioannina, 45110 Ioannina, Epirus, Greece. E-mail: cmytafides@gmail.com; latzounis@gmail.com; paipetis@uoi.gr; Tel: +30 26510 09025 Tel: +30 26510 08001
bInstitute of Construction Materials, Technische Universität Dresden, 01062 Dresden, Germany
First published on 6th March 2024
Abstract
In this study, a multifunctional, hierarchically modified glass fiber-reinforced polymer composite laminate (GFRP) capable of harvesting thermoelectric energy is fabricated and demonstrated. The fibrous reinforcements were hierarchically patterned with alternate n- and p-type graphene nanotube (single-walled carbon nanotube – SWCNT) aqueous dispersions, which were printed via ink dispensing processes. The optimal n- and p-type resin-impregnated printed films demonstrate high power factors of 82 and 96 μW m−1 K−2, respectively, and excellent stability in air. The manufactured GFRP-based graphene thermoelectric generator (GTEG) has the capability to stably function up to 125 °C under ambient conditions (1 atm, RH: 50 ± 5% RH). Printed SWCNT-based thermoelectric (TE) modules were successfully designed and fabricated onto a glass fiber fabric substrate with remarkable properties of n-type and p-type TE thin films resulting in exceptionally high performance. The thermoelectrically functionalized GFRP exhibits excellent stability during operation with obtained TE values of an open circuit voltage VOC = 1.01 V, short circuit current ISC = 850 μA, internal resistance RTEG = 1188 Ohm, and a generated power output Pmax = 215 μW at ΔT = 100 °C with TC = 25 °C. The novelty of this work is that it demonstrates for the first time a multilayered hierarchically modified carbon-based energy-harvesting structural composite, capable of powering electronic devices such as a LED light from the power it generates when exposed to a temperature difference, and the overall results are among the highest ever presented in the field of energy-harvesting structural composites and printed carbon-based thermoelectrics. Both experimental measurements and simulations validated the TE performance. In addition, GFRP–GTEG showed a bending strength of 310 MPa and a flexural modulus of 21.3 GPa under room temperature (RT) and normal conditions (25 °C), retaining to a significant extent its mechanical properties while simultaneously providing the energy-harvesting capability. The aforementioned functional composite may be easily scaled-up, delivering potential for industrial-scale manufacturing of high-performance TEG-enabled structural composites.
1. Introduction
As the energy demands critically increase, it is vital to investigate further alternatives to energy production in order to satisfy our daily activities, while reducing CO2 emissions. Renewable energy sources have great potential to provide sufficient energy with reduced carbon footprint. The exploitation of waste heat and thermal energy recovery are major challenges towards sustainability for transport, energy and other industrial sectors.1–3 The conversion of thermal energy into electricity is a sustainable energy source that can be used to exploit waste dissipated heat, utilizing the Seebeck effect of thermoelectricity.4–6 The magnitude of this effect is characterized by the thermoelectric power (or as it is also known as the Seebeck coefficient), which is the result of the voltage difference per unit temperature difference between two points of a material (S = ΔV/ΔT). Materials that demonstrate a significant thermoelectric effect are known as thermoelectric (TE) materials. Some of the most used TE materials are tellurium, bismuth, lead telluride, bismuth telluride, zinc antimonide, silicon and germanium.1,2 A TE material effectively converts thermal energy into power when it exhibits a high Seebeck coefficient, low thermal conductivity and low electrical resistivity. The power factor (PF) is also used to determine the efficiency of thermoelectric materials and is described as PF = σ·S2, where σ corresponds to the electrical conductivity and S corresponds to the Seebeck coefficient. A high electrical conductivity is needed for a significant amount of current to pass through the TE material as the material generates electricity. The need for low thermal conductivity is to sustain a significant temperature gradient within the material.7 The dimensionless figure of merit (zT) of a TE material is described by: | (1) |
A thermoelectric generator (TEG) which typically consists of several thermoelements can recover significant amounts of thermal energy by directly converting this waste energy to electricity when subjected to temperature differences.
Lightweight structural composites such as fiber-reinforced polymers (FRPs) are being developed and adapted in multiple applications related to the aerospace, aeronautics, automotive, maritime, infrastructure and construction sectors. A glass-fiber polymer (GFRP) composite laminate usually consists of multiple glass-fiber fabric layers that are aligned in one or more directions. Composite science and technology have extensively dealt with the physical properties, the static and dynamic mechanical behavior, the interfacial characteristics, the aging (physical and environmental), and recycling of FRPs. Some recent studies have been published regarding structural composites with energy harvesting functionalities and more specifically on their capacity to generate thermoelectric energy.11–15 Multifunctional self-powered materials that can provide both structural and energy-harvesting functionalities are a very promising approach towards sustainability regarding the exploitation of waste energy.
Self-powered multifunctional devices are attractive for applications where the use of local power sources cannot be easily applied, places where wiring for power delivery is not desirable and devices where emergency power supply may be needed. Such innovative devices that are capable of being integrated within self-powered structures are capable of power-up low energy-consumption devices, e.g. Internet of Things (IoT) or Structural Health Monitoring (SHM) systems.16 Autonomous-SHM systems are important embedded technologies for future-generation structural composites so as to predict structural damage and avoid failures during service time. Although FRPs’ structural performance is well established, the multifunctionality of these materials is a topic of particular research interest.17
The thermoelements that constitute a TEG device need to maintain a significant temperature difference over time to achieve high efficiency. In numerous studies, multiple methods for increasing zT have been investigated, with particular attention to reducing both thermal conductivity and electrical resistivity. These studies include the formation of state-of-the-art alloy TE materials (e.g., PbTe–Ge,18 Pb0.75Sn0.25Te19), nanocrystalline compounds (e.g., Bi2Te320), nanostructured alloys (e.g., Bi–Sb–Te21 and Si–Ge22), halide perovskites,23 skutterudites,24 composites25 and copolymers.26
Large-scale TEG devices can only be realized if thermoelectric modules, consisting of efficient and cost-effective TE materials are produced. Multiple studies related to the enhancement of the generated thermopower refer to TE materials pointing out the following issues: high material and processing cost and production scale-up difficulty, TE material size limitation, insufficiently high zT values, implementation difficulty and inadequate mechanical performance.
Carbon-based TE materials are of particular interest as abundant non-toxic source materials are employed for their production, and their low mass is promising for high specific energy output. Carbon nanotubes (CNTs) have recently attracted great attention as parent materials for the development of printed Carbon Thermoelectric Generators (CTEGs) via ink dispensing technologies. This is due to both their notable phonon scattering properties and their extremely high electrical and mechanical properties. Moreover, CNTs possess tunable semiconducting characteristics as their n- or p-type behaviour may be tailored via specific doping strategies resulting in exceptional versatility in terms of TE properties.13,27–32
Various materials have been used as fillers in order to enable the thermoelectric functionality of structural laminated composites, namely carbon black, tellurium and/or bismuth telluride, achieving however quite low TE values.33–35
Kim et al. studied the thermoelectric characteristics of CF–epoxy composite materials, which behaved as p-type semiconductors. In this study, the generation of thermovoltage at a given temperature difference was shown. A CF–epoxy composite with dimensions 70 × 70 × 14 mm showed a quite low open-circuit voltage of 0.2 mV at ΔT = 60 °C.36
Han et al. studied the through-thickness TE behavior of carbon-fiber-reinforced polymer (CFRP) composites with varying filler incorporation using Te nanoparticles (∼13% of the composite), Bi–Te nanoparticles (1.6% of the composite) and carbon black (2.0% of the composite) at 8![[thin space (1/6-em)]](https://www.rsc.org/images/entities/char_2009.gif) :
:![[thin space (1/6-em)]](https://www.rsc.org/images/entities/char_2009.gif) 1 volume ratio of tellurium to bismuth telluride. A CFRP with dimensions 100 × 76 × 25 mm showed a thermoelectric open-circuit voltage of 15 mV at ΔT = 100 °C. Apart from the fact that the generated thermovoltage presented in this study is quite low, the effect of the incorporated filler on the mechanical behaviour of the composite was not considered.33
1 volume ratio of tellurium to bismuth telluride. A CFRP with dimensions 100 × 76 × 25 mm showed a thermoelectric open-circuit voltage of 15 mV at ΔT = 100 °C. Apart from the fact that the generated thermovoltage presented in this study is quite low, the effect of the incorporated filler on the mechanical behaviour of the composite was not considered.33
Karalis et al. examined a TEG-enabled structural CFRP incorporating interconnected carbon-fiber tows as thermoelements at the bottom composite lamina. The TEG-enabled CFRP device was able to generate a voltage output of 20 mV and a maximum power output of 0.9 μW, at a temperature difference of 75 °C. However, there is a significant difficulty in this case for large-scale manufacturing FRP-based TEG structures/devices.14
In a previous study, CNT-based TE glass fiber (GF) hierarchical reinforcements were produced to evaluate the thermoelectric response of the TE-functionalised GFs after the hierarchical modification with CNTs by subjecting the material to a temperature gradient. An open circuit thermovoltage VOC of 2 mV was achieved for a p-type thermoelement at ΔT = 100 °C.37 Following the previous study, the functional interphases of model epoxy composites incorporating nanocoated modified GFs with p- and n-type SWCNTs were evaluated for their mechanical and thermoelectric behavior. The interfacial shear strength (IFSS) was estimated by pull-out tests at low level for n-type and p-type model composites. As shown, the existence of the SDBS surfactant that was used as a dispersant of the SWCNTs in DI–water deteriorated the IFSS, resulting in a decrease in IFSS for each system compared to the reference ones. The TE performance of the coated GF tows was negligibly affected by the resin encapsulation.13 In a more recent study, a 16-ply GFRP–TEG composite consisting of interconnected TE-coated GF fabrics was able to achieve a Pmax of 2.2 μW at ΔT = 100 °C.11
In this study, aqueous, low-cost and resin-impregnated n- and p-semiconducting printed TE coatings based on SWCNT were developed. The manufactured TE films exhibited significant PFs of ∼82 and 96 μW m−1 K−2 correspondingly with excellent stability during lab-testing in an air-environment @ΔT = 100 °C. Motivated by these results, a fully printed GTEG-enabled GFRP device consisting of serially interconnected printed SWCNT-based thermoelements has been successfully designed and fabricated, demonstrating remarkable TE stability, performance, and mechanical strength, capable to generate power at temperature differences up to 100 °C and THot = 125 °C. The TEG-enabled GFRP structural composite consisting of 232 p-/n-TE pairs could deliver an impressive thermopower equal to 10![[thin space (1/6-em)]](https://www.rsc.org/images/entities/char_2009.gif) 108 μV K−1 @ΔT = 100 °C (where THot = 125 °C and TCold = 25 °C). The fabricated energy-harvesting structural composite has shown significant thermoelectric performance, achieving VOC = 1.01 V, ISC = 850 μA, internal resistance RTEG = 1188 Ohm, and a generated power output Pmax = 215 μW at ΔT = 100 °C (TC = 25 °C), while it retained its mechanical integrity.
108 μV K−1 @ΔT = 100 °C (where THot = 125 °C and TCold = 25 °C). The fabricated energy-harvesting structural composite has shown significant thermoelectric performance, achieving VOC = 1.01 V, ISC = 850 μA, internal resistance RTEG = 1188 Ohm, and a generated power output Pmax = 215 μW at ΔT = 100 °C (TC = 25 °C), while it retained its mechanical integrity.
2. Experimental section
2.1. Characterization
LabRAM Horiba (model HR800) was used to determine the crystallinity and purity of SWCNT-based thermoelectric materials (Horiba, Japan). Raman excitation was performed using an Ar+ laser at 514.5 nm with a power of 1.0 mW in the focal plane, visualizing all spectra in the range of 80–3600 cm−1. Viscosity measurements of the produced inks were performed using an NDJ-8S rotary viscometer. Surface morphological micrographs of the printed TE films on the GF fabrics were taken using a FEI-NanoSem-200, operating at 1.0 to 3.0 kV accelerating voltage (FEI, Netherlands). In addition, the Bruker Innova (Bruker, USA) Atomic Force Microscope (AFM) was utilized to investigate the surface morphology of the graphene nanotube-based films. The AFM was operating at 3.3 V and at tapping mode in f0 = 300 kHz with the RTESPA-300 Sb-doped Silicon probe.2.2. Thermoelectric properties and performance measurements
In order to characterize the thermoelectric properties of the manufactured GFRP–TEG device, the efficiency and the thermal stability of the printed films were carried out. By maintaining one block at room temperature (RT = TC = 25 °C) and heating the other block to varied degrees of temperature, thermopower was generated. The measurements were conducted in a lab setting with a mean pressure of 1 atm and a relative humidity of 55 ± 5%. The TC and TH (cold and hot boundary temperature, respectively) blocks were continuously controlled by K-type thermocouples and a Digital IR Thermometer OS-VIR50 (OMEGA Engineering Ltd, United Kingdom) for the accurate temperature difference (ΔT) monitoring. GFRP–GTEG's current and voltage generated under various temperature differences, were measured using the 3440 1Agilent DMM (Agilent Technologies, USA). An IR Imaging Camera UWAAA PRO Seek Thermal was utilized to capture IR images of the TE module. The efficiency and the performance of the structural GFRP–GTEG were computer-controlled by purposely made LabVIEW programs in order to deliver the V–I, P–I, V–Rload and P–Rload curves.The electrical conductivities of the printed materials were measured using the Ossila 4-point probe instrument (Ossila, United Kingdom). The conductivities that are presented are the averages of at least five measurements made on various samples. Using the STA 409 CD thermogravimetric analyser from NETZSCH GmbH (Selb, Germany), the thermal behavior of the generated materials was investigated, where the specimens were placed in a ceramic crucible and heated up with 10 °C min−1 heating rate under a 60 ml min−1 constant oxygen flow.
3. Materials and methods
3.1. Fabrication of n- and p-type graphene-based TE inks
The graphene nanotube powder (purity of carbon ≥80%) was acquired from OCSiAl (TUBALL™, Russia) with approximately a length of 5 μm and an outer diameter of 1.7 ± 0.5 nm. The p-type TE ink was produced via a solution/mixing process, adding the sodium dodecylbenzenesulfonate (SDBS) surfactant and nanotubes in deionized H2O (DI H2O). 2 mg ml−1 of SWCNTs and 2 mg ml−1 of SDBS were added in 100 ml of DI water, and the mixture was primarily stirred for 20 minutes. Subsequently, utilizing a pen-type sonicator UP400S (Hielscher, Germany), the mixture was tip-sonicated for 40 minutes, stirred again for 25 minutes, tip-sonicated for another 40 minutes and in the end stirred for 2.40 hours. The tip-sonication and mixing were carried out at 10 W and 1200 rpm, respectively. After completion of the SWCNT-dispersion process in DI–H2O, poly(3,4-ethylenedioxythiophene) polystyrene sulfonate (PEDOT![[thin space (1/6-em)]](https://www.rsc.org/images/entities/char_2009.gif) :
:![[thin space (1/6-em)]](https://www.rsc.org/images/entities/char_2009.gif) PSS) was added in 10
PSS) was added in 10![[thin space (1/6-em)]](https://www.rsc.org/images/entities/char_2009.gif) :
:![[thin space (1/6-em)]](https://www.rsc.org/images/entities/char_2009.gif) 5 ratio. For high-grade printable inks with significant TE efficiency, it is essential to produce dispersions with qualitative characteristics such as viscosity which significantly contributes to the adhesion of the ink to the substrate.38,39 This study demonstrated that the optimal printing viscosity was ca. 340 to 400 cP, corresponding to the selected dispersions.38,40 As observed, substantial amounts of SDBS are required for good dispersion of SWCNTs. Lower SDBS content leads to low-quality dispersions, which in turn create discontinuities in low-conductivity printed films, making them improper for industrial applications.
5 ratio. For high-grade printable inks with significant TE efficiency, it is essential to produce dispersions with qualitative characteristics such as viscosity which significantly contributes to the adhesion of the ink to the substrate.38,39 This study demonstrated that the optimal printing viscosity was ca. 340 to 400 cP, corresponding to the selected dispersions.38,40 As observed, substantial amounts of SDBS are required for good dispersion of SWCNTs. Lower SDBS content leads to low-quality dispersions, which in turn create discontinuities in low-conductivity printed films, making them improper for industrial applications.
The n-type graphene nanotube-based ink was produced via a facile and fast aqueous-based process, in which SDBS and graphene nanotubes were added in deionized water, in a manner like the p-type ink procedure as described above, using polyethyleneimine (PEI) for the n-doping of the CNTs in a ratio of 10![[thin space (1/6-em)]](https://www.rsc.org/images/entities/char_2009.gif) :
:![[thin space (1/6-em)]](https://www.rsc.org/images/entities/char_2009.gif) 20. PEI was used as an air-stable, low-cost and easy to process n-dopant. PEDOT:PSS, SDBS and PEI were supplied by Sigma-Aldrich (Merck, Germany). The production process and the dispersions of the SWCNT-based inks, as well as the mask-assisted process of the printed TE thin films, are depicted in Fig. S1 (ESI†).
20. PEI was used as an air-stable, low-cost and easy to process n-dopant. PEDOT:PSS, SDBS and PEI were supplied by Sigma-Aldrich (Merck, Germany). The production process and the dispersions of the SWCNT-based inks, as well as the mask-assisted process of the printed TE thin films, are depicted in Fig. S1 (ESI†).
3.2. Finite elements simulations: geometry, mesh generation and boundary conditions for the GFRP–GTEG module
The TE module was simulated utilizing the finite element analysis (FEA). The specific design of the fabricated structural laminate GFRP–GTEG was recreated numerically. The device hosted 232 p-/n-pairs of thermoelements and was simulated by using 29 individual TEG units in series connection where each GFRP–GTEG unit consists of 8 p-/n-pairs of thermoelements. FEA was employed for the numerical computational solution defining TE properties via coupled equations with the required boundary conditions, as indicated by the experimental device. The computational simulation generated electrical potentials and thermal fields, which may be rendered to temperature distributions, electrical potentials and voltage outputs for the TEG-enabled structural module. A more detailed description of the finite element analysis discretization is thoroughly described in the ESI† of this study.4. Results and discussion
4.1. Finite elements analysis of the TEG-enabled GFRP module
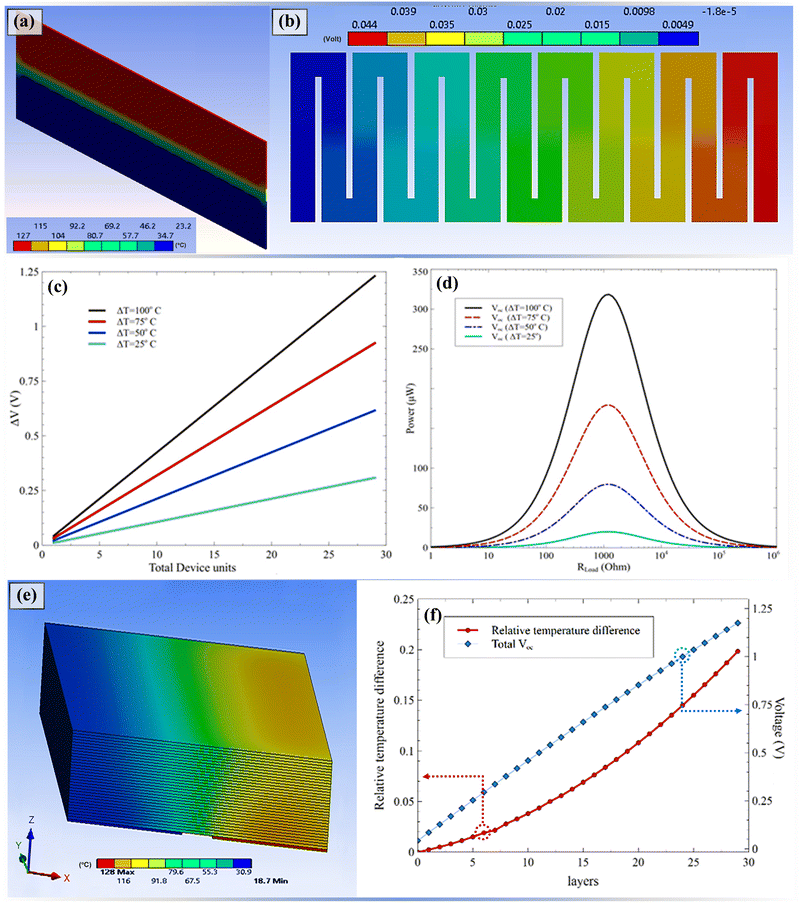
An FEA describing the thermoelectric performance of the CFRP–GTEG utilizing the coupled differential equations was performed. This enabled a full simulation after modelling of the manufactured module operational characteristics in various ΔTs. A discretized space of the 8 p-/n-pairs model approach was used to monitor the electrical potential and temperature variations. Fig. 1(a) depicts representative temperature profiles of the GFRP–GTEG.The computationally determined temperature variations showed a smooth distribution between the “hot” and the “cold” plates. The heat transmission within the GFRP–GTEG module was reflected by the smooth temperature decrease through the laminae that acted as independent thermal resistors. In Fig. 1(b), the calculated electrical potential distribution throughout the GFRP–GTEG unit is shown. A voltage drop is noticed when electrons pass through the serially interconnected n- and p-type semiconducting thermoelements.
The voltage difference between the last and the first semiconductors of the GFRP–GTEG unit is linked to the output voltage ΔV of the module and could be simulated for one (Fig. S2 and S3, ESI†) or multiple interconnected GFRP–GTEG units (Fig. 1(c) and (d)) at various temperature gradients, which enables the modelling of various operational conditions. For the numerical simulations, the temperature difference range of ΔT = 25, 50, 75 100 °C was employed. The ΔV (voltage difference) scaled linearly with ΔT, as predicted. The simulation data indicated a slope of 425 μV K−1 and a correlation coefficient of 0.999, as can be seen in Fig. S4a (ESI†).
The power and voltage output for the GFRP–GTEG unit and for multiple in linear fashion interconnected GFRP–GTEG units (total of 232 p-/n-pairs of semiconductor thermoelements) as a function of ΔT were calculated and shown in Fig. 1(c) and (d). The maximum electric power production was estimated to be Pmax,sim = 320 μW for the device hosting 29 GFRP–GTEG units/232 p-/n-pairs of semiconductor thermoelements at ΔT = 100 °C and was the maximum anticipated value. The power losses which were present during the experimental procedure reduced the power output to Pmax,exp = 215 μW. Fig. 1(e) illustrates the temperature distribution in the layered device consisting of 29 GFRP–GTEG units/layers presented for ΔT = 100 °C. A significant temperature drop on the hot side of the device was observed. In order to have a quantitative estimation of the temperature drop for devices with different numbers of GFRP–GTEG units/layers, the relative difference of the ‘hot’ region side (measured on the edge point of the ‘hot’ side of the last GFRP–GTEG unit/layer) with respect to the temperature of the ‘hot’ aluminum heat plate was computed and presented in Fig. 1(f). For 20 layers, the relative temperature drop is about 10%, while for 30 layers, the temperature drop was close to 25%. It was obvious that the layered devices hosting the same number of GFRP–GTEG units had poorer performance in terms of output voltage compared to their planar, linearly interconnected counterparts. For instance, the device with 29 GFRP–GTEG units/layers could potentially provide an output voltage of 1.11 V by adding the individual voltage output of each unit/layer (cumulative voltage shown in Fig. 1(f)), while the 29 GFRP–GTEG units in linear configuration would give 1.23 V, both at the same temperature difference ΔT = 100 °C.
4.2. Thermoelectric characterization, stability and properties
Aiming to produce optimal n- and p-type inks, multiple discrete SWCNT![[thin space (1/6-em)]](https://www.rsc.org/images/entities/char_2009.gif) :
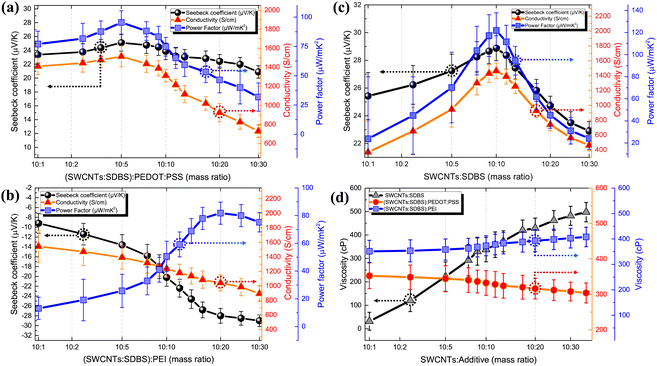
:![[thin space (1/6-em)]](https://www.rsc.org/images/entities/char_2009.gif) additive mass ratios were dispersed in DI water. Fig. 2 depicts the thermoelectric characterization and properties of the manufactured TE materials. Initially, a SWCNT-based aqueous dispersion was optimized using the commonly used SDBS surfactant. It was demonstrated that the ratio of the SWCNTs
additive mass ratios were dispersed in DI water. Fig. 2 depicts the thermoelectric characterization and properties of the manufactured TE materials. Initially, a SWCNT-based aqueous dispersion was optimized using the commonly used SDBS surfactant. It was demonstrated that the ratio of the SWCNTs![[thin space (1/6-em)]](https://www.rsc.org/images/entities/char_2009.gif) :
:![[thin space (1/6-em)]](https://www.rsc.org/images/entities/char_2009.gif) SDBS 10
SDBS 10![[thin space (1/6-em)]](https://www.rsc.org/images/entities/char_2009.gif) :
:![[thin space (1/6-em)]](https://www.rsc.org/images/entities/char_2009.gif) 10 is the optimal dispersion regarding the TE properties of the printed film as shown in Fig. 2(c).
10 is the optimal dispersion regarding the TE properties of the printed film as shown in Fig. 2(c).
After the optimal SWCNT-dispersion development process, n- and p-type TE inks were produced by the addition of PEDOT:PSS and PEI, respectively, at various mass ratios. Fig. 2(a) and (b) depicts the obtained Seebeck coefficients, electrical conductivities, and power factors of the p- and n-type printed and resin-impregnated TE films at various PEDOT:PSS and PEI mass ratios, respectively. As was described in the relevant paragraph to produce the ink, very low quantities of the SDBS surfactant result in a low-quality CNT dispersion, leading to a reduced-quality TE ink, rendering it inappropriate for making continuous films with acceptable conductive properties. The highest power factors of the produced TE materials were observed for the 10![[thin space (1/6-em)]](https://www.rsc.org/images/entities/char_2009.gif) :
:![[thin space (1/6-em)]](https://www.rsc.org/images/entities/char_2009.gif) 5 and 10
5 and 10![[thin space (1/6-em)]](https://www.rsc.org/images/entities/char_2009.gif) :
:![[thin space (1/6-em)]](https://www.rsc.org/images/entities/char_2009.gif) 20 per mass ratios for n- and p-type printed films, respectively with dimensions of 33 mm × 4 mm. All SWCNT-based printed films were produced by drop casting 300 μl of the TE ink using a micropipette on the GF fabric and dried at 85 °C for 35 min. When the (SWCNTs:SDBS)
20 per mass ratios for n- and p-type printed films, respectively with dimensions of 33 mm × 4 mm. All SWCNT-based printed films were produced by drop casting 300 μl of the TE ink using a micropipette on the GF fabric and dried at 85 °C for 35 min. When the (SWCNTs:SDBS)![[thin space (1/6-em)]](https://www.rsc.org/images/entities/char_2009.gif) :
:![[thin space (1/6-em)]](https://www.rsc.org/images/entities/char_2009.gif) PEDOT:PSS mass ratio reached 10
PEDOT:PSS mass ratio reached 10![[thin space (1/6-em)]](https://www.rsc.org/images/entities/char_2009.gif) :
:![[thin space (1/6-em)]](https://www.rsc.org/images/entities/char_2009.gif) 5, a small increase in the conductivity of the material was observed as the conductive PEDOT:PSS molecules contributed as energy filtering in-between SWCNTs.45 Above this ratio, it appeared that adding more PEDOT:PSS molecules deteriorated the electrical properties, without contributing significantly to the Seebeck coefficient.
5, a small increase in the conductivity of the material was observed as the conductive PEDOT:PSS molecules contributed as energy filtering in-between SWCNTs.45 Above this ratio, it appeared that adding more PEDOT:PSS molecules deteriorated the electrical properties, without contributing significantly to the Seebeck coefficient.
Regarding the n-type TE ink, increasing the (SWCNTs:SDBS)![[thin space (1/6-em)]](https://www.rsc.org/images/entities/char_2009.gif) :
:![[thin space (1/6-em)]](https://www.rsc.org/images/entities/char_2009.gif) PEI mass-ratio over 10
PEI mass-ratio over 10![[thin space (1/6-em)]](https://www.rsc.org/images/entities/char_2009.gif) :
:![[thin space (1/6-em)]](https://www.rsc.org/images/entities/char_2009.gif) 20 results in a reduction in electrical conductivity due to the presence of more PEI dielectric molecules intervening with the nanotubes, without however substantially affecting the Seebeck coefficient. Besides the excellent dispersion and homogeneity of the produced inks, they also exhibited very satisfactory viscosities of 350 and 400 cP for the n- and the p-type ink, respectively, as shown in Fig. 2(d). Therefore, they may also be considered for industrial-scale production processes, i.e. gravure, flexographic or slot-die printing.38–40
20 results in a reduction in electrical conductivity due to the presence of more PEI dielectric molecules intervening with the nanotubes, without however substantially affecting the Seebeck coefficient. Besides the excellent dispersion and homogeneity of the produced inks, they also exhibited very satisfactory viscosities of 350 and 400 cP for the n- and the p-type ink, respectively, as shown in Fig. 2(d). Therefore, they may also be considered for industrial-scale production processes, i.e. gravure, flexographic or slot-die printing.38–40
The stability of the printed p-type (SWCNTs:SDBS):PEDOT:PSS over-time as well as the n-type (SWCNTs:SDBS):PEI printed films were evaluated. Measurements of the electrical conductivity and the Seebeck coefficient of the resin-impregnated n- and p-type SWCNT films over a period of 90 days were conducted as shown in Fig. S5 (ESI†). The tests were performed at normal environmental conditions (≃25 °C, RH: 50 ± 5%, 1 atm). Minor changes in the Seebeck coefficient and the electrical conductivity equal to 2.8% were detected over the testing period, demonstrating that the produced n- and p-type SWCNT printed and resin-impregnated films displayed exceptional long-term stability in air. Simultaneously, efficient doping took place due to electron transfer between the nitrogen-induced atoms from the amine group of the PEI molecules on the CNTs, resulting in both stable and efficient n-type films.46,47 The p-type SWCNT positive Seebeck coefficient of the films is caused due to doping by oxygen in air leading to hole carriers.48,49
Since the primary goal of this study was to produce water-based inks for industrial-scale and facile printing applications, acidic treatment methods were not preferred for p-doping enhancement as referred to in previous studies.50–52 Nonetheless, the obtained PFs of the resin-impregnated TE films were 82 μW m−1 K−2 and 96 μW m−1 K−2 for n- and p-type printed films, respectively, which makes them among the highest reported values for aqueous and printable carbon-based materials.3,53–60 The significantly high power factors can be related to the exceptional conductivities of 1043 S cm−1 and 1514 S cm−1, along with the significant Seebeck coefficients of −28 μV K−1 and 25 μV K−1 of n- and p-type printed TE films, respectively.
4.3. Raman spectra and thermogravimetric analysis of n- and p-type films
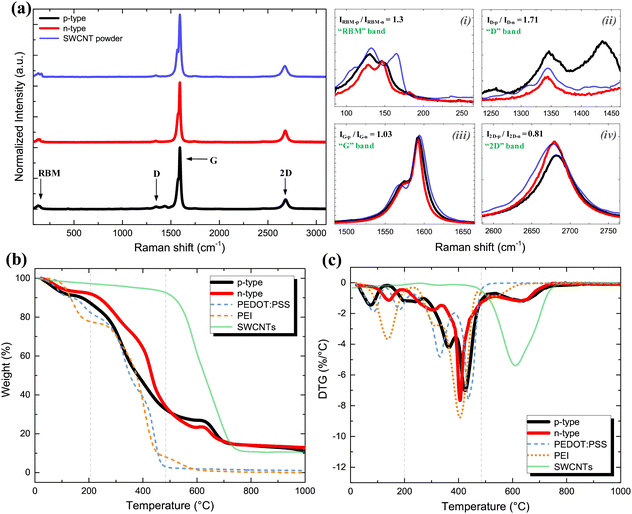
Normalized Raman spectra of both p-type (SWCNTs:SDBS):PEDOT:PSS and n-type (SWCNTs:SDBS):PEI printed TE films as well as the SWCNT powder are shown in Fig. 3(a). The main graphitic G′ band at ca. 1590 cm−1 and the disorder induced or D band were observed at ca. 1350 cm−1. The low intensity of the D band, compared to the G band located at ca. 1580 cm−1 for both SWCNT films, indicated a high crystal size and minimal defects.61 In comparison to the n-type, the p-type TE printed film had comparable intensities of both the G mode (at ca. 1580 cm−1) and the 2D mode (at ca. 2600 cm−1). This ascertained that no structural defects were induced via the doping process. The additional mode located at ca. 1435 cm−1 was due to the addition of PEDOT:PSS to the p-type material. The spectrum of PEDOT:PSS is shown in Fig. S6 (ESI†). Moreover, the radial breathing mode (RBM), with a less than 500 cm−1 resonance frequency, represented a bond-stretching phonon mode out-of-plane where all the atoms of carbon move cooperatively in the radial direction. Likewise, the n-type film's RBM zone exhibited nearly the same intensity as the p-type film's as well as the pristine SWCNT powder, implying no major barrier to carbon atom oscillations in the radial direction, also manifested by the excellent electrical conductivity of the n- and p-type TE films.Additionally, the thermal stability of both the p- and n-type morphologies was assessed using thermogravimetric analysis (TGA). This thermal study was performed to demonstrate the operational temperature limit for both p- and n-type morphologies and up to ΔT = 100 °C. Fig. 3(b) and (c) shows the thermal degradation of the p- and n-type, PEDOT:PSS, PEI and pristine SWCNTs. Zone “I” (0–200 °C) is believed to be due to adsorbed water within the materials, zone “II” (200–480 °C) marked the onset of burning of the polymers and small molecules (e.g. SDBS, PEI, PEDOT:PSS), and zone “III” (480–1000 °C) corresponds to the combustion of the SWCNTs together with other residual additives.
The approximately 14% remaining mass of both the CNT-based samples was related to the metal impurities due to the SWCNT production process, confirming the ≥80 carbon purity indicated by the manufacturer. Concluding, the SWCNT-based p- and n-type materials exhibited a stable TE behavior up to 100 °C, making them suitable for integrated TE applications within structural FRP laminate composites.
4.4. SEM & AFM microscopical characterization
The solid-state morphology and the dispersion quality of the printed n- and p-type TE films were investigated. Fig. 4 illustrates the SEM as well as the AFM images of the surface morphology of the n- and the p-type printed films on GF. As previously stated, these dispersions were produced in DI–water, drop casted using a micropipette onto a GF fabric and dried at 85 °C for 35 min. The SWCNT-based printed TE films exhibited comparably densely packed network architectures that effectively contribute to carrier transports, suggesting the production of well-dispersed p- and n-type inks. The p-type printed film network exhibited outstanding uniformity and continuity (Fig. 4(a)–(c)). A good dispersion of CNTs was also observed in the n-type printed film indicating that sufficient PEI molecules were attached to the CNT's surfaces (Fig. 4(d)–(f)), resulting in effective n-doping owing to electron transfer from the nitrogen anions (N−) derived from PEI to the nanotubes. The coating and the dispersion quality of the n-type PEI-doped SWCNT material are depicted in Fig. 4(d)–(f). In a previous work, the dispersibility of SWCNTs with SDBS and PEI in DI–water is also demonstrated.62 AFM images illustrated the morphologies of the representative samples. In Fig. 4(f), the increased concentration of the PEI molecules at the (SWCNT:SDBS):PEI dispersion is clearly shown in comparison with the p-type (SWCNT:SDBS):PEDOT:PSS film (Fig. 4(c)). In Fig. 4(b) and (e), characteristic ribbons which were formed during the during of the carbon nanotube inks can be traced.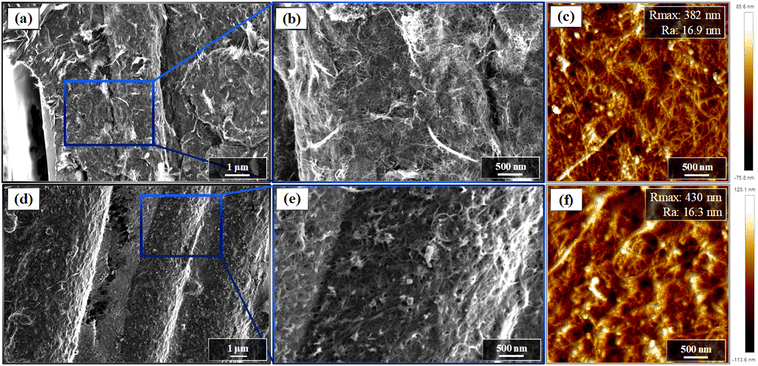 | ||
| Fig. 4 SEM and AFM micrographs of the dominant p- and n-type carbon-based materials, (a)–(c): p-type material, and (d)–(f): n-type material. | ||
These morphologies confer excellent conductive properties to the dry film due to the formation of prolonged Y-shaped intertube and interbundle junctions. The overall outcome of this process is the yield of conductivities for the n- and p-type printed films that reach 1043 S cm−1 and 1514 S cm−1, respectively. Intertube junctions, as is well known, govern the electrical conductivity of carbon nanotube films. As a consequence, it may be hypothesised that the more conductive molecules of PEDOT:PSS, as well as the lower ratio to the SWCNT:SDBS dispersion, offered greater interconnections between the nanotubes as compared to PEI, resulting in distinctly enhanced electrical conductivity for the produced printed TE film. To summarize, the thicker the molecule of the insulating/dielectric dopant, the more the carrier transport across the nanotubes is hindered resulting in a considerably reduced electrical conductivity.63
4.5. Fabrication of the GFRP–GTEG module
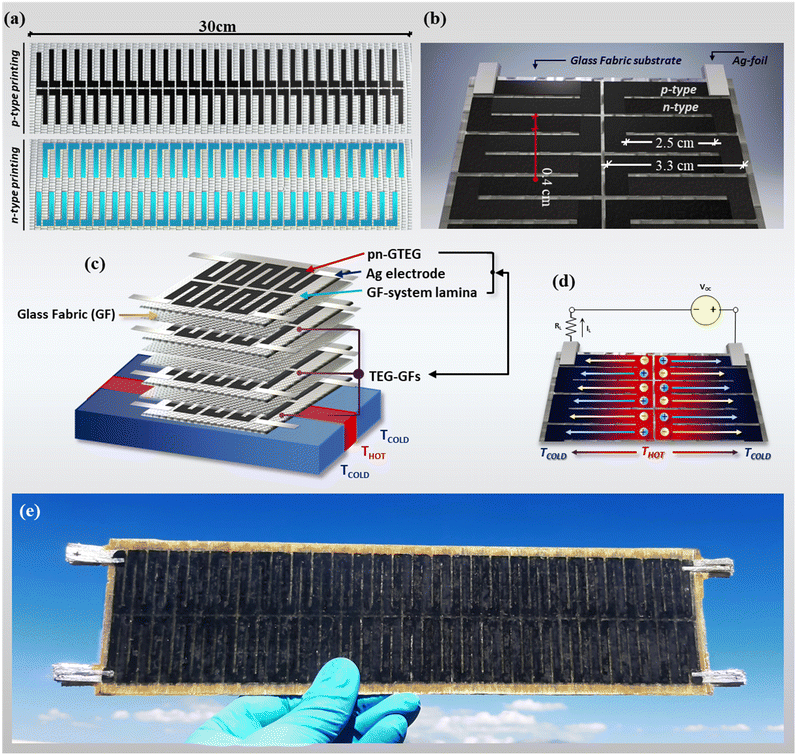
A structural GFRP-printed TEG module was manufactured via a facile printing process. 232 p-/n-pairs (∼0.26 mm thick) were printed on a Glass Fabric substrate using the produced inks. Fig. 5(a) illustrates the mask-assisted fabrication process of the GFRP–GTEG module. The TEG-enabled GFRP device has the dimensions of 32 cm × 7.1 cm × 2.1 mm. In the beginning, p-type TE ink was deposited on the unidirectional GF fabric. Afterwards, n-type TE ink was printed so that at the edge of the p-type thermoelement, electrical continuity was secured for successive p-/n-pairs. As indicated in Fig. 5(b), the element was 3.3 cm × 0.4 cm in dimension.After printing, the thermoelements/printed films of n- and p-type materials were dried at 85 °C for 35 minutes. The conductive nanotubes were used as electrodes to interconnect the thermoelements, resulting in a graphene-based TEG to avoid the use of metallic contacts. Four silver (Ag) foil electrodes were used as external electrodes of the GFRP–TEG module.
In order to exploit as much as possible power output of the module, the graphene-based printed TEG architecture was applied to 4 glass-fiber fabrics. The TEG-laminae were alternated with four insulating glass fabrics to make a [0/90]2s symmetrical and balanced cross-ply laminate, as shown in Fig. 5(c). Fig. 5(d) depicts the thermoelectrically generated carriers upon setting ΔT at the device boundaries as well as the GFRP–GTEG's module principle of operation and equivalent circuit. Finally, all of the glass-fiber fabrics/plies were impregnated using the commercial Araldite LY 5052 epoxy resin (Huntsman, USA) and laminated by hand lay-up realizing an 8-ply GTEG-enabled structural composite as shown in Fig. 5(e).
The GFRP–GTEG composite laminate was cured and post cured in accordance with the datasheet provided by the resin manufacturer. Typically, organic or inorganic TEGs are created by a p–n type alternating laying of the elements using a printed or evaporated metal deposition for the thermoelements connectivity.41–43 Nevertheless, when highly conductive SWCNTs are employed, the contact resistance of a metal/SWCNTs interconnection surpasses the internal resistance of the printed SWCNT-film itself, resulting in TEGs with diminished power output.44 In this study, the facile manufacturing process of a structural laminate, carbon-based and fully printed GFRP–TEG module is demonstrated.
The electrical conductivity of the used n- and p-type printed materials is 1043 S cm−1 and 1514 S cm−1, correspondingly. As an outcome of fabricating a metal-free TEG device, exclusively based on graphene-printed TE materials, is the demonstration of an efficient structural GFRP–GTEG module with remarkable thermoelectric performance. Having the experimental results as an indication of the efficiency of the manufactured GFRP–GTEG device, it is demonstrated that the proposed architecture, design and methodology employed in this work for the manufacturing of a structural laminate, a carbon-based and fully printed TEG, utilizes the maximum power throughput of the module, indicating a significant future potential for structural or even multifunctional power generation TEGs.
4.6. Performance and demonstration of the GFRP–GTEG device
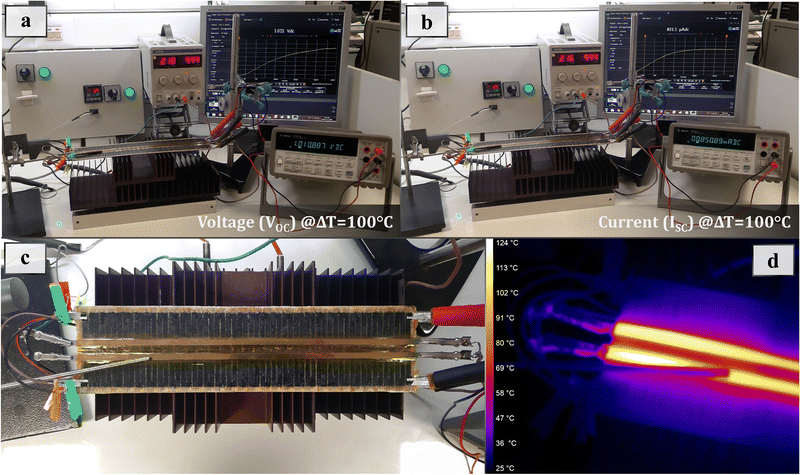
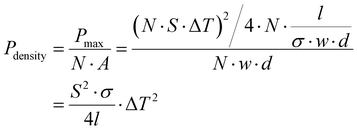
The manufactured GFRP–GTEG module exhibited an exceptional TE output, because of the remarkable TE properties of the n- and p-type printed thermoelements, created using the SWCNT-based semiconducting inks. The GFRP–GTEG was subsequently tested in the presence of a ΔT imposed from the centre and symmetric sides of the device in a planar direction and, due to the Seebeck effect, a substantial output voltage was yielded. In Fig. 6, the performance of the module in terms of thermoelectric voltage generation is shown for various ΔTs.The experiment took place under ambient conditions (TC ∼ 25 °C, 1 atm, RH: 50 ± 5%). The novel design of the structural GFRP–GTEG device with dimensions of 32 cm × 7.1 cm × 2.1 mm exhibited a total thermoelectric power generation of 10108 μV K−1 for a temperature difference set at ΔT = 100 °C. It should be mentioned that the manufactured GFRP–GTEG module demonstrated a remarkable TE efficiency without the use of metallic interconnections between consecutive thermoelements. The excellent conductivity of the TE films together with the small distance between the interconnected thermoelements led to this outcome. As previously noted, the contact resistance of a metallic interconnection and a printed CNT film is greater than the internal resistance of a metal or a printed CNT film alone, leading to a lower power output.44 This is not the case with our manufactured GFRP–GTEG, which utilizes just SWCNTs with excellent electrical conductivity. During the GFRP–TEG performance study, VOC = 1.01 V (open-circuit voltage) and ISC = 850 μA (short-circuit current) were recorded at ΔT = 100 °C with an RTEG = 1188 Ohm (internal resistance of the TEG). This yielded a remarkable power of 215 μW, as illustrated in Fig. 6 and 7 The GFRP–GTEG power density could be calculated using the following equation:64
 | (2) |
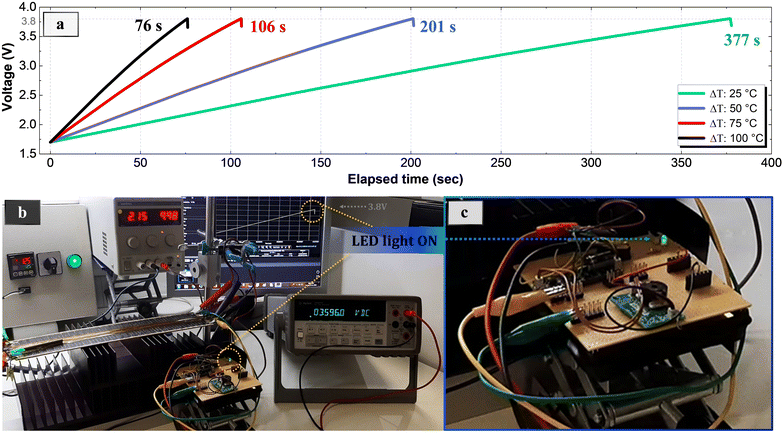
Fig. 7 depicts the thermoelectric power measurement set-up as well as the GFRP–GTEGs’ performance at ΔT = 100 °C. When the GFRP–GTEG's thermoelements were subjected to a temperature gradient, a large thermoelectric voltage was rapidly observed. Even at a temperature difference as low as ΔT = 25 °C, a power output of 19.5 μW was obtained. As a result, it is successfully exhibited that the produced multifunctional structure can be efficient in harvesting waste thermal energy in the ambient and converting it efficiently to electrical energy, providing significant potential for energy-harvesting structural parts. Hereafter, it will be shown that the satisfactory mechanical properties of GFRP–GTEG also facilitate the realization of multiple multifunctional structural applications. A more thorough explanation of the TE GFRP–GTEG performance may be found in Fig. S4 (ESI†). Following the previous experimentation, the GFRP–GTEG was used to power up an LED utilizing the commercial ALD-EH4295 step-up converter (Advanced Linear Devices, USA). In order for the commercial step-up converter to be capable of powering up the LED, it has to raise its internal voltage from 1.6 V to 3.8 V. The input power must be larger than the minimum value of 2 W in order to start charging the ALD-EH4295. Even at T = 10 K, the GFRP–GTEG could output 3.12 μW, which safely exceeded the minimal 2 μW required by the EH4295 to begin charging. Fig. S7 (ESI†) shows that under these settings, the manufactured GFRP–GTEG was able to switch a green LED within a charging period of 2357 s (∼39 min). Fig. 8(a) illustrates the charging time needed for the GFRP–GTEG to activate the EH4295 as a function of ΔT. Charging durations for the switching of the LED were 201 s and 76 s at T = 50 K and = 100 K, respectively. The employed setup together with the printed circuit board containing the ALD-EH4295 that was utilized to power up a commercial LED is depicted in Fig. 8(b). Fig. S8 (ESI†) illustrates a comparison between structural composite thermoelectric generators.
4.7. Mechanical tests and performance of the GFRP–GTEG device
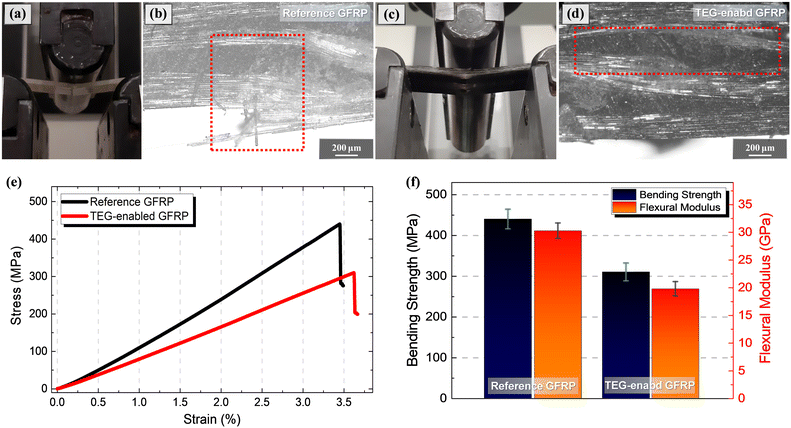
In order to evaluate the GFRP–GTEG device as a structural component, mechanical performance tests were conducted for reference and GTEG-enabled GFRP specimens. The outcomes of the 3-point bending experiments are shown in Fig. 9(a)–(d). Fig. 9(e) shows the stress–strain curve where deterioration in the mechanical behavior of the modified composite specimens was observed. Nevertheless, it was found that the maximum load of the TEG laminate specimens decreased by 31.2% and the displacement relative to the reference laminate till failure increased by 6%. The TEG-enabled laminate has a flexural strength of −32.3% and a flexural modulus of −33.4% when compared to reference GFRP laminate specimens. The lower strength values are attributed to the internal interfaces created by the printed SWCNT-based TE films onto the glass fiber laminates, which act as defects. Furthermore, the higher strain values are due to the interlaminar shear caused also by the printed TE films. More specifically, because the bending resistance is related to the specimen's thickness squared, the developing stress is inversely proportional to this quantity. The fracture images in Fig. 9(b) and (d) also show that the GFRP–GTEG laminate samples showed a distinct form of failure than the reference samples. In particular, the reference samples failed mainly because of bending, while the TEG samples exhibited multiple delaminations. The specimens’ greater thickness/span ratio made them more vulnerable to shear failure. Additionally, the SDBS surfactant may weaken the interlaminar strength of the composite, causing the specimens to fail in interlaminar shear, from both n- and p-type materials to the glass fabrics.As a consequence, the observed knockdown effect in mechanical characteristics was attributed to the integration of the functional printed TE materials into the GTEG-enabled FRP.
5. Conclusions
The objective of this study is to design, manufacture and demonstrate a high-performance integrated GTEG within a multifunctional structural laminate composite. The fabricated thermoelectrically enabled GFRP consisted of graphene nanotube-based printed TEG laminae within an 8-ply structural laminate composite. The graphene TE ink used for the printed TEG architecture was based on aqueous SWCNT dispersions and produced via facile methods and low-cost carbon materials. The fully printed all-carbon prototype structural GFRP–GTEG comprised serially interconnected n- and p-type thermoelectric printed elements. The graphene-based printed materials also served as interconnections for the electrical junction of the p-/n-thermoelements, as they exhibited enhanced electrical conductivity. The optimized n-type and p-type resin-impregnated printed TE films on GF substrate exhibited the noteworthy PFs of 82 μW m−1 K−2 and 96 μW m−1 K−2@ΔT = 100 K. The fabricated CFRP–GTEG was measured to have RTEG = 1188 Ω. When exposed to ΔT = 100 K, it exhibited VOC = 1.01 V and ISC = 850 μA corresponding to the remarkable power output of 215 μW. In this work, for the first time, it is demonstrated an interlaminar hierarchically modified carbon-based energy-harvesting structural composite, capable of powering electronic devices such as LED lights, and the overall results are among the highest ever presented in the field of energy-harvesting structural composites and printed carbon-based thermoelectrics.3,11,14,53–60 In addition, Finite Element simulations were performed to validate the experimental findings. The manufactured structural GFRP–GTEG with the capability of thermal energy-harvesting, is a significant step towards sustainable and advanced zero-energy consumption structures. It is also a promising realistic approach for a wide application range, even in remote areas where powering low-energy consuming electronics is essential to provide fully energy-autonomous solutions. The reported significant TE performance achieved via graphene-based printed TE films, provides significant potential for large-scale printable and industrial manufacturing of thermoelectrically enabled multifunctional structural laminate composites, which could potentially have a major impact on the renewable energy market.Author contributions
C. K. M. was involved in the production processes of the thermoelectric inks, the device architecture, the design, the manufacturing, and the characterization of the GFRP–GTEG. C. K. M., L. T. and G. K. involved in the thermoelectric and electrical characterization of the produced materials. C. K. M., A. S. P. and L. T. involved to the core idea development. K. T., and C. K. M. involved in the Raman and TGA measurements and the analysis of the printed films. M. L. involved in the SEM measurements, imaging and analysis. L. G. and E. L. contributed to the finite element simulation analysis of the GFRP–GTEG module. L. T. and A. S. P. were responsible for reviewing, editing and supervising the entire study.Conflicts of interest
There are no conflicts to declare.Acknowledgements
This study was co-financed by Greek National Funds and the European Union under the RESEARCH-CREATE-INNOVATE call through the operational programme: Competitiveness, Entrepreneurship & Innovation 2014-2020 (EPAnEK) with the project code: T1EDK-03480.References
- G. Tan, L.-D. Zhao and M. G. Kanatzidis, Chem. Rev., 2016, 116, 12123–12149 CrossRef CAS PubMed.
- X.-L. Shi, J. Zou and Z.-G. Chen, Chem. Rev., 2020, 120, 7399–7515 CrossRef CAS PubMed.
- J. L. Blackburn, A. J. Ferguson, C. Cho and J. C. Grunlan, Adv. Mater., 2018, 30, 1704386 CrossRef PubMed.
- M. G. Kanatzidis, in Semiconductors and Semimetals, ed. T. M. Tritt, Elsevier, 2001, vol. 69, pp. 51–100 Search PubMed.
- D. Beretta, N. Neophytou, J. M. Hodges, M. G. Kanatzidis, D. Narducci, M. Martin- Gonzalez, M. Beekman, B. Balke, G. Cerretti, W. Tremel, A. Zevalkink, A. I. Hofmann, C. Müller, B. Dörling, M. Campoy-Quiles and M. Caironi, Mater. Sci. Eng., R, 2019, 138, 100501 CrossRef.
- T. Kyratsi, AIP Conf. Proc., 2010, 1203, 700–705 CrossRef.
- A. J. Minnich, M. S. Dresselhaus, Z. F. Ren and G. Chen, Energy Environ. Sci., 2009, 2, 466–479 RSC.
- G. J. Snyder and A. H. Snyder, Energy Environ. Sci., 2017, 10, 2280–2283 RSC.
- Q. Jiang, J. Yang, P. Hing and H. Ye, Mater. Adv., 2020, 1, 1038–1054 RSC.
- S.-W. Chang, Y.-J. Chen, D. Wan and H.-L. Chen, J. Mater. Chem. A, 2023, 11, 15183–15195 RSC.
- G. Karalis, L. Tzounis, K. Tsirka, C. K. Mytafides, A. Voudouris Itskaras, M. Liebscher, E. Lambrou, L. N. Gergidis, N.-M. Barkoula and A. S. Paipetis, ACS Appl. Mater. Interfaces, 2021, 13(20), 24138–24153 CrossRef CAS PubMed.
- G. Karalis, C. K. Mytafides, L. Tzounis, A. S. Paipetis and N.-M. Barkoula, Materials, 2021, 14(9), 2173 CrossRef CAS PubMed.
- G. Karalis, K. Tsirka, L. Tzounis, C. Mytafides, L. Koutsotolis and A. S. Paipetis, Appl. Sci., 2020, 10(15), 5352 CrossRef CAS.
- G. Karalis, L. Tzounis, E. Lambrou, L. N. Gergidis and A. S. Paipetis, Appl. Energy, 2019, 253, 113512 CrossRef CAS.
- G. Karalis, L. Tzounis, K. Tsirka, C. K. Mytafides, M. Liebscher and A. S. Paipetis, Compos. Sci. Technol., 2022, 109291, DOI:10.1016/j.compscitech.2022.109291.
- I. Petsagkourakis, K. Tybrandt, X. Crispin, I. Ohkubo, N. Satoh and T. Mori, Sci. Technol. Adv. Mater., 2018, 19, 836–862 CrossRef CAS PubMed.
- D. D. L. Chung, Mater. Sci. Eng., R, 2017, 113, 1–29 CrossRef.
- P. Jood, M. Ohta, A. Yamamoto and M. G. Kanatzidis, Joule, 2018, 2, 1339–1355 CrossRef CAS.
- X. Ji, B. Zhang, Z. Su, T. Holgate, J. He and T. M. Tritt, Phys. Status Solidi A, 2009, 206, 221–228 CrossRef CAS.
- B. Zhu, X. Liu, Q. Wang, Y. Qiu, Z. Shu, Z. Guo, Y. Tong, J. Cui, M. Gu and J. He, Energy Environ. Sci., 2020, 13, 2106–2114 RSC.
- Z. Viskadourakis, A. Drymiskianaki, V. M. Papadakis, I. Ioannou, T. Kyratsi and G. Kenanakis, Materials, 2021, 14(7), 1706 CrossRef CAS PubMed.
- A. Samarelli, L. Ferre Llin, S. Cecchi, J. Frigerio, D. Chrastina, G. Isella, E. Müller Gubler, T. Etzelstorfer, J. Stangl, Y. Zhang, J. M. R. Weaver, P. S. Dobson and D. J. Paul, Solid-State Electron., 2014, 98, 70–74 CrossRef CAS.
- M. A. Haque, S. Kee, D. R. Villalva, W.-L. Ong and D. Baran, Adv. Sci., 2020, 7, 1903389 CrossRef CAS PubMed.
- M. Rull-Bravo, A. Moure, J. F. Fernández and M. Martín-González, RSC Adv., 2015, 5, 41653–41667 RSC.
- M. O. Faruk, A. Ahmed, M. A. Jalil, M. T. Islam, A. M. Shamim, B. Adak, M. M. Hossain and S. Mukhopadhyay, Appl. Mater. Today, 2021, 23, 101025 CrossRef.
- J. Guo, G. Li, H. Reith, L. Jiang, M. Wang, Y. Li, X. Wang, Z. Zeng, H. Zhao, X. Lu, G. Schierning, K. Nielsch, L. Liao and Y. Hu, Adv. Electron. Mater., 2020, 6, 1900945 CrossRef CAS.
- C. K. Mytafides, L. Tzounis, G. Karalis, P. Formanek and A. S. Paipetis, ACS Appl. Mater. Interfaces, 2021, 13, 11151–11165 CrossRef CAS PubMed.
- A. J. Paleo, B. Krause, M. F. Cerqueira, M. Melle-Franco, P. Pötschke and A. M. Rocha, Polymers, 2021, 14(22), 4803 CrossRef PubMed.
- K. Kröning, B. Krause, P. Pötschke and B. Fiedler, Nanomaterials, 2020, 10(6), 1144 CrossRef PubMed.
- M. T. Z. Myint, T. Nishikawa, K. Omoto, H. Inoue, Y. Yamashita, A. K. K. Kyaw and Y. Hayashi, Sci. Rep., 2020, 10, 7307 CrossRef CAS PubMed.
- M. Hada, T. Hasegawa, H. Inoue, M. Takagi, K. Omoto, D. Chujo, S. Iemoto, T. Kuroda, T. Morimoto, T. Hayashi, T. Iijima, T. Tokunaga, N. Ikeda, K. Fujimori, C. Itoh, T. Nishikawa, Y. Yamashita, T. Kiwa, S.-Y. Koshihara, S. Maeda and Y. Hayashi, ACS Appl. Energy Mater., 2019, 2, 7700–7708 CrossRef CAS.
- K. Jiang, S.-H. Hong, S.-H. Tung and C.-L. Liu, J. Mater. Chem. A, 2022, 10, 18792–18802 RSC.
- S. Han and D. D. L. Chung, Composites, Part A, 2013, 48, 162–170 CrossRef CAS.
- S. Han, J. T. Lin, Y. Yamada and D. D. L. Chung, Carbon, 2008, 46, 1060–1071 CrossRef CAS.
- S. Mardi, M. Pea, A. Notargiacomo, N. Yaghoobi Nia, A. D. Carlo and A. Reale, Materials, 2020, 13(6), 1404 CrossRef CAS PubMed.
- M. Kim, D. H. Sung, K. Kong, N. Kim, B.-J. Kim, H. W. Park, Y.-B. Park, M. Jung, S. H. Lee and S. G. Kim, Composites, Part B, 2016, 90, 37–44 CrossRef CAS.
- G. Karalis, C. Mytafides, A. Polymerou, K. Tsirka, L. Tzounis, L. N. Gergidis and A. S. Paipetis, Key Eng. Mater., 2020, 827, 252–257 Search PubMed.
- H. Kipphan, Handbook of Print Media, Springer, Heidelberg, Germany, 2001, pp. 1–202 DOI:10.1007/978-3-540-29900-4_1.
- K. Suganuma, Introduction to Printed Electronics, Springer, Osaka, Japan, 2014 Search PubMed.
- J. Park, S. Kim and C. Lee, Int. J. Precis. Eng. Manuf. - Green Technol., 2018, 5, 247–254 CrossRef.
- C. A. Hewitt, A. B. Kaiser, S. Roth, M. Craps, R. Czerw and D. L. Carroll, Nano Lett., 2012, 12, 1307 CrossRef CAS PubMed.
- S. L. Kim, K. Choi, A. Tazebay and C. Yu, ACS Nano, 2014, 8, 2377 CrossRef CAS PubMed.
- X. Cheng, X. Wang and G. Chen, J. Mater. Chem. A, 2018, 6, 19030–19037 RSC.
- J. Choi, Y. Jung, S. J. Yang, J. Y. Oh, J. Oh, K. Jo, J. G. Son, S. E. Moon, C. R. Park and H. Kim, ACS Nano, 2017, 11, 7608–7614 CrossRef CAS PubMed.
- Y. Yang, H. Deng and Q. Fu, Mater. Chem. Front., 2020, 4, 3130–3152 RSC.
- R. Lincoln, F. Scarpa, V. Ting and R. Trask, Multifunct. Mater., 2019, 2(4), 043001 CrossRef CAS.
- A. M. Karlsson and M. O. Adeoye, in Encyclopedia of Complexity and Systems Science, ed. R. A. Meyers, Springer, New York, New York, NY, 2009, pp. 1283–1302 DOI:10.1007/978-0-387-30440-3_86.
- K. Bradley, S.-H. Jhi, P. G. Collins, J. Hone, M. L. Cohen, S. G. Louie and A. Zettl, Phys. Rev. Lett., 2000, 85, 4361–4364 CrossRef CAS PubMed.
- P. G. Collins, K. Bradley, M. Ishigami and A. Zettl, Science, 2000, 287, 1801 CrossRef CAS PubMed.
- J. L. Blackburn, T. M. Barnes, M. C. Beard, Y.-H. Kim, R. C. Tenent, T. J. McDonald, B. To, T. J. Coutts and M. J. Heben, ACS Nano, 2008, 2, 1266–1274 CrossRef CAS PubMed.
- R. C. Tenent, T. M. Barnes, J. D. Bergeson, A. J. Ferguson, B. To, L. M. Gedvilas, M. J. Heben and J. L. Blackburn, Adv. Mater., 2009, 21, 3210–3216 CrossRef CAS.
- W. Zhou, J. Vavro, N. M. Nemes, J. E. Fischer, F. Borondics, K. Kamarás and D. B. Tanner, Phys. Rev. B: Condens. Matter Mater. Phys., 2005, 71, 205423 CrossRef.
- Y. Nonoguchi, K. Ohashi, R. Kanazawa, K. Ashiba, K. Hata, T. Nakagawa, C. Adachi, T. Tanase and T. Kawai, Sci. Rep., 2013, 3, 3344 CrossRef PubMed.
- C. Cho, B. Stevens, J.-H. Hsu, R. Bureau, D. A. Hagen, O. Regev, C. Yu and J. C. Grunlan, Adv. Mater., 2015, 27, 2996–3001 CrossRef CAS PubMed.
- W. Zhou, Q. Fan, Q. Zhang, L. Cai, K. Li, X. Gu, F. Yang, N. Zhang, Y. Wang, H. Liu, W. Zhou and S. Xie, Nat. Commun., 2017, 8, 14886 CrossRef CAS PubMed.
- H. Wang, J.-H. Hsu, S.-I. Yi, S. L. Kim, K. Choi, G. Yang and C. Yu, Adv. Mater., 2015, 27, 6855–6861 CrossRef CAS PubMed.
- C. K. Mai, B. Russ, S. L. Fronk, N. Hu, M. B. Chan-Park, J. J. Urban, R. A. Segalman, M. L. Chabinyc and G. C. Bazan, Energy Environ. Sci., 2015, 8, 2341 RSC.
- T. Fukumaru, T. Fujigaya and N. Nakashima, Sci. Rep., 2015, 5, 7951 CrossRef CAS PubMed.
- C. Wan, X. Gu, F. Dang, T. Itoh, Y. Wang, H. Sasaki, M. Kondo, K. Koga, K. Yabuki, G. J. Snyder, R. Yang and K. Koumoto, Nat. Mater., 2015, 14, 622 CrossRef CAS PubMed.
- S. L. Kim, K. Choi, A. Tazebay and C. Yu, ACS Nano, 2014, 8, 2377–2386 CrossRef CAS PubMed.
- M. S. Dresselhaus, G. Dresselhaus, R. Saito and A. Jorio, Phys. Rep., 2005, 409, 47–99 CrossRef.
- D. D. Freeman, K. Choi and C. Yu, PLoS One, 2012, 7, e47822 CrossRef CAS PubMed.
- H.-Z. Geng, K. K. Kim, K. P. So, Y. S. Lee, Y. Chang and Y. H. Lee, J. Am. Chem. Soc., 2007, 129, 7758–7759 CrossRef CAS PubMed.
- Y. Lu, Y. Ding, Y. Qiu, K. Cai, Q. Yao, H. Song, L. Tong, J. He and L. Chen, ACS Appl. Mater. Interfaces, 2019, 11, 12819–12829 CrossRef CAS PubMed.
- M.-H. Lee, Y. H. Kang, J. Kim, Y. K. Lee and S. Y. Cho, Adv. Energy Mater., 2019, 9, 1900914 CrossRef.
Footnote |
| † Electronic supplementary information (ESI) available. See DOI: https://doi.org/10.1039/d3ma01000g |
| This journal is © The Royal Society of Chemistry 2024 |

