Rapid production of 38 mM H2O2 in an alcoholic suspension of a WO3 photocatalyst under visible light†
Hiroshi
Kominami
 *a,
Kaisei
Kamitani
b and
Atsuhiro
Tanaka
ac
aDepartment of Applied Chemistry, Faculty of Science and Engineering, Kindai University, 3-4-1, Kowakae, Higashiosaka, Osaka 577-8502, Japan. E-mail: hiro@apch.kindai.ac.jp
bDepartment of Molecular and Material Engineering, Graduate School of Science and Engineering, Kindai University, 3-4-1, Kowakae, Higashiosaka, Osaka 577-8502, Japan
cPrecursory Research for Embryonic Science and Technology (PRESTO), Japan Science and Technology Agency (JST), 4-1-8 Honcho, Kawaguchi 332-0012, Japan
First published on 31st May 2024
Abstract
Specific approaches to H2O2 production over a WO3 photocatalyst under visible light irradiation, i.e., (1) no use of a cocatalyst, (2) reaction under an O2 atmosphere, (3) reaction in a high concentration of alcohol, and (4) reaction at 60 °C, were found to be effective for rapid production of 38 mM H2O2.
Hydrogen peroxide (H2O2) is a versatile chemical compound that is used in various applications including applications in pharmaceuticals, organic synthesis, and semiconductor manufacturing processes.1 It is also gaining attention for its potential to reduce costs and promote environmental conservation in chemical production post-processing. The reaction of H2O2 produces only water and oxygen as by-products. However, the anthraquinone method, which is currently the mainstream industrial method for producing H2O2, is a multi-step process that consumes a significant amount of energy, introduces hydrogen gas, and requires toxic organic solvents. Therefore, a more efficient and cleaner method for synthesizing H2O2 is necessary.
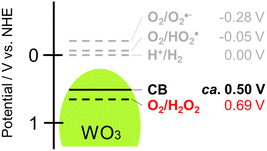
One method for producing H2O2 is through photocatalysis using semiconductors.2 When a semiconductor is irradiated by light of which the energy is larger than the band gap, photogenerated electrons in the conduction band (CB) and positive holes in the valence band cause reduction and oxidation, respectively. It was reported that organic and inorganic semiconductor photocatalysts such as titanium(IV) oxide (TiO2),3,4 carbon nitride (C3N4),5,6 cadmium sulfide7 and metal organic frameworks (MOFs)8 generate H2O2 by two-electron reduction of O2 (O2 + 2e− + 2H+→ H2O2, E° = +0.69 V vs. NHE)9 in the presence of an appropriate hole scavenger (Fig. 1). However, since the CB of these photocatalysts is rather negative, oxygen radicals such as ˙O2− and ˙HO2 can also be formed by one-electron reduction of O2 (O2 + e− + H+ → ˙O2H, E° = −0.05 V vs. NHE), resulting in less efficiency (or selectivity) for H2O2 production. In addition, since H2O2 decomposes with irradiation of UV light,10 TiO2 might be eliminated from candidates for an efficient H2O2-producing photocatalyst. We reached the idea that tungsten(VI) oxide (WO3) would be an ideal photocatalyst for H2O2 production for two reasons: (1) tungsten(VI) oxide works under irradiation of visible light (band gap: 2.8 eV), which reduces the possibility of H2O2 decomposition by UV light, and (2) the bottom of the CB of WO3 (+0.50 V vs. NHE) is located under the potential for one-electron reduction of O2 but over the potential for two-electron reduction of O2, which eliminates the possibility of H2O2 decomposition induced by active oxygen species formed by one-electron reduction of O2 (Fig. 1).
The concentration of H2O2 ([H2O2]) is expressed as a function of reaction time (t)3 (eqn (1)), assuming that the photocatalytic H2O2 production kinetics is in the zero order and photocatalytic H2O2 consumption is in the first order of its concentration,
 | (1) |
The equilibrium (saturated) concentration of H2O2 ([H2O2]∞) is calculated from eqn (2),
 | (2) |
From the kinetic consideration, the strategy for rapid production of H2O2 with a high concentration is to simultaneously satisfy a large kf and a small kd toward the WO3 photocatalyst. The tactic for achieving a small kd is not to use a cocatalyst because a cocatalyst induces the decomposition of H2O2 as well as acceleration of O2 reduction.
In this study, to compensate for the loss of the cocatalyst effect and to further increase the rate of H2O2 production by O2 reduction over a cocatalyst-free WO3 photocatalyst under visible light irradiation, several methods for achievement of a larger kf and a high concentration of H2O2 were investigated. We found that rapid production of 38 mM H2O2 was achieved by a very simple reaction system, i.e., cocatalyst-free WO3 in an alcohol–water solvent with a high alcohol content under O2 at a slightly elevated temperature.
Fig. 2a shows the time courses of photocatalytic H2O2 production by O2 reduction in a 2-propanol–water (9![[thin space (1/6-em)]](https://www.rsc.org/images/entities/char_2009.gif) :
:![[thin space (1/6-em)]](https://www.rsc.org/images/entities/char_2009.gif) 1) suspension of WO3 at various temperatures under visible light irradiation. At 27 °C, the H2O2 concentration reached 4.8 mM at 4 h, which is much larger than that reported for cocatalyst-free WO3 (8.55 × 10⁻³ mM at 5 h) and still larger than that of Au–WO3 (1.2 mM at 5 h) in a 4% ethanol aqueous solution,11 although the reaction conditions such as the kind of WO3, alcohol concentration, and light intensity were different. The large difference between our result and the reported results suggests that the rate of H2O2 production and H2O2 concentration can be further increased by controlling the reaction conditions. No H2O2 was produced in the absence of WO3.
1) suspension of WO3 at various temperatures under visible light irradiation. At 27 °C, the H2O2 concentration reached 4.8 mM at 4 h, which is much larger than that reported for cocatalyst-free WO3 (8.55 × 10⁻³ mM at 5 h) and still larger than that of Au–WO3 (1.2 mM at 5 h) in a 4% ethanol aqueous solution,11 although the reaction conditions such as the kind of WO3, alcohol concentration, and light intensity were different. The large difference between our result and the reported results suggests that the rate of H2O2 production and H2O2 concentration can be further increased by controlling the reaction conditions. No H2O2 was produced in the absence of WO3.
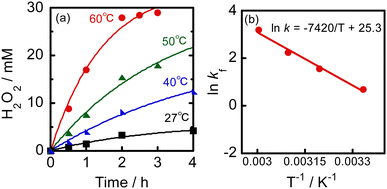
Fig. 2a shows that a slight increase in reaction temperature significantly increased both the rate of H2O2 production and concentration of H2O2. After 2 h at 60 °C, the concentration of H2O2 surprisingly reached 28 mM and thereafter remained largely unchanged. Kao et al.12 provide a summary of the concentrations of H2O2 produced in various photocatalytic systems, along with the reaction conditions, in the supporting information of their paper. The rate and concentration of H2O2 production in our reaction system exceed those previously reported. For example, Teranishi et al.13 reported that the concentration of H2O2 reached 17 mM after 23 h in a 4% ethanol–water suspension of Au/TiO2 under UV light irradiation. The concentration of H2O2 increased to 11 mM after 8 h over modified Au/TiO2 in an aqueous solution containing 3.2 vol% formic acid.12 In previous studies, Au was mainly used as the sole cocatalyst for H2O2 production because of its effectiveness in catalyzing O2 reduction and low activity for H2O2 decomposition. All of the studies were conducted at room temperature without considering the reaction temperature. Our results indicate that a significant amount of H2O2 can be produced rapidly by raising the reaction temperature by only about 30 °C, without the need for an Au cocatalyst. To clarify the effect of an Au cocatalyst, 0.3 wt% Au/WO3 was prepared using the photodeposition method and used for H2O2 production under the same conditions as those for cocatalyst-free WO3. The reaction was carried out in a 2-propanol–water (9![[thin space (1/6-em)]](https://www.rsc.org/images/entities/char_2009.gif) :
:![[thin space (1/6-em)]](https://www.rsc.org/images/entities/char_2009.gif) 1) solution under O2 at 60 °C with visible light irradiation (Fig. S1, ESI†). The concentration of H2O2 after 2 h was 12 mM, which was less than half of that produced by Au-free WO3, although the reaction rate and concentration were much larger than those previously reported.
1) solution under O2 at 60 °C with visible light irradiation (Fig. S1, ESI†). The concentration of H2O2 after 2 h was 12 mM, which was less than half of that produced by Au-free WO3, although the reaction rate and concentration were much larger than those previously reported.
To better understand the production of 28 mM H2O2 at 2 h in a 2-propanol–water (9![[thin space (1/6-em)]](https://www.rsc.org/images/entities/char_2009.gif) :
:![[thin space (1/6-em)]](https://www.rsc.org/images/entities/char_2009.gif) 1) suspension of metal-free WO3 at various temperatures, we analyzed the kinetics. Table 1 shows the rate constants of H2O2 production and consumption (kf and kd), which were determined from curve fitting of experimental results (Fig. 2a) using eqn (1). Simulation curves using kf and kd were well-fitted to the results. The value of kf at 27 °C (2.0 mM h−1) was much larger than that reported for Au–WO3 (0.36 mM h−1).11 This indicates that the amount of alcohol and O2 pressure greatly affect H2O2 production by a WO3 photocatalyst, regardless of the use of an Au cocatalyst. As the reaction temperature was increased, the value of kf greatly increased and the value at 60 °C (20 mM h−1) was ten-times larger than that of cocatalyst-free WO3 at 27 °C. These results suggest that increasing the reaction temperature is a simple yet highly efficient approach to rapidly produce H2O2 with a high concentration using cocatalyst-free WO3 photocatalysis under visible light irradiation. The kinetics of Au–WO3 at 60 °C were also analyzed and its rate constants (kf and kd) are also shown in Table 1. The value of kf of Au–WO3 at 60 °C was much smaller than that of Au-free WO3 at the same temperature. As predicted, the value of kd of Au–WO3 at 60 °C was larger than that of Au-free WO3 at the same temperature. A comparison of the kinetic parameters between Au-free WO3 and Au–WO3 at 60 °C suggests that our approach of operating the reaction in an alcohol–water solvent with a high alcohol content under O2 at a slightly elevated temperature without using a cocatalyst is appropriate for achieving rapid production and a high concentration of H2O2.
1) suspension of metal-free WO3 at various temperatures, we analyzed the kinetics. Table 1 shows the rate constants of H2O2 production and consumption (kf and kd), which were determined from curve fitting of experimental results (Fig. 2a) using eqn (1). Simulation curves using kf and kd were well-fitted to the results. The value of kf at 27 °C (2.0 mM h−1) was much larger than that reported for Au–WO3 (0.36 mM h−1).11 This indicates that the amount of alcohol and O2 pressure greatly affect H2O2 production by a WO3 photocatalyst, regardless of the use of an Au cocatalyst. As the reaction temperature was increased, the value of kf greatly increased and the value at 60 °C (20 mM h−1) was ten-times larger than that of cocatalyst-free WO3 at 27 °C. These results suggest that increasing the reaction temperature is a simple yet highly efficient approach to rapidly produce H2O2 with a high concentration using cocatalyst-free WO3 photocatalysis under visible light irradiation. The kinetics of Au–WO3 at 60 °C were also analyzed and its rate constants (kf and kd) are also shown in Table 1. The value of kf of Au–WO3 at 60 °C was much smaller than that of Au-free WO3 at the same temperature. As predicted, the value of kd of Au–WO3 at 60 °C was larger than that of Au-free WO3 at the same temperature. A comparison of the kinetic parameters between Au-free WO3 and Au–WO3 at 60 °C suggests that our approach of operating the reaction in an alcohol–water solvent with a high alcohol content under O2 at a slightly elevated temperature without using a cocatalyst is appropriate for achieving rapid production and a high concentration of H2O2.
![[thin space (1/6-em)]](https://www.rsc.org/images/entities/char_2009.gif) :
:![[thin space (1/6-em)]](https://www.rsc.org/images/entities/char_2009.gif) 1) suspension of WO3 at various temperatures under irradiation of visible light
1) suspension of WO3 at various temperatures under irradiation of visible light
The thermal effects on H2O2 production over metal-free WO3 were analyzed, and Fig. 2b shows an Arrhenius plot. A linear correlation was observed between the logarithm of the rate constant for H2O2 production (ln![[thin space (1/6-em)]](https://www.rsc.org/images/entities/char_2009.gif) kf) and reciprocal temperature (T−1). The apparent activation energy (Ea) and the frequency factor (A) were determined to be 62 kJ mol−1 and 9.8 × 10¹⁰ mM h−1, respectively, under the present reaction conditions. These kinetic parameters clarify the characteristics of photocatalytic H2O2 formation over cocatalyst-free WO3 under the present conditions. The large activation energy suppresses a rate-determining process at around room temperature, either O2 reduction or 2-propanol oxidation on the surface of WO3. This difficulty can be overcome by a slight increase in the reaction temperature. Interestingly, the effect of reaction temperature on kd of WO3 was considerably less than the effect on kf (refer to Table 1). This may be a characteristic of cocatalyst-free WO3. At elevated temperatures, the large increase in kf value and the slight increase in kd value result in a larger kf/kd value (Table 1), leading to rapid H2O2 production and large H2O2 concentration. A thermal effect on H2O2 production was observed only under light irradiation (Fig. S2, ESI†). In the dark at 60 °C, H2O2 was consumed, while the amount of acetone increased, indicating that oxidation of 2-propanol by H2O2 occurred over WO3.
kf) and reciprocal temperature (T−1). The apparent activation energy (Ea) and the frequency factor (A) were determined to be 62 kJ mol−1 and 9.8 × 10¹⁰ mM h−1, respectively, under the present reaction conditions. These kinetic parameters clarify the characteristics of photocatalytic H2O2 formation over cocatalyst-free WO3 under the present conditions. The large activation energy suppresses a rate-determining process at around room temperature, either O2 reduction or 2-propanol oxidation on the surface of WO3. This difficulty can be overcome by a slight increase in the reaction temperature. Interestingly, the effect of reaction temperature on kd of WO3 was considerably less than the effect on kf (refer to Table 1). This may be a characteristic of cocatalyst-free WO3. At elevated temperatures, the large increase in kf value and the slight increase in kd value result in a larger kf/kd value (Table 1), leading to rapid H2O2 production and large H2O2 concentration. A thermal effect on H2O2 production was observed only under light irradiation (Fig. S2, ESI†). In the dark at 60 °C, H2O2 was consumed, while the amount of acetone increased, indicating that oxidation of 2-propanol by H2O2 occurred over WO3.
Fig. 3 shows an absorption spectrum of WO3 and an action spectrum of H2O2 production in a 2-propanol–water (9![[thin space (1/6-em)]](https://www.rsc.org/images/entities/char_2009.gif) :
:![[thin space (1/6-em)]](https://www.rsc.org/images/entities/char_2009.gif) 1) suspension of WO3 obtained at 60 °C. The change in AQE against wavelength of light was similar to that in light absorption of WO3, suggesting that H2O2 production was induced by photoabsorption of WO3. It should be noted that the value of AQE at 450 ± 10 nm (55%) was quite large, which means that H2O2 production by O2 reduction proceeds very efficiently over WO3 under the present conditions. The value of AQE was almost the same in contrast to the further increase in the photoabsorption at 400 ± 10 nm. Since inevitable consumption of H2O2 by 2-propanol oxidation occurs, H2O2 production may be almost saturated at 450 nm under the present conditions.
1) suspension of WO3 obtained at 60 °C. The change in AQE against wavelength of light was similar to that in light absorption of WO3, suggesting that H2O2 production was induced by photoabsorption of WO3. It should be noted that the value of AQE at 450 ± 10 nm (55%) was quite large, which means that H2O2 production by O2 reduction proceeds very efficiently over WO3 under the present conditions. The value of AQE was almost the same in contrast to the further increase in the photoabsorption at 400 ± 10 nm. Since inevitable consumption of H2O2 by 2-propanol oxidation occurs, H2O2 production may be almost saturated at 450 nm under the present conditions.
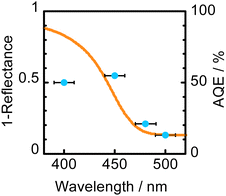 | ||
Fig. 3 Absorption spectrum of WO3 and action spectrum of H2O2 production in a 2-propanol–water (9![[thin space (1/6-em)]](https://www.rsc.org/images/entities/char_2009.gif) : :![[thin space (1/6-em)]](https://www.rsc.org/images/entities/char_2009.gif) 1) suspension of WO3 obtained at 60 °C. 1) suspension of WO3 obtained at 60 °C. | ||
Fig. 4 shows the effect of 2-propanol content in 2-propanol–water solvents on H2O2 production for 1 h in a suspension of WO3 at 60 °C. The H2O2 yield increased with an increase in the 2-propanol content and the yield reached the maximum at 90% of 2-propanol. The yield decreased when the reaction was carried out in neat 2-propanol. One of the reasons for the larger yield in solvents having larger 2-propanol contents is that positive holes were effectively trapped by 2-propanol adsorbed on the surface of WO3, resulting in efficient reduction of O2 with photogenerated electrons. Another reason is the larger solubility of O2 in solvents having larger 2-propanol contents,14–16 which directly increases the rate of O2 reduction (electron trapping by O2). The decrease in the yield in neat 2-propanol suggests that the presence of H2O is necessary as the hydrogen source and/or stabilization of H2O2 in the solvent.
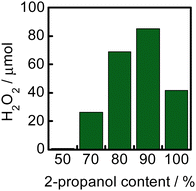 | ||
| Fig. 4 Effect of the 2-propanol content in a 2-propanol–water solvent on H2O2 production for 1 h in a suspension of WO3 at 60 °C. | ||
After reaching 28 mM at 2 h, the H2O2 concentration did not increase in a 2-propanol–water (9![[thin space (1/6-em)]](https://www.rsc.org/images/entities/char_2009.gif) :
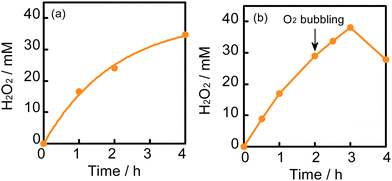
:![[thin space (1/6-em)]](https://www.rsc.org/images/entities/char_2009.gif) 1) suspension of WO3 at 60 °C, although the equilibrium concentration was expected to be 51 mM from the value of kf/kd (eqn (1) and Table 1). Table 2 shows the amounts of H2O2 and acetone in the liquid phase and the amount of O2 in the gas phase at various times at 60 °C. If the ideal reaction (O2 + 2-propanol → H2O2 + acetone) occurs, the ratio of [H2O2]/[acetone] should be unity. However, the observed values were less than unity, as shown in Table 2. This suggests that a subsequent reaction consuming H2O2 (H2O2 + 2-propanol → 2H2O + acetone) occurs in part and inevitably. We also noted that O2 was greatly consumed along with H2O2 production (approximately half being consumed after 2 h), as shown in Table 2. The decrease in the partial pressure of O2 in the gas phase also reduces the O2 concentration in the liquid phase, resulting in a decrease in the rate of H2O2 production. Another reason for the saturation of the H2O2 concentration may be the deactivation of WO3, which will be discussed later. To increase the H2O2 concentration, two methods, (1) connection with an O2 balloon and (2) re-bubbling with O2, were investigated. When an O2 balloon was connected to the reactor, the H2O2 concentration increased after 2 h and finally reached 34 mM after 4 h (Fig. 5a). In the case of re-bubbling with O2 at 2 h, the H2O2 concentration reached 38 mM after an additional 1 h (total of 3 h) light irradiation (Fig. 5b). These results indicate that O2 pressure is one of the important factors for achieving a high concentration of H2O2.
1) suspension of WO3 at 60 °C, although the equilibrium concentration was expected to be 51 mM from the value of kf/kd (eqn (1) and Table 1). Table 2 shows the amounts of H2O2 and acetone in the liquid phase and the amount of O2 in the gas phase at various times at 60 °C. If the ideal reaction (O2 + 2-propanol → H2O2 + acetone) occurs, the ratio of [H2O2]/[acetone] should be unity. However, the observed values were less than unity, as shown in Table 2. This suggests that a subsequent reaction consuming H2O2 (H2O2 + 2-propanol → 2H2O + acetone) occurs in part and inevitably. We also noted that O2 was greatly consumed along with H2O2 production (approximately half being consumed after 2 h), as shown in Table 2. The decrease in the partial pressure of O2 in the gas phase also reduces the O2 concentration in the liquid phase, resulting in a decrease in the rate of H2O2 production. Another reason for the saturation of the H2O2 concentration may be the deactivation of WO3, which will be discussed later. To increase the H2O2 concentration, two methods, (1) connection with an O2 balloon and (2) re-bubbling with O2, were investigated. When an O2 balloon was connected to the reactor, the H2O2 concentration increased after 2 h and finally reached 34 mM after 4 h (Fig. 5a). In the case of re-bubbling with O2 at 2 h, the H2O2 concentration reached 38 mM after an additional 1 h (total of 3 h) light irradiation (Fig. 5b). These results indicate that O2 pressure is one of the important factors for achieving a high concentration of H2O2.
![[thin space (1/6-em)]](https://www.rsc.org/images/entities/char_2009.gif) :
:![[thin space (1/6-em)]](https://www.rsc.org/images/entities/char_2009.gif) 1) suspension of WO3 and amount of O2 in the gas phase at various times at 60 °C under visible light irradiation
1) suspension of WO3 and amount of O2 in the gas phase at various times at 60 °C under visible light irradiation
Fig. 5b indicates that WO3 was deactivated after 3 h. We performed various analyses including XRD, SEM, FT-IR, UV-vis spectrum, and XPS analyses of WO3 samples before and after the reaction (Fig. S3, ESI†). However, no clear differences were observed between the two samples, suggesting that the saturation of H2O2 concentration is due not to an irreversible deactivation but a temporal deactivation of WO3. We found that calcination of WO3 in a box furnace at 300 °C for 1 h under air resulted in complete recovery of the initial performance of WO3 (Fig. S4, ESI†). Since the specific surface area of WO3 was small, a small amount of organic (peroxide) moieties deposited on the surface may decrease the O2 adsorption. The organic moieties are probably removed by thermal treatment at 300 °C, resulting in the recovery of the original performance of WO3.
In summary, it has been believed that only Au serves as an efficient cocatalyst for the photocatalytic production of H2O2 through O2 reduction. However, the production rate and the concentration of H2O2 have remained low. In this study, a WO3 photocatalyst was used to achieve rapid production and a high concentration of H2O2. Tungsten(VI) oxide has the advantage of working under visible light irradiation, and its CB bottom is located between the potentials for one-electron and two-electron reduction of O2. The strategy employed in this study involves avoiding the use of a cocatalyst, which induces H2O2 decomposition, even though this may result in a decrease in the formation rate. To compensate for the loss of the cocatalyst effect in the cocatalyst-free WO3 photocatalyst, other factors were investigated. Finally, rapid production of 38 mM H2O2 was achieved in a high alcohol concentration (90%) under an O2 atmosphere at 60 °C with additional O2 supply.
The data supporting this article have been included as part of the ESI.†
This work was partly supported by JSPS KAKENHI Grants 23K17964 and 23H01767 and by a fund from Nippon Sheet Glass Foundation for Materials Science and Engineering. A. T. is grateful for financial support from Japan Petroleum Energy Center (JPEC).
Conflicts of interest
There are no conflicts to declare.Notes and references
- J. M. Campos-Martin, G. Blanco-Brieva and J. L. G. Fierro, Angew. Chem., Int. Ed., 2006, 45, 6962 CrossRef CAS PubMed.
- H. Hou, X. Zeng and X. Zhang, Angew. Chem., Int. Ed., 2020, 59, 17356 CrossRef CAS PubMed.
- M. Teranishi, S. Naya and H. Tada, J. Am. Chem. Soc., 2010, 132, 7850 CrossRef CAS PubMed.
- Y. Shiraishi, S. Kanazawa, D. Tsukamoto, A. Shiro, Y. Sugano and T. Hirai, ACS Catal., 2013, 3, 2222 CrossRef CAS.
- Z. Zhu, H. Pan, M. Murugananthan, J. Gong and Y. Zhang, Appl. Catal., B, 2018, 232, 19 CrossRef CAS.
- Z. Wei, M. Liu, Z. Zhang, W. Yao, H. Tan and Y. Zhu, Energy Environ. Sci., 2018, 11, 2581 RSC.
- S. Thakur, T. Kshetri, N. H. Kim and J. H. Lee, J. Catal., 2017, 345, 78 CrossRef CAS.
- Y. Isaka, Y. Kondou, Y. Kawase, Y. Kuwahara, K. Mori and H. Yamashita, Chem. Commun., 2018, 54, 9270 RSC.
- Y. Nosaka and A. Y. Nosaka, Chem. Rev., 2017, 117, 11302 CrossRef CAS PubMed.
- P. Krystynik, P. Kluson, S. Hejda, D. Buzek, P. Masin and D. N. Tito, Appl. Catal., B, 2014, 160–161, 506 CrossRef CAS.
- Y. Wang, Y. Wang, J. Zhao, M. Chen, X. Huang and Y. Xu, Appl. Catal., B, 2021, 284, 119691 CrossRef CAS.
- K.-C. Kao, S.-J. Huang, Y.-F. Hsia, J.-H. Huang and C.-Y. Mou, ACS Appl. Nano Mater., 2024, 7, 218 CrossRef CAS.
- M. Teranishi, S. Naya and H. Tada, J. Phys. Chem. C, 2016, 120, 1083 CrossRef CAS.
- C. B. Kretschmer, J. Nowakowska and R. Wiebe, Ind. Eng. Chem., 1946, 38, 506 CrossRef CAS.
- R. Battino, T. R. Rettich and T. Tominaga, J. Phys. Chem. Ref. Data, 1983, 12, 163 CrossRef CAS.
- M. Quaranta, M. Murkovic and I. Klimant, Analyst, 2013, 138, 6243 RSC.
Footnote |
| † Electronic supplementary information (ESI) available: Experimental procedure, Tables S1 and S2, and Fig. S1–S4. See DOI: https://doi.org/10.1039/d4cc01402b |
| This journal is © The Royal Society of Chemistry 2024 |

