
 Open Access Article
 This Open Access Article is licensed under a Creative Commons Attribution-Non Commercial 3.0 Unported Licence
Quantification of thermodynamic effects of carbohydrate multivalency on avidity using synthetic discrete glycooligomers†
Masanori
Nagao
 *a,
Yu
Hoshino
*b and
Yoshiko
Miura
*a
*a,
Yu
Hoshino
*b and
Yoshiko
Miura
*a
aDepartment of Chemical Engineering, Kyushu University, 744 Motooka, Nishi-ku, Fukuoka 819-0395, Japan. E-mail: nagaom@chem-eng.kyushu-u.ac.jp
bDepartment of Applied Chemistry, Kyushu University, 744 Motooka, Nishi-ku, Fukuoka 819-0395, Japan
First published on 13th June 2024
Abstract
A quantitative understanding of thermodynamic effects of avidity in biomolecular interactions is important. Herein, we synthesized discrete glycooligomers and evaluated their interactions with a model protein using isothermal titration calorimetry. The dimeric glycooligomer exhibited higher binding constants compared to the glycomonomer, attributed to the reduced conformational entropy loss through local presentation of multiple carbohydrate units. Conversely, divalent glycoligands with polyethylene glycol linkers, aiming for multivalent binding, showed enhanced interactions through increased enthalpy. These findings emphasize the importance of distinguishing between the “local avidity” and the “multipoint avidity”.
Multivalent interactions play a crucial role in biomolecular interactions that are essential for biological processes.1 The strength of the direct interaction between a ligand's recognition domain and a receptor's binding site is known as “affinity”, whereas the binding strength resulting from accumulated multiple recognition domains or functional groups with affinity is termed “avidity”.2 Carbohydrates are representative biomolecules that utilize avidity in binding to specific proteins like lectins.3,4 Even when a monovalent interaction of carbohydrate is weak, presenting multiple carbohydrate units strengthens overall binding, known as the cluster glycoside effect.5–7 Whitesides and co-workers comprehensively studied the multivalent interactions and revealed the correlation between the number of binding points and avidity using model systems.1,8,9 In recent years, there's been heightened interest in designing avidity effects in glycoligands targeting membrane proteins like dendritic cell-specific intercellular adhesion molecule-3-grabbing non-integrin (DC-SIGN) in the biomedical field.10,11 Understanding the mechanism of avidity in multivalent interactions is pivotal for precise design of effective glycoligands.
Intermolecular binding in biomolecular systems is explained thermodynamically using Gibbs free energy (ΔG = ΔH − TΔS).12 Enthalpy represents the heat released during bond formation between biomolecules.13 On the other hand, entropy refers to changes in the mobility of the ligands, receptors, and water molecules.14–16 Controlling these thermodynamic parameters is crucial in designing biomolecular interactions.17 Isothermal titration calorimetry (ITC) is a powerful tool for determining these parameters, and numerous studies have utilized ITC to measure thermodynamic parameters in carbohydrate–lectin interactions.18–23 Despite these pioneering works, a quantitative understanding of thermodynamic effects resulting from the multivalent presentation of carbohydrate units in glycoligands, particularly regarding avidity in molecular interactions, remains unclear. For example, the potential modes of multivalent effects (chelate binding or statistical rebinding) are expected to have different thermodynamic contributions, especially in terms of entropy.10
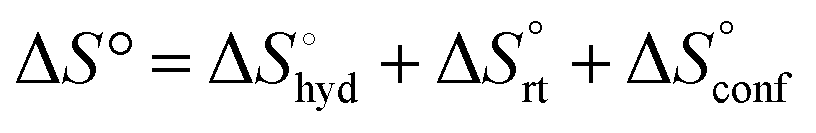
Herein, we synthesized monovalent and divalent glycoligands by radical polymerization and evaluated their interactions with concanavalin A (ConA) using ITC. We applied the post-purification method to synthesize discrete glycooligomers with monovalent and divalent carbohydrate units.24–26 Glycooligomers were synthesized via reversible addition–fragmentation chain transfer (RAFT) polymerization with an acrylamide monomer carrying mannose units (ManAAm). The target degree of polymerization (DP) was set to 3 (Fig. 1a and Fig. S1, ESI†). The resulting glycooligomer mixture with DP of 1, 2 and 3 was fractionated using a reverse-phase chromatography (Fig. S2, ESI†). The glycooligomer structures in each fraction were identified through proton nuclear magnetic resonance (1H NMR) and mass spectrometry (MS) analysis. Interestingly, differences in the diastereomeric structures of the dimers allowed for their isolation (Fig. S3–S5, ESI†). The combination of RAFT polymerization and chromatographic fractionation yielded monomeric and dimeric glycooligomers (meso- and racemo-) with discrete molecular weights (M1, m-M2, and r-M2). After converting the trithiocarbonate groups of the glycooligomers to thiol groups, discrete glycooligomers with the thiol terminals were obtained (M1-SH, m-M2-SH, and r-M2-SH). The structural confirmation data are provided in the ESI† (Fig. S6 and S7).
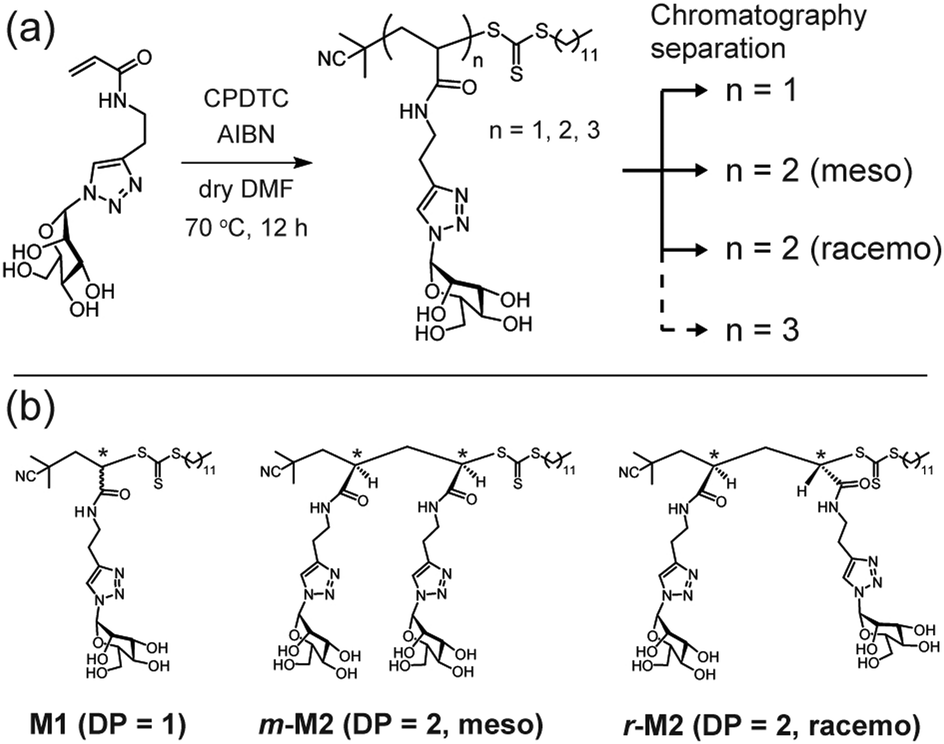 | ||
| Fig. 1 (a) Synthetic scheme of discrete glycooligomers carrying mannose units. (b) Chemical structures of the isolated discrete glycooligomers with degree of polymerization (DP) of 1 or 2. | ||
The interaction between the synthesized glycooligomers and the model lectin, ConA, was evaluated by ITC. ConA is a tetrameric lectin with four mannose binding sites, one site per subunit.27 An acetate buffer (pH = 5.2) was used to induce ConA dimer formation, preventing aggregation of ConA during measurements.21 To evaluate the interaction of the monomeric mannose unit, ManAAm was chosen over M1-SH because M1-SH forms a micelle structure due to its amphiphilicity. The binding constant (Ka), enthalpy change (ΔH), and entropy change (ΔS) of ManAAm at 25 °C are summarized in Table 1, with the raw data presented in Fig. S14 and S15 (ESI†). It is important to note that the stoichiometry N was fixed as 2 (two ManAAm to one ConA dimer) in fitting the data to accurately estimate the thermodynamic parameters in the weak interactions (the Wiseman constant c < 10).28 The Ka of ManAAm (5.4 × 10³ M−1) was lower than that of methyl α-mannopyranoside (1.2 × 10⁴ M−1), indicating a negative effect from the adjacent triazole ring on the interaction. Although the triazole ring of ManAAm brought the potential change in affinity from secondary interactions or steric effects, a control experiment using glucose acrylamide, which showed negligible binding to ConA (Ka < 1.3 × 10³ M−1), confirmed the selectivity in the interactions based on the carbohydrate structure (Fig. S16, ESI†).
| Glycoligands | K d (μmol L−1) | K a (L mol−1) | ΔG° (kJ mol−1) | ΔH° (kJ mol−1) | −TΔS° (kJ mol−1) | ΔS° (J mol−1 K−1) | N | c |
|---|---|---|---|---|---|---|---|---|
a Data were obtained by ITC measurements at 25 °C (298.15 K) using an acetate buffer (pH = 5.2). The measurements were repeated more than three times.
b Mixture of m-M2-SH and r-M2-SH in 50![[thin space (1/6-em)]](https://www.rsc.org/images/entities/char_2009.gif) :50 wt%.
c Binding constant Ka was calculated as the inverse of the dissociation constant Kd obtained from ITC measurements.
d Stoichiometry N was fixed in fitting the parameters.
e The Wiseman constant c was calculated using the following formula: c = [ConA dimer] × Ka × N. :50 wt%.
c Binding constant Ka was calculated as the inverse of the dissociation constant Kd obtained from ITC measurements.
d Stoichiometry N was fixed in fitting the parameters.
e The Wiseman constant c was calculated using the following formula: c = [ConA dimer] × Ka × N.
|
||||||||
| Methyl α-mannopyranoside | 82.0 ± 2.2 | 12200 ± 330 |
−23.3 ± 0.1 | −26.4 ± 0.6 | 3.0 ± 0.7 | −10.2 ± 2.4 | 2 | 1.2 ± 0.3 |
| ManAAm | 176.1 ± 9.5 | 5640 ± 320 | −21.4 ± 0.1 | −27.6 ± 0.9 | 6.2 ± 0.9 | −20.7 ± 0.3 | 2 | 0.5 ± 0.1 |
| m-M2-SH | 79.5 ± 1.4 | 12580 ± 220 |
−23.4 ± 0.03 | −25.6 ± 0.3 | 2.2 ± 0.3 | −7.2 ± 1.1 | 2 | 1.2 ± 0.07 |
| r-M2-SH | 99.6 ± 5.9 | 10080 ± 620 |
−22.9 ± 0.2 | −26.2 ± 0.7 | 3.3 ± 0.9 | −11.0 ± 2.9 | 2 | 1.1 ± 0.02 |
| M2-SH | 76.4 ± 2.8 | 13100 ± 480 |
−23.5 ± 0.1 | −25.6 ± 0.5 | 2.1 ± 0.6 | −6.9 ± 2.0 | 2 | 1.0 ± 0.2 |
| M1-PEG3.4k-M1 | 118 ± 8 | 8480 ± 590 | −22.4 ± 0.2 | −42.4 ± 2.5 | 20.0 ± 2.7 | −67.1 ± 8.9 | 1 | 0.6 ± 0.04 |
| M1-PEG6k-M1 | 139 ± 7 | 7230 ± 380 | −22.1 ± 0.2 | −44.9 ± 1.2 | 22.8 ± 1.4 | −76.4 ± 4.7 | 1 | 0.4 ± 0.02 |
| M1-PEG10k-M1 | 195 ± 38 | 5360 ± 1130 | −21.2 ± 0.7 | −53.4 ± 7.7 | 32.2 ± 8.3 | −108 ± 28 | 1 | 0.4 ± 0.08 |
| M2-PEG3.4k-M2 | 41.7 ± 3.2 | 24190 ± 2000 |
−25.0 ± 0.4 | −50.6 ± 2.7 | 25.6 ± 3.1 | −85.9 ± 10.5 | 1 | 1.4 ± 0.1 |
| M2-PEG6k-M2 | 27.2 ± 1.4 | 36890 ± 1900 |
−26.0 ± 0.1 | −43.5 ± 1.3 | 17.5 ± 1.3 | −58.6 ± 4.2 | 1 | 1.6 ± 0.1 |
| M2-PEG10k-M2 | 35.9 ± 3.4 | 28110 ± 2780 |
−25.4 ± 0.3 | −46.8 ± 3.9 | 21.5 ± 4.1 | −72.0 ± 13.8 | 1 | 1.2 ± 0.1 |
The effect of presenting two mannose units to one binding site was evaluated using m-M2-SH and r-M2-SH for ITC measurements. Their binding constants were close to each other (1.3 × 10⁴ and 1.0 × 10⁴ M−1, respectively) and were approximately twice as high as that of ManAAm (Table 1 and Fig. S17 and S18, ESI†). Since the diastereomers showed no significant differences in the thermodynamic parameters, the mixture form of M2-SH was used for subsequent measurements (Fig. S19, ESI,†Ka = 1.3 × 10⁴ M−1). A control experiment using thioglycerol showed no binding to ConA, refusing the unspecific interaction of the thiol group with the protein surface (Fig. S20, ESI†). Interestingly, while the enthalpy value of ManAAm had a slight advantage over M2-SH (ΔΔH° = 2.0 kJ mol−1), the entropy term value of M2-SH was notably smaller than that of ManAAm (Δ(−TΔS°) = −4.1 kJ mol−1), resulting in the enhanced interaction of M2-SH (ΔΔG° = −2.1 kJ mol−1). The entropy change obtained from ITC measurement includes three factors, as described by eqn (1):
 | (1) |
 represents the hydration entropy,
  is the rotational-translation entropy, and
  stands for conformation entropy.14,20,29 Among these factors, is expressed as a constant value from eqn (2),
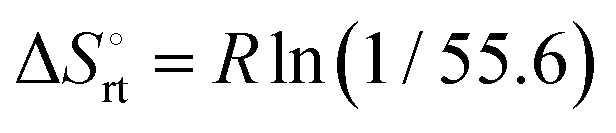 | (2) |
 reaches zero at 385 K, where the hydration shell no longer exists,
 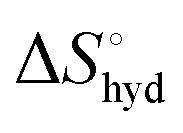 is calculated with heat capacity (ΔCp) according to eqn (3).20
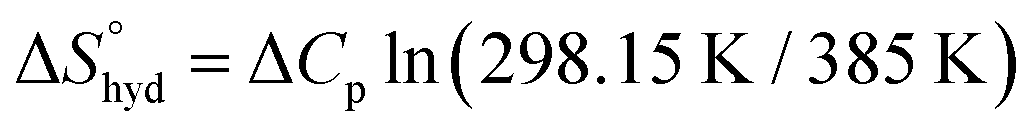 | (3) |
 is obtained by subtracting the sum of
  and
and  from the observed ΔS°
  . To obtain the heat capacity in each system, ITC measurements were conducted using ManAAm and M2-SH at different temperatures (Fig. S27–S34, ESI†). The plots of ΔH versus temperature show negative slopes, indicating heat capacity of −0.220 and −0.216 kJ mol−1 K−1 for ManAAm and M2-SH, respectively (Fig. 2). The calculated entropy values are shown in Table 2. While
  of ManAAm and M2-SH were similar (56.4 and 55.3 J mol−1 K−1, respectively),
  of ManAAm was notably larger than that of M2-SH (−43.7 and −28.8 J mol−1 K−1, respectively). This indicates that the reduced conformation entropy loss in the binding of M2-SH enhanced the interaction with ConA. The two carbohydrate units of M2-SH increased the number of molecular conformation capable of binding to ConA, resulting in the reduction of conformational entropy loss. The thermodynamic results obtained here strongly support the traditional understanding regarding the effect of multivalent presentation of carbohydrate units in gaining avidity (statistical rebinding mode).5,10,19
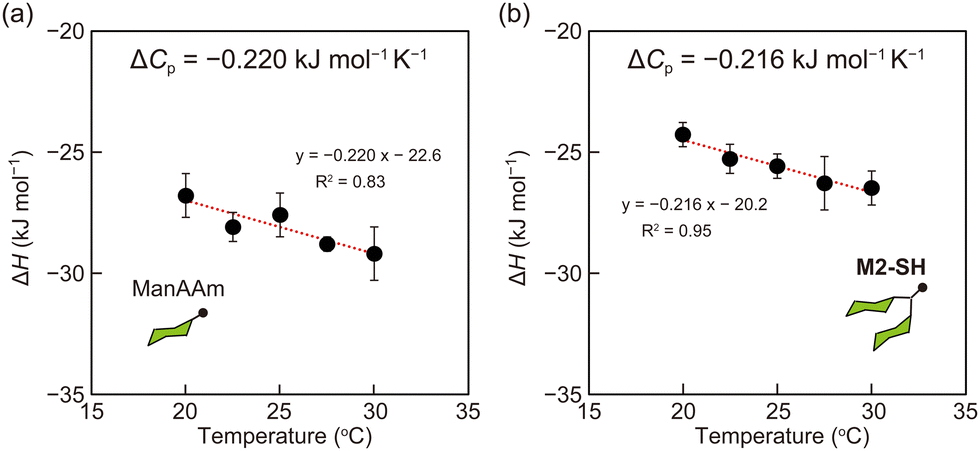 | ||
| Fig. 2 Plots of enthalpy values to temperature. (a) ManAAm and (b) M2-SH. Red lines represent the linear fit of the plots, and the slope indicates heat capacity (ΔCp). Error bars represent standard deviations of three or more experiments. | ||
| Entropy | ManAAm (J mol−1 K−1) | M2-SH (J mol−1 K−1) |
|---|---|---|
a Conformation entropy  was calculated using the following formula: was calculated using the following formula: 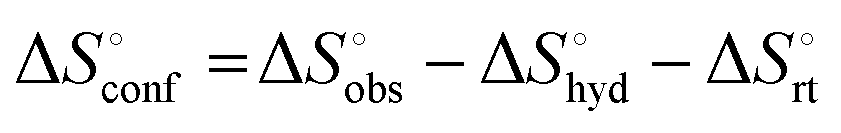 . .
|
||

|
56.4 | 55.3 |
|
−33.4 | −33.4 |

|
−43.7 | −28.8 |
|
−20.7 | −6.9 |
The effect of multivalent binding in the molecular interactions was further explored using a divalent glycoligand with a linker structure. M1-SH was conjugated to the terminals of polyethylene glycol (PEG) with molecular weights of 3.4k, 6k, and 10k Da through a thiol–maleimide reaction (Table S1 and Fig. S8–S12, ESI†). In size exclusion chromatography (SEC) analysis, the glycoligands showed consistent molecular weights compared to those of the PEG precursors (Table S1 and Fig. S13, ESI†). The resulting divalent glycoligands with various linker lengths, M1-PEGn-M1 (n = 3.4k, 6k, and 10k), were expected to exhibit multivalent interaction with ConA dimers. The binding constants of M1-PEGn-M1 were 8.5 × 10³, 7.2 × 10³, and 5.4 × 10³ M−1 for M1-PEG3.4k-M1, M1-PEG6k-M1, and M1-PEG10k-M1, respectively, assuming the stoichiometry of 1:1 for a ConA dimer (Table 1). These values were higher than that of ManAAm but lower than that of M2-SH, indicating that the multivalent effect weakened as the distance between the two carbohydrate units increased (Fig. 3). In the thermodynamic parameters, ΔH° of the M1-PEGn-M1 series surpassed those of ManAAm and M2-SH, suggesting a scenario of multiple binding events (chelate binding mode). However, this enthalpic advantage was counteracted by a simultaneous increase in entropy term, attributed to the entropy loss of the flexible PEG linkers. Although the entropy loss can be suppressed by using a rigid linker structure, we used flexible PEG linkers to discuss the results referring to the previous reports9 in the next paragraph.
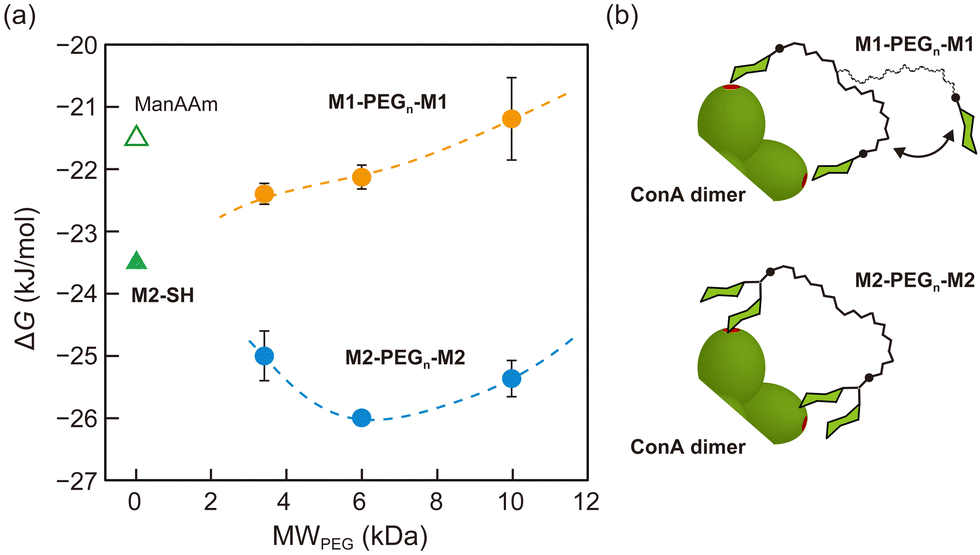 | ||
| Fig. 3 (a) Plots of ΔG° for the binding of divalent glycoligands (M1-PEGn-M1 and M2-PEGn-M2) to ConA dimer as a function of molecular weight of the PEG linkers. Yellow and blue circles represent M1-PEGn-M1 and M2-PEGn-M2, respectively. Hollow and solid green triangles represent the glycomonomer (ManAAm) and dimeric glycooligomer (M2-SH), respectively. (b) Illustration of the supposed binding modes of the glycoligands to ConA dimer. | ||
The effect of the strength of local interactions on the avidity was evaluated with glycoligands carrying M2-SH at the terminals of the PEG linkers (M2-PEGn-M2). The detailed data are provided in the ESI† (Table S1 and Fig. S8–13). Interestingly, the M2-PEGn-M2 series showed higher binding constants than M2-SH, and the maximal binding strength (the lowest ΔG° = −26.0 kJ mol−1) was observed with the molecular weight of 6 kDa (Table 1 and Fig. 3). This result suggests that the spatial distance between the two terminal mannose units of M2-PEG6k-M2 matched the distance between the binding sites of ConA (approximately 6.5 nm).9,30 These results of the glycoligands with PEG linkers indicate that enhancement of interactions through multiple binding is not observed unless there is a certain level of strength in the local interaction. Otherwise, the enthalpy gain at multiple binding points cannot compensate for the entropy loss of the linker structures associated with binding to the target molecules. While the affinity between a mannose unit and a ConA binding site is constant in principle, M2-PEG6k-M2 gained overall avidity through multiple binding (“multipoint avidity”), supported by the enhanced local interactions of M2-SH units (“local avidity”).
In summary, we synthesized discrete glycoligands and quantified the effects of multivalency on their interactions with the model lectin using ITC. The local multivalent presentation of carbohydrate units enhanced the interaction by contribution of the reduced conformation entropy. Conversely, presenting carbohydrate units at multiple binding sites enhanced the interaction through gaining enthalpic advantage, which could be offset by entropic loss from linker structures when the interactions at individual binding sites are weak. This work emphasizes the importance of distinguishing between the “local avidity” effect near binding sites and the “multipoint avidity” resulting from an increase in binding points, in designing practical glycoligand molecules in the biomedical field (Fig. 4).
 | ||
| Fig. 4 Illustrated summary of the correlation between the carbohydrate presentation mode and enhancement of the interactions with ConA. | ||
This work was financially supported by a JSPS Grant-in-Aid (JP22H05048, JP23K26708, and JP24K17726).
Data availability
The data supporting this article have been included as part of the ESI.†Conflicts of interest
There are no conflicts to declare.Notes and references
- M. Mammen, S.-K. Choi and G. M. Whitesides, Angew. Chem., Int. Ed., 1998, 37, 2754–2794 CrossRef.
- S. C. Oostindie, G. A. Lazar, J. Schuurman and P. W. H. I. Parren, Nat. Rev. Drug Discovery, 2022, 21, 715–735 CrossRef CAS.
- R. A. Dwek, Chem. Rev., 1996, 96, 683–720 CrossRef CAS.
- S. Cecioni, A. Imberty and S. Vidal, Chem. Rev., 2015, 115, 525–561 CrossRef CAS.
- J. J. Lundquist and E. J. Toone, Chem. Rev., 2002, 102, 555–578 CrossRef CAS.
- M. Martínez-Bailén, J. Rojo and J. Ramos-Soriano, Chem. Soc. Rev., 2023, 52, 536–572 RSC.
- Y. Miura, Y. Hoshino and H. Seto, Chem. Rev., 2016, 116, 1673–1692 CrossRef CAS.
- G. B. Sigal, M. Mammen, G. Dahmann and G. M. Whitesides, J. Am. Chem. Soc., 1996, 118, 3789–3800 CrossRef CAS.
- E. T. Mack, P. W. Snyder, R. Perez-Castillejos, B. Bilgiçer, D. T. Moustakas, M. J. Butte and G. M. Whitesides, J. Am. Chem. Soc., 2012, 134, 333–345 CrossRef CAS.
- V. Porkolab, M. Lepšík, S. Ordanini, A. John, A. Le Roy, M. Thépaut, E. Paci, C. Ebel, A. Bernardi and F. Fieschi, ACS Cent. Sci., 2023, 9, 709–718 CrossRef CAS.
- S. Ordanini, N. Varga, V. Porkolab, M. Thépaut, L. Belvisi, A. Bertaglia, A. Palmioli, A. Berzi, D. Trabattoni, M. Clerici, F. Fieschi and A. Bernardi, Chem. Commun., 2015, 51, 3816–3819 RSC.
- J. M. Fox, M. Zhao, M. J. Fink, K. Kang and G. M. Whitesides, Annu. Rev. Biophys., 2018, 47, 223–250 CrossRef CAS.
- F. Spyrakis, M. H. Ahmed, A. S. Bayden, P. Cozzini, A. Mozzarelli and G. E. Kellogg, J. Med. Chem., 2017, 60, 6781–6827 CrossRef CAS.
- F. F. Theisen, L. Staby, F. G. Tidemand, C. O’Shea, A. Prestel, M. Willemoës, B. B. Kragelund and K. Skriver, J. Am. Chem. Soc., 2021, 143, 14540–14550 CrossRef CAS.
- C.-e A. Chang, W. Chen and M. K. Gilson, Proc. Natl. Acad. Sci. U. S. A., 2007, 104, 1534–1539 CrossRef CAS.
- C. Forrey, J. F. Douglas and M. K. Gilson, Soft Matter, 2012, 8, 6385–6392 RSC.
- P. I. Kitov and D. R. Bundle, J. Am. Chem. Soc., 2003, 125, 16271–16284 CrossRef CAS.
- T. K. Dam and C. F. Brewer, Chem. Rev., 2002, 102, 387–429 CrossRef CAS.
- S. M. Dimick, S. C. Powell, S. A. McMahon, D. N. Moothoo, J. H. Naismith and E. J. Toone, J. Am. Chem. Soc., 1999, 121, 10286–10296 CrossRef CAS.
- C. P. Sager, B. Fiege, P. Zihlmann, R. Vannam, S. Rabbani, R. P. Jakob, R. C. Preston, A. Zalewski, T. Maier, M. W. Peczuh and B. Ernst, Chem. Sci., 2018, 9, 646–654 RSC.
- S. Igde, S. Röblitz, A. Müller, K. Kolbe, S. Boden, C. Fessele, T. K. Lindhorst, M. Weber and L. Hartmann, Macromol. Biosci., 2017, 17, 1700198 CrossRef.
- S. Boden, F. Reise, J. Kania, T. K. Lindhorst and L. Hartmann, Macromol. Biosci., 2019, 19, 1800425 CrossRef.
- M. Nagao, M. Kichize, Y. Hoshino and Y. Miura, Biomacromolecules, 2021, 22, 3119–3127 CrossRef CAS.
- J. Lawrence, S.-H. Lee, A. Abdilla, M. D. Nothling, J. M. Ren, A. S. Knight, C. Fleischmann, Y. Li, A. S. Abrams, B. V. K. J. Schmidt, M. C. Hawker, L. A. Connal, A. J. McGrath, P. G. Clark, W. R. Gutekunst and C. J. Hawker, J. Am. Chem. Soc., 2016, 138, 6306–6310 CrossRef CAS.
- Y. Hoshino, S. Taniguchi, H. Takimoto, S. Akashi, S. Katakami, Y. Yonamine and Y. Miura, Angew. Chem., Int. Ed., 2020, 59, 679–683 CrossRef CAS.
- Y. Saito, R. Honda, S. Akashi, H. Takimoto, M. Nagao, Y. Miura and Y. Hoshino, Angew. Chem., Int. Ed., 2022, 61, e202206456 CrossRef CAS.
- M. Ambrosi, N. R. Cameron and B. G. Davis, Org. Biomol. Chem., 2005, 3, 1593–1608 RSC.
- W. B. Turnbull and A. H. Daranas, J. Am. Chem. Soc., 2003, 125, 14859–14866 CrossRef CAS.
- J. A. Caro, K. W. Harpole, V. Kasinath, J. Lim, J. Granja, K. G. Valentine, K. A. Sharp and A. J. Wand, Proc. Natl. Acad. Sci. U. S. A., 2017, 114, 6563–6568 CrossRef CAS.
- M. Ambrosi, N. R. Cameron and B. G. Davis, Org. Biomol. Chem., 2005, 3, 1593–1608 RSC.
Footnote |
| † Electronic supplementary information (ESI) available: Materials, characterization, 1H NMR spectra and MS spectra of the glycoligands, SEC chromatograms, conditions of the RAFT polymerization, and results of ITC measurements. See DOI: https://doi.org/10.1039/d4cc02409e |
| This journal is © The Royal Society of Chemistry 2024 |