
 Open Access Article
 This Open Access Article is licensed under a
 Creative Commons Attribution 3.0 Unported Licence
Mixed anion control of negative thermal expansion in a niobium oxyfluoride†
Eliza K.
Dempsey
 ab and
James
Cumby
*ab
ab and
James
Cumby
*ab
aSchool of Chemistry, University of Edinburgh, David Brewster Road, Edinburgh, EH9 3FJ, UK. E-mail: james.cumby@ed.ac.uk
bCentre for Science at Extreme Conditions (CSEC), University of Edinburgh, Peter Guthrie Tait Road, Edinburgh EH9 3FD, UK
First published on 1st February 2024
Abstract
A significant change in thermal expansion with anion composition has been identified in the niobium oxyfluoride, NbO2−xF1+x from 0 < x < 0.6. Fluorine doping leads to a transition from positive thermal expansion to unusual zero and negative thermal expansion caused by transverse anionic vibrations. This work has consequences for the development of advanced technological materials with tuneable low thermal expansion and is the first example of the use of multiple anions to control thermal expansion.
Thermal expansion is often one of the most important engineering properties when considering materials for technological applications. In multi-component devices, such as a fuel cell which must undergo significant temperature changes, a mismatch in coefficient of thermal expansion (CTE) between materials can cause serious issues.1–3 In fields such as telescope optics, a component may be required to retain a precise shape over changes in temperature.4,5 Even the CTE of human teeth is considered when designing long lasting dental filling materials.6,7 These are just a few examples but there are many others where minimising or tuning CTE can significantly improve performance. A small minority of materials exhibit zero or negative thermal expansion (NTE), where the structure contracts on heating, however the number of available NTE materials is significantly limited and we have no robust method for designing new NTE materials.8,9
NTE can originate due electronic or magnetic transitions, but the temperature range of NTE in these materials is limited.10,11 However, NTE over a broader temperature range is most commonly caused by transverse vibrations in flexible open framework structures.12 The simplest example of structural NTE is in the cubic ReO3-type structure consisting of corner-sharing octahedra (Fig. 1(A)). NTE can be theorised to arise in this structure due to tilting modes of the rigid octahedra according to the rigid unit mode (RUM) model.13 As the amplitude of the RUM vibration increases with temperature, the average cell volume decreases, resulting in NTE, as illustrated in Fig. 1(B).
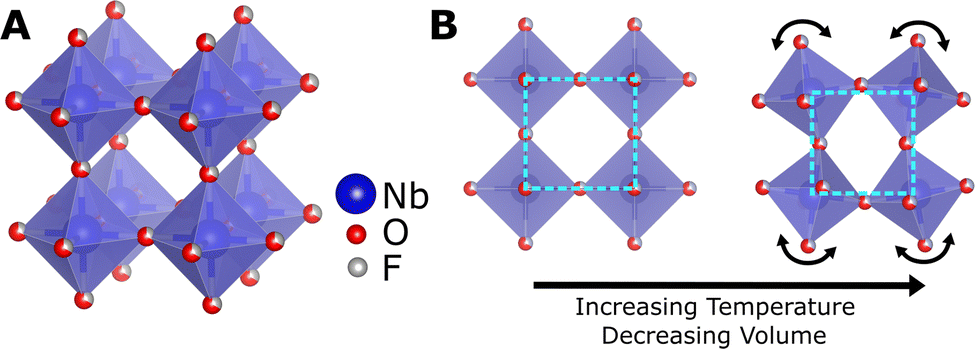 | ||
Fig. 1 (A) The cubic ReO3-type structure of NbO2F in the Pm![[3 with combining macron]](https://www.rsc.org/images/entities/char_0033_0304.gif) m space group. (B) An illustration of the rigid unit mode mechanism of negative thermal expansion in the cubic ReO3-type structure. m space group. (B) An illustration of the rigid unit mode mechanism of negative thermal expansion in the cubic ReO3-type structure. | ||
Since the discovery of large NTE in ScF3 in 2010,14 fluorides have become a rapidly growing area for discovery of new NTE materials.12 Aside from ScF3, this has largely focused on double ReO3-type structures, such as CaZrF6, where the cations adopt a 3D “checkerboard” arrangement.15–17 Not all ReO3-type structures, however, exhibit NTE. In contrast to ScF3, ReO3 only shows NTE over a limited temperature range.18,19 This has been attributed to reduced flexibility of oxide linkages compared to the highly flexible fluoride linkages in ScF3.20,21 The true NTE mechanism in these structures is likely to be more complex than a simple RUM model, with some evidence for non-rigid transverse phonons as the origin of NTE in ScF3.22,23
Despite the growing number of oxide and fluoride based NTE materials,12 little attention has so far been paid to mixed-anion oxyfluorides. ReO3-type NbO2F and TaO2F only exhibit positive and zero thermal expansion respectively despite their cubic structure.24,25 However, due to the variable oxidation state of niobium, the oxygen–fluorine ratio of NbO2F can be modified to form the NbO2−xF1+x solid solution whilst retaining the cubic structure.26 This provides an excellent system for the effects of mixed anions to be explored. Previously we have found a significant composition dependence of electronic and magnetic properties, driven by the substitution of Nb(V) for Nb(IV).27
Through variable temperature X-ray powder diffraction, we have identified a significant change in the CTE of NbO2−xF1+x when the fluorine content is increased, changing from positive to zero to negative thermal expansion. This presents a new pathway for precise tuning of thermal expansion through anionic composition and is, to our knowledge, the first example of an oxyfluoride NTE material.
NbO2−xF1+x samples from x = 0 to x = 0.6 (vide infra) were synthesised by a high temperature solid state synthesis, full details of which are given in ESI.† Higher fluorine content compositions were achieved using polytetrafluoroethylene (PTFE) as a fluorine source. The use of PTFE provides a safer and cheaper alternative to fluoride synthesis than metal fluorides or hydrofluoric acid. The cubic ReO3-type structure and purity of our final products were confirmed from X-ray powder diffraction (ESI†). To characterise the thermal expansion properties of NbO2−xF1+x X-ray powder diffraction data were collected at temperatures from 12–373 K. Low temperature data were collected in house with Cu-Kα1 radiation whilst high temperature data were collected at the BM01 beamline of the European Synchrotron Radiation Facility (ESRF). The variation in unit cell volume was extracted from Rietveld refinements of the data using the GSAS-II software28 and is shown in Fig. 2(A). Data for NbO1.9F1.1 between 200–250 K are unavailable due to sample misalignment during data collection. The mean and range of volumetric CTE for each composition is shown in Fig. 2(B).
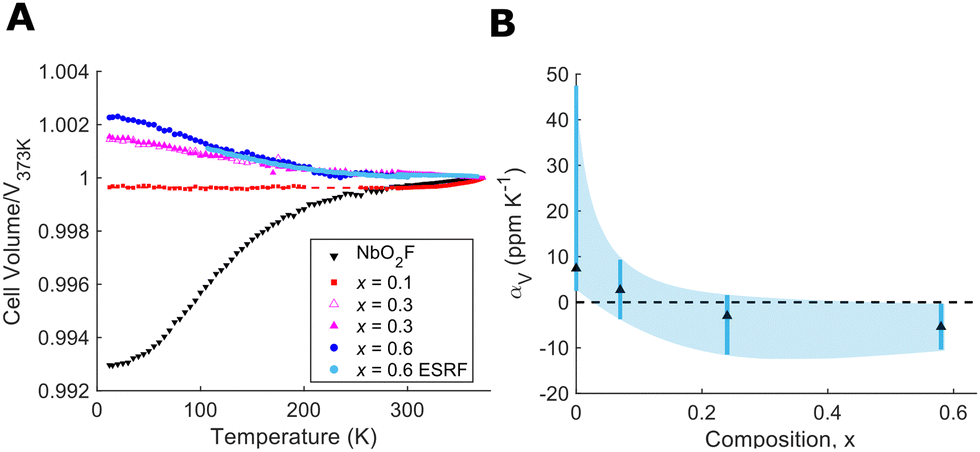 | ||
| Fig. 2 (A) Relative variation in unit cell volume with temperature for NbO2−xF1+x as determined from powder X-ray diffraction. (B) The range and mean values of volumetric coefficient of thermal expansion for each NbO2−xF1+x composition. | ||
The thermal expansion behaviour of NbO2F is positive but shows an atypical levelling out at high temperature as previously reported.24 This positive thermal expansion, when compared to reported zero thermal expansion in isostructural TaO2F, was attributed to displacement of the central Nb ion.25 In the case of NbO1.9F1.1, however, we observe near perfect zero thermal expansion from 12 to 310 K with a mean CTE of 0.4 ppm K−1 (ESI†). This presents a significant difference from NbO2F despite only a subtle change to the overall chemical composition. We therefore believe this effect is structural rather than purely chemical in origin, with possible influence from local structure or anion ordering due to the fluorine doping. The fact the thermal expansion shows no change over a broad temperature range indicates perfectly balanced positive and negative thermal expansion effects. Above 310 K, there is a clear switch to dominant positive thermal expansion.
Further fluoride doping, to form NbO1.7F1.3 and NbO1.4F1.6, leads to negative thermal expansion over the full measured temperature range (12 to 373 K). The NTE shows a clear correlation to fluoride doping (Fig. 2(B)) with mean volumetric CTEs of −3 and −5 ppm K−1 respectively. This is consistent with the larger flexibility of fluoride linkages in these structures compared to oxides. The increasing fluoride content softens the transverse anionic vibrations, allowing them to contribute to NTE without the overall cubic structure collapsing to a rhombohedral phase. This is similar to the mechanism of NTE observed in ScF3.
Refinement of the atomic displacement parameters for NbO2F with temperature (Fig. 3(A)) gives similar results to those reported for TaO2F.25 As expected, the isotropic niobium displacement has a significant non-zero component independent of temperature, likely caused by local static displacements away from fluoride and towards oxide anions. The anion displacement, however, is strongly anisotropic and dominated by transverse displacement perpendicular to the Nb–(O/F)–Nb bond. This transverse anion displacement also shows a strong thermal dependence, increasing with temperature. The thermal dependence of this transverse displacement can be quantified from the gradient of a linear fit (dUtransverse/dT). By comparing these gradients for different NbO2−xF1+x compositions (Fig. 3(B)) there is a clear correlation with a strong thermal dependence producing a more negative CTE. The strongly ionic nature of the fluoride bonding compared to more covalent oxide linkages increases the transverse flexibility of the anionic linkage, resulting in NTE. We have also extracted equivalent linear fit gradients from published ReO3-type and double ReO3-type displacement parameters. A comparison of our displacement gradients with these literature values show a similar correlation with CTE. We propose that this parameter is therefore a better measure of anion flexibility than the absolute transverse displacement parameter which may have both static and thermal contributions. This also supports the use of an anion-centred perspective to understand and control thermal expansion.
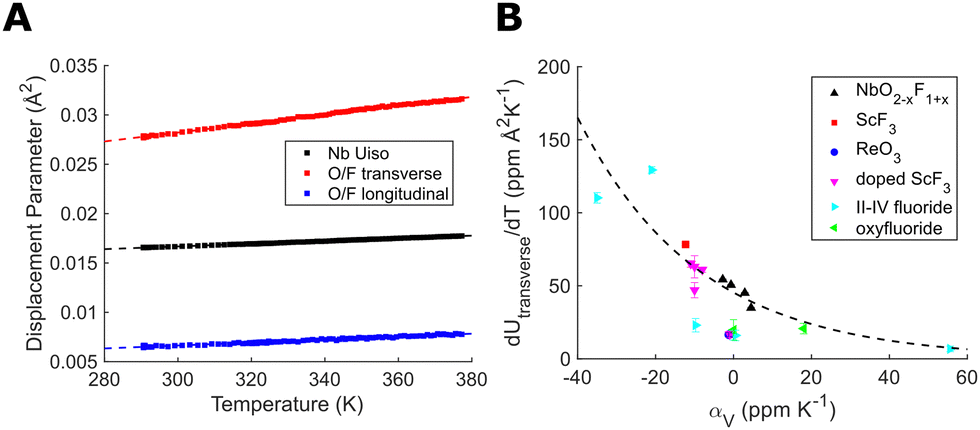 | ||
| Fig. 3 (A) Refined displacement parameters for NbO2F. (B) The gradient of the transverse anion displacement parameter in ReO3-type structures showing its relationship with mean volumetric CTE.14,15,19,25,29–33 Linear fits were performed over the full temperature range of data available for which the structure remains cubic. | ||
Determining the precise oxygen/fluorine composition in ceramic samples is a known challenge, therefore we have utilised a number of complementary approaches. Firstly, we have compared our refined lattice parameters with those reported by Brink et al. for NbO2−xF1+x (ESI†).26 Our results show slight deviation from our targeted compositions, likely due to the use of different synthesis procedures for high and low fluorine content samples which may lead to final compositions differing slightly from the idealised products. The corrected compositions, based on lattice parameters, are presented in Table 1. However these results may not be directly comparable due to the use of hydrofluoric acid in the Brink et al. synthesis which is known to lead to hydroxyl defects in the samples.24 To support this analysis, we also performed magnetic susceptibility measurements with temperature (Fig. 4(A)). The high temperature, paramagnetic region is fitted to a Curie–Weiss model, χm = C/(T − θW), in order to extract the paramagnetic moment (Fig. 4(B)). Therefore, the percentage of Nb4+ and composition of each sample could be determined. Full details of the analysis are provided in ESI.† The results of both these approaches, presented in Table 1, show reasonable agreement with each other and with the composition of starting products allowing us to estimate composition to within 0.1.
| Sample ID | Composition, x for NbO2−xF1+x | ||
|---|---|---|---|
| Synthesis ratio | Lattice parameter26 | Magnetic susceptibility | |
| x = 0.1 | 0.19 | 0.04 | 0.07 |
| x = 0.3 | 0.31 | 0.37 | 0.24 |
| x = 0.6 | 0.63 | 0.43 | 0.57 |
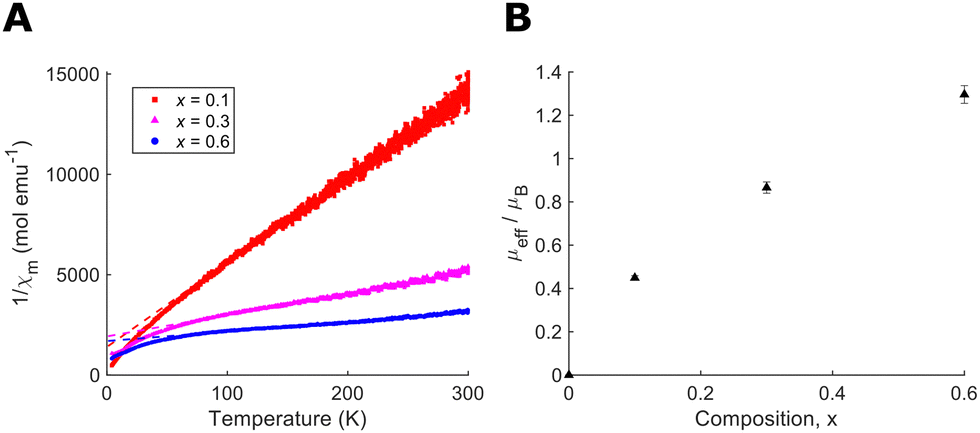 | ||
| Fig. 4 (A) Inverse magnetic susceptibility against temperature for NbO2−xF1+x including linear Curie–Weiss fits. Diamagnetic and ferromagnetic corrections have been applied. (B) Effective magnetic moments calculated from Curie–Weiss fitting. | ||
In summary, we have identified a novel approach to controlling thermal expansion through varying the oxygen to fluorine ratio. Only small changes in anion composition dramatically alter the CTE from positive to zero to negative with the effect persisting over a broad temperature range (12 to 373 K). To our knowledge, this is the first example of negative thermal expansion in an oxyfluoride material with a notable negative CTE of −5 ppm K−1 in NbO1.4F1.6. This highlights the importance of often overlooked anionic contributions and the great potential of mixed anion materials which have already been highlighted for use in fields such as battery electrodes, photocatalysis and optics.34–39 We anticipate this work will lead to a new class of metal oxyfluorides with tuneable low thermal expansion in combination with functional optical, magnetic and electronic properties.
EKD and JC jointly conceptualized the study and devised the methodology. EKD led the investigation, developed visualizations and wrote the original draft. JC provided resources, supervision and edited the manuscript.
EKD wishes to thank the University of Edinburgh for funding. We would like to thank Dr Charlie McMonagle (ESRF) and Dr Rebecca Rae (CSEC) for assistance with data collection. For the purpose of open access, the author has applied a Creative Commons Attribution (CC BY) licence to any Author Accepted Manuscript version arising from this submission.
Conflicts of interest
There are no conflicts to declare.Notes and references
- J. Kim and A. Manthiram, Chem. Mater., 2010, 22, 822–831 Search PubMed.
- C. S. Montross, H. Yokokawa and M. Dokiya, Br. Ceram. Trans., 2002, 101, 85–93 Search PubMed.
- Y. Zhang, B. Chen, D. Guan, M. Xu, R. Ran, M. Ni, W. Zhou, R. O’Hayre and Z. Shao, Nature, 2021, 591, 246–251 Search PubMed.
- T. Legero, T. Kessler and U. Sterr, J. Opt. Soc. Am. B, 2010, 27, 914–919 Search PubMed.
- C. Blaurock, M. McGinnis, K. Kim and G. E. Mosier, Proc. SPIE, 2005, 5867, 58670V Search PubMed.
- M. B. Lopes, Z. Yan, S. Consani, A. Gonini Júnior, A. Aleixo and J. F. McCabe, Braz. Dent. J., 2012, 23, 03–07 Search PubMed.
- H. Wolter, W. Storch and H. Ott, MRS Online Proc. Libr., 1994, 346, 143–149 Search PubMed.
- C. Lind, Materials, 2012, 5, 1125–1154 Search PubMed.
- A. W. Sleight, Curr. Opin. Solid State Mater. Sci., 1998, 3, 128–131 Search PubMed.
- E. Pachoud, J. Cumby, C. T. Lithgow and J. P. Attfield, J. Am. Chem. Soc., 2018, 140, 636–641 Search PubMed.
- Y. Song, N. Shi, S. Deng, X. Xing and J. Chen, Prog. Mater. Sci., 2021, 121, 100835 Search PubMed.
- N. Shi, Y. Song, X. Xing and J. Chen, Coord. Chem. Rev., 2021, 449, 214204 Search PubMed.
- M. T. Dove, K. O. Trachenko, M. G. Tucker and D. A. Keen, Rev. Mineral. Geochem., 2000, 39, 1–33 Search PubMed.
- B. K. Greve, K. L. Martin, P. L. Lee, P. J. Chupas, K. W. Chapman and A. P. Wilkinson, J. Am. Chem. Soc., 2010, 132, 15496–15498 Search PubMed.
- J. C. Hancock, K. W. Chapman, G. J. Halder, C. R. Morelock, B. S. Kaplan, L. C. Gallington, A. Bongiorno, C. Han, S. Zhou and A. P. Wilkinson, Chem. Mater., 2015, 27, 3912–3918 Search PubMed.
- B. R. Hester, J. C. Hancock, S. H. Lapidus and A. P. Wilkinson, Chem. Mater., 2017, 29, 823–831 Search PubMed.
- L. Hu, J. Chen, J. Xu, N. Wang, F. Han, Y. Ren, Z. Pan, Y. Rong, R. Huang, J. Deng, L. Li and X. Xing, J. Am. Chem. Soc., 2016, 138, 14530–14533 Search PubMed.
- T. Chatterji, T. C. Hansen, M. Brunelli and P. F. Henry, Appl. Phys. Lett., 2009, 94, 241902 Search PubMed.
- T. Chatterji, P. F. Henry, R. Mittal and S. L. Chaplot, Phys. Rev. B: Condens. Matter Mater. Phys., 2008, 78, 134105 Search PubMed.
- T. A. Bird, M. G. L. Wilkinson, D. A. Keen, R. I. Smith, N. C. Bristowe, M. T. Dove, A. E. Phillips and M. S. Senn, Phys. Rev. B: Condens. Matter Mater. Phys., 2021, 104, 214102 Search PubMed.
- T. A. Bird, J. Woodland-Scott, L. Hu, M. T. Wharmby, J. Chen, A. L. Goodwin and M. S. Senn, Phys. Rev. B, 2020, 101, 064306 Search PubMed.
- L. Hu, J. Chen, A. Sanson, H. Wu, C. Guglieri Rodriguez, L. Olivi, Y. Ren, L. Fan, J. Deng and X. Xing, J. Am. Chem. Soc., 2016, 138, 8320–8323 Search PubMed.
- M. T. Dove, Philos. Trans. R. Soc., A, 2019, 377, 20180222 Search PubMed.
- A. P. Wilkinson, R. E. Josefsberg, L. C. Gallington, C. R. Morelock and C. M. Monaco, J. Solid State Chem., 2014, 213, 38–42 Search PubMed.
- J. Z. Tao and A. W. Sleight, J. Solid State Chem., 2003, 173, 45–48 Search PubMed.
- F. J. Brink, L. Norén and R. L. Withers, J. Solid State Chem., 2004, 177, 2177–2182 Search PubMed.
- E. K. Dempsey and J. Cumby, J. Mater. Chem. C, 2023, 11, 1791–1797 Search PubMed.
- B. H. Toby and R. B. Von Dreele, J. Appl. Crystallogr., 2013, 46, 544–549 Search PubMed.
- B. R. Hester and A. P. Wilkinson, Inorg. Chem., 2018, 57, 11275–11281 Search PubMed.
- L. Hu, J. Chen, L. Fan, Y. Ren, Y. Rong, Z. Pan, J. Deng, R. Yu and X. Xing, J. Am. Chem. Soc., 2014, 136, 13566–13569 Search PubMed.
- J. Xu, L. Hu, L. Wang, J. Deng, J. Chen and X. Xing, Acta Phys. – Chim. Sin., 2018, 34, 339 Search PubMed.
- C. R. Morelock, B. K. Greve, L. C. Gallington, K. W. Chapman and A. P. Wilkinson, J. Appl. Phys., 2013, 114, 213501 Search PubMed.
- B. K. Greve, PhD Thesis, Georgia Institute of Technology, 2012.
- H. Kageyama, K. Hayashi, K. Maeda, J. P. Attfield, Z. Hiroi, J. M. Rondinelli and K. R. Poeppelmeier, Nat. Commun., 2018, 9, 772 Search PubMed.
- M. A. Lange, I. Khan, R. Dören, M. Ashraf, A. Qurashi, L. Prädel, M. Panthöfer, M. von der Au, A. Cossmer, J. Pfeifer, B. Meermann, M. Mondeshki, M. N. Tahir and W. Tremel, Dalton Trans., 2021, 50, 6528–6538 Search PubMed.
- M. A. Lange, I. Khan, P. Opitz, J. Hartmann, M. Ashraf, A. Qurashi, L. Prädel, M. Panthöfer, A. Cossmer, J. Pfeifer, F. Simon, M. von der Au, B. Meermann, M. Mondeshki, M. N. Tahir and W. Tremel, Adv. Mater., 2021, 33, 2007434 Search PubMed.
- H. Mizoguchi, M. Orita, M. Hirano, S. Fujitsu, T. Takeuchi and H. Hosono, Appl. Phys. Lett., 2002, 80, 4732–4734 Search PubMed.
- N. H. Bashian, M. B. Preefer, J. Milam-Guerrero, J. J. Zak, C. Sendi, S. A. Ahsan, R. C. Vincent, R. Haiges, K. A. See, R. Seshadri and B. C. Melot, J. Mater. Chem. A, 2020, 8, 12623–12632 Search PubMed.
- L. Permér, J. Solid State Chem., 1992, 97, 105–114 Search PubMed.
Footnote |
| † Electronic supplementary information (ESI) available. See DOI: https://doi.org/10.1039/d3cc06129a |
| This journal is © The Royal Society of Chemistry 2024 |