Facilely printed silk fibroin hydrogel microparticles as injectable long-lasting fillers†
Chunyu
Xie
a,
Xiao
Yang
a,
Fan
Zheng
a,
Jiahao
Shi
a,
Caixia
Huo
b,
Zuyuan
Wang
b,
Rui L.
Reis
cd,
Subhas C.
Kundu
 cd,
Bo
Xiao
 *a and
Lian
Duan
*a
aState Key Laboratory of Resource Insects, College of Sericulture, Textile, and Biomass Sciences, Southwest University, Beibei, Chongqing 400715, China. E-mail: bxiao@swu.edu.cn; lianduan@swu.edu.cn
bBeijing Green Pharmaceutical Technology Co., Ltd, Fengtai, Beijing 100070, China
c3Bs Research Group, I3Bs—Research Institute on Biomaterials, Biodegradables and Biomimetics, University of Minho, Headquarters of the European Institute of Excellence on Tissue Engineering and Regenerative Medicine, AvePark, Barco 4805-017, Guimaraes, Portugal
dICVS/3B's-PT Government Associate Laboratory, Braga, Guimarães, Portugal
First published on 14th November 2023
Abstract
There is a high demand from aging people for facial fillers with desirable biocompatibility and lasting filling effects to overcome facial depression. Novel injectable regenerated silk fibroin (RSF) microparticles were facilely printed from a glycidyl methacrylate-modified silk fibroin hydrogel to address this issue. The β-sheet content and mechanical properties of the RSF hydrogel can be simply modulated by the number of freeze–thawing cycles, and the swelling rate of the RSF hydrogel in saline was negligible. The printed RSF microparticles were uniform, and their diameter was about 300–500 μm, which could be adjusted by the pore sizes of the printed screens. After the injection with a 26-gauge needle, the size distribution of RSF microparticles had no noticeable variation, suggesting that the microparticles could bear the shear strain without breaking during the injection. The in vitro experiments demonstrated that RSF not only had desirable biocompatibility but also facilitated fibroblast migration. The subcutaneous injection experiments demonstrated that the RSF microparticles formed a lasting spot in the injected site. The tissue sections revealed that the RSF microparticles were still distinct on week 8, and blood vessels formed around the microparticles. These promising data demonstrate that the printed RSF microparticles have great potential for facial rejuvenation.
1. Introduction
With advancing age, people usually suffer from facial depression due to the lowered rate of collagen synthesis, leading to great demands for facial rejuvenation.1 Many cosmetic techniques (e.g., facial filling) have been designed and developed to address this issue. Among these techniques, injectable filler plastic surgery is the most attractive one to increase the soft tissue volume and eliminate wrinkles because of the facile operation, tiny trauma, quick recovery and lasting improvement.2,3 In cosmetic medicine, the commonly used injectable fillers include collagen,4,5 hyaluronic acid6,7 and polymethacrylamide methyl ester,8–10 but some defects restrict the promotion. For example, fillers based on collagen and hyaluronic acid have the best histocompatibility and the fewest complications. However, their price is high, and the filling time is short due to the rapid absorption.11–13 Polymethacrylamide methyl ester-based fillers have long-lasting effects, but their biocompatibility is undesirable, which may cause complications, such as inflammatory infections and foreign body granulomas.14–16 Therefore, the development of novel injectable fillers with lasting filling effects, desirable histocompatibility and popular price has great potential in the cosmetic field.Regenerated silk fibroin (RSF), a natural protein obtained from silkworm cocoons, has adequate supplements for raw materials and relatively low price. Strikingly, RSF possesses desirable biocompatibility and excellent biofunctions, including promoting cell proliferation and facilitating angiogenesis, suggesting that RSF is an ideal candidate for producing injectable fillers.17–20 For this purpose, RSF should be manufactured into particles with a diameter of hundreds of micrometers to escape from the phagocytosis of immune cells and avoid being always carried by the body fluid, thus achieving a promising filling effect. Many methods, such as emulsification,21,22 spray-drying,23–25 shattering,26 desolvation,27 phase separation28,29 and microfluidics,30 can convert RSF into microparticles. Nevertheless, some of these methods are cumbersome, and the obtained particles do not have a uniform distribution. More importantly, the size of these RSF microparticles prepared by the abovementioned methods was only dozens of micrometers, which was far from the requirements for facial filling.
In this study, we synthesized methacrylate-modified RSF, a nontoxic, commonly used photocuring material in tissue engineering, to prepare a bulk RSF hydrogel. Thereafter, this hydrogel was facilely printed using a stainless-steel screen with hundreds of micrometers of pore size to produce RSF microparticles with a large diameter, as shown in Fig. 1. The RSF microparticles should be folded without breaking during the injection application and unfolded to fill after the injection. Subsequently, we systematically evaluated the mechanical strength and compressibility of the RSF hydrogel, as well as its β-sheet content, swelling, microstructure, diameter distribution and cytotoxicity. Furthermore, we subcutaneously injected these RSF hydrogel microparticles into the back of rats, and a distinct spot was seen on the injected site during the following observation for 2 months. The tissue section revealed that the degradation of RSF hydrogel microparticles was relatively slow, and the injection did not lead to pathological changes. These promising data suggest that the RSF hydrogel microparticles prepared by the facile print approach have great potential in the cosmetic field.
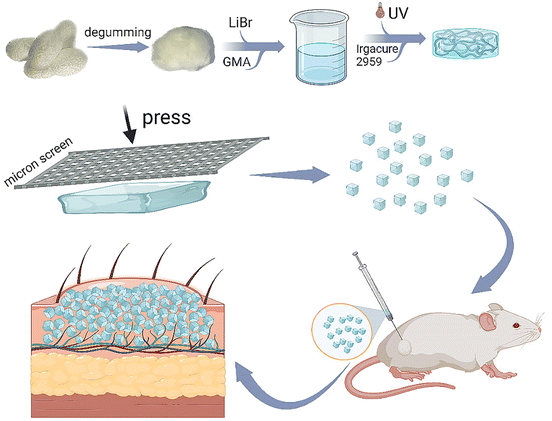 | ||
| Fig. 1 Schematic representation for preparing printed RSF hydrogel microparticles and their application as injectable fillers. | ||
2. Materials and methods
2.1 Materials
B. mori silkworm cocoons were obtained from the State Key Laboratory of Resource Insects (Southwest University, China). Irgacure 2959 was obtained from Sigma-Aldrich (St Louis, USA). Glycidyl methacrylate (GMA), 3-(4,5-dimethyl-2-thiazolyl)-2,5-diphenyl-2h-tetrazolium bromide (MTT), dimethylsulfoxide (DMSO), and Triton X-100 were purchased from Aladdin (Shanghai, China). Collagenase was provided by Beijing Yikang Shengshi Biotechnology Co. Ltd (Beijing, China). Hyaluronic acid (100–140 MDa) was provided by Shaanxi Lucky Medical Technology Co. Ltd (Shaanxi, China).2.2 Fabrication of glycidyl methacrylated SF (GMA-SF)
The cocoons were boiled twice in 0.05 M Na2CO3 solution for 30 min to remove sericin and then cleaned thoroughly with deionized water and dried at 60 °C overnight. The dried cocoons were solubilized in 9.3 M LiBr (lithium bromide) solution for 1 h incubation at 60 °C. Subsequently, GMA was added to the solution at a rate of 0.5 mL min−1 and stirred for 6 h at 60 °C. After the reaction, the solution was dialyzed with deionized water for 4 days (MWCO = 12–14 kDa). Finally, the GMA-SF solution was freeze-dried and stored at −80 °C before use.2.3 Preparation of RSF hydrogel microparticles
Freeze-dried GMA-SF was directly dissolved in deionized water at room temperature to prepare a solution with a concentration of 30%. The photo-initiator (0.4%, Irgacure 2959) was added to the GMA-SF solution. Then, the mixture was transferred to molds and photocured by ultraviolet light irradiation at a wavelength of 365 nm to prepare the RSF hydrogel. The hydrogels were treated by different freeze–thawing cycles to modulate the β-sheet content. The groups were defined as FT-0, FT-1, FT-2 and FT-3 to stand for the specimen treated by 0, 1, 2 and 3 cycles, respectively. The stainless-steel screens with different pore sizes (150 or 200 nm), provided by Shaoxing Shangyu Huafeng Hardware Instruments Co. Ltd (Shaoxing, China), were applied to print the RSF hydrogel, and finally, the RSF microparticles were prepared.2.4 Physicochemical characterization of RSF hydrogel microspheres
2.5 In vitro cytotoxicity and biofunction of RSF hydrogel microparticles
2.6 Subcutaneous injection
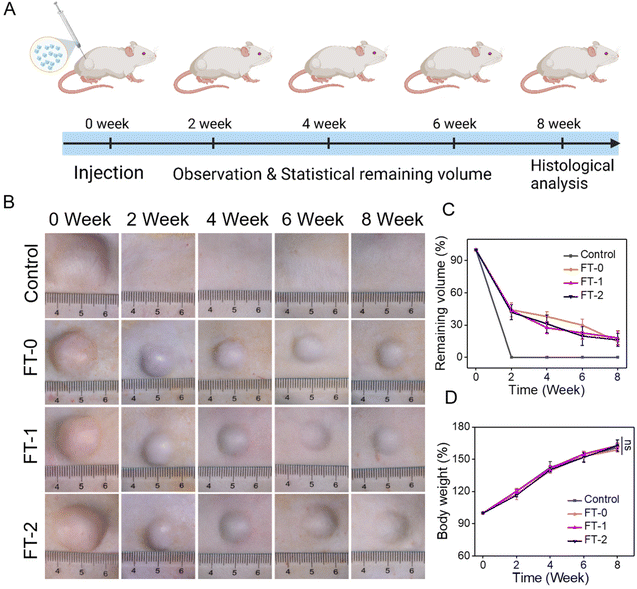
Male Sprague Dawley rats (6 weeks old) were randomly divided into four groups (n = 7 for each group). The RSF hydrogel microparticles (300 mg) were dispersed in 0.3% hyaluronic acid solution (1 mL) and subcutaneously injected into the back of the rats. The rats injected with 0.3% hyaluronic acid were set as the control group. A digital camera recorded the injection sites, and the weight of rats was obtained at predetermined time points (2, 4, 6 and 8 weeks). Meanwhile, one rat in each group was euthanized, and the tissue around the injection site was collected for the section at every time point. The sectioned tissue was applied to evaluate the degradation rate and the biofunctions of RSF hydrogel microparticles through hematoxylin–eosin (H&E) staining, Masson's trichrome staining and fluorescence staining for CD31.All animal experiments were designed with the approval of the ethics department of the Southwest University Committee (IACUC-20230614-01). All animal experiments were conducted following the Guidelines for Nursing and the Use of Laboratory Animals, Southwest University, China. Animals had free access to food and water.
2.7 Statistical analysis
All statistical analyses were performed using Origin 8.0 software. Data were expressed as mean ± standard error of the mean (S.E.M.). Student's t-test, one- or two-way analysis of variance, was used to determine statistically significant differences. The significant differences were *p < 0.05, **p < 0.01, ***p < 0.001 and ns = not significant.3. Results and discussion
3.1 Physicochemical characterization of RSF hydrogels
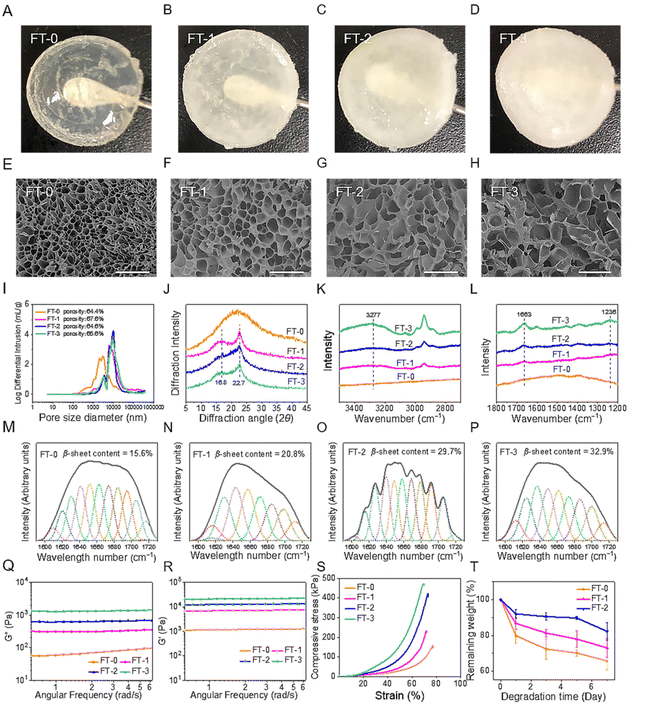
The NMR spectrum (Fig. S1†) revealed that the GMA-SF possessed the proton peaks for the methacrylate vinyl group (δ = 6.2–6.0 and 5.8–5.6 ppm) and the methyl group (δ = 1.8 ppm), which demonstrated the successful functionalization of the methacrylate groups on RSF.31 Subsequently, the GMA-SF solution was photo-crosslinked to obtain the RSF hydrogel. In particular, the β-sheet structure is a crucial factor that may influence the biocompatibility and degradation rate of the RSF-based materials.32 Therefore, we applied the freeze–thawing method to modulate the β-sheet structure content in the RSF hydrogel. As shown in Fig. 2A–D, we prepared 4 types of RSF hydrogel with different freezing and thawing cycles. It was clear that the hydrogel's transparency was inversely proportional to the number of cycles. FT-0 possessed decent clarity, but FT-3 was utterly opaque. The SEM images (Fig. 2E–H) exhibited that all the hydrogels had homogeneous and interconnected porous structures, regardless of the number of cycles. The pore size of all RSF hydrogels was about several tens of micrometers, which was large enough to accommodate the migrated cells. We also quantified the porosity and pore-size distribution of the RSF hydrogel by the mercury intrusion method. Fig. 2I shows that the average pore size of the RSF hydrogels with freeze–thawing treatment was larger than that of FT-0, consistent with the SEM results. Additionally, the porosities of FT-0, FT-1, FT-2 and FT-3 were 66.4%, 67.6%, 64.6% and 65.6%, respectively, suggesting that the freeze–thawing had no obvious influence on the porosity of the RSF hydrogel.The crystal structure of the RSF hydrogel was first evaluated by XRD analysis (Fig. 2J). FT-0 exhibited a broadened peak located around 20°, suggesting the lower content of β-sheets. In contrast, RSF hydrogels with freeze–thawing treatment exhibited a much different XRD spectrum. These hydrogels contained 2 diffraction peaks at 16.7° and 22.8°, respectively, indicating a considerable proportion of β-sheets. To further assess the content of β-sheet in the RSF hydrogel, Raman spectroscopy was applied to measure the specimens. Fig. 2K shows that a peak around 3277 cm−1, corresponding to β-sheets (N–H), was observed in FT-1, FT-2 and FT-3, but no peak was observed in the same region of the spectrum for FT-0. Fig. 2L shows that FT-1, FT-2 and FT-3 possessed peaks corresponding to the β-sheet located at 1663 cm−1 (C![[double bond, length as m-dash]](https://www.rsc.org/images/entities/char_e001.gif) O in amid I) and 1236 cm−1 (C–N in amide III), but FT-0 still had no rise in the same region. These data also confirmed that the freeze–thawing treatment improved the content of β-sheets. The FTIR spectrum was recorded to calculate the range of β-sheets in different RSF hydrogels. The FTIR spectra of all hydrogels contained peaks at 1651 cm−1 (C
O in amid I) and 1236 cm−1 (C–N in amide III), but FT-0 still had no rise in the same region. These data also confirmed that the freeze–thawing treatment improved the content of β-sheets. The FTIR spectrum was recorded to calculate the range of β-sheets in different RSF hydrogels. The FTIR spectra of all hydrogels contained peaks at 1651 cm−1 (C![[double bond, length as m-dash]](https://www.rsc.org/images/entities/char_e001.gif) O, amide I), 1529 cm−1 (N–H, amide II) and 1240 cm−1 (C–N, amide III) (Fig. S2†). Deconvolution was used to quantify the variation of the secondary structure. As shown in Fig. 2M–P, the content of the β-sheet structure in hydrogels increased from 15.6% to 32.9% when the number of freeze–thawing cycles increased from 0 to 3, which confirmed that the content of β-sheets in the RSF hydrogel can be modulated by the freeze–thawing method. Besides, the increasing content of the β-sheet structure in the hydrogel caused an increased proportion of diffuse reflection light, leading to the decreased transparency, as illustrated in Fig. 2A–D.
O, amide I), 1529 cm−1 (N–H, amide II) and 1240 cm−1 (C–N, amide III) (Fig. S2†). Deconvolution was used to quantify the variation of the secondary structure. As shown in Fig. 2M–P, the content of the β-sheet structure in hydrogels increased from 15.6% to 32.9% when the number of freeze–thawing cycles increased from 0 to 3, which confirmed that the content of β-sheets in the RSF hydrogel can be modulated by the freeze–thawing method. Besides, the increasing content of the β-sheet structure in the hydrogel caused an increased proportion of diffuse reflection light, leading to the decreased transparency, as illustrated in Fig. 2A–D.
The mechanical property is another critical index for injection. During the injection process, the hydrogel was compressed under sizeable shear stress. In this case, the hydrogel must possess desirable mechanical strength and compressibility for injection.33,34 We measured the viscoelastic properties of different RSF hydrogels. As illustrated in Fig. 2Q and R, all RSF hydrogels exhibited a steady hydrogel state, and the values of storage modulus (G′) were always larger than those of loss modulus (G′′) for the testing range. Additionally, the values of G′ and G′′ were directly proportional to the number of freeze–thawing cycles. The values of G′ for FT-1, FT-2, and FT-3 were 5-, 10- and 17-fold larger than those for FT-0, respectively. This variation can be explained by the increased content of β-sheet in the hydrogel.35 The compressive strain–stress curves of different RSF hydrogels are shown in Fig. 2S. Notably, all the RSF hydrogels can bear 70% compressive strain without a break, suggesting that they can be significantly compressed during the injection. In contrast, physically cross-linked (e.g., only cross-linked by the β-sheet structure) RSF hydrogels tend to irreversibly deform under external force and can be applied as injectable materials for biomedical application.36 This type of RSF hydrogel can't provide enough support for skin filling due to its weak mechanical properties. Recently, RSF hydrogels with outstanding mechanical properties have been constructed according to the principle of double network (DN) hydrogels. For example, a DN hydrogel based on RSF and polyacrylamide can bear great strain (90%) without breaking under great compressive stress (4.9 MPa).37 However, the DN RSF hydrogel is also unsuitable for injectable skin fillers because the great compressive stress may cause the block of needle or obvious pain for the patients. Besides, as illustrated in Fig. 2S, the compressive stress of the RSF hydrogel dramatically increased with increasing the number of freeze–thawing cycles, indicating that the hydrogel with freeze–thawing treatment needed higher force to be injected. The compressive stress (70% strain) for FT-3 sharply increased to more than 450 kPa, which was about 3 times larger than that for FT-0. The significantly higher compressive stress adversely impacts injection, which may cause the jamming of the needle. Therefore, FT-3 was abandoned in the following experiments.
The degradation rate is important for skin fillers because it directly corresponds to the lasting time after being filled.38,39 Therefore, we evaluated the in vitro degradation rate of the RSF hydrogel in the presence of collagenase, as shown in Fig. 3T. It was obvious that the RSF hydrogels were dramatically degraded with the treatment of collagenase. After incubation for 7 days, the remaining weight for FT-0, FT-1, and FT-2 was 65.7%, 73.0%, and 82.3%, respectively. This result suggested that the freezing and thawing treatment obviously improved the enzymatic resistance of fibroin. Furthermore, in view of the much higher concentration of collagenase adopted (30 U mL−1), we speculate that the degradation rate in vivo will be much slower and the RSF hydrogel may achieve a lasting filling effect.
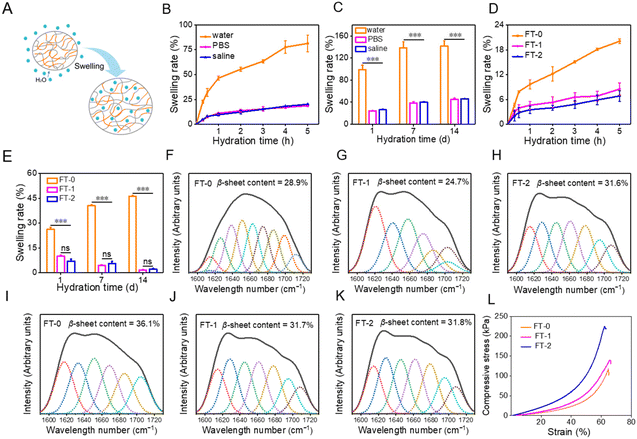
3.2 Swelling of RSF hydrogels
Hydrogels naturally swell in water, as illustrated in Fig. 3A, which may influence the mechanical properties and injectability of RSF hydrogels. We first evaluated the swelling of FT-0. As described in Fig. 3B, the swelling rate for FT-0 was 81.4% (in water), 18.7% (in PBS) and 20.1% (in saline) after hydration for 5 h, respectively. When the hydration time was prolonged to 14 d, the swelling of the hydrogel was equilibrated. Fig. 3C shows that the final swelling rate for FT-0 was 142.0% (in deionized water), 45.1% (in PBS) and 46.1% (in saline), respectively. This result revealed that the RSF hydrogel had a much higher swelling rate in deionized water than in PBS and saline. For clinical application, the dispersion must be prepared with saline. Therefore, we systematically evaluated the swelling of different RSF hydrogels in saline. Fig. 3D shows that the swelling rates for FT-0, FT-1 and FT-2 in saline were about 20.1%, 8.5% and 6.8% after hydration for 5 h, respectively. Fig. S3† shows the images of FT-0, FT-1 and FT-2 after hydration at different times; no noticeable swelling was observed. When the hydration time was prolonged to 14 d (Fig. 3E), the swelling rate for FT-0, FT-1 and FT-2 in saline was about 46.1%, 1.6% and 2.2%, respectively. The expansion rate indicated that the freeze–thawing treatment can decrease RSF hydrogel swelling. Previous research reported that β-sheets resulted in the formation of a physical crosslink, which increased the hydrogel network.40,41 Therefore, we adopted a deconvoluted FTIR spectrum (Fig. S4†) to quantify the content of β-sheets in the hydrogel after hydration in saline for 1 and 2 months. As illustrated in Fig. 3F–H, the content of β-sheets was 28.9%, 24.7% and 31.6% after hydration for 1 month, respectively, followed by 36.1%, 31.7% and 31.8% after hydration for 2 months, respectively (Fig. 3I–K). This variation demonstrated that the freeze–thawing treatment can increase the content of β-sheets in the RSF hydrogel, regardless of hydration in saline or not, thus decreasing the swelling of the hydrogel. Although the swelling of the RSF hydrogel in saline was tiny, it may also negatively influence the mechanical properties and injectability. To address this point, we evaluated the compressive strain–stress curves of the RSF hydrogel after hydration in saline. Fig. 3L indicates that the compressibility for RSF hydrogels was slightly decreased after hydration, but these hydrogels still can bear 60% compressive strain without a break, indicating that the swelled RSF hydrogel still can be applied for injection.3.3 Preparation and characterization of RSF hydrogel microparticles
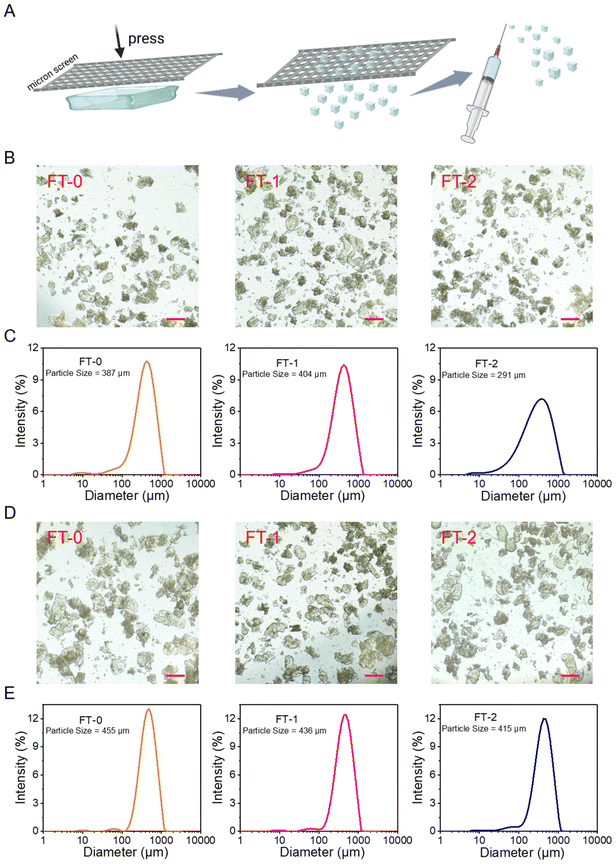
The bulk RSF hydrogel should be cut into microparticles to fit the 26-gauge needle (inner diameter = 260 μm), the commonly used specification in cosmetic medicine. To address this point, we used stainless steel screens with different pore sizes to print the bulk RSF hydrogel into microparticles, as illustrated in Fig. 4A. Fig. S5A and B† show the photograph and microscopic image of a screen with a pore size of 200 microns. Fig. S6A† shows the microscopic images of RSF microparticles printed by the screen. The particles made from FT-0, FT-1 or FT-2 had similar diameters; they were all several hundreds of micrometers. The DLS data (Fig. S6B†) reflected that these three types of microparticles had uniform size distribution and the hydrodynamic mean particle size was 526, 502 and 491 μm for FT-0, FT-1 and FT-2, respectively. These promising data demonstrate that printing by screens is a facile and efficient approach to preparing uniform microparticles. Nevertheless, these particles blocked the 26-gauge needle during the injection. This phenomenon might be attributed to the larger size of the microparticles. Therefore, as shown in Fig. S7A and B,† the screens with smaller pore sizes (150 μm) were adopted to print the bulk RSF hydrogel. The microscopy images in Fig. 4B show that the particles made from FT-0, FT-1 or FT-2 had similar diameters (several hundreds of micrometers) after printing. The DLS data (Fig. 4C) revealed that these particles also had uniform size distribution, and the hydrodynamic mean particle size was 387, 404 and 291 μm for FT-0, FT-1 and FT-2, respectively, which were much smaller than those printed by screens with 200 μm pore size. These microparticles can pass the 26-gauge needle smoothly during the injection experiments, suggesting that adjusting the pore size of the screen is a simple approach to obtaining microparticles fitting for different gauges of needles. Although the size of these microparticles was much larger than 260 μm, the inner diameter of the 26-gauge needle, the compressive strain–stress curves demonstrated that all RSF hydrogels can bear 60% compressive strain without break. Therefore, these microparticles can be considerably compressed under shear stress during the injection, thus passing the needle.Whether the microparticles break or not during the injection process is an essential index for dermal fillers because the fragments are easily carried away by the flowing body fluid or phagocytosed by immune cells, which is harmful to the filling. Therefore, we also evaluated the size of injected microparticles by microscopy and DLS. Fig. 4D shows that all the injected particles had a diameter of several hundreds of micrometers, and no apparent break was observed. Fig. 4E reveals that the injected particles still had a uniform size distribution. The hydrodynamic mean particle size was 455, 436 and 415 μm for FT-0, FT-1 and FT-2 after injection, respectively, which were similar to the data of particles before injection, indicating that these microparticles possessed desirable injectability and could bear the shear stress without a break.
3.4 In vitro cytocompatibility and cell migration of RSF hydrogel microparticles
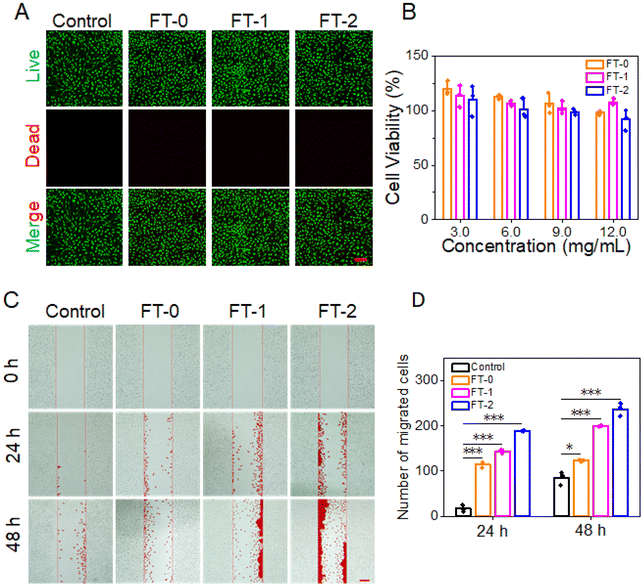
Cytotoxicity is the prerequisite for clinical application.42 We adopt the live/dead staining and MTT assay to determine the cytotoxicity of RSF hydrogel microparticles. As shown in Fig. 5A, L929 cells exhibited predominant green fluorescence (live cell), and the red fluorescence standing for dead cells was scarcely observed, demonstrating that the co-incubation would not lead to the death of L929 cells. Fig. 5B lists the cell viability after co-incubation for 24 h. The cell viability was more significant than 80% when the concentration of RSF hydrogel microparticles was below 9 mg mL−1. The live/dead staining data and MTT assay determined that all the RSF hydrogel microparticles had desirable biocompatibility.Previous research reported that RSF can promote the migration of fibroblasts.43,44In vivo, fibroblasts can synthesize collagen fibrils, which is beneficial for dermal filling. Given this, we designed a scratching experiment to confirm whether the RSF hydrogel microparticles can facilitate the migration of L929. Fig. 5C shows that FT-0, FT-1 and FT-2 dramatically stimulated the migration of L929 into the scratched area on both 24 and 48 h. In particular, the FT-2 group had the most significant number of migrated cells, followed by the FT-1 group. The corresponding quantification of migrated cells is listed in Fig. 5D. After incubating for 48 h, about 123.3 ± 2.1 cells migrated into the scratched area in the FT-0 group, 200.0 ± 1.0 cells in the FT-1 group and 237.3 ± 14.2 cells in the FT-2 group, which were several fold higher than those for the control group (85.0 ± 15.1 cells). These prospective data suggested that the RSF hydrogel microparticles may facilitate the fibroblast migrating to the injected site, thus benefiting the deposition of collagen fibrils.
3.5 Subcutaneous injection
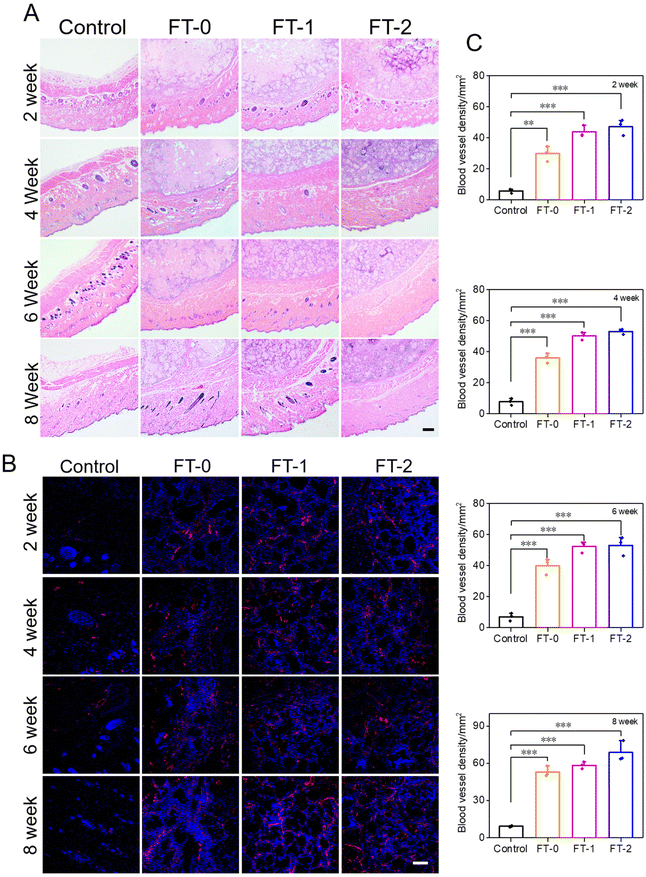
The injectability and biocompatibility of RSF hydrogel microparticles had been confirmed via a previous study. Subcutaneous injection experiments were performed, as shown in Fig. 6A, to verify the filling efficiency and degradation rate of microparticles in vivo. The RSF hydrogel microparticles were dispersed in hyaluronic acid solution, the commonly used dispersion medium in cosmetic medicine, and subcutaneously injected into rats for monitoring the filling efficiency in the following 8 weeks. As shown in Fig. 6B, rats in each group immediately formed a spot with a diameter of 20 mm after the injection. Notably, the spot in the control group completely disappeared 2 weeks later. In contrast, the spot in the FT-0, FT-1 and FT-2 groups was still distinct, and the size decreased to about 10 mm. When the time prolonged to 4, 6 and 8 weeks, the spot in the FT-0, FT-1 and FT-2 groups only shrunk slightly. Mainly, as listed in Fig. S8,† the spot still existed on the back of rats when the time was further prolonged to 12 weeks, suggesting a desirable filling efficiency. The corresponding semi-quantification of the spot volume in Fig. 6C also exhibited a similar trend. For the control group, the fluidity of hyaluronic acid solution can explain the quickly disappearing spot. For the FT-0, FT-1 and FT-2 groups, the rapidly decreased spot size in the first 2 weeks was also mainly attributed to the flowing hyaluronic acid. The RSF hydrogel microparticles were non-flowing and could be deposited on the injected sites, thus leading to the lasting filling effect. Meanwhile, we monitored the rats’ body weight variation, as shown in Fig. 6D. The data revealed no significant difference between the control and experimental groups, which also demonstrated the biosafety of RSF hydrogel microparticles.During the injection experiment, the tissue of the spot was harvested at predetermined time points and then sectioned for H&E staining. As shown in Fig. 7A, we did not observe any injectant in the tissue section of the control group, which coincided with the disappeared spot in Fig. 6B. In contrast, microparticles can be seen in the other groups. Furthermore, the size of RSF hydrogel microparticles had no apparent decrease, and the microparticles had no crack with prolonged time, suggesting a relatively low degradation rate in vivo. The Masson's trichrome staining in Fig. S9† also exhibited a similar trend. These results confirmed that the RSF hydrogel microparticles can fill the injection sites for a long time. Besides, we determined the newly formed blood vessels in the spot tissue via the fluorescent staining for CD31. As shown in Fig. 7B, many cells (blue for DAPI) aggregated, and some hollows were notable among the cells in FT-0, FT-1 and FT-2 groups, which indicated that the microparticles were enveloped by cells. The red fluorescence for CD31 was also remarkable, confirming the existence of newly formed vessels. The corresponding quantification for CD31 (Fig. 7C) revealed that after 2 weeks of injection, the relative fluorescence intensity for CD31 was 5.8, 29.8, 43.8 and 47.1, respectively, which increased to 9.3, 53.1, 58.4 and 68.7 at week 8, confirming that the blood density in FT-0, FT-1 and FT-2 was significantly higher than that in the control group. Blood vessels provide necessary nutrients and oxygen for the newly formed tissues. Therefore, we conjectured that the injected RSF hydrogel microparticles may induce the growth of tissues and might achieve a permanent filling efficiency after the complete degradation.
During the injection experiments, we also monitored the blood parameters of rats at every time point. As shown in Fig. S10,† the hematological analysis showed that the blood parameters had no significant difference among different groups. Furthermore, we evaluated the histopathology of the major organs (heart, liver, spleen, lungs and kidneys), and no obvious abnormality was observed, as shown in Fig. S11.† These results confirmed the desirable biosafety of RSF hydrogel microparticles, thus ensuring their potential in cosmetic medicine.
4. Conclusions
A bulk RSF hydrogel was facilely printed into microparticles using screens to prepare biocompatible facial fillers with a lasting impact and popular cost. The obtained RSF hydrogel microparticles possessed uniform size distribution and desirable mechanical properties, ensuring that the microparticles could smoothly pass the 26-gauge needle without breaking. The subcutaneous injection experiments suggested that the RSF microparticles formed lasting spots on the site during the following 2 months. The tissue section confirmed that these microparticles had no noticeable degradation and blood vessels formed around the microparticles. These data demonstrate that printing is a facile approach to obtain a promising RSF-based injectable filler for cosmetic medicine.Conflicts of interest
The authors declare that they have no known financial interests or personal relationships.Acknowledgements
This study was supported by the National Natural Science Foundation of China (82072060 and 22008201), the Science and Technology Department of Jiangxi Province (20212BDH81019 and 20224BAB206073), the Fundamental Research Funds for the Central Universities (SWU-XDPY22006 and SWU-KQ22075), the Venture & Innovation Support Program for Chongqing Overseas Returnees (2205012980212766), and the Distinguished Young Scholars of Chongqing (2022NSCQ-JQX5279).References
- J. Varani, M. K. Dame, L. Rittie, S. E. Fligiel, S. Kang, G. J. Fisher and J. J. Voorhees, Am. J. Pathol., 2006, 168, 1861–1868 CrossRef CAS PubMed.
- M. Tilton, E. T. Camilleri, M. D. Astudillo Potes, B. Gaihre, X. Liu, F. Lucien, B. D. Elder and L. Lu, Biomater. Adv., 2023, 153, 213539 CrossRef CAS.
- D. Bertossi, L. Lanaro, S. Dorelan, K. Johanssen and P. Nocini, Plast. Reconstr. Surg., 2019, 143, 428–439 CrossRef CAS.
- S. A. Grant, J. Zhu, J. Gootee, C. L. Snider, M. Bellrichard and D. A. Grant, Tissue Eng. Part A, 2018, 24, 1091–1098 CrossRef CAS PubMed.
- G. Montalbano, S. Toumpaniari, A. Popov, P. Duan, J. Chen, K. Dalgarno, W. E. Scott 3rd and A. M. Ferreira, Mater. Sci. Eng., C, 2018, 91, 236–246 CrossRef CAS.
- C. Chun, D. Y. Lee, J. T. Kim, M. K. Kwon, Y. Z. Kim and S. S. Kim, Biomater. Res., 2016, 20, 24 CrossRef PubMed.
- B. M. Hong, G. L. Hong, M. A. Gwak, K. H. Kim, J. E. Jeong, J. Y. Jung, S. A. Park and W. H. Park, Int. J. Biol. Macromol., 2021, 185, 98–110 CrossRef CAS.
- E. Ho, A. Lowman and M. Marcolongo, Biomacromolecules, 2006, 7, 3223–3228 CrossRef CAS PubMed.
- B. J. Klotz, D. Gawlitta, A. Rosenberg, J. Malda and F. P. W. Melchels, Trends Biotechnol., 2016, 34, 394–407 CrossRef CAS.
- L. Kessler, S. Gehrke, M. Winnefeld, B. Huber, E. Hoch, T. Walter, R. Wyrwa, M. Schnabelrauch, M. Schmidt, M. Kückelhaus, M. Lehnhardt, T. Hirsch and F. Jacobsen, J. Tissue Eng., 2017, 8, 1–14 Search PubMed.
- K. Saravanakumar, S. Park, S. S. Santosh, A. Ganeshalingam, G. Thiripuranathar, A. Sathiyaseelan, S. Vijayasarathy, A. Swaminathan, V. V. Priya and M. H. Wang, Int. J. Biol. Macromol., 2022, 222, 2744–2760 CrossRef CAS.
- J. Alijotas-Reig and V. Garcia-Gimenez, J. Eur. Acad. Dermatol. Venereol., 2008, 22, 150–161 CrossRef CAS.
- S. M. Daines and E. F. Williams, JAMA Facial Plast. Surg., 2013, 15, 226–231 CrossRef PubMed.
- Q. Gao, L. Duan, X. Feng and W. Xu, Chin. Chem. Lett., 2021, 32, 577–582 CrossRef CAS.
- D. Chan, C. L. Maikawa, A. I. d'Aquino, S. S. Raghavan, M. L. Troxell and E. A. Appel, J. Biomed. Mater. Res., Part A, 2023, 111, 910–920 CrossRef CAS PubMed.
- A. Rivkin, Dermatol. Surg., 2014, 40, 305–313 CrossRef CAS.
- Y. Wang, H.-J. Kim, G. Vunjak-Novakovic and D. L. Kaplan, Biomaterials, 2006, 27, 6064–6082 CrossRef CAS.
- C. Vepari and D. L. Kaplan, Prog. Polym. Sci., 2007, 32, 991–1007 CrossRef CAS.
- H. Tao, D. L. Kaplan and F. G. Omenetto, Adv. Mater., 2012, 24, 2824–2837 CrossRef CAS.
- H. Y. Wang and Y. Q. Zhang, Biotechnol. Prog., 2015, 31, 630–640 CrossRef CAS.
- Q. Han, T. Zheng, L. Zhang, N. Wu, J. Liang, H. Wu and G. Li, J. Biomater. Sci., Polym. Ed., 2022, 33, 747–768 CrossRef CAS PubMed.
- X. Wu, L. Ge, G. Shen, Y. He, Z. Xu, D. Li, C. Mu, L. Zhao and W. Zhang, ACS Appl. Mater. Interfaces, 2022, 14, 21848–21859 CrossRef CAS.
- T. Hino, M. Tanimoto and S. Shimabayashi, J. Colloid Interface Sci., 2003, 266, 68–73 CrossRef CAS.
- X. Wen, X. Peng, H. Fu, Y. Dong, K. Han, J. Su, Z. Wang, R. Wang, X. Pan, L. Huang and C. Wu, Int. J. Pharm., 2011, 416, 195–201 CrossRef CAS PubMed.
- S. Farago, G. Lucconi, S. Perteghella, B. Vigani, G. Tripodo, M. Sorrenti, L. Catenacci, A. Boschi, M. Faustini, D. Vigo, T. Chlapanidas, M. Marazzi and M. L. Torre, Pharm. Dev. Technol., 2016, 21, 453–462 CAS.
- L. B. Shi, H. X. Cai, L. K. Chen, Y. Wu, S. A. Zhu, X. N. Gong, Y. X. Xia, H. W. Ouyang and X. H. Zou, Biomaterials, 2014, 35, 1519–1530 CrossRef CAS PubMed.
- A. Rodriguez-Nogales, A. A. Lozano-Pérez, S. D. Aznar-Cervantes, F. Algieri, J. Garrido-Mesa, N. Garrido-Mesa, T. Vezza, M. P. Utrilla, J. L. Cenis, M. E. Rodríguez-Cabezas and J. Gálvez, Int. J. Pharm., 2016, 511, 1–9 CrossRef CAS PubMed.
- J. Wu, Z. Zheng, G. Li, D. L. Kaplan and X. Wang, Acta Biomater., 2016, 39, 156–168 CrossRef CAS PubMed.
- J. Wu, X. Xie, Z. Zheng, G. Li, X. Wang and Y. Wang, Mater. Sci. Eng., C, 2017, 80, 549–557 CrossRef CAS.
- D. N. Breslauer, S. J. Muller and L. P. Lee, Biomacromolecules, 2010, 11, 643–647 CrossRef CAS.
- Y. J. Lee, J. S. Lee, O. Ajiteru, O. J. Lee, J. S. Lee, H. Lee, S. W. Kim, J. W. Park, K. Y. Kim, K. Y. Choi, H. Hong, T. Sultan, S. H. Kim and C. H. Park, Int. J. Biol. Macromol., 2022, 213, 317–327 CrossRef CAS PubMed.
- M. Choi, D. Choi and J. Hong, Biomacromolecules, 2018, 19, 3096–3103 CrossRef CAS PubMed.
- A. Charlet, F. Bono and E. Amstad, Chem. Sci., 2022, 13, 3082–3093 RSC.
- D. Yao, M. Li, T. Wang, F. Sun, C. Su and T. Shi, ACS Biomater. Sci. Eng., 2021, 7, 636–647 CrossRef CAS.
- L. M. De Leon Rodriguez, Y. Hemar, J. Cornish and M. A. Brimble, Chem. Soc. Rev., 2016, 45, 4797–4824 RSC.
- J. W. Liu, Z. Z. Ding, G. Z. Lu, J. G. Wang, L. Wang and Q. Lu, Macromol. Biosci., 2019, 19, e1900326 CrossRef PubMed.
- F. Chen, S. P. Lu, L. Zhu, Z. Q. Tang, Q. L. Wang, G. Qin, J. Yang, G. Z. Sun, Q. Zhang and Q. Chen, J. Mater. Chem. B, 2019, 7, 1708–1715 RSC.
- R. You, Y. Xu, Y. Liu, X. Li and M. Li, Biomed. Mater., 2014, 10, 015003 CrossRef.
- Z. D. Gu, L. Chen, Y. C. Xu, Y. S. Liu, Z. G. Zhao, C. Q. Zhao, W. W. Lei, Q. F. Rong, R. C. Fang, T. Y. Zhao and M. J. Liu, ACS Appl. Mater. Interfaces, 2018, 10, 4161–4167 CrossRef CAS.
- D. E. Clarke, E. T. Pashuck, S. Bertazzo, J. V. M. Weaver and M. M. Stevens, J. Am. Chem. Soc., 2017, 139, 7250–7255 CrossRef CAS.
- Y. Xiang, J. Zhang, H. Mao, Z. Yan, X. Wang, C. Bao and L. Zhu, Biomacromolecules, 2021, 22, 4846–4856 CrossRef CAS PubMed.
- M. Thomas, L. George, J. Mathew, D. G. Mathew and P. Thomas, J. Conservative Dent., 2023, 26, 182–187 CAS.
- F. Sun, D. Xiao, H. Su, Z. Chen, B. Wang, X. Feng, Z. Mao and X. Sui, J. Mater. Chem. B, 2023, 11, 1486–1494 RSC.
- J. Liu, X. Xie, T. Wang, H. Chen, Y. Fu, X. Cheng, J. Wu, G. Li, C. Liu, H. Liimatainen, Z. Zheng, X. Wang and D. L. Kaplan, ACS Appl. Mater. Interfaces, 2023, 15, 12696–12707 CrossRef CAS.
Footnote |
| † Electronic supplementary information (ESI) available. See DOI: https://doi.org/10.1039/d3bm01488f |
| This journal is © The Royal Society of Chemistry 2024 |


