DOI:
10.1039/D3TC03625A
(Paper)
J. Mater. Chem. C, 2023,
11, 16201-16213
Portable and non-invasive fluorescent thin films from photocatalytically active carbon dots for selective and trace-level detection of picric acid†
Received
6th October 2023
, Accepted 23rd October 2023
First published on 24th October 2023
Abstract
Portable fluorescent (FL) sensors for on-site detection of pollutants have strong implications in the practical world. Herein, we report a simple one-pot synthesis of N, S and P-doped carbon dots (CDs) derived from C. thevetia flowers (TF-CDs), which exhibit selectivity for the sensitive detection of picric acid (PA). Further integration of this FL probe onto polyvinylidene fluoride (PVDF) enables the fabrication of a highly porous, thin, and flexible TF-CD@PVDF film strip via a simple phase inversion method, enabling the selective and trace-level detection of a potent explosive, picric acid (PA). The TF-CD@PVDF strip shows a limit of detection (LOD) of 244 nM for PA, whereas TF-CD itself in suspended form shows sensitivity as low as 104 nM. The findings reveal a static quenching mechanism for TF-CDs in the presence of PA. As the application of TF-CD is not restricted to sensing, its potency towards sunlight photodegradation of methyl orange (MO), an azo dye, is also investigated. TF-CDs showed fast degradation kinetics for MO under sunlight with a removal efficiency of 96.8% in about 60 min. The real sample analysis was further performed by externally spiking real water samples, validating the real-world applicability of the as-prepared TF-CDs for the sensing and decontamination of polluted water. The present study paves the way for designing portable, flexible florescent platforms for extended applications.
1. Introduction
Enabling the smart and versatile detection and remediation of environmental pollutants has strong implications in the modern era. In the past decade, carbon dots (CDs) have been proven to be an efficient fluorescent (FL) sensor due to their exceptional and stable luminescence properties with minimal photobleaching and excellent biocompatibility.1–3 The abundance of various precursor molecules and simple synthetic routes with ease of surface modification make CDs quite versatile and highly useful in myriad applications such as sensing,4 bio-imaging,5 drug delivery,6 energy storage,7 photodynamic therapy,8 photocatalysis,9etc. Recent studies have shown that the CD structure could be more effectively controlled by the wise selection of the carbon precursor. Unlike top–down approaches, a logical manipulation of the CD structure is possible in bottom–up approaches.10 It has been established that structural features of precursor fragments are retained to various degrees during the partial carbonization step of CD formation as per the specific synthetic parameters employed.11 Although the mechanism behind the structural formation is yet to be fully understood, a large number of oxygen–nitrogen containing groups or polymerizable functionalities like –OH, –NH2, –COOH, –C![[double bond, length as m-dash]](https://www.rsc.org/images/entities/char_e001.gif) O, –CC–, etc., in the precursor units facilitate the polymerization–carbonization process under hydrothermal conditions.12 From this point of view, several biomass-based precursors, viz., lignocellulose,13 pectin,14 vitamins,15 amino acids,16 tannins,17 alkaloids18etc., that are rich in polyols, amines, heteroaromatics and/or carbonyl groups, have been exploited as the major carbon source, which represents a green and cost effective approach to achieve desirable end optoelectronic attributes such as luminescence in the intended CDs.19,20
O, –CC–, etc., in the precursor units facilitate the polymerization–carbonization process under hydrothermal conditions.12 From this point of view, several biomass-based precursors, viz., lignocellulose,13 pectin,14 vitamins,15 amino acids,16 tannins,17 alkaloids18etc., that are rich in polyols, amines, heteroaromatics and/or carbonyl groups, have been exploited as the major carbon source, which represents a green and cost effective approach to achieve desirable end optoelectronic attributes such as luminescence in the intended CDs.19,20
The photophysical properties of CDs not only make them a good candidate for the detection of a wide range of pollutants but also enable the removal of several waste water contaminants through the photocatalytic degradation pathway.21,22 The exponential increase in harmful contaminants such as explosives and organic dyes in water bodies requires stern actions for their trace-level detection, quantification and/or their removal for a clean and sustainable ecosystem. Picric acid (PA), a key member of the nitroaromatic compound (NAC) family, is extensively utilized in the production of matches, glass, rocket fuel, dyes, and pharmaceuticals.23 It is known for its high explosive power with low safety value and high detonation velocity and is considered a significant groundwater contaminant as it is a potent irritant and allergen.24 PA is discharged into the water ecosystem either directly or indirectly, leading to several diseases like liver dysfunction, cyanosis, anemia, and other chronic disorders as well as skin and eye irritation in exposed mammals including human.25 Therefore, effective monitoring and trace level detection of PA are urgently required for the social and environmental safety.26 Until now, many fluorescent systems have been employed for detecting NACs. The most successful demonstrations of FL detection of PA were focused mainly on graphene QDs,27 semiconductor QDs,28 perovskite QDs,29 fluorescent polymers,30 metal–organic frameworks,31,32 chemosensors,33,34 supramolecular assembly,35etc. A very few reports are available with CDs as FL probes for detecting PA, and even they are in the solution phase.36,37 Also, a plentiful reports available for detecting a wide range of other pollutants (e.g., metal ions, pharmaceuticals, and dyes) were mostly carried out in aqueous medium.37,38 This makes the process simple but limits the recyclability/reusability of CDs as a practical sensor since CDs tend to agglomerate in aqueous medium upon the addition of foreign analytes due to electrostatic interactions among them.39
Parallel efforts have been invested to fabricate flexible CD composites to confront the above mentioned issues.40–42 An effective way is to integrate the sensor material with a stable polymer matrix without compromising the FL properties of the luminescent probe. This helps to make the sensor portable and reusable, enabling fast and sensitive on-site detection of pollutants.43–45 Many polymeric platforms have been reported to form a film-based fluorescent platform for detecting potential pollutants by incorporating various PL sensing probes. Howsoever, most of the FL polymeric sensor strips or films reported so far46–48 lack the combined merits of a simple fabrication procedure, high LOD with good selectivity, portability, less toxicity, least photo bleachability and multicycle detection ability. Cross-linking with starch,49 physical incorporation with PVA,50 TLC plates51 or SiO2 based nanomesh scaffold technology,52etc. are some strategies which have been employed to integrate a FL active sensing probe with a film platform. In this respect, polyvinylidene fluoride (PVDF) can be considered as potential candidate for thin film formation due to its high thermal stability and chemical resistance, mechanical strength, flexibility environmental friendly nature and low cost.53,54 Its inherent hydrophobicity and excellent binding properties ensure a high mechanical robustness in aqueous systems, preventing the gradual leaching of hydrophilic FL active components from the composite film.
Herein, we have utilized fluorescent carbon dots derived from C. thevetia flowers (as a green multicomponent carbon source that adds desired functionalities to the final CD structure) and N, S and P doping agents for the fabrication of luminescent, photo catalytically active N, S and P-doped CDs (TF-CD). A highly porous, thin, flexible, and reusable TF-CD@PVDF strip is then fabricated by a simple phase-inversion method, enabling easy and selective sensing of PA without compromising much sensitivity (with a LOD of 244 nM). Furthermore, the photocatalytic efficacy of TF-CDs for environmental remediation using the photocatalytic degradation of methyl orange (MO) was also explored. TF-CDs showed fast degradation kinetics for MO under sunlight with a removal efficiency of 96.8% within ∼60 min. Real sample analysis was also carried out for both sensing and degradation for validating the versatility of the as-prepared TF-CDs in real-world applications.
2. Experimental section
2.1. Materials and reagents
The flowers of Cascabela thevetia (C. thevetia) were plucked from Simrol area (Indian Institute of Technology Indore campus, Madhya Pradesh, India); methyl orange (MO), L-cysteine, 3-nitroaniline (3-NA), 4-iodoaniline (4-IA) and the sodium salt of ethylenediaminetetraacetic acid (Na2-EDTA) were purchased from Sigma Aldrich. Phosphoric acid (H3PO4) and 2,4-dinitrotoluene (2,4-DNT) were procured from Himedia. Polyvinylidene fluoride (PVDF), aniline, 2-nitrophenol (2-NP) and tert-butyl alcohol (TBA) was provided by Thermo Fisher Scientific, Finar, S D Fine Chem Limited and SRL chemicals, respectively. 4-Nitrotoluene (4-NT) and p-benzoquinone (BZQ) were purchased from Lobachem. N-Methyl-2-pyrrolidone (NMP) was purchased from Rankem chemicals. PA and nitrobenzene (NB) were purchased from Merck. The studies were carried out using deionized water (DI) acquired from the Sartorius Milli-Q system (Germany), without further treatment.
2.2. Instrumentation
The UV-vis spectroscopic studies were recorded using a Shimadzu UV-1900 spectrophotometer. All fluorescence (FL) data were taken on a Fluoromax-4 spectrofluorometer (HORIBA Jobin Yvon, model FM100) with an excitation and emission slit width of 2 nm in a quartz cell (1 cm × 1 cm). All decay studies were performed using time-correlated single-photon counting (TCSPC) on a HORIBA Jobin Yvon system of model Fluorocube-01-NL. For obtaining FTIR spectra (4000–400 cm−1), an attenuated total reflectance-Fourier transform infrared spectroscopy (ATR-FTIR) Bruker Alpha II system was used. The powder X-ray diffraction (PXRD) pattern was obtained from a Rigaku Smart Lab X-ray diffractometer with a Cu Kα radiation source (1.5406 Å). Transmission electron micrographs (TEM), high-resolution TEM (HRTEM) images for morphological characterization and SAED (selected area electron diffraction) patterns of samples were obtained to know about the morphology and crystallinity of CDs using an FEI Tecnai 30 G2S-TWIN transmission electron microscope at an accelerating voltage of 300 kV. To know more about the atomic compositions and changes in chemical functionalities of CD samples, survey spectra and HR spectra were recorded using an X-ray photoelectron spectrophotometer (XPS) using PHI 5000 Versa Probe II (ULVAC-PHI Inc., USA) equipped with a microfocused (200 μm, 15 kV), monochromatic Al Kα X-ray source (hν = 1486.6 eV). Morphological data of the films were recorded using a Supra55 Zeiss field emission scanning electron microscope (FE-SEM). The wettability of samples was checked using a contact angle goniometer (KYOWA, DMe-201) by placing sessile-dropping water (2.0 μL) droplets on the film.
2.3. Synthesis of TF-CDs
The fluorescent CDs were synthesized from C. thevetia flowers as a green precursor by one-step hydrothermal method. First, flowers were washed thoroughly and chopped into small pieces, dried and a domestic mixer was used for grinding. The obtained powder was used further for the synthesis of CDs. Briefly, 0.2 g of flower powder, 0.1 g of L-cysteine and 2 mL of phosphoric acid were mixed with 20 mL of DI water on a stirrer for 30 min to prepare a homogenous solution. Then, the above solution was poured in a 50 mL Teflon-lined autoclave and the reaction mixture was treated hydrothermally at 180 °C for 12 h. The as-obtained brown solution was centrifuged (10![[thin space (1/6-em)]](https://www.rsc.org/images/entities/char_2009.gif) 000 rpm; 15 min) to remove any solid product. Further purification was performed by dialyzing the obtained product against DI water. The final product obtained was stored in a refrigerator until further use, and referred to as TF-CDs.
000 rpm; 15 min) to remove any solid product. Further purification was performed by dialyzing the obtained product against DI water. The final product obtained was stored in a refrigerator until further use, and referred to as TF-CDs.
2.4. Synthesis of PVDF thin films with TF-CDs
PVDF films were prepared as described earlier.55 Briefly, 15 wt% PVDF was dissolved in NMP through vigorous stirring at 80–90 °C. To this solution, 0.5 mL of TF-CDs (674 mg mL−1) was added and mixed well. Then, the solution was poured on a glass slide and a thin film was casted on a glass slide with uniform thickness. Furthermore, the glass slides were immersed in a coagulation bath containing DI water to accomplish the phase inversion procedure. Finally, the porous TF-CDs@PVDF film was obtained and dried at room temperature. After forming the film, it was allowed to dry overnight. For a control experiment, the casting solution without TF-CDs was prepared by a similar procedure.
2.5. Quantum yield (QY) and limit of detection (LOD) measurement
The QY of TF-CDs was determined by using quinine sulfate as the reference standard solution. It was calculated using the following equation;| |  | (1) |
Here, Φ and ΦQS is the QY of the TF-CDs and quinine sulfate, respectively. AS and AQS represent the absorbance, SS and SQS are integrated intensity and nS and nQS represent the refractive indices of TF-CDs and quinine sulfate, respectively.
The LOD was calculated using the following expression
Here
S is the slope of the calibration plot and
σ is the error.
2.6. FL sensing of PA using TF-CDs
To evaluate the sensitivity and selectivity of the synthesized TF-CDs, different nitro compounds, viz., PA, 2,4-DNT, 4-NT, NB, 4-IA, 2-NP and 3-NA were tested. The selectivity was determined by adding each NAC (200 μM concentration each) in 2 mL of TF-CD (674 mg mL−1) solutions. The solutions were kept under static conditions for equilibration and their FL intensities at an excitation wavelength (λex) of 340 nm were subsequently recorded. Among the various NACs under test, the sensor exhibited high specificity towards PA. Therefore, further studies were carried out with PA. To study the sensitivity of TF-CDs, different concentrations of PA (0–200 μM) were added and the FL spectra were examined when excited at wavelength of 340 nm. After that, the interference study was carried out in which different NACs were mixed with TF-CD as well as PA and FL of the mixtures was recorded at λex 340 nm. The following Stern–Volmer equation was used to determine the quenching constant (Ksv):| |  | (3) |
where I0 and I are the CD's emission intensities prior to and following the addition of analytes, respectively, and [C] is the analyte concentration. All the procedures were triplicated under similar conditions.
2.7. Sensing of PA with TF-CD@PVDF composite films
The sensitivity of TF-CD@PVDF composite films was checked by dropping different concentrations of PA (ranging from 0–100 μM) onto 2 × 2 cm films and incubating the films for 5 min. The films were then dried and subjected to FL studies at 330 nm λex.
2.8. Degradation study
The photocatalytic performance of TF-CDs was estimated through the photodegradation of MO, a synthetic dye. The photocatalytic study was carried out in an aqueous solution under sunlight (∼1 kW m−2) power density. In a typical experiment, a fixed amount of catalyst (i.e., 7 μL, 674 mg mL−1) was added to 50 mL of the prepared dye solution (10 ppm) and stirred under dark conditions for 15 min to establish absorption and desorption equilibrium. The solution was then exposed to blue light (450 nm) as well as sunlight (1000 lm m−2), separately for 60 min. A similar study was also performed in dark as a control experiment. During the photocatalytic study, different aliquots were collected at 15 min intervals. Subsequently, the collected samples were analysed using UV-vis spectroscopy to monitor the concentration of MO at 506 nm. The concentration of remaining MO was evaluated using the plot of C/C0vs. time. Besides, MO degradation was also monitored by varying the concentration of MO and CDs through UV-vis spectroscopy. The photodegradation of MO was fitted according to the first order kinetic equation:By taking log on both the sides and arranging the equation,| |  | (5) |
Here, C0 is the concentration of MO at time, t = 0 min, C is the concentration of MO at time t, and k refers to the pseudo-first-order rate constant.
Similarly, the % of MO degradation was calculated by measuring the decrease in absorbance of MO using the following equation:
| |  | (6) |
where,
C0 is the concentration of MO at initial time
t = 0 and
C is the concentration of MO at a particular time during the reaction.
2.9. Electrochemical measurements
All the electrochemical measurements were carried out using a three-electrode cell. Pt and Ag/AgCl were used as a counter and reference electrode and 0.5 M Na2SO4 was used as electrolyte. The electrode for electrochemical analysis was prepared by drop-casting TF-CD suspensions (20 μl, 13.48 mg) and Nafion (5% w) onto a carbon cloth and then dried under vacuum. After complete drying, the substrate was inserted into a three-electrode system (AUTOLAB PGSTAT 204N electrochemical workstation) for electrochemical impedance spectroscopy (EIS) measurements over a frequency range of 1 to 105 Hz with an AC voltage amplitude of 10 mV and photocurrent responses were recorded using the amperometry i–t curve mode. All the photo-electrochemical measurements were conducted using a blue light source with 100 mW cm−2 power density.
3. Results and discussion
3.1. Preparation and characterization of TF-CDs
The TF-CDs were prepared from C. thevetia flowers via a simple one pot, single step hydrothermal synthesis as shown in Scheme 1. C. thevetia extracts have been proven to contain alkaloids, steroids, volatile oils, flavonoids, and tannins, as constituents, which are responsible for major functionalities observed in TF-CDs, etc.56 To enhance the optical properties and electronic properties of the CDs, doping with N, S and P was accomplished by using L-cysteine and phosphoric acid as doping agents.57,58 It is well known that heteroatom doping in CDs not only improves their fluorescence efficiency but can also adds new functionalities and active sites on the surface of CDs.28,59
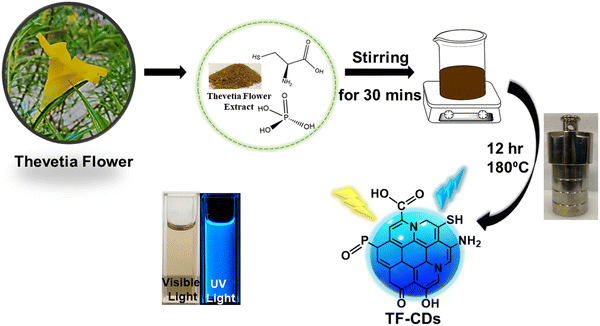 |
| | Scheme 1 Schematic representation for the synthesis of TF-CDs from C. thevetia flowers by a one pot hydrothermal method. | |
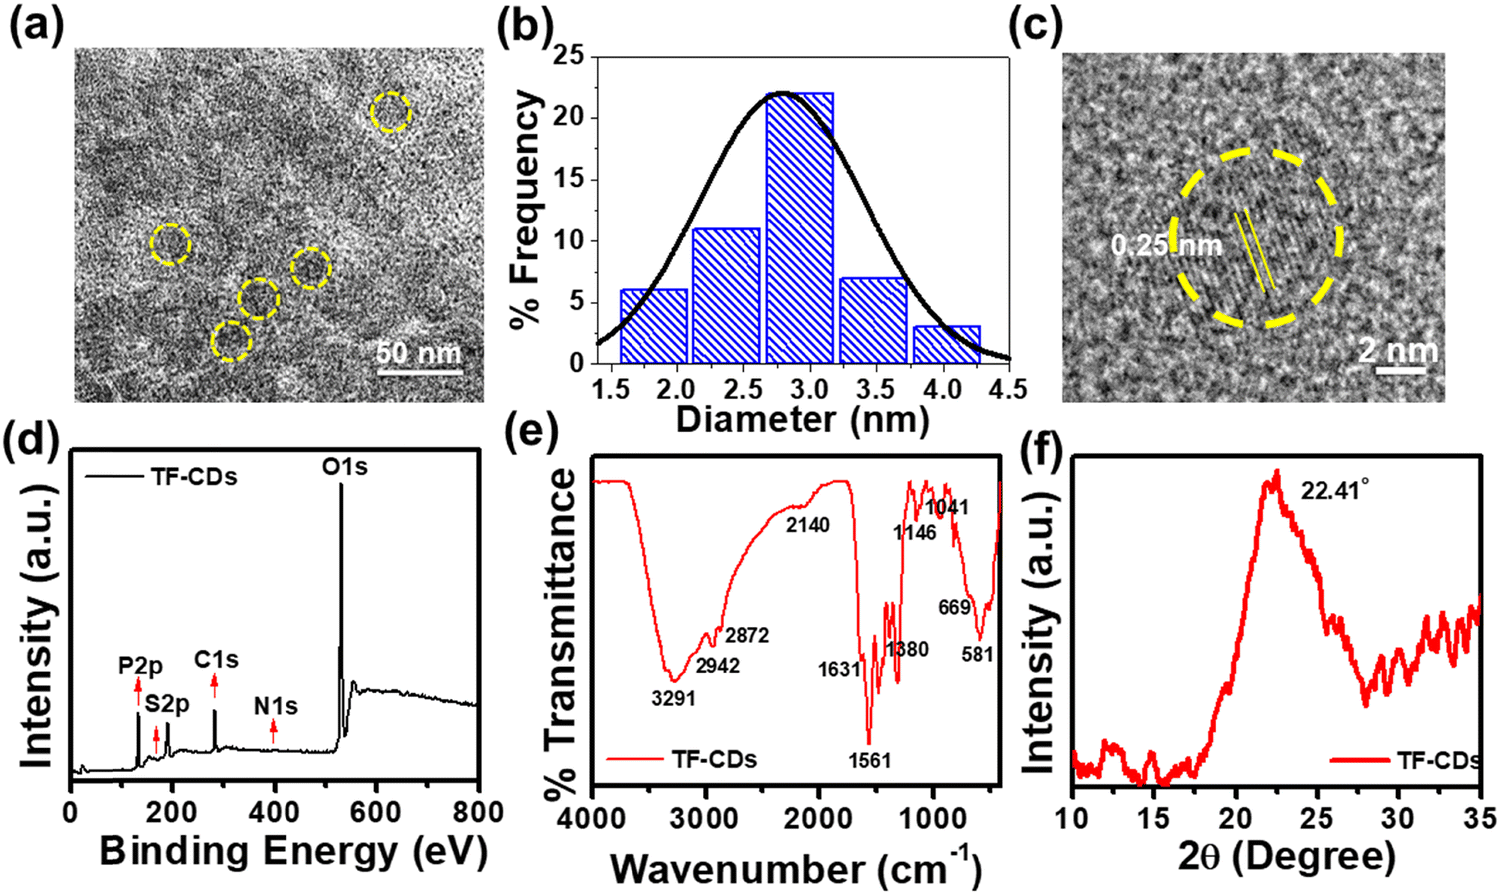
The successful synthesis of TF-CDs was confirmed using various morphological and spectroscopic techniques. To this end, we first performed HRTEM to analyse the morphology of CDs. Fig. 1a shows the TEM image of TF-CDs, proving the presence of spherical dots with a mean diameter of 2.7 nm, as shown in the histogram drawn (Fig. 1b). The magnified HRTEM image (Fig. 1c) clearly shows the distinct lattice fringes of CDs with a 0.25 nm d-spacing that is related to the (100) graphite plane.60
 |
| | Fig. 1 (a) TEM image, (b) size distribution histogram, (c) HRTEM image with d-spacing of TF-CDs, (d) XPS survey scan, (e) FTIR, and (f) XRD of the as-synthesized TF-CDs. | |
Moreover, the chemical composition and functionalities of CDs can be better elucidated through XPS analysis. The XPS survey spectrum of TF-CDs shown in Fig. 1d confirms the doping of P (135 eV, 2.3%), S (164 eV, < 0.1%) and N (399 eV, 0.5%) elements in the TF-CDs. The HR XPS peak for P2p (Fig. S1a, ESI†) was deconvoluted into several binding energies at 133.0 eV and 134.2 eV, indicating the presence of P–C and P–O groups, respectively. Similarly, the S2p spectra was deconvoluted into two peaks, centering at binding energies of 164.7 eV and 167.1 eV as shown in Fig. S1b (ESI†), attributed to C–S and S–H, respectively, which corroborates the incorporation of sulphur in TF-CDs. The deconvoluted high-resolution C1s spectrum exhibits four peaks at the binding energy values of 284.1 eV, 284.9 eV, 285.7 eV and 287.1 eV, corresponding to C–S, CC, C–N/C–P and CO, respectively (Fig. S1c, ESI†). Fig. S1d (ESI†) shows the N1s spectrum with two peaks at 399.1 eV from pyridinic-N and at 400.6 eV arising from pyrrolic-N. Fig. S1e (ESI†) shows the HR scans of the O1s spectrum resolved into two peaks centered at 532.5 eV and 533.9 eV, which are assigned to C–O and CO/PO, respectively.61,62 The surface functional groups were also confirmed using ATR-FTIR spectroscopy. According to Fig. 1e, the stretching vibration of the O–H/N–H results in a broad band at 3291 cm−1. The peaks at 2942 and 2872 cm−1 are assigned to C–H stretching from sp3 carbon. The peak observed at 2140 cm−1 is attributed to S–H bonds. The peak centered at 1631 cm−1 is due to the streching vibrations of CO/CC groups. Peaks at 1561 cm−1 (N–H bending) and 1380 cm−1 (C–N stretching) indicate the presence of amide functional groups in the TF-CD structure. The distinct peaks corresponding to C–O, P–O, PO and C–S groups were observed at 1146 cm−1, 1041 cm−1, 669 cm−1, and 581 cm−1, respectively.63–65 The XPS and FTIR studies confirm the doping of N, S and P into TF-CDs as indicated by functionalities such as –NH2, –COOH, –SH, P–O, PO and –OH. Apart from phosphoric acid and L-cysteine as P and S and N doping agents, we speculate that the major C–O, phenolic/hydroxyl functionalities observed on TF-CDs were mainly derived from the constituents of C. thevetia biomass (alkaloids, steroids, volatile oils, flavonoids, and tannins),66 which acted as a major C source for CD formation. XRD analysis was used to investigate the crystalline properties of CDs. The diffraction pattern of TF-CDs (Fig. 1f) features a characteristic broad diffraction peak of CDs at an angle of 22.41°, assigned to the (002) plane. The broadness of the diffraction peak indicates the semi-amorphous nature of TF-CDs.8
3.2. Photophysical analysis of TF-CDs
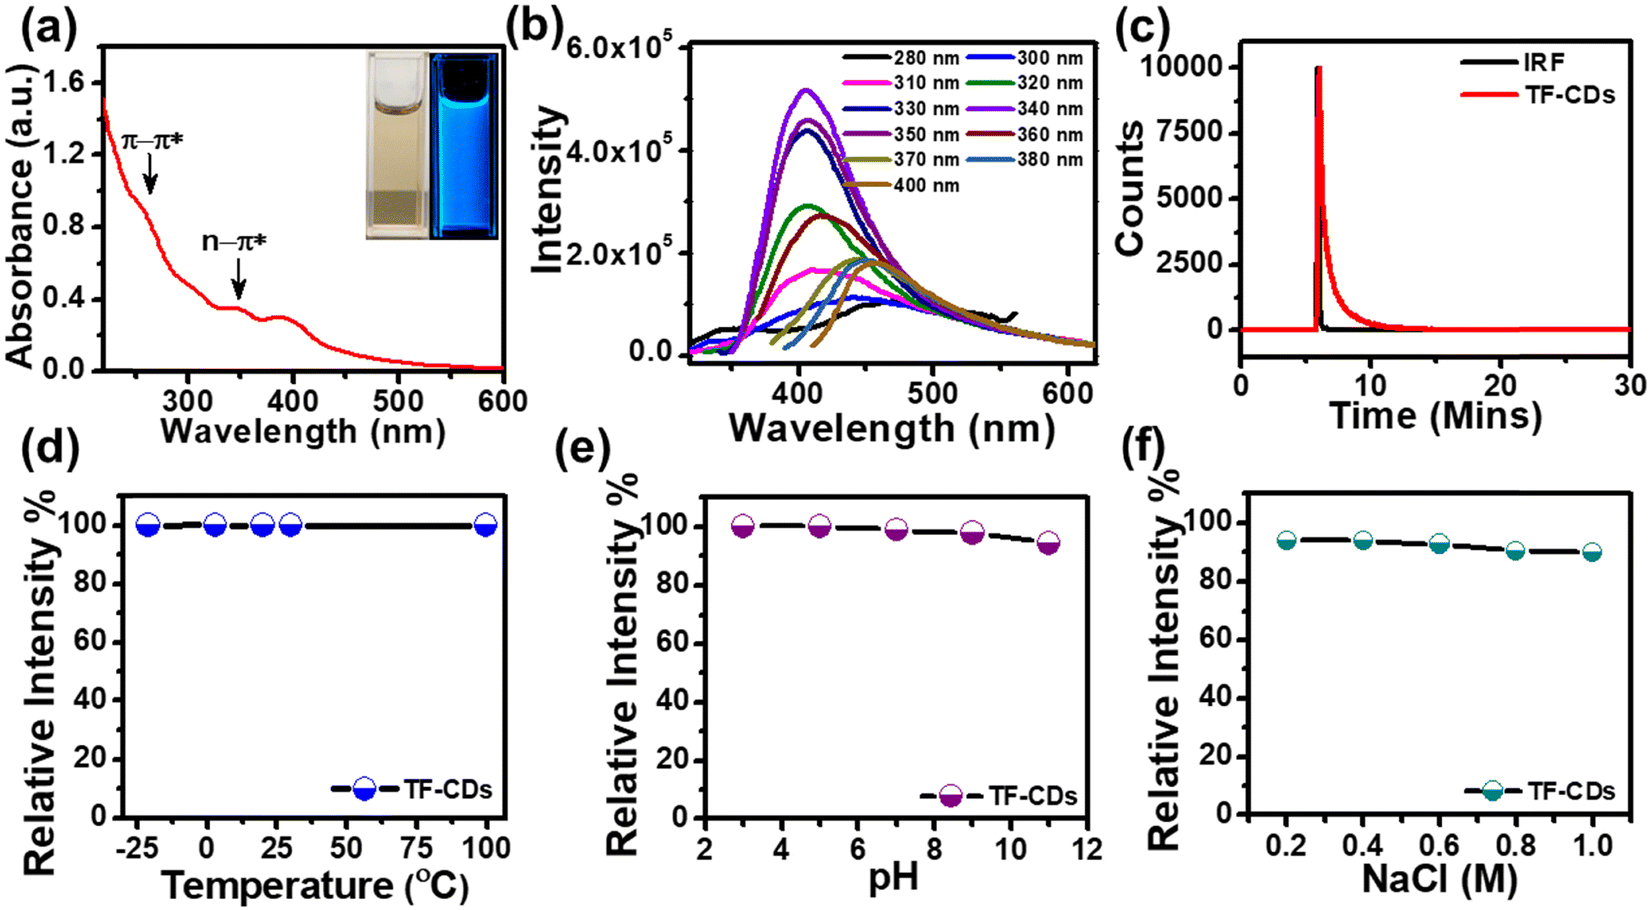
The optical behavior of the as-synthesized TF-CD catalyst was studied by UV-vis spectroscopy. As shown in Fig. 2a, the UV-vis absorption spectrum exhibits absorption peaks at 260 nm, typically ascribed to the π–π* transition of the carbon core (CC bonds), along with peaks positioned at 344 and 400 nm assigned to n–π* from surface states.67 The band gap energy of a photocatalyst is an important optical parameter for predicting the formation and transfer of photoinduced electrons and holes.68 The optical band gap of TF-CDs was found to be 2.6 eV by using the Tau plot as shown in Fig. S2 (ESI†). The digital photographs in the inset of Fig. 2a show that the aqueous solution of TF-CDs was light yellow in colour under visible light and emitted bright blue FL when irradiated with 365 nm UV light. FL studies performed in Fig. 2b show the excitation dependency of TF-CDs. A progressive change in FL intensity was observed as the excitation wavelength was increased from 280 nm to 400 nm, reaching its maximum emission at 406 nm (with λex = 340 nm). The excitation dependent behaviour indicates variations in the distribution of emission trap sites and differences in the sizes of CDs. The major hypotheses existing for the luminescence mechanism of carbon dots are related to the molecular state, carbon core state, surface state and size dependent emission.11 In the case of TF-CDs, we adopted a hydrothermal synthesis method and confirmed the retention of most of the active electron rich functionalities of precursor molecules (from FTIR and XPS analysis) along with a graphitized core (evidenced from TEM and XRD analysis). This is in accordance with the report suggesting that the hydrothermal condition induces a partial condensation–polymerization–carbonization mechanism, leading to the formation of carbon dots that retain some sp3 features of precursor molecules.11 Thus, being a quantum dot, the plausible FL centres observed for the as-prepared TF-CD could likely be due to the carbon core, surface-state and size dependent emission.
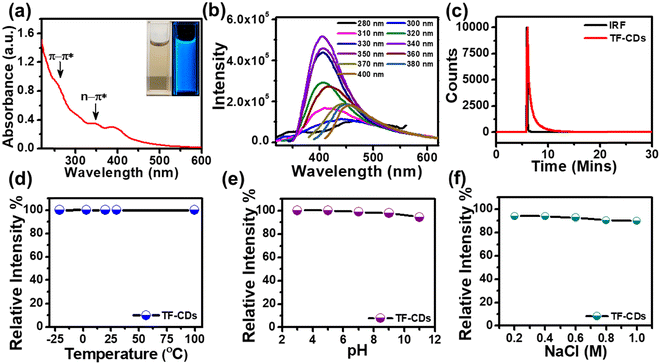 |
| | Fig. 2 (a) UV-vis spectra (inset: TF-CDs solution in both visible and UV light), (b) FL emission spectra and (c) TCSPC measurement recorded for TF-CDs. Stability plots of TF-CDs at different: (d) temperatures, (e) pH and (f) NaCl concentrations. | |
Besides, the FL lifetime, an inherent property of CDs that is related to FL sites and their environment, was also recorded. The decay curve as shown in Fig. 2c indicates the average FL lifetime of TF-CDs, which was calculated to be 0.76 ns and fitted biexponentially. Additionally, the FL QY (eqn (1)) of TF-CDs was 16.5%, measured with quinine sulfate at a wavelength of 330 nm with bright blue FL. This result demonstrates the potential of the as-prepared TF-CDs for sensing and photocatalytic applications.
3.3. Study of fluorescence stability
The FL stability of TF-CDs was examined under different conditions like temperature, pH and NaCl. Stability is a very important parameter for CDs when they are used for sensing and degradation applications. Moreover, FL of TF-CDs was observed to be stable up to 99% in various temperature ranges (from a lower temperature of −25 °C to a temperature higher as 100 °C) (Fig. 2d). The FL emission of TF-CDs was relatively stable (with a retention of up to 94% FL) in the pH range 3–11 (Fig. 2e). Similarly, TF-CDs exhibited considerable stability in a very high saline concentration (1 M NaCl), retaining up to 90% stability, as shown in Fig. 2f. Thus, TF-CDs could be an exciting applicant for environmental remediation application.
3.4. Fluorescence-based PA detection with TF-CDs
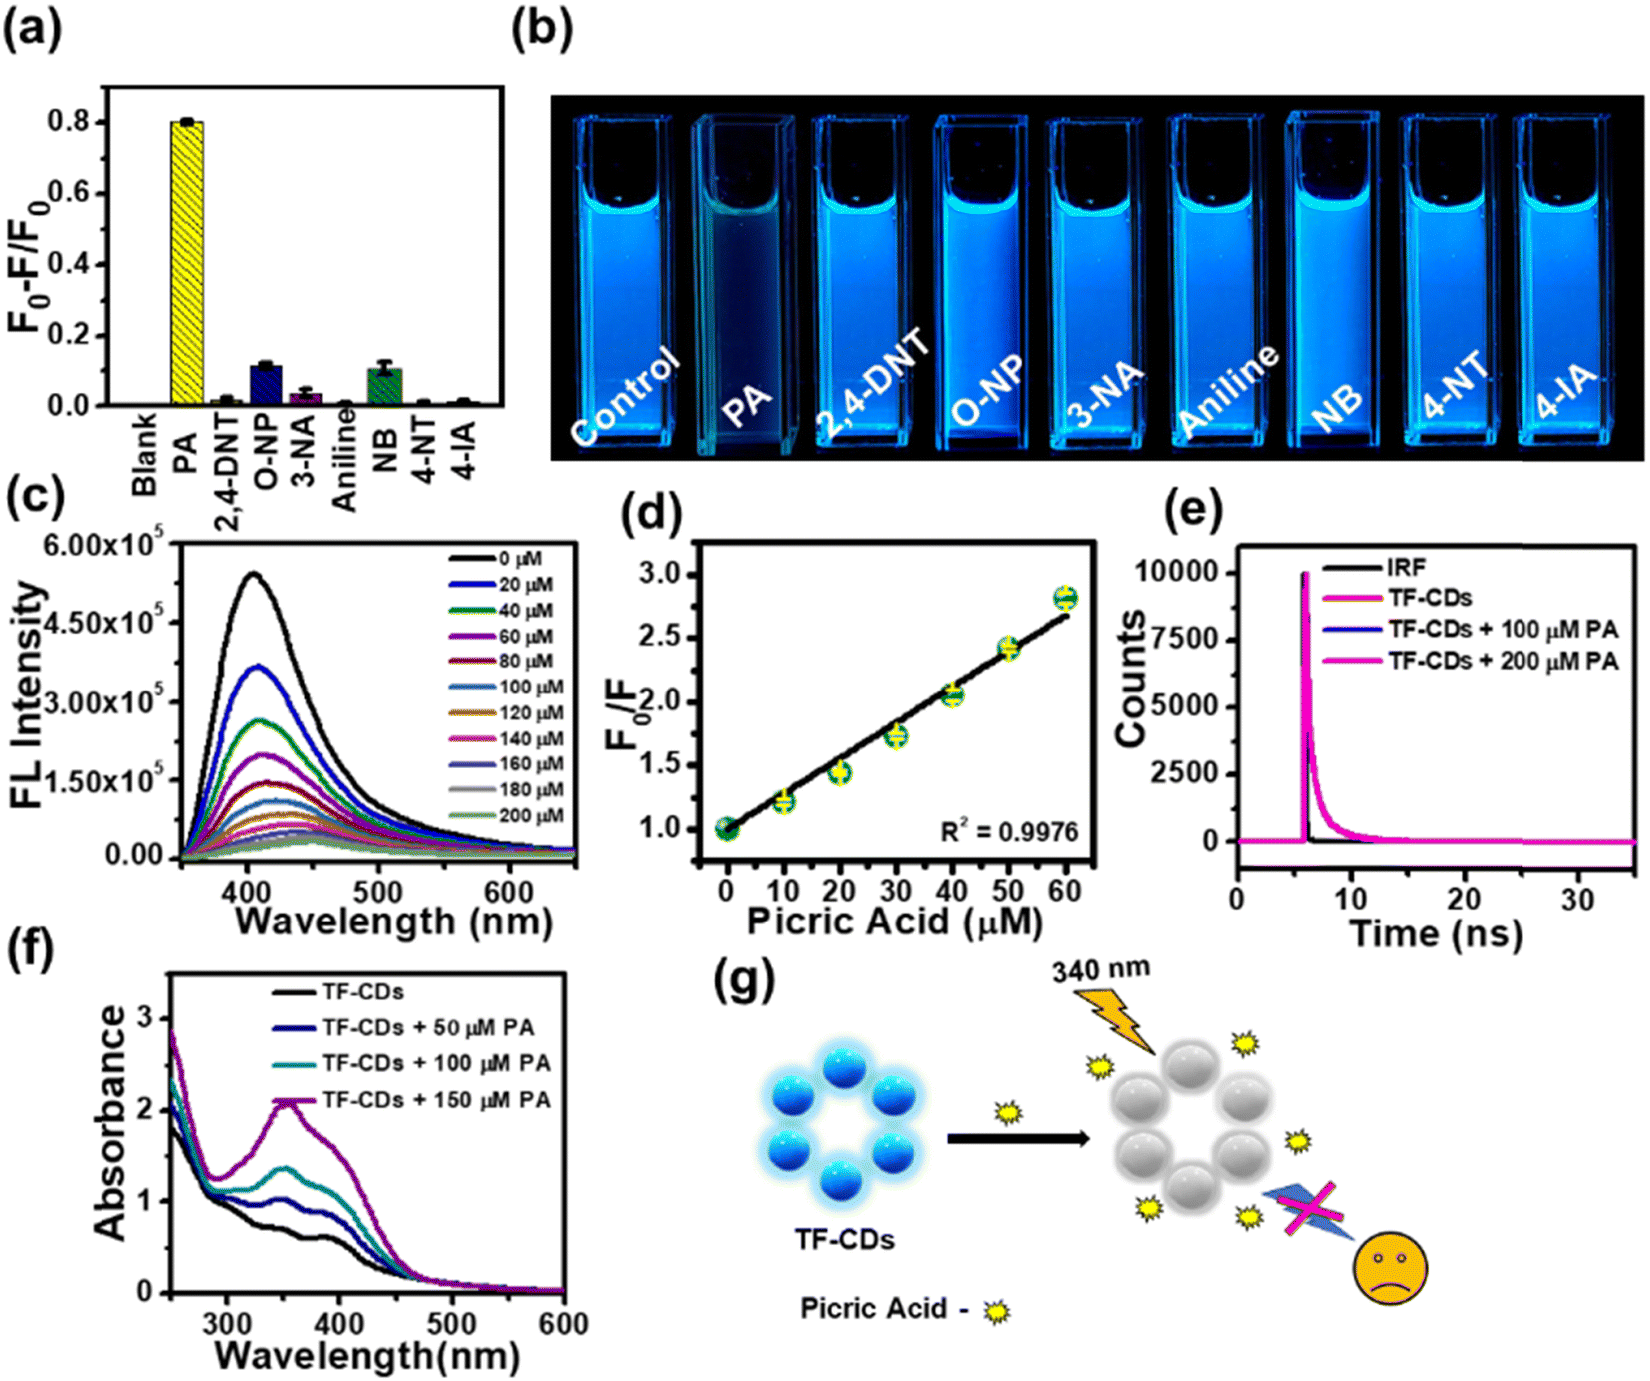
Aqueous dispersions of TF-CDs were mixed with a series of NACs to investigate the selectivity. TF-CD solutions were separately treated with 200 μM of PA, 3-NT, 2,4-DNT, aniline, 4-IA, NB, 2-NP 4-NT, and 3-NA and their FL emissions were recorded at 406 nm, as shown in Fig. 3a. Evidently, complete FL quenching of the blue TF-CDs solution was observed in presence of PA. The remaining NACs caused negligible quenching in FL. The photograph given in Fig. 3b shows visible selective quenching of CDs’ bright blue FL with PA compared with other NACs. The FL titration of TF-CDs was further carried out to calculate the LOD and quenching constant by incubating with different concentrations of PA (0–200 μM). Fig. 3c displays a consistent decrease in the FL of CDs upon treatment with different doses of PA, showing a 96% quenching response at a maximum concentration of 200 μM. Fig. 3d shows the intensity variation vs. PA concentrations plot, revealing a linear relationship (with an excellent correlation coefficient, R2, of 0.9976), and a LOD of 104 nM determined using eqn (2). The value of the quenching constant was found to be 2.8 × 10⁻² M−1 calculated using eqn (3). The results obtained suggest that the interaction of TF-CDs with PA is quite strong. The higher the value of Ksv, the better the quenching efficiency of TF-CDs for PA detection will be.69 Next, we performed the interference study to ascertain the effectiveness of TF-CDs in detection of PA in the presence of other NACs. Fig. S3 (ESI†) shows the anti-interference ability of TF-CDs towards PA where there was no hinderance in the detection of PA even in the presence of the other competitive ions. This validates the high selectivity of TF-CDs’ FL response among NACs.
 |
| | Fig. 3 (a) Selectivity of TF-CDs towards various NACs, (b) photographs of TF-CDs in the presence of various NACs captured under UV light, (c) FL spectra of TF-CDs after adding different concentrations of PA (0–200 μM) and (d) relationship between PA concentration vs. F/F0 for TF-CDs. (e) Lifetime data and (f) UV–vis spectra of TF-CDs for different concentrations of PA. (g) Schematic representation of quenching of TF-CDs after the addition of PA. | |
3.5. PA sensing mechanism
The FL quenching mechanism of PA with TF-CDs was elucidated with the help of UV-vis spectroscopy and FL lifetime measurements (Fig. 3e–g). The FL quenching mainly occurs either due to förster resonance energy transfer (FRET)70 or the inner filter effect (IFE).71 Interestingly, no change in the FL lifetime of TF-CDs (0.76 ns) was observed in the absence and presence of PA (Fig. 3e), i.e., when 100 μM and 200 μM of PA were added to TF-CDs, the lifetime remained at 0.77 and 0.74 ns, respectively, which shows a lack of possibility of any excited state quenching process like FRET. Furthermore, to check the possibility of IFE, we utilized UV-vis spectroscopy to study the changes in the UV-vis spectra of TF-CDs in the presence of different concentrations of PA (Fig. 3f). Notably, the absorption intensity of TF-CDs increased upon increasing the concentration of PA with no changes in the absorption maxima (λmax) of TF-CDs. The increase in the absorption intensity can be attributed to the spectral overlap between the absorption spectra of PA and excitation spectra of TF-CDs (Fig. S4, ESI†). The absence of FRET and the presence of good spectral overlap between the absorption of PA and excitation of TF-CDs clearly indicate a secondary mechanism of FL quenching i.e., the IFE mechanism for the detection of PA.72Fig. 3g shows the schematic illustration of the FL quenching of TF-CDs in the presence of PA. The above results clearly show that the synthesized TF-CDs have excellent sensitivity and selectivity for the detection of PA and can be utilized to quantify the concentration of PA in contaminated water.
3.6. Detection of PA on TF-CD@PVDF strips
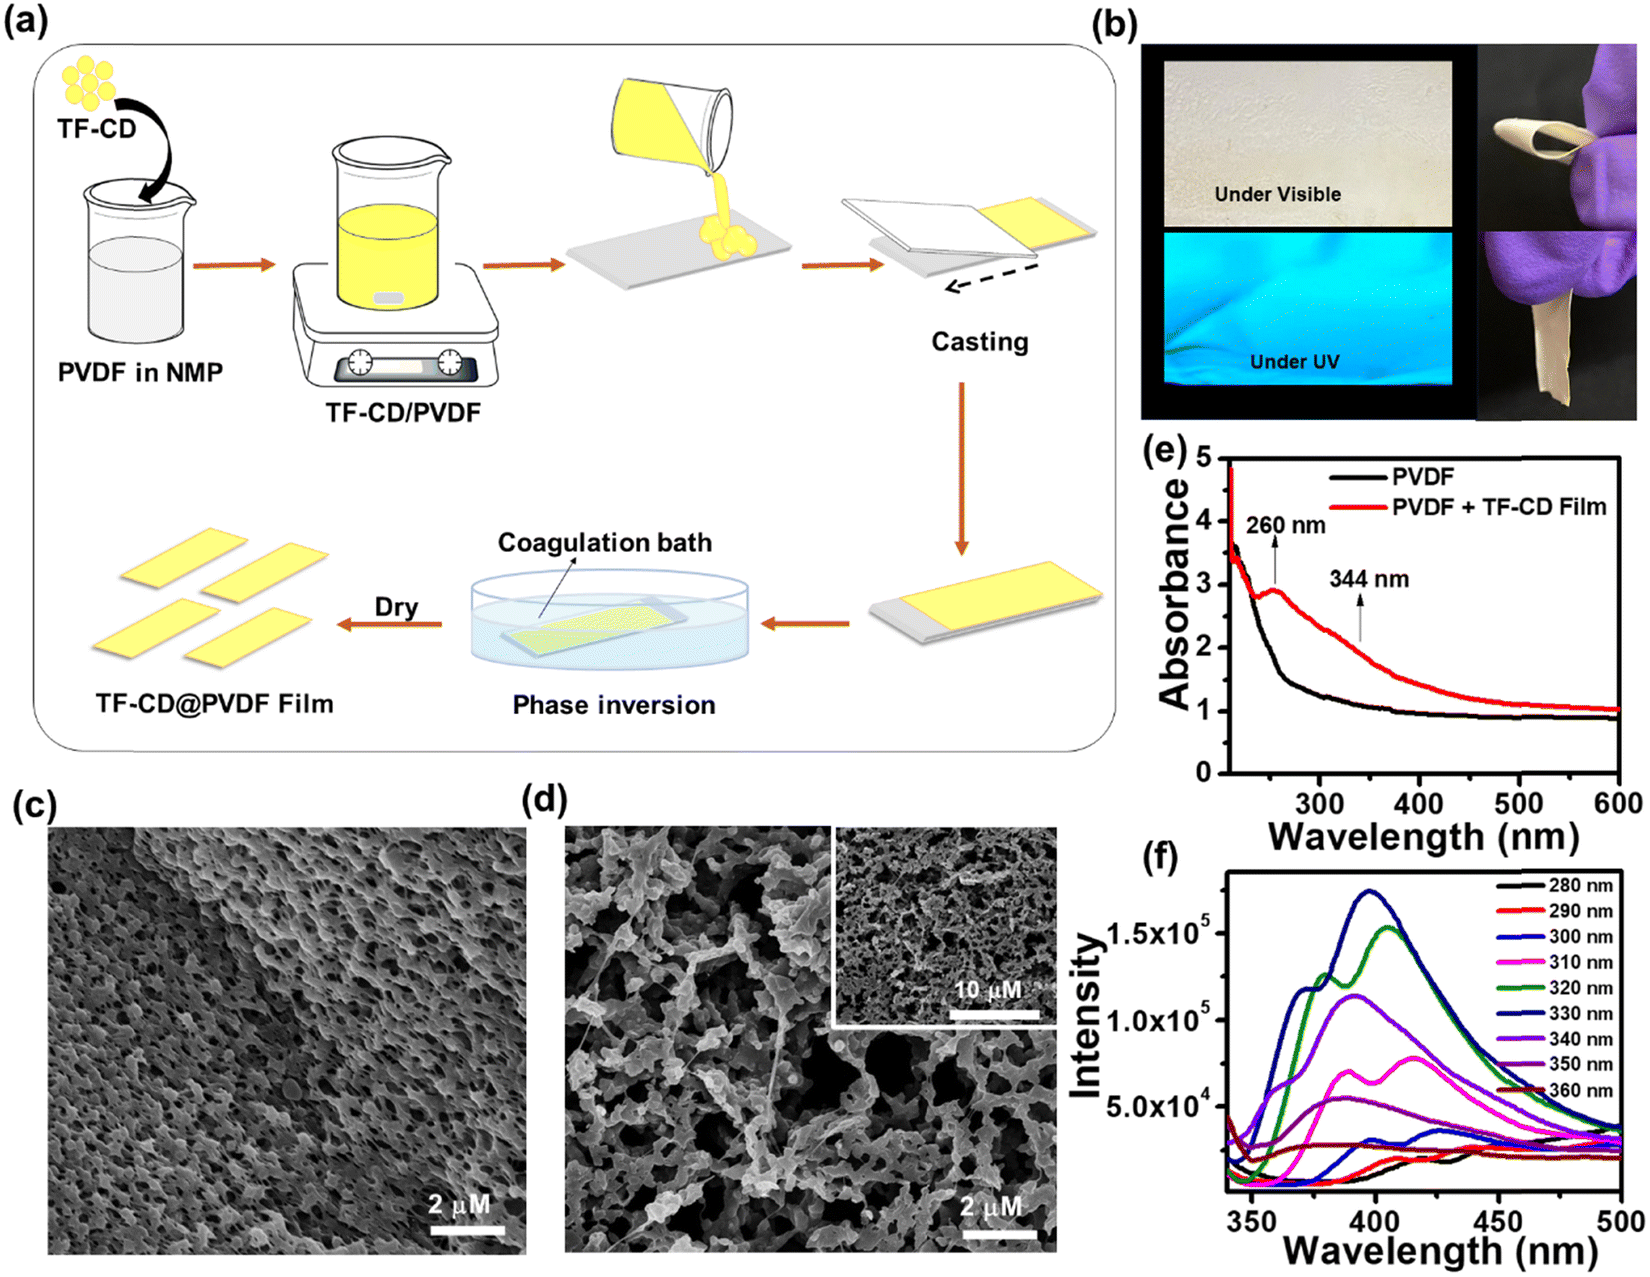
Encouraged by the remarkable sensing attributes of TF-CDs, we further established their sensing potential as a portable device in practical applications for the on-site detection of PA using PVDF-based thin film strips. Highly porous TF-CD-incorporated PVDF (TF-CD@PVDF) thin films were fabricated by adopting a phase inversion method as depicted in Fig. 4a. Achieving a uniform distribution of hydrophilic TF-CDs in hydrophobic PVDF films was indeed challenging during the film formation. Therefore, the selection of solvent was made thoughtfully. The selection NMP as the solvent for PVDF was advantageous as it not only served as an excellent dispersant for TF-CDs but was also known to improve the processability for film formation. During the phase inversion process, NMP was replaced with fast diffusion of water from the coagulation bath, leading to the formation of porous PVDF films embedded with TF-CDs. In addition, when PVDF formed a slurry in TF-CD dispersed NMP medium, we speculated a possible interaction of fluorine atoms of PVDF with the amine hydrogen or hydroxyl hydrogen present on the TF-CD surface. Hence, a uniform dispersion of the as-prepared CD with PVDF at a moderate concentration is justifiable. Apparently, we observed a reduction in FL intensity with higher loading of TF-CDs, possibly due to the increased aggregation induced quenching at higher CD concentrations. Fig. S5 (ESI†) shows the effect of different concentrations of TF-CDs on PVDF films on FL emission intensity. The fabrication method of these hybrid films is simple and can be used for scale-up production. Furthermore, the present method is highly cost effective as the coagulation bath utilized for immersion can be reused several times.73 The incorporation of CDs in these films provides good optoelectronic characteristics that can be utilized for a broad range of applications. Moreover, Fig. 4b demonstrates the retention of bright blue FL of TF-CDs in the free standing film (photographs captured under visible and UV light), while maintaining flexibility. The surface morphology of a control PVDF film and the thus-prepared TF-CD@PVDF composite films was analysed using FESEM (Fig. 4c and d). It was observed that a highly perforated thin film structure was formed in a control film (Fig. 4c) and also the porous features were created on TF-CD@PVDF due to phase separation. Notably, this porous structure is retained in the composite film even after the incorporation of TF-CDs into PVDF (Fig. 4d). The inset of Fig. 4d presents a low magnification SEM image of TF-CD@PVDF. Fig. S6 (ESI†) shows the PXRD pattern of PVDF (black line) and TF-CD@PVDF (red line) with peaks centred at 18.4° (020), 20.0° (110) and 26.5° (110), which can be ascribed to the crystalline nature of the PVDF α phase.74 Moreover, the peak intensity at 20.0° was increased and the peaks at 18.5° and 26.5° merged in the case of TF-CD@PVDF.75 The contact angles of PVDF and TF-CD@PVDF films were measured with a contact angle goniometer in a sessile drop experiment. The contact angle of a bare PVDF membrane was found to be 96.9 ± 1° which was reduced to 77.1 ± 1° after adding TF-CDs in PVDF. The difference in the contact angle of PVDF (Fig. S7a, ESI†) and that of TF-CD@PVDF (Fig. S7b, ESI†) proves that the hydrophobic nature of PVDF was reduced after the incorporation of hydrophilic CDs into PVDF films. In fact, this is beneficial for the applicability of TF-CD@PVDF for sensing waterborne pllutants.76Fig. 4e shows the UV-vis absorption spectra of PVDF and TF-CD@PVDF composites. Notably, bare PVDF films do not feature any evident absorption peaks while two apparent peaks centred at 260 nm and 344 nm, characteristic of CDs, emerged upon incorporation of TF-CDs into the PVDF film. Furthermore, the FL spectra of TF-CD@PVDF (Fig. 4f) exhibit maximum emission wavelength at 398 nm upon excitation at 330 nm, which further indicates a blue shift in the FL maximum of composite films with respect to TF-CDs. The stability of films under various conditions has also been evaluated and discussed in ESI† and Fig. S8a–c.
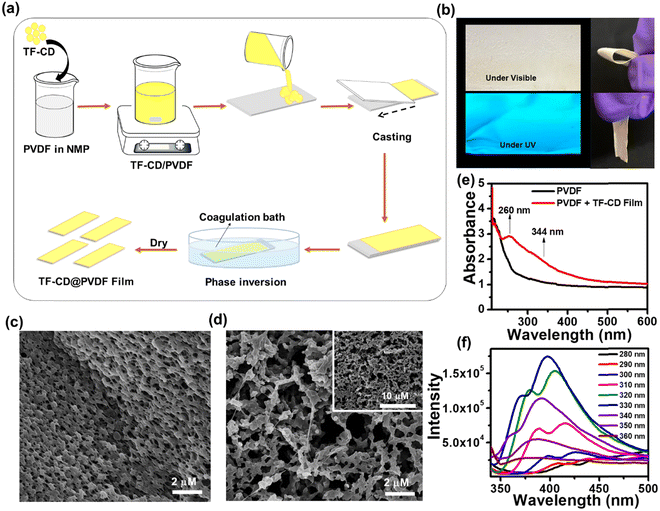 |
| | Fig. 4 (a) Schematic showing the preparation of TF-CD@PVDF films, (b) photographs of TF-CD@PVDF films under visible and UV light (365 nm), SEM images of (c) PVDF and (d) TF-CD@PVDF composite films, (e) UV-vis spectra of PVDF films and TF-CD@PVDF composite films and (f) FL spectra of TF-CD@PVDF composite films under different excitation wavelengths. | |
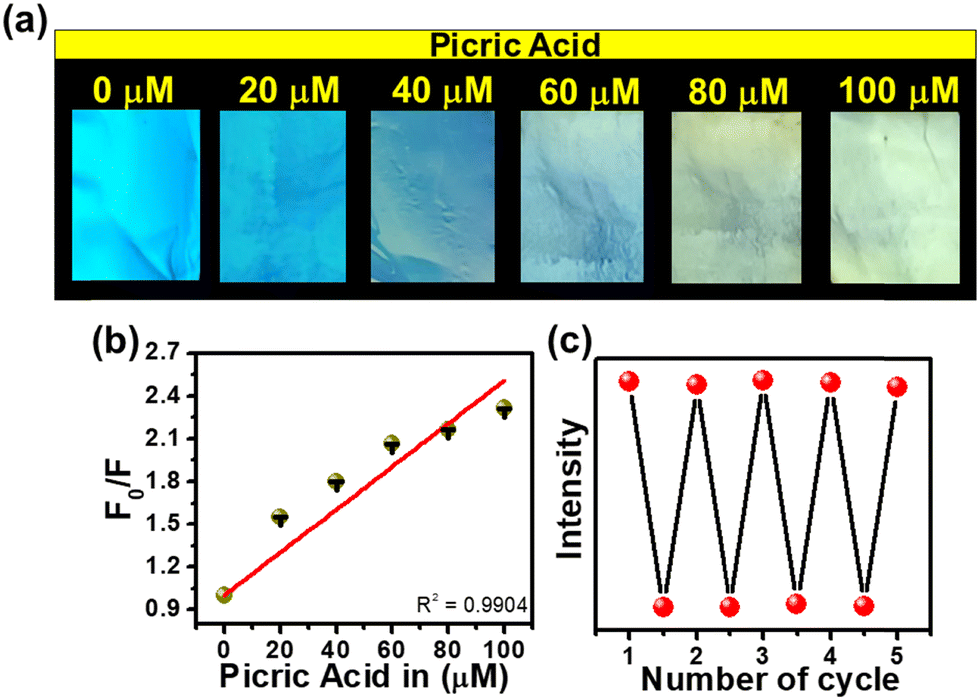
The porous structure of the fabricated TF-CD@PVDF film can further provide an efficient diffusion pathway for the fast detection of PA. The pale-yellow colour strips exhibit bright blue-coloured FL upon 365 nm UV illumination. The changes in the blue FL behaviour were visible under UV light after adding different concentrations of PA solutions on strips (photographs are given in Fig. 5a) and the changes in the FL intensity were further examined with a FL spectrophotometer. The FL of thin films is successively turned-off by increasing PA concentration (from 0–100 μM). Furthermore, the FL intensity ratio F/F0 is linearly correlated (R2 = 0.9904) in the range of 0–100 μM PA concentrations (Fig. 5b). The detection limit was calculated to be 244 nM, which is superior to any other solid FL sensing platform reported for PA sensing (Table 1). Furthermore, we assessed the selectivity of TF-CD@PVDF in the presence of other NACs. The selectivity was determined by immersing the films in each NAC (100 μM concentration each) for 5 min under static conditions for equilibration and their FL intensities were subsequently recorded at a λex of 330 nm. Among the various NACs under test, the TF-CD@PVDF film showed high specificity towards PA, as indicated in Fig. S9 (ESI†). Fig. 5c shows the recyclability plot of the as-prepared FL sensor strip, presenting stability and reusability (at least for 5 cycles). After each cycle, the film was washed with DI water, dried, and further reused for PA detection. Therefore, the as-developed flexible and portable sensing strip allows for multiple reuses of the sensor, inhibiting the elution of FL active CD into the environment.
 |
| | Fig. 5 (a) Digital images of TF-CD@PVDF films after adding different concentrations of PA (under UV illumination of 365 nm), (b) linearity plot of F0/F vs. PA concentrations for TF-CD@PVDF composite films and (c) recyclability study of composite films for PA detection. | |
Table 1 The performance comparison for the PA sensing platform
| Sr. no. |
Sensing element |
Linear range (μM) |
LOD (nm) |
Portable platform |
Real sample |
Recyclability of sensor |
Ref. |
| 1 |
AIE luminogen-functionalized MM |
0–50 |
1700 |
— |
— |
Yes |
77
|
| 2 |
N-GQDs |
1–60 |
300 |
— |
Lake water |
— |
78
|
| 3 |
N-CNPs |
0–20 |
250 |
— |
— |
— |
79
|
| 4 |
Cdot-PPy film |
— |
148.4 |
Film |
Ground water and soil |
— |
80
|
| 5 |
N doped GQDs |
0–4 |
420 |
— |
— |
— |
81
|
| 6 |
Polymeric thin films |
10–90 |
56000 |
Film |
— |
Yes |
82
|
| 7 |
MOFs |
0–1000 |
5000 |
— |
— |
— |
83
|
| 8 |
(Na -Ala/Chit -cl -polyAAm |
— |
— |
— |
— |
Yes |
84
|
| 9 |
Ce-doped ZnO |
0–12 |
278 |
— |
— |
— |
85
|
| 10 |
TF-CD@PVDF |
0–100 |
244 |
Film |
Tap, ground and river water |
Yes |
This work |
3.7. Real sample analysis
The developed system was further utilized for the determination of PA in water samples from various sources such as river water (Narmada river, Madhya Pradesh), tap water (Simrol, Madhya Pradesh) and ground water (Simrol, Madhya Pradesh). The collected water samples were filtred through a 0.22 μm membrane. As expected, initially no traces of PA were found in the abovementioned water samples when checked with FL TF-CDs. Next, the above water samples were spiked with different concentrations of PA (20, 40 and 60 μM) and recovery tests were performed. The recovery ranged from 73–100%, with a standard deviation of less than 2 for TF-CDs as shown in Table 2. The same experiment was performed for TF-CD@PVDF films. The recovery ranged from 91–104%, with a standard deviation of below 2, as shown in the above-mentioned Table 2. The excellent recovery rate with good precision and reliabilty demonstrates the wide applicability of TF-CD and TF-CD@PVDF composite films for use as a sensor in real sample analysis.
Table 2 Picric acid sensing in real water samples with TF-CDs and TF-CD@PVDF films (N = 3)
| Sample |
TF-CD |
TF-CD@PVDF |
| Claimed concentration (μM) |
Obtained concentration (μM) |
Recovery (%) |
SD (n = 3) |
Obtained concentration (μM) |
Recovery (%) |
SD (n = 3) |
| Tap water |
20 |
20 |
97.86 |
0.86 |
20 |
91.25 |
1.38 |
|
|
40 |
39.39 |
100.05 |
0.30 |
39.89 |
104.85 |
0.52 |
|
|
60 |
59.71 |
99.75 |
0.46 |
59.80 |
99.75 |
0.28 |
| River water |
20 |
19.83 |
97.33 |
1.52 |
19.97 |
96.15 |
2.8 |
|
|
40 |
39.93 |
99.95 |
1.49 |
39.80 |
100.67 |
1.03 |
|
|
60 |
59.94 |
93.78 |
0.01 |
59.94 |
99.06 |
1.89 |
| Ground water |
20 |
19.88 |
88.47 |
0.14 |
20 |
91.24 |
1.36 |
|
|
40 |
39.75 |
82.45 |
1.42 |
39.93 |
95.64 |
0.45 |
|
|
60 |
59.89 |
73.27 |
0.61 |
59.71 |
100.07 |
1.01 |
3.8. Photocatalytic activity of TF-CDs
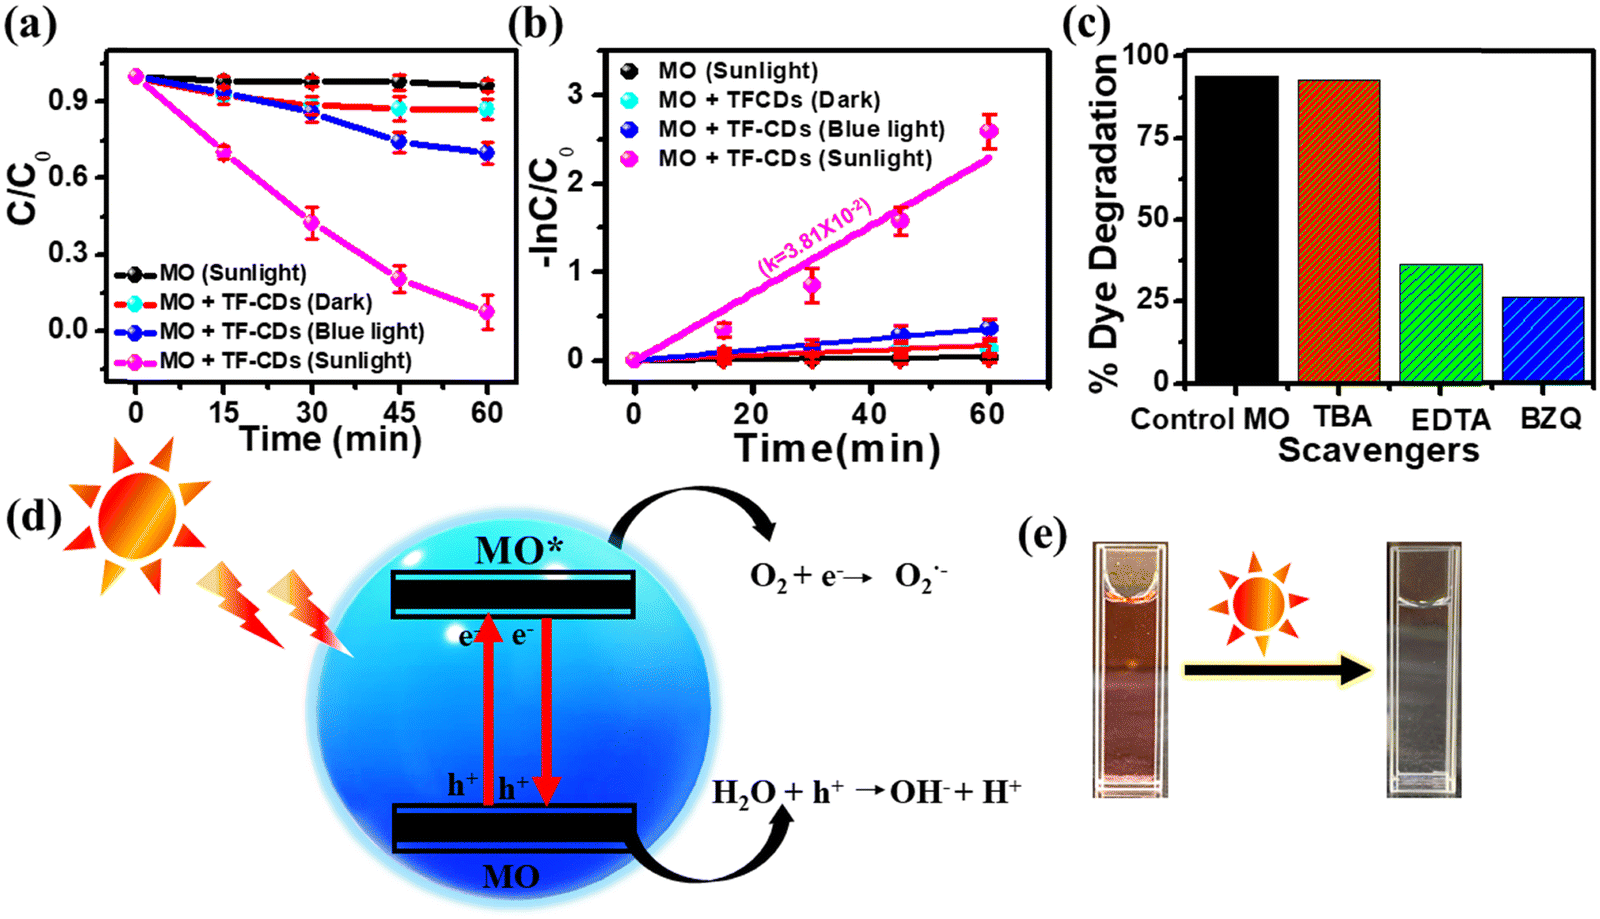
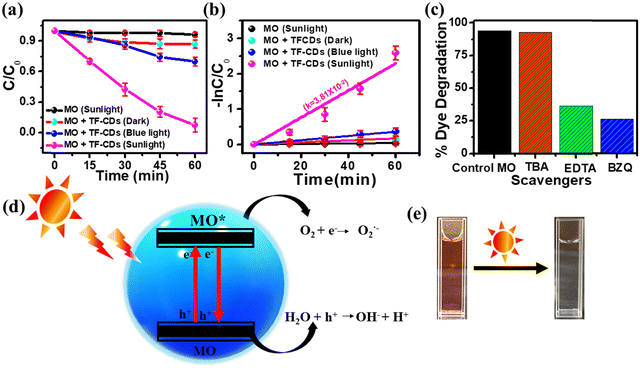
Recently, the photocatalytic pathway has become a leading approach for the waste water treatment and has been utilized extensively for the removal of wide range of pollutants from contaminated water using various catalysts. However, the good optoelectronic properties, cost-effectiveness and biocompatible nature of CDs make them a promising candidate for photocatalytic remediation of various pollutants. MO is an anionic dye that has been widely employed in various major industries but the unrestricted disposal of MO in the water bodies without appropriate treatment has resulted in serious health problems for both human and marine life.86 Here, we have examined the photocatalytic efficacy of TF-CDs (4.7 mg mL−1) for environmental remediation using MO (∼10 ppm, 50 mL) as a model organic pollutant. Initially, we checked the photostability of MO in sunlight without any catalyst (Fig. S10a, ESI†). In the absence of TF-CDs, MO was found to be highly stable upon illumination under sunlight for 60 min. Furthermore, we carried out the photocatalytic degradation studies of MO in the presence of TF-CDs under dark conditions, blue light and sunlight as shown in Fig. S10b–d (ESI†), respectively. Notably, TF-CDs showed the best photocatalytic activity for the degradation of MO under sunlight illumination (1 kW m−2 power density) while very little degradation of MO was observed under blue light illumination (18 W, ∼420 nm). Fig. 6a shows the comparative C/C0 graph of the above kinetic experiments, which further indicates that the present TF-CDs show better photocatalytic efficiency under sunlight as compared to blue light or dark. Surface defects and dopant materials, which contribute to the enhanced light absorption, are responsible for the better photocatalytic activity of TF-CDs. This further leads to the direct generation of reactive oxygen species (ROS), enabling the photodegradation process. However, light played an important role in the degradation process. The C/C0vs. time plot of the comparative dye degradation demonstrates that blue light is insufficient to completely degrade MO dye.
 |
| | Fig. 6 (a) and (b) Comparative photodegradation of MO under blue light and sunlight and their rate, respectively, (c) effect of scavengers on the degradation of MO, (d) possible mechanism for MO degradation by TF-CDs, and (e) images of MO before and after sunlight exposure (after degradation). | |
When exposed to sunlight, 10 ppm MO dye was degraded (96.8%) in around 60 min, whereas blue light degraded only ∼30.13% under the same conditions. The percentage degradation was calculated using eqn (6). From Fig. 6b, it is evident that the reaction rate (the rate of photodegradation) in the presence of sunlight (3.8 × 10⁻² min−1) is faster than that in the presence of blue light (0.59 × 10⁻² min−1). The pseudo-first-order kinetic model (based on the Langmuir–Hinshelwood approach) was followed in this photodegradation study.19 A comparison of the photocatalytic degradation of MO by TF-CDs with various types of FL photocatalysts reported so far has been listed in Table S1 (ESI†), emphasizing the superior performance of TF-CDs. Furthermore, the reliability of the as-prepared TF-CD as a photocatalyst for degrading MO was validated by performing experiments using different reaction parameters such as by varying the concentration of MO dye (5–30 ppm) and TF-CDs solution (1–7 μL mL−1) as well as by varying the pH (2–10) and the details are given in ESI† (Fig. S11 and S12).
3.8.1. The plausible mechanism of MO degradation.
Furthermore, electrochemical studies were performed to gain a better understanding about the photogeneration of charge carriers in the TF-CD photocatalyst. The transient photocurrent responses of TF-CDs and bare electrodes were recorded for several on–off cycles under visible light irradiation and are plotted in Fig. S13a (ESI†). For TF-CDs, the on–off response to visible light is much stronger than in the bare sample, where photogenerated electrons and holes could be efficiently separated, reducing the photogenerated carrier recombination. The improved photogeneration of charge carriers could lead to enhanced photocatalytic activity of TF-CDs. EIS was performed to further estimate the charge transfer and recombination process. As shown in Fig. S13b (ESI†), the smaller arc radius on the EIS Nyquist plot of TF-CDs as compared to the bare sample has been observed under visible light illumination indicates effective separation of photogenerated electron–hole pairs and faster charge transfer. The results obtained from photocurrent response and EIS stipulate the separation of electron–hole pairs and lower recombination rates, which improved photocatalytic activities.
Additionally, we performed the radical scavenging test to establish the role of radicals in the degradation process of MO. For this purpose, the photodegradation process of MO was studied in the presence of various radical scavengers such as TBA to scavenge the hydroxyl radicals (˙OH), Na2EDTA to trap the holes (h+) and BZQ to scavenge superoxide radicals (O2˙−). Fig. 6c displays the comparative results of different scavenging agents for MO dye. The extent of photocatalytic degradation of MO decreases to 26% in the presence of BZQ, which can be attributed to the scavenging of O2˙−. Furthermore, the presence of Na2EDTA resulted in only 36% degradation of MO. Notably, 92% degradation of MO was observed in the presence of TBA, which clearly shows that ˙OH plays a very little role in the photodegradation of MO. Taken together, the above results clearly show the importance of O2˙− and holes in the photocatalytic degradation of MO. Fig. 6d shows a schematic illustration of the plausible mechanism for the photocatalytic degradation of MO in the presence of TF-CDs under sunlight illumination. Initially, the irradiation of MO in the presence of TF-CDs under sunlight illumination helps in the generation of excited state electrons (e−) and holes (h+) in TF-CDs. These h+ directly oxidize the MO into CO2 and H2O and e− activate dissolved oxygen (O2) to generate O2˙−, allowing the degradation of MO into lower molecular weight hydrocarbons. Fig. 6e shows the dye solution before and after exposure of sunlight in the presence of TF-CD, representing the pure solution after degradation. Furthermore, the details of real sample analysis for MO degradation are given in ESI.†
4. Conclusion
In the current work, we have synthesized N, S and P-doped CDs from C. thevetia flowers by a simple one pot hydrothermal method. Furthermore, the aqueous solution of TF-CDs shows a significant and selective FL quenching towards PA among the other nitro compounds under examination. We developed TF-CD-loaded highly porous PVDF film strips portable for an on-site detection of PA. The TF-CDs@PVDF film shows blue color FL, which is quenched upon the addition of PA. The TSCPC and UV-vis measurements revealed a static quenching mechanism for PA detection. Moreover, the sensor can also be employed further for real sample analysis, highlighting its practicability. Besides, the as-synthesized TF-CDs were further checked for their photocatalytic properties. Here, TF-CDs were employed as a potential advanced photocatalytic material to degrade about 10 ppm of MO dye in 60 minutes in the presence of only sunlight. The synthesized material is utilized for the easy, fast, and selective detection of PA in both aqueous and film forms and also for the photodegradation of MO.
Conflicts of interest
There are no conflicts to declare.
Acknowledgements
N. M. would like to thank UGC, New Delhi, for the research fellowship. D. K. thank IIT Indore for the Master's Programme. K. N. thanks the DBT-RA programme in Biotechnology and Life Sciences (DBTHRDPMU/DBT-RA/2022-23/EXT/59). S. M. M thanks SERB-DST (CRG/2020/001769), BRNS (Project no. 58/14/17/2020-BRNS/37215), and IIT Indore for financial support. The authors gratefully acknowledge Sophisticated Instrumentation Centre (SIC), IIT Indore, for all the characterization facilities, CSIR-NIIST for TEM and XPS facility.
References
- C. Yu, X. Li, X. Qiao, Z. Zhang, D. Zhang, H. Liu, X.-L. Hao, Z. Wang, H. You and L. Zhou, J. Phys. Chem. C, 2023, 127, 3176–3183 CrossRef CAS
 .
.
- N. Mate, Pranav, K. Nabeela, N. Kaur and S. M. Mobin, ACS Omega, 2022, 7, 43759–43769 CrossRef CAS PubMed .
- Y. Wu, D. Qin, Z. Luo, S. Meng, G. Mo, X. Jiang and B. Deng, ACS Sustainable Chem. Eng., 2022, 10, 5195–5202 CrossRef CAS .
- H. Barhum, T. Alon, M. Attrash, A. Machnev, I. Shishkin and P. Ginzburg, ACS Appl. Nano Mater., 2021, 4, 9919–9931 CrossRef CAS PubMed .
- Z. M. Markovic, M. Labudová, M. Danko, D. Matijašević, M. Mičušík, V. Nádaždy, M. Kováčová, A. Kleinová, Z. Špitalský, V. Pavlović, D. D. Milivojević, M. Medić and B. M. T. Marković, ACS Sustainable Chem. Eng., 2020, 8, 16327–16338 CrossRef CAS .
- T. S. John, P. K. Yadav, D. Kumar, S. K. Singh and S. H. Hasan, Luminescence, 2020, 35, 913–923 CrossRef CAS PubMed .
- Q. Wu, L. Wang, Y. Yan, S. Li, S. Yu, J. Wang and L. Huang, ACS Sustainable Chem. Eng., 2022, 10, 3027–3036 CrossRef CAS .
- L. Yue, H. Li, Q. Sun, J. Zhang, X. Luo, F. Wu and X. Zhu, ACS Appl. Nano Mater., 2020, 3, 869–876 CrossRef CAS .
- N. Li, Z. Liu, M. Liu, C. Xue, Q. Chang, H. Wang, Y. Li, Z. Song and S. Hu, Inorg. Chem., 2019, 58, 5746–5752 CrossRef CAS PubMed .
- G. Ragazzon, A. Cadranel, E. V. Ushakova, Y. Wang, D. M. Guldi, A. L. Rogach, N. A. Kotov and M. Prato, Chem, 2021, 7, 606–628 CAS .
- Q. Zeng, T. Feng, S. Tao, S. Zhu and B. Yang, Light: Sci. Appl., 2021, 10, 142 CrossRef CAS PubMed .
- F. Yuan, T. Yuan, L. Sui, Z. Wang, Z. Xi, Y. Li, X. Li, L. Fan, Z. Tan, A. Chen, M. Jin and S. Yang, Nat. Commun., 2018, 9, 2249 CrossRef PubMed .
- D. Rodríguez-Padrón, M. Algarra, L. A. C. Tarelho, J. Frade, A. Franco, G. de Miguel, J. Jiménez, E. Rodríguez-Castellón and R. Luque, ACS Sustainable Chem. Eng., 2018, 6, 7200–7205 CrossRef .
- S. R. Ankireddy, V. G. Vo, S. S. A. An and J. Kim, ACS Appl. Bio Mater., 2020, 3, 4873–4882 CrossRef CAS PubMed .
- W. Lu, Y. Guo, J. Zhang, Y. Yue, L. Fan, F. Li, C. Dong and S. Shuang, ACS Appl. Mater. Interfaces, 2022, 14, 57206–57214 CrossRef CAS PubMed .
- Y. Ran, S. Wang, Q. Yin, A. Wen, X. Peng, Y. Long and S. Chen, Luminescence, 2020, 35, 870–876 CrossRef CAS PubMed .
- Y. Li, C. Liu, M. Chen, Y. Zheng, H. Tian, R. Shi, X. He and X. Lin, Nanomaterials, 2022, 12, 3062 CrossRef CAS PubMed .
- R. Sangubotla, S. Won and J. Kim, J. Photochem. Photobiol., A, 2023, 438, 114542 CrossRef CAS .
- A. Bhati, S. R. Anand, Gunture, A. K. Garg, P. Khare and S. K. Sonkar, ACS Sustainable Chem. Eng., 2018, 6, 9246–9256 CrossRef CAS .
- I. Milenković, M. Borišev, Y. Zhou, S. Z. Spasić, R. M. Leblanc and K. Radotić, J. Agric. Food Chem., 2021, 69, 5446–5451 CrossRef PubMed .
- A. Tyagi, K. M. Tripathi, N. Singh, S. Choudhary and R. K. Gupta, RSC Adv., 2016, 6, 72423–72432 RSC .
- J. Y. Tai, K. H. Leong, P. Saravanan, S. T. Tan, W. C. Chong and L. C. Sim, J. Environ. Chem. Eng., 2021, 9, 104622 CrossRef CAS .
- S. Senapati and K. K. Nanda, ACS Sustainable Chem. Eng., 2018, 6, 13719–13729 CrossRef CAS .
- A. Chowdhury and P. S. Mukherjee, J. Org. Chem., 2015, 80, 4064–4075 CrossRef CAS PubMed .
- P. C. Purba, M. Venkateswaralu, S. Bhattacharyya and P. S. Mukherjee, Inorg. Chem., 2022, 61, 713–722 CrossRef CAS PubMed .
- Y. Nailwal, M. Devi and S. K. Pal, ACS Appl. Polym. Mater., 2022, 4, 2648–2655 CrossRef CAS .
- Y. Fan, T. Tao, H. Wang, Z. Liu, W. Huang and H. Cao, Dyes Pigm., 2021, 191, 109355 CrossRef CAS .
- V. Sharma and M. S. Mehata, Spectrochim. Acta, Part A, 2021, 260, 119937 CrossRef CAS PubMed .
- X. Chen, C. Sun, Y. Liu, L. Yu, K. Zhang, A. M. Asiri, H. M. Marwani, H. Tan, Y. Ai, X. Wang and S. Wang, Chem. Eng. J., 2020, 379, 122360 CrossRef CAS .
- Y. Zhao, L. Xu, F. Kong and L. Yu, Chem. Eng. J., 2021, 416, 129090 CrossRef CAS .
- S. Chongdar, U. Mondal, T. Chakraborty, P. Banerjee and A. Bhaumik, ACS Appl. Mater. Interfaces, 2023, 15, 14575–14586 CAS .
- H. Yu, Q. Liu, M. Fan, J. Sun, Z.-M. Su, X. Li and X. Wang, Dyes Pigm., 2022, 197, 109812 CrossRef CAS .
- K. Acharyya and P. S. Mukherjee, Chem. Commun., 2014, 50, 15788–15791 RSC .
- J.-F. Xiong, J.-X. Li, G.-Z. Mo, J.-P. Huo, J.-Y. Liu, X.-Y. Chen and Z.-Y. Wang, J. Org. Chem., 2014, 79, 11619–11630 CrossRef CAS PubMed .
- J.-H. Hu, W. Zhang, C.-X. Ren, Y. Xiong, J.-Y. Zhang, J. He, Y. Huang, Z. Tao and X. Xiao, Anal. Chim. Acta, 2023, 1254, 341095 CrossRef CAS PubMed .
- A. Saravanan, M. Maruthapandi, P. Das, S. Ganguly, S. Margel, J. H. T. Luong and A. Gedanken, ACS Appl. Bio Mater., 2020, 3, 8023–8031 CrossRef CAS PubMed .
- S. Pagidi, H. K. Sadhanala, K. Sharma and A. Gedanken, Adv. Electron. Mater., 2022, 8, 2100969 CrossRef CAS .
- P. Das, M. Maruthapandi, A. Saravanan, M. Natan, G. Jacobi, E. Banin and A. Gedanken, ACS Appl. Nano Mater., 2020, 3, 11777–11790 CrossRef CAS .
- A. López-Beltrán, C. Iriarte-Mesa, C. Murru, F. J. Chao-Mujica, A. L. Corcho-Valdés, L. Morales-Álvarez, L. F. Desdín-García, J. Deschamps and M. Antuch, Chem. – Eur. J., 2023, 29, e202300188 CrossRef PubMed .
- M. H. M. Facure, R. Schneider, L. A. Mercante and D. S. Correa, Environ. Sci.: Nano, 2020, 7, 3710–3734 RSC .
- K. B. R. Teodoro, M. H. M. Facure, R. Schneider, A. D. Alvarenga, R. S. Andre and D. S. Correa, ACS Appl. Nano Mater., 2023, 6, 11561–11571 CrossRef CAS .
- M. Ng Hau Kwan, C. P. Leo, S. M. N. Arosa Senanayake, G. K. Lim and M. K. Tan, J. Environ. Chem. Eng., 2020, 8, 103187 CrossRef CAS .
- X. Ren, L. Cao, W. Liang, P. Wang, C. E. Bunker, L. Yang, L. R. Teisl and Y.-P. Sun, ACS Appl. Nano Mater., 2022, 5, 2820–2827 CrossRef CAS .
- P. Das, S. Ganguly, S. R. Ahmed, M. Sherazee, S. Margel, A. Gedanken, S. Srinivasan and A. R. Rajabzadeh, ACS Appl. Polym. Mater., 2022, 4, 9323–9340 CrossRef CAS .
- Z. Feng, K. H. Adolfsson, Y. Xu, H. Fang, M. Hakkarainen and M. Wu, Sustainable Mater. Technol., 2021, 29, e00304 CrossRef CAS .
- Y. Zhang, L. Gao, S. Ma and T. Hu, Spectrochim. Acta, Part A, 2022, 267, 120525 CrossRef CAS PubMed .
- Y.-J. Jin, B.-M. Si, E. Kim, J. Lee, H. Kim, G. Kwak, T. Sakaguchi, J. Lee, I. Y. Song, C.-L. Lee, J. H. Kim, K. Heo and W.-E. Lee, ACS Appl. Mater. Interfaces, 2023, 15, 12339–12349 CrossRef CAS PubMed .
- M. Kanjo, M. Gon and K. Tanaka, ACS Appl. Mater. Interfaces, 2023, 15, 31927–31934 CrossRef CAS PubMed .
- D. B. Kanzariya, R. Goswami, D. Muthukumar, R. S. Pillai and T. K. Pal, ACS Appl. Mater. Interfaces, 2022, 14, 48658–48674 CrossRef CAS PubMed .
- K. J. Goswami, N. Sultana and N. S. Sarma, Sens. Actuators, B, 2023, 374, 132778 CrossRef CAS .
- R. Mitra and A. Saha, ACS Sustainable Chem. Eng., 2017, 5, 604–615 CrossRef CAS .
- Q. Liu, M. Liu, D. Li, K. Li, H. Xu, J. Lu, X. Shao and T. Liu, Sens. Diagn., 2022, 1, 130–133 RSC .
- L. Dong, Z. Xiong, X. Liu, D. Sheng, Y. Zhou and Y. Yang, J. Appl. Polym. Sci., 2019, 136, 47555 CrossRef .
- R. Ram, D. Khastgir and M. Rahaman, Adv. Polym. Technol., 2018, 37, 3287–3296 CrossRef CAS .
- D. Zhang, W. Jiang, Y. Zhao, Y. Dong, X. Feng and L. Chen, Appl. Surf. Sci., 2019, 494, 635–643 CrossRef CAS .
- S. Tufail, Z. Ali, S. Hanif, A. Sajjad and M. Zia, Biochem. Syst. Ecol., 2022, 105, 104526 CrossRef CAS .
- S. Karami, M. Shamsipur, A. A. Taherpour, M. Jamshidi and A. Barati, J. Phys. Chem. C, 2020, 124, 10638–10646 CrossRef CAS .
- D. Das and R. k Dutta, ACS Appl. Nano Mater., 2021, 4, 3444–3454 CrossRef CAS .
- Q. Xu, T. Kuang, Y. Liu, L. Cai, X. Peng, T. S. Sreeprasad, P. Zhao, Z. Yu and N. Li, J. Mater. Chem. B, 2016, 4, 7204–7219 RSC .
- L. Li, Y. Li, Y. Ye, R. Guo, A. Wang, G. Zou, H. Hou and X. Ji, ACS Nano, 2021, 15, 6872–6885 CrossRef CAS PubMed .
- L. Bishwal, S. Kar and S. Bhattacharyya, ACS Appl. Mater. Interfaces, 2023, 15, 15907–15916 CrossRef CAS PubMed .
- D. Saini, R. Aggarwal, A. K. Sonker and S. K. Sonkar, ACS Appl. Nano Mater., 2021, 4, 9303–9312 CrossRef CAS .
- C. Lu, Q. Zhu, X. Zhang, H. Ji, Y. Zhou, H. Wang, Q. Liu, J. Nie, W. Han and X. Li, ACS Sustainable Chem. Eng., 2019, 7, 8542–8553 CrossRef CAS .
- M. Hahn, J. M. Kim, H. Hong, C. Lee, D. Kim, M. Y. Han, H. S. Kim and Y. Piao, ACS Appl. Nano Mater., 2022, 5, 11896–11905 CrossRef CAS .
- W. Wang, J. Chen, D. Wang, Y. Shen, L. Yang, T. Zhang and J. Ge, Anal. Methods, 2021, 13, 789–795 RSC .
- B. R. Meena, S. Meena, D. Chittora and K. Sharma, Biochem. Biophys. Rep., 2021, 25, 100914 CAS .
- N. Soni, S. Singh, S. Sharma, G. Batra, K. Kaushik, C. Rao, N. C. Verma, B. Mondal, A. Yadav and C. K. Nandi, Chem. Sci., 2021, 12, 3615–3626 RSC .
- Y. Gao, S. Li, Y. Li, L. Yao and H. Zhang, Appl. Catal., B, 2017, 202, 165–174 CrossRef CAS .
- Y.-Q. Wang, Z. Fang, H. Min, X.-Y. Xu and Y. Li, ACS Appl. Nano Mater., 2022, 5, 8467–8474 CrossRef CAS .
- M. Stepanova, Y. Gromova, A. Dubavik, V. Maslov, A. Orlova and V. Zakharov, J. Phys. Chem. C, 2022, 126, 10441–10448 CrossRef CAS .
- C. Dalal, A. K. Garg, M. Mathur and S. K. Sonkar, ACS Appl. Nano Mater., 2022, 5, 12699–12710 CrossRef CAS .
- M. K. Mahto, D. Samanta, M. Shaw, M. A. S. Shaik, R. Basu, I. Mondal, A. Bhattacharya and A. Pathak, ACS Appl. Nano Mater., 2023, 6, 8059–8070 CrossRef CAS .
- X.-T. Yuan, C.-X. Xu, H.-Z. Geng, Q. Ji, L. Wang, B. He, Y. Jiang, J. Kong and J. Li, J. Hazard. Mater., 2020, 384, 120978 CrossRef CAS PubMed .
- O. D. Jayakumar, B. P. Mandal, J. Majeed, G. Lawes, R. Naik and A. K. Tyagi, J. Mater. Chem. C, 2013, 1, 3710–3715 RSC .
- P. Huang, S. Xu, W. Zhong, H. Fu, Y. Luo, Z. Xiao and M. Zhang, Sens. Actuators, A, 2021, 330, 112880 CrossRef CAS .
- S. Singh, N. Shauloff, C. P. Sharma, R. Shimoni, C. J. Arnusch and R. Jelinek, J. Colloid Interface Sci., 2021, 592, 342–348 CrossRef CAS PubMed .
- D. Li, J. Liu, R. T. K. Kwok, Z. Liang, B. Z. Tang and J. Yu, Chem. Commun., 2012, 48, 7167–7169 RSC .
- L. Lin, M. Rong, S. Lu, X. Song, Y. Zhong, J. Yan, Y. Wang and X. Chen, Nanoscale, 2015, 7, 1872–1878 RSC .
- X. Sun, J. He, Y. Meng, L. Zhang, S. Zhang, X. Ma, S. Dey, J. Zhao and Y. Lei, J. Mater. Chem. A, 2016, 4, 4161–4171 RSC .
- A. Pal, M. P. Sk and A. Chattopadhyay, ACS Appl. Mater. Interfaces, 2016, 8, 5758–5762 CrossRef CAS PubMed .
- M. Kaur, S. K. Mehta and S. K. Kansal, Sens. Actuators, B, 2017, 245, 938–945 CrossRef CAS .
- M. Gupta and H. Lee, ACS Appl. Mater. Interfaces, 2018, 10, 41717–41723 CrossRef CAS PubMed .
- W. Liu, C. Chen, Z. Wu, Y. Pan, C. Ye, Z. Mu, X. Luo, W. Chen and W. Liu, ACS Sustainable Chem. Eng., 2020, 8, 13497–13506 CrossRef CAS .
- A. K. Sharma, B. S. Kaith, K. Chandel and A. Singh, Int. J. Biol. Macromol., 2020, 147, 582–594 CrossRef PubMed .
- M. Kumar, M. S. Chauhan, M. S. Akhtar and A. Umar, Ceram. Int., 2021, 47, 3089–3098 CrossRef CAS .
- C. Dalal, A. K. Garg and S. K. Sonkar, ACS Appl. Nano Mater., 2021, 4, 5611–5620 CrossRef CAS .
Footnote |
| † Electronic supplementary information (ESI) available: Deconvoluted high resolution XPS spectra of TF-CDs, FL spectra of TF-CDs upon addition of various interference nitro aromatic compounds, Plot of (αhν)2versus photoenergy (hν) for TF-CDs, competitive selectivity in the sensing response of TF-CDs, UV-visible absorption spectra of TF-CDs with addition of PA and maximum fluorescence excitation of TF-CDs, PXRD spectra of PVDF and TF-CD@PVDF, contact angle measurements of PVDF membranes and TF-CD@PVDF, effect on FL properties of TF-CD@PVDF by varying the concentration of TF-CDs, the stability of TF-CD@PVDF films, the selectivity of TF-CD@PVDF films, degradation study of MO under various conditions, effect of degradation on variation of MO and TF-CD concentration, effect of pH, comparison table for photocatalytic performance towards MO of various types of photocatalysts, degradation of MO under sunlight in real water samples, transient photocurrent response and EIS Nyquist plots of TF-CDs. See DOI: https://doi.org/10.1039/d3tc03625a |
|
| This journal is © The Royal Society of Chemistry 2023 |

 *abc
*abc