
Fe(III)-carboxythiolate layered metal–organic frameworks with interest as active materials for rechargeable alkali-ion batteries†
Nusik
Gedikoglu‡
a,
Pablo
Salcedo-Abraira‡
 a,
Long H. B.
Nguyen
bd,
Nathalie
Guillou
c,
Nicolas
Dupré
a,
Christophe
Payen
a,
Nicolas
Louvain
bd,
Lorenzo
Stievano
bd,
Philippe
Poizot
a and
Thomas
Devic
*a
a,
Long H. B.
Nguyen
bd,
Nathalie
Guillou
c,
Nicolas
Dupré
a,
Christophe
Payen
a,
Nicolas
Louvain
bd,
Lorenzo
Stievano
bd,
Philippe
Poizot
a and
Thomas
Devic
*a
aNantes Université, CNRS, Institut des Matériaux de Nantes Jean Rouxel, IMN, F-44000 Nantes, France. E-mail: thomas.devic@cnrs-imn.fr
bICGM, Univ Montpellier, CNRS, ENSCM, Montpellier, France
cInstitut Lavoisier de Versailles, UMR CNRS 8180, Université de Versailles St-Quentin en Yvelines, Université Paris Saclay, 78035 Versailles, France
dRéseau sur le Stockage Electrochimique de l'Energie (RS2E), FR CNRS 3459, Amiens, France
First published on 20th October 2023
Abstract
Metal organic frameworks (MOFs) built up from metal–sulfur (M–S) bonds have shown great promise in the last decade thanks to their impressive electronic properties arising from the more covalent nature of the M–S bond when compared to M–O. In this study, we aim to expand the scope of available S-based MOFs to high oxidation state cations Mn+ (n ≥ 3). Through the systematic exploration of the reactivity of the mixed thiolate-carboxylate ligand 2,5-disulfhydrylbenzene-1,4-dicarboxylic acid (H4DSBDC) with Fe(III) salts, three new compounds were isolated. The structure of these materials consists of the same hybrid layers made of chains of edge-sharing FeS4O2 octahedra connected by fully deprotonated DSBDC4−, alternating with either organic (dimethyammonium, H2N(CH3)2+) or inorganic (Na+ or K+) cations. The Fe–S connection leads to a strong absorption in the visible range, while the +III oxidation state of Fe, evidenced by Mössbauer spectroscopy, ensures a fairly good stability towards oxygen and water, higher than that typically observed with +II cations. Furthermore, Na{Fe(DSBDC)} exhibits an interesting reversible electrochemical activity when cycled both versus Li, Na and K in half-cells with good capacity retention, confirming the potential of this family of materials for applications involving electron transfer.
1 Introduction
While oxygen-based ligands are dominating the field of metal organic frameworks (MOFs) (together with nitrogen-based ligands), they often suffer from poor electronic properties, arising from the rather ionic character of metal–oxygen bonds. The resulting lack of electronic conductivity is a clear drawback for various applications in which a fast electron transfer process is required, such as (photo)electrocatalysis, sensing, photovoltaics, and electrochemical energy storage. Elements less electronegative than oxygen giving rise to more covalent metal–ligand bonds offer great opportunities. In this prospect, there has been a rising interest in MOFs based on non-innocent, conjugated thiolate ligands in the last decade.1–4 These materials were found to be particularly appealing for electrochemical energy storage, with the mechanism based either on faradaic or pseudo-capacitive processes.5–14 Pure S-based ligands such as 1,2-dithiolene lead to materials with outstanding electronic properties (metallic,15 and even superconducting16 behaviour have been reported), but generally poorly crystallized. Alternatively, mixed O, S-based ligands, such are carboxylate-thiolate, are of interest to achieve both improved electronic properties and a decent crystallinity for in-depth structural characterization. For example, Dincă et al. reported analogues of CPO-27/MOF-74(M) (M = Mn(II), Fe(II)) prepared from 2,5-disulfhydrylbenzene-1,4-dicarboxylic acid (H4DSBDC) instead of 2,5-dihydroxybenzene-1,4-dicarboxylic acid (H4DOBDC), with a comparable (although slightly different) crystal structure but with improved electronic conductivities.17,18 Both compounds were obtained from M(II) salts under dry conditions and characterized in the absence of oxygen, suggesting a strong sensitivity toward oxidation, as observed for the oxygenated counterpart CPO-27(Fe).19 With the aim of producing more stable frameworks, this study is interested in building new MOFs from Fe(III) instead of Fe(II). The reactivity of H4DSBDC and related ligands with a large variety of cations has been already explored, notably by the team of Z. Xu. In line with the hard and soft acid and base (HSAB) theory,20 it was found that networks comprising M(I) (M = Ag) and M(II) (M = Fe, Co, Ni, Cu, Pb) cations rely on M–S (and M–O) bonds,21–23 while those based on M(III) (M = Al, Eu) and M(IV) (M = Zr) cations are based exclusively on M–O bonds.21,24–28 Nevertheless, studies on molecular complexes derived from thiosalicylic acid reveal that the formation of M–S bonds with high-charge cations (e.g. Co(III), Mn(III), Fe(III), and V(IV)) is still possible, but usually requires the addition of a base.29–33 As basic media strongly favour the formation of inorganic M(IV, III) oxides/hydroxides,34 the preparation of MOFs in a pure form using related synthetic conditions is intrinsically challenging. With this in mind, the reactivity of H4DSBDC with Fe(III) precursors is systematically investigated, both in the absence and in the presence of an inorganic base. Three anionic networks are obtained, all based on similar layers built up from chains of edge-sharing FeS4O2 octahedra and fully deprotonated DSBDC4−, separated by either organic (dimethylammonium, DMA) or inorganic (Na, K) cations. The Fe–S connectivity gives rise to a strong absorption in the visible range thanks to ligand-to-metal charge transfer (LMCT). All solids are stable in air and various liquids, including water, contrary to their Fe(II) counterparts. It is also shown that the dehydration of the Na-based solid is accompanied by a reversible structural change implying a slippage of the layer to accommodate the departure of water molecules bound to Na. Eventually, Na{Fe(DSBDC)} contains Fe(III) redox centres and the structure possesses a sufficiently large interlayer spacing that should accommodate and facilitate fast ion intercalation/de-intercalation processes. Thus, this material can be potentially used as an electrode material for rechargeable alkali-ion batteries. The reversible electrochemical insertion in this solid was then assessed in Li, Na and K half-cells. Up to 80% of the Fe(III) can participate in reversible electrode reactions, with reasonable capacity retention and a moderate sensitivity to the cycling rate when compared to purely oxygenated MOFs.2 Materials and methods
2.1 Synthetic procedure
2,5-Disulfhydrylbenzene-1,4-dicarboxylic acid (H4DSBDC) was prepared using the reported procedure.352.2 Crystallographic studies
Single crystal X-ray diffraction (SCXRD) analysis of (DMA){Fe(DSBDC)} was performed at room temperature using a Rigaku XtaLAB Synergy diffractometer equipped with Mo Kα radiation (0.71073 Å). The CrysAlisPro suite was used to integrate and scale intensities and a semi-empirical absorption correction (ABSPACK) was applied based on multiple scans of equivalent reflections. The structure was solved by direct methods using SHELXS and refined with the full matrix least squares routine SHELXL.36,37 Eight non-H-atoms were refined anisotropically, while hydrogen atoms were introduced geometrically and not refined. Crystallographic details are summarized in Table S1.†Crystal structures of Na{Fe(DSBDC)}·2.5H2O and Na{Fe(DSBDC)} were elucidated from powder X-ray diffraction (PXRD) data collected on the CRISTAL beamline at Synchrotron SOLEIL (L'Orme des Merisiers, France). Extractions of the peak positions, pattern indexing, whole powder pattern decomposition, structural determination (simulated annealing and difference Fourier calculations), as well as Rietveld refinement were carried out with the TOPAS program.38 The LSI-indexing method converged unambiguously to triclinic unit cells with satisfactory figures of merit (see Tables 1 and S2†). Unit cell parameters, background and peak shape characteristics were first refined using the whole powder pattern fitting method, to be then fixed during structural determination undertaken by the simulated annealing process. The DSBDC ligand was treated as a rigid body and allowed to move as well as Na and Fe atoms. Based on the first suggested model, the atomic positions of Fe and Na, and the centre of the rigid body were rapidly fixed on special positions. Successive difference Fourier calculations allowed the location of additional water molecules in the case of the hydrated compound. Given the small number of independent atoms of the structural models, and the high quality data, the rigid body used for the organic ligand could be removed for the Rietveld refinement and only a few soft distance and angle restraints were applied for the anhydrous compound. The H atom of the organic ligand was fixed by geometric constraints. At their final stage, the Rietveld plots (Fig. S3 and S5†) correspond to satisfactory model indicators and profile factors (see Table S2†). They involve 28 and 25 structural parameters for Na{Fe(DSBDC)}·2.5H2O and Na{Fe(DSBDC)}, respectively (1 scale factor, 24 and 21 atomic coordinates and 3 temperature factors). CCDC-2291657, 2291658 and 2291659 contain the supplementary crystallographic data for Na{Fe(DSBDC)}, Na{Fe(DSBDC)}·2.5H2O and (DMA){Fe(DSBDC)}.†
2.3 Physicochemical characterization
Routine room temperature powder X-ray diffraction (PXRD) patterns were collected in a Bragg–Brentano mode with a Bruker D8 Advance diffractometer equipped with a Cu anode and a monochromator (λ = 1.5406 Å). Variable temperature PXRD (VTPXRD) experiments were carried out under air using an Anton Paar XRK 900 high-temperature chamber in a Bruker D8 Advance diffractometer collecting each 10 °C with a heating rate of 1 °C min−1. For ICP-AES experiments (Fe, Na, and K), solids were first dissolved in a HNO3 20 wt% and further analyzed with an iCAP 6300 radial analyzer (Thermo Scientific). Elemental analyses (C, H, N, S) were carried out on a Flash 2000 analyzer from Thermo Scientific. Thermogravimetric analyses (TGA) were performed under air at 5 °C min−1 up to 1000 °C on Setaram SENSYSevo equipment. Fourier-transformed infrared (FTIR) spectra were recorded at room temperature with a Bruker alpha FTIR spectrometer in the attenuated total reflectance (ATR) mode between 400 and 4000 cm−1. UV-Vis spectra were collected on a PerkinElmer lambda 1050 equipped with an integration sphere modulus. Scanning electron microscopy-energy dispersive spectroscopy (SEM-EDS) analyses were carried out on a JEOL JSM 5800LV scanning microscope equipped with an SDD SAMx energy dispersive spectrometer. The powder samples were embedded in epoxy resin polished to obtain a flat surface, and metallized with a thin layer of carbon. Elemental ratios of phases were derived from EDS map analyses. The EDS maps were collected at a resolution of 256 × 337 pixels with an 8 ms dwell time averaged over 4 passes. 1H-NMR spectra were collected on an Avance 300 MHz Bruker spectrometer in D2O. The solid was first degraded in NaOD 20% w/w and then filtered in order to remove the resulting Fe(OH)3. Transmission 57Fe Mössbauer spectra were collected at room temperature with a triangular velocity waveform. A Kr gas-filled proportional counter was used for the detection of γ-rays produced by a 0.5 GBq 57Co:Rh source, kept at room temperature. Velocity calibration was performed with an α-Fe foil at room temperature. Absorbers containing ∼20 mg cm−2 of the active material were used in all acquisitions. For dehydrated Na{Fe(DSBDC)}, the sample was protected from air using thermally sealed coffee bags. Low-temperature Mössbauer measurements were carried out at −268 °C with a helium flow cryostat (SHI-850 Series from Janis) with the source at room temperature. The spectra were analysed by fitting the experimental spectrum using an appropriate combination of quadrupole doublets and magnetic sextets with Lorentzian profiles using the PC-Mos II computer program.39 The isomer shift scale is referred to α-Fe at room temperature. 23Na MAS NMR experiments were carried out at room temperature on a Bruker Avance-200 spectrometer (B0 = 4.7 T, Larmor frequency ν0(23Na) = 52.94 MHz). MAS spectra were obtained by using a Bruker MAS probe with a cylindrical 2.5 mm o.d. zirconia rotor. Spinning frequencies up to 25 kHz were utilized. 23Na NMR spectra were acquired using an echo sequence to discard the significant contribution from the probe signal, with a π/2 pulse of 1 μs. Recycle delays of 1 s were determined to ensure quantitative measurements. The isotropic shifts, reported in parts per million, are relative to an external 1 M solution of NaCl in water, set at 0 ppm. Magnetic measurements were performed with a Quantum Design MPMS XL SQUID magnetometer. Magnetic susceptibility χ was defined as the ratio of magnetization to the applied DC magnetic field. The nitrogen sorption experiment at 77 K was carried out using a Micromeritics Triflex volumetric adsorption apparatus. The sample was activated under vacuum at 100 °C prior to the sorption measurement.2.4 Electrochemical storage assessments vs. Li, Na and K
Na{Fe(DSBDC)}·2.5H2O was dried at 100 °C under vacuum overnight prior to its use in order to ensure the complete removal of water molecules. Solid-state electrochemical experiments were performed under galvanostatic conditions using two-electrode cells with alkali metals as the negative electrode. For Li, a two-electrode Swagelok®-type cell containing a Li metal disc as both the counter and reference electrode was used, together with a Whatman GF/D glass fibre separator, and 100 μL of LP30 electrolyte (1 M LiPF6 in ethylene carbonate (EC)![[thin space (1/6-em)]](https://www.rsc.org/images/entities/char_2009.gif) :dimethyl carbonate (DMC) (1:1 vol%) 99.9%, from Solvionic ref. E001). The composite positive electrodes were prepared in an Ar filled glovebox by mixing the active material with Ketjenblack® EC-600JD (Akzo Nobel) carbon conducting additive to ensure proper electronic conduction (MOF:carbon ratio ≈ 70:30 wt%, ca. 3 mg of active material per electrode). The electrochemical cells were then cycled in galvanostatic mode at various current densities (from 1 e− exchanged per Fe in 20 h up to 1 e− exchanged per Fe in 2 h) starting from reduction (discharging step) by using an MPG-2 multi-channel system (Bio-Logic SAS, Seyssinet-Pariset, France). Self-supported electrodes were used for electrochemical testing in Na and K half-cells. Dehydrated Na{Fe(DSBDC)} powder was mixed with Ketjenblack® EC-600JD (Akzo Nobel) in the 70:30 wt% ratio, and then 4 wt% of polytetrafluoroethylene (PTFE, Sigma-Aldrich) was added. For Na-ion batteries, the cell was assembled with Na metal as a counter electrode, 1 M NaPF6 in EC:DMC (1:1 by wt%) as an electrolyte, and Whatman glass fibre as a separator. For K-ion batteries, K metal was used as a counter electrode, 5 M KTFSI in dimethoxyethane (DME) as an electrolyte, and a Whatman glass fibre GF/D disk and a tri-layer polypropylene polyethylene membrane (Celgard 2325) as separators. Coin cells (CR2032) were assembled in an Ar-filled glovebox (O2 < 0.5 ppm, H2O < 0.5 ppm). The electrochemical cycles are defined by one oxidation (charge) followed by one reduction (discharge), i.e. after the initial reduction of the material to reach a fully alkalinated state, as commonly found in positive electrode materials.
:dimethyl carbonate (DMC) (1:1 vol%) 99.9%, from Solvionic ref. E001). The composite positive electrodes were prepared in an Ar filled glovebox by mixing the active material with Ketjenblack® EC-600JD (Akzo Nobel) carbon conducting additive to ensure proper electronic conduction (MOF:carbon ratio ≈ 70:30 wt%, ca. 3 mg of active material per electrode). The electrochemical cells were then cycled in galvanostatic mode at various current densities (from 1 e− exchanged per Fe in 20 h up to 1 e− exchanged per Fe in 2 h) starting from reduction (discharging step) by using an MPG-2 multi-channel system (Bio-Logic SAS, Seyssinet-Pariset, France). Self-supported electrodes were used for electrochemical testing in Na and K half-cells. Dehydrated Na{Fe(DSBDC)} powder was mixed with Ketjenblack® EC-600JD (Akzo Nobel) in the 70:30 wt% ratio, and then 4 wt% of polytetrafluoroethylene (PTFE, Sigma-Aldrich) was added. For Na-ion batteries, the cell was assembled with Na metal as a counter electrode, 1 M NaPF6 in EC:DMC (1:1 by wt%) as an electrolyte, and Whatman glass fibre as a separator. For K-ion batteries, K metal was used as a counter electrode, 5 M KTFSI in dimethoxyethane (DME) as an electrolyte, and a Whatman glass fibre GF/D disk and a tri-layer polypropylene polyethylene membrane (Celgard 2325) as separators. Coin cells (CR2032) were assembled in an Ar-filled glovebox (O2 < 0.5 ppm, H2O < 0.5 ppm). The electrochemical cycles are defined by one oxidation (charge) followed by one reduction (discharge), i.e. after the initial reduction of the material to reach a fully alkalinated state, as commonly found in positive electrode materials.
3 Results and discussion
3.1 Synthesis and structure determination
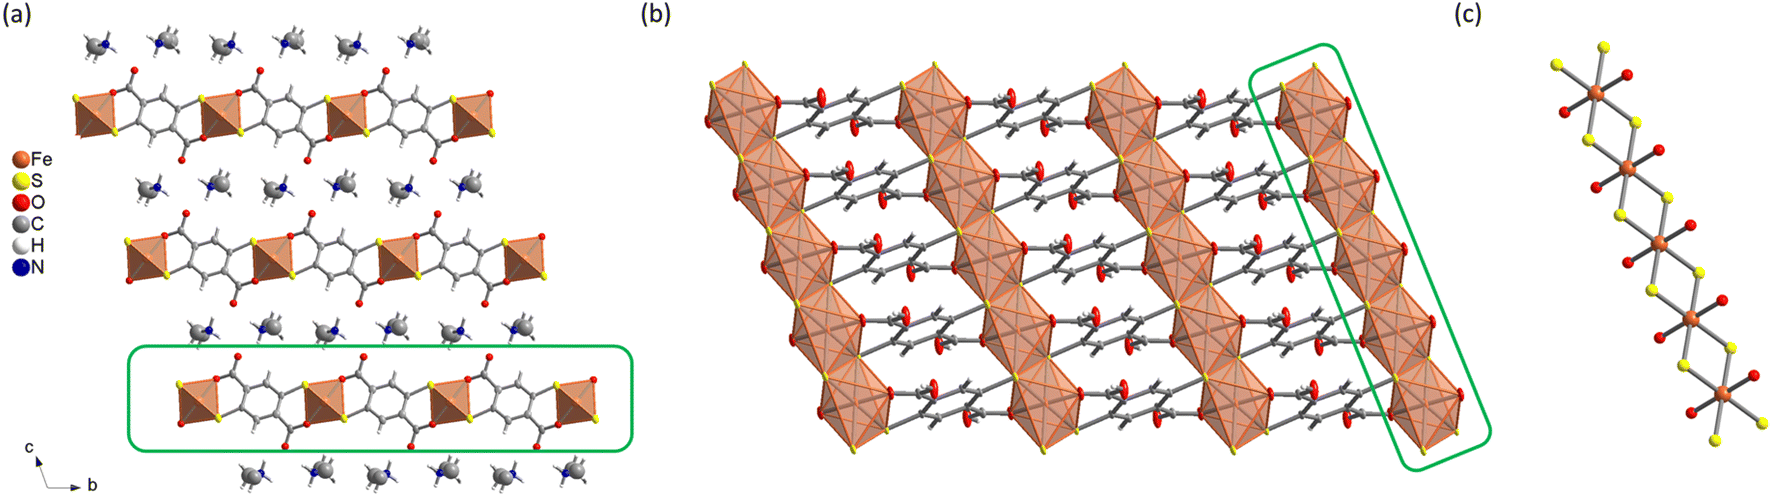
The reactivity of H4DSBDC with different Fe(III) sources under solvothermal conditions was investigated using the high-throughput setup developed by N. Stock,40 which allows a rapid and systematic investigation over a wide range of synthetic conditions (e.g. solvents, concentration, linker/metal ratio, presence of mineralizing agents, etc.) saving time and resources. Attempts were carried out in various solvents including water, alcohols, N,N-dimethylformamide (DMF) and polar green solvents such as propylene carbonate and γ-valerolactone. Poorly crystalline solids were obtained in water, while among the organic solvents, only DMF yielded crystalline phases above 120 °C. These phases were observed with a variety of iron precursors (iron(III) chloride hexahydrate, iron(III) perchlorate hydrate, iron(III) acetylacetonate, and iron(0)), but the best crystallinity was always achieved with FeCl3·6H2O. Note that in DMF, the reaction of Fe(III) with H4DSBDC is almost immediate as evidenced by the change of the colour of the solution from yellow to dark green immediately after mixing the ligand and the metallic salt (see Fig. S19†). This dark colour is very likely associated with the formation of Fe–S bonds leading to a strong ligand-to-metal charge transfer, as later confirmed by the structural analysis. This suggests that the addition of a base is not mandatory to drive the formation of such a bond. The addition of alkaline (Na, K) hydroxide indeed gave rise to the same colour change, but to a different final product. The same phases could be obtained by replacing the hydroxide by chloride, although with a limited reproducibility. Eventually, using FeCl3·6H2O in DMF in the temperature range of 150–180 °C with and without a base (NaOH or KOH), three distinct crystalline phases, were isolated in a good yield (>75%, see the Experimental section). The synthesis conditions were then up-scaled in 23 mL reactors for full characterization. As shown in Fig. S1,† their PXRD patterns present strong similarities, suggesting that all compounds are structurally closely related. Among the three compounds, only the one prepared in the absence of base was obtained in the form of single crystals with sufficient size (∼30 μm) and quality for SCXRD analysis. This solid, formulated (DMA){Fe(DSBDC)} with DMA = dimethylammonium, crystallizes in the triclinic P![[1 with combining macron]](https://www.rsc.org/images/entities/char_0031_0304.gif) space group (no. 2) with the cell parameters summarized in Table 1. Rietveld analysis of the PXRD data confirmed that the structural model obtained from SCXRD is representative of the polycrystalline sample (Fig. S2†). The asymmetric unit consists of one Fe atom on an inversion centre, half a DSBDC ligand and half a DMA in general position. (DMA){Fe(DSBDC)} features a non-porous structure of stacked {Fe(DSBDC)}n layers. Each layer is composed of chains of Fe and organic ligand DSBDC (Fig. 1b). The Fe ion is chelated by two DSBDC ligands through one S atom and one O atom (see Fig. 1a), and two additional S atoms coming from two other DSBDC ligands, defining a compressed octahedral environment. Each S atom is then bound to two Fe ions, leading to the formation of chains of edge-sharing FeS4O2 octahedra running along the a-axis (Fig. 1c). These chains are bound through the organic ligands to define layers parallel to the a, b plane (Fig. 1b).
space group (no. 2) with the cell parameters summarized in Table 1. Rietveld analysis of the PXRD data confirmed that the structural model obtained from SCXRD is representative of the polycrystalline sample (Fig. S2†). The asymmetric unit consists of one Fe atom on an inversion centre, half a DSBDC ligand and half a DMA in general position. (DMA){Fe(DSBDC)} features a non-porous structure of stacked {Fe(DSBDC)}n layers. Each layer is composed of chains of Fe and organic ligand DSBDC (Fig. 1b). The Fe ion is chelated by two DSBDC ligands through one S atom and one O atom (see Fig. 1a), and two additional S atoms coming from two other DSBDC ligands, defining a compressed octahedral environment. Each S atom is then bound to two Fe ions, leading to the formation of chains of edge-sharing FeS4O2 octahedra running along the a-axis (Fig. 1c). These chains are bound through the organic ligands to define layers parallel to the a, b plane (Fig. 1b).
| Compound | (DMA){Fe(DSBDC)} | Na{Fe(DSBDC)}·2.5H2O | K{Fe(DSBDC)}·nH2O | Na{Fe(DSBDC)} |
|---|---|---|---|---|
| Formula | FeC10H10NO4S2 | FeNaC8H7O6.5S2 | FeKC8H2+2nO4+nS2 | FeNaC8H2O4S2 |
| Crystal sys. | Triclinic | Triclinic | Triclinic | Triclinic |
| S.G. |
P |
P |
P |
P |
| a/Å | 3.5583(4) | 3.5487(1) | 3.5796(2) | 3.55430(4) |
| b/Å | 8.598(2) | 8.5445(2) | 8.6087(5) | 8.5345(1) |
| c/Å | 10.405(2) | 10.0485(2) | 10.3691(5) | 10.2606(1) |
| α/° | 109.90(2) | 109.249(2) | 114.426(4) | 128.8186(7) |
| β/° | 92.47(1) | 100.613(2) | 98.32(1) | 95.899(1) |
| γ/° | 91.71(1) | 90.723(2) | 92.065(9) | 91.179(2) |
| V/Å3 | 298.71(8) | 281.85(2) | 286.23(3) | 239.763(6) |
| M 20 | 66 | 18 | 124 | |
| Z | 1 | 1 | 1 | 1 |
 | ||
| Fig. 1 Structure of (DMA){Fe(DSBDC)}: (a) view along the a axis; (b) {Fe(DSBDC)}n layer; (c) {FeS2O2}n chain. | ||
The DSBDC ligand is almost planar (dihedral angle between the phenyl ring and the carboxylate <25°), with both O atoms free of any Fe–O bond pointing toward the interlayer spacing. The ligands are stacked parallel along the direction of the chain (a axis), with short intermolecular C⋯C distances (3.34 Å). Finally, DMA cations, whose presence was confirmed by liquid 1H-NMR of the degraded material in NaOD (Fig. S9†) filled the interlayer spacing. The DMA cations interact with the pending O atoms through hydrogen bonds (dN⋯O = 2.67(5) Å, dH⋯O = 1.80 Å), suggesting that the ligand is fully deprotonated. Fe–S and Fe–O bond distances are summarized in Table 2. Bond-valence calculations41 (BVC, Table 2) suggest the charge of the Fe atom is +3, in agreement with the formulation (DMA){Fe(DSBDC)}. This was ultimately confirmed by 57Fe Mössbauer spectroscopy (see below).
| Compound | Bond | Distance (Å) | Bond valence | Fe ox. state | |
|---|---|---|---|---|---|
| (DMA){Fe(DSBDC)} | Fe–S (x2) | 2.435(4) | 0.48 | 2.86 | +3 |
| Fe–S (x2) | 2.559(4) | 0.34 | |||
| Fe–O (x2) | 1.940(7) | 0.61 | |||
| Na{Fe(DSBDC)}·2.5H2O | Fe–S (x2) | 2.432(2) | 0.48 | 2.89 | +3 |
| Fe–S (x2) | 2.542(2) | 0.36 | |||
| Fe–O (x2) | 1.941(4) | 0.61 | |||
| Na{Fe(DSBDC)} | Fe–S (x2) | 2.453(2) | 0.45 | 2.70 | +3 |
| Fe–S (x2) | 2.547(2) | 0.35 | |||
| Fe–O (x2) | 1.983(3) | 0.55 | |||
| Fe2(DSBDC)(DMF)2 (ref. 18) | Fe–S | 2.446(2) | 0.46 | 2.28 | +2 |
| Fe–S | 2.444(2) | 0.46 | |||
| Fe–O | 2.064(4) | 0.41 | |||
| Fe–O | 2.055(3) | 0.42 | |||
| Fe–O | 2.176(6) | 0.30 | |||
| Fe–O | 2.297(5) | 0.22 | |||
| Fe(6-Hmna)2 (ref. 22) | Fe–S (x2) | 2.549(1) | 2.24 | +2 | |
| Fe–S (x2) | 2.643(2) | ||||
| Fe–O (x2) | 1.992(2) |
As the formation of dimethylamine (and further DMA) arises from the degradation of DMF, high temperature was necessary to produce this solid with a good yield. Upon the addition of NaOH, another phase was obtained at a lower temperature (150 °C). This solid, formulated as Na{Fe(DSBDC)}·2.5H2O was obtained as microcrystalline needles (Fig. S10†), which hampered the structural elucidation by SCXRD. Synchrotron PXRD data were used to determine the crystal structure (see Table 1, as well as Fig. S3 and Table S2† for the final Rietveld refinement and crystallographic parameters, respectively). Unit-cell parameters were found to be similar to those of (DMA){Fe(DSBDC)}, although with a smaller c parameter.
Structure determination further confirms the close relationship between both compounds. Na{Fe(DSBDC)}·2.5H2O indeed consists of {Fe(DSBDC)}n layers almost identical to those found in (DMA){Fe(DSBDC)} (see Table 2 for Fe–S and Fe–O bond distances). The main difference arises from the interlayer spacing. As shown in Fig. 2a, Na ions, present with a Na:Fe:DSBDC ratio close to 1:1:1 as confirmed by EDS analysis (see Table S4†), are located in the interlayer spacing. Each Na+ adopts a distorted octahedral environment with four O atoms in the equatorial position arising from the carboxylate groups of four distinct DSBDC ligands (O2), and two water molecules (Ow1) on the axial positions (see Table S3† for Na–O distances). This defines {NaO4(H2O)2}n chains made of edge-sharing NaO6 octahedra running parallel to the a-axis ultimately affording a 3-D network. Again, BVC suggests that Fe adopts a +3 oxidation state, in line with the stoichiometry Na:Fe:DSBDC = 1:1:1. This structure is analogous to that of Ni2(DFDMT), (DFDMT = 2,5-difluoro-3,6-dimercaptoterephthalate), which contains exclusively M(II) both in the intralayer and interlayer cation sites.23 As shown in Fig. 2a, Na{Fe(DSBDC)}·2.5H2O presents small 1-D channels running along the a axis (∼3 × 5 Å2 considering the van der Waals radii) which contain both water molecules interacting with Na and free water molecules (two and a half per formula unit, respectively). The accessibility of these channels will be discussed later.
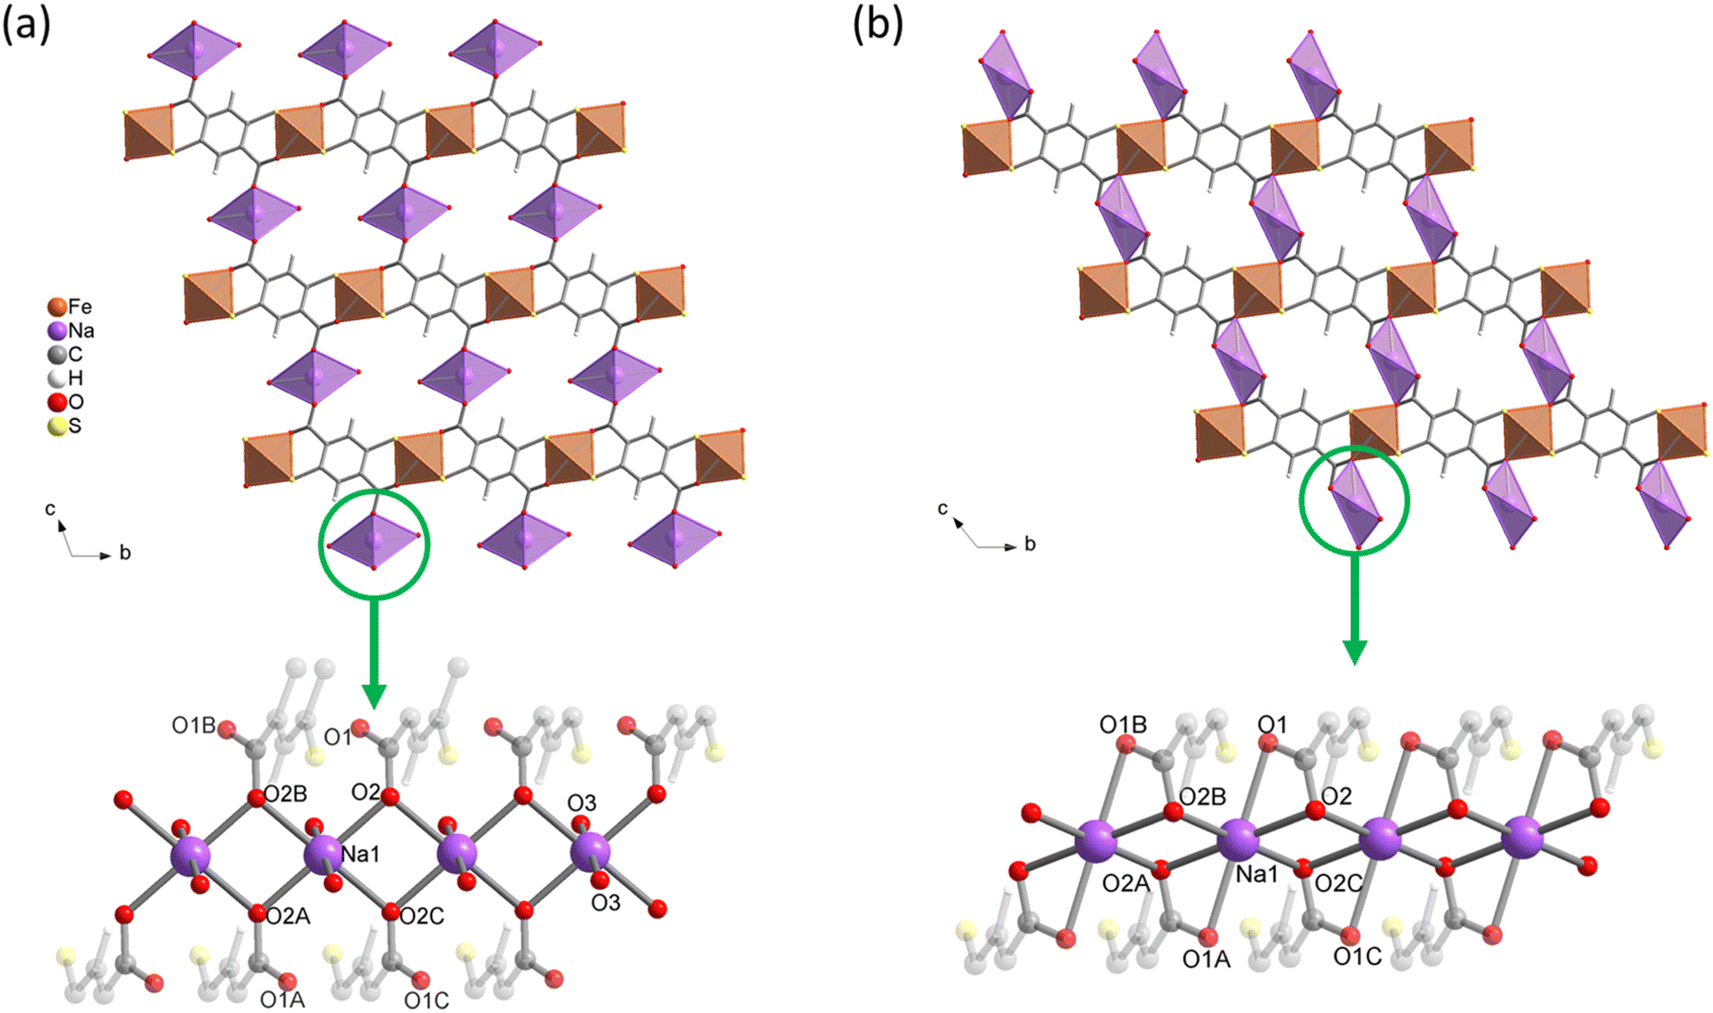 | ||
| Fig. 2 Crystal structures of (a) Na{Fe(DSBDC)}·2.5H2O and (b) Na{Fe(DSBDC)}. Top: view along the a-axis; bottom: view of the interlayer {NaO4}n chain. | ||
It is worth noting that a closely related material was obtained when replacing NaOH with KOH in the synthesis. Needle-like microcrystals were again obtained (Fig. S10†), and the PXRD pattern and the unit-cell parameters deduced from the whole structureless powder pattern fitting (Fig. S4†) are very similar to that of Na{Fe(DSBDC)}·2.5H2O (Table 1), while EDS analysis confirmed a K:Fe:DSBDC ratio equal to 1:1:1 (Table S4†), suggesting that this material can be safely formulated as K{Fe(DSBDC)}·nH2O.
The FTIR spectra of the three compounds are shown in Fig. S11† and the assigned bands are summarized in Table S5.† The intense C![[double bond, length as m-dash]](https://www.rsc.org/images/entities/char_e001.gif) O vibration band observed at 1678 cm−1 in the free ligand H4DSBDC is not visible anymore, whereas a new band attributed to the asymmetric stretching mode of the carboxylate is detected at 1563, 1580 and 1565 cm−1 for (DMA){Fe(DSBDC)}, Na{Fe(DSBDC)}·2.5H2O and K{Fe(DSBDC)}·nH2O, respectively. Also, the S–H stretching band at 2560 cm−1 present in H4DSBDC totally disappeared in all the materials, supporting the full deprotonation of the ligand, in agreement with the formulation issued from XRD analysis. Eventually, the chemical composition of all solids was corroborated by elemental analysis (C, H, S) and ICP-AES (Fe, Na, K), confirming that each compound is prepared in a pure form (see the ESI†).
O vibration band observed at 1678 cm−1 in the free ligand H4DSBDC is not visible anymore, whereas a new band attributed to the asymmetric stretching mode of the carboxylate is detected at 1563, 1580 and 1565 cm−1 for (DMA){Fe(DSBDC)}, Na{Fe(DSBDC)}·2.5H2O and K{Fe(DSBDC)}·nH2O, respectively. Also, the S–H stretching band at 2560 cm−1 present in H4DSBDC totally disappeared in all the materials, supporting the full deprotonation of the ligand, in agreement with the formulation issued from XRD analysis. Eventually, the chemical composition of all solids was corroborated by elemental analysis (C, H, S) and ICP-AES (Fe, Na, K), confirming that each compound is prepared in a pure form (see the ESI†).
57Fe Mössbauer spectroscopy experiments were carried out to confirm the oxidation state of Fe in both (DMA){Fe(DSBDC)} and Na{Fe(DSBDC)}·2.5H2O. The spectra collected at room temperature are shown in Fig. 3. All the observed signals can be fitted using appropriate combinations of quadrupole doublets, and the resulting isomer shift (δ), quadrupole splitting (Δ), and relative resonance area are summarised in Table 3. One doublet with δ = 0.48 mm s−1 is observed for (DMA){Fe(DSBDC)}, which is consistent with the presence of Fe(III) in a high-spin (HS) state.42,43 The presence of trivalent iron is confirmed by the value of the hyperfine magnetic fields found in the spectrum measured at low temperature, showing magnetic ordering (see later and the ESI†). The high Δ value also indicates a strongly distorted coordination sphere, in line with the geometry of the heteroleptic FeS4O2 octahedra identified by XRD. In Na{Fe(DSBDC)}·2.5H2O, two doublets with δ = 0.50 and 0.37 mm s−1 are detected. The former corresponds to the major HS-Fe3+S4O2 local environment while the latter is also associated with HS Fe(III), but likely in a more ionic, possibly FeO6, environment.44 Possibly, this FeO6 environment could come from some defects in the structure where the Fe3+ cations are located in the interlayer positions, at the position occupied by the Na ions, and surrounded exclusively by O atoms. This analysis eventually confirms the exclusive presence of Fe(III) in (DMA){Fe(DSBDC)} and Na{Fe(DSBDC)}·2.5H2O, and hence the possibility of building up highly crystalline MOFs based on Fe(III)–S bonds. It also confirms that the formation of these materials does not require the addition of a base, at least when working in DMF. Note here that both structures were also analysed with the machine learning tool oxiMACHINE developed by Smit et al. to assign the oxidation state of cations in MOFs.45 OxiMACHINE wrongly assigned a +II oxidation state in both cases but with a very low confidence rate. This likely arises from the fact that the training dataset available to date is rather small, as discussed in the Introduction.
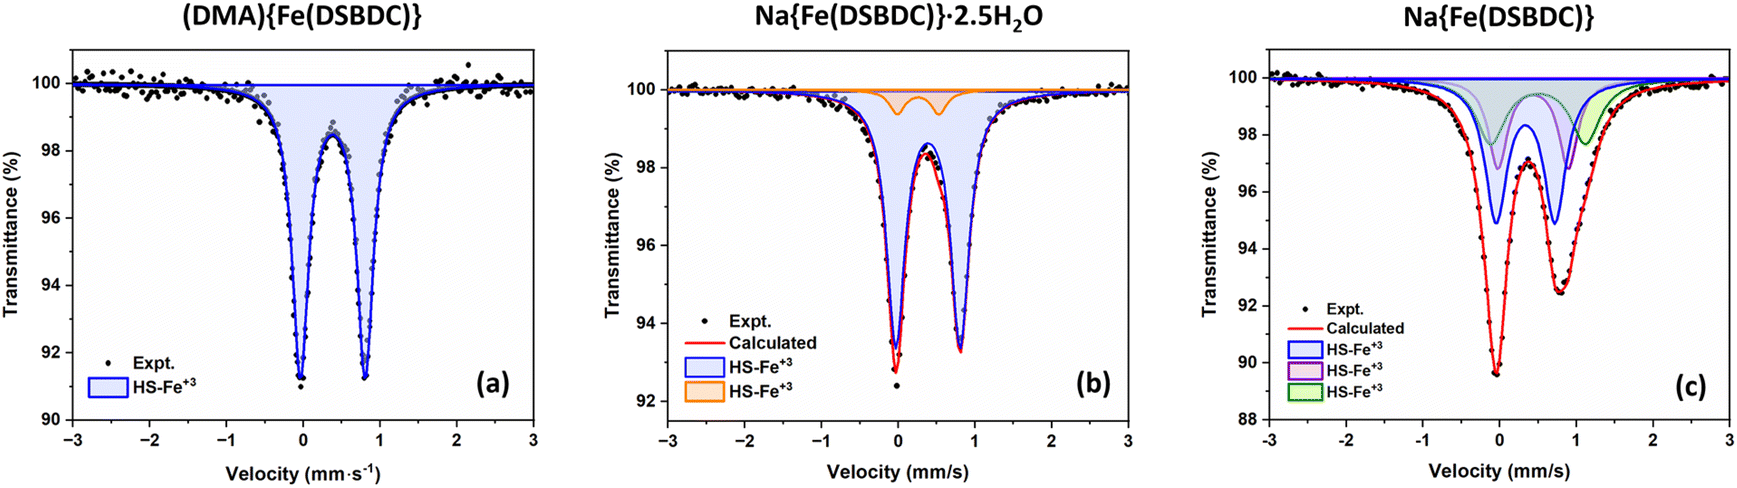 | ||
| Fig. 3 Mössbauer spectra of (a) (DMA){Fe(DSBDC)}, (b) Na{Fe(DSBDC)}·2.5H2O and (c) Na{Fe(DSBDC)} collected at 298 K. | ||
| Compound | δ (mm s−1) | Δ (mm s−1) | Area (%) | Assignment |
|---|---|---|---|---|
| (DMA){Fe(DSBDC)} | 0.49 | 0.84 | 100 | HS-Fe3+S4O2 |
| Na{Fe(DSBDC)}·2.5H2O | 0.50 | 0.84 | 93 | HS-Fe3+S4O2 |
| 0.37 | 0.56 | 7 | HS-Fe3+O6 | |
| Na{Fe(DSBDC)} | 0.45 | 0.77 | 46 | HS-Fe3+S4O2 |
| 0.61 | 1.24 | 28 | HS-Fe3+S4O2 | |
| 0.55 | 0.92 | 26 | HS-Fe3+S4O2 |
The coordination environment of the Fe cation and the chain-like motif can be compared with that of related compounds (see Table 2 for Fe–S/O distances). In the CPO-27 analogue formulated Fe2(DSBDC)(DMF)2,18 the coordination environment is different (FeS2O4 instead of FeS4O2 octahedra). Although in both cases inorganic chains are built from edge-sharing octahedra, the way they are connected also differs, with the formation of a straight chain vs. a helical one in {Fe(DSBDC)} and Fe2(DSBDC)(DMF)2, respectively, giving rise to shorter Fe–Fe distances in the CPO-27 analogue (3.19 vs. 3.55 Å). More interestingly, the coordination environment of Fe and the chain-like motif in {Fe(DSBDC)} are nearly identical to those found in the iron-thiolate-carboxylate 1-D coordination polymer [Fe(6-Hmna)2] (6-H2mna = 6-mercaptonicotinic acid) reported by Du et al.22 This compound is indeed built of similar edge-sharing FeS4O2 polyhedra, with slightly longer Fe–S and Fe–O bond distances (see Table 2), and thus, longer Fe⋯Fe distances (3.83 vs. 3.55 Å). This fact could be easily rationalized considering that Fe adopts a +2 oxidation state in [Fe(6-Hmna)2], which possesses a larger ionic radius than Fe(III). This suggests that the {FeS4O2} chains, and thus the {Fe(DSBDC)} layers, can be reduced without any massive structural rearrangement. This is of high interest for their use as active materials for electrochemical energy storage, as discussed later.
3.2 Thermal and sorption behaviour
The thermal behaviour of the three solids was evaluated by TGA and VTPXRD, both carried out under air (Fig. S12–S14† and 4, respectively), with the aim of evaluating their thermal stability and the conditions of formation of the derived anhydrous phases. The thermal behaviour of these materials was found to depend on the nature of the interlayer cation. Negligible weight loss (<3%) was detected upon heating (DMA){Fe(DSBDC)} to ∼220 °C. Above this temperature, a ∼10% weight loss was recorded, immediately followed by a second one spanning from ∼300 °C to ∼440 °C (50%) and associated with a loss of ∼50%. The first weight loss is attributed to the departure of DMA and the second one to the combustion of the ligand. Eventually, a last weight loss is detected at ∼550 °C. Due to the presence of sulfur in the structure, the final residue of the TGA consists of a mixture of oxides and sulfates, hampering a quantitative estimation of the final composition. VTPXRD data (Fig. 4a) show almost no change in the structure from 30 up to 180 °C, while the material gets amorphized above this temperature. When compared with the TGA, the amorphization is likely associated with the departure of the DMA.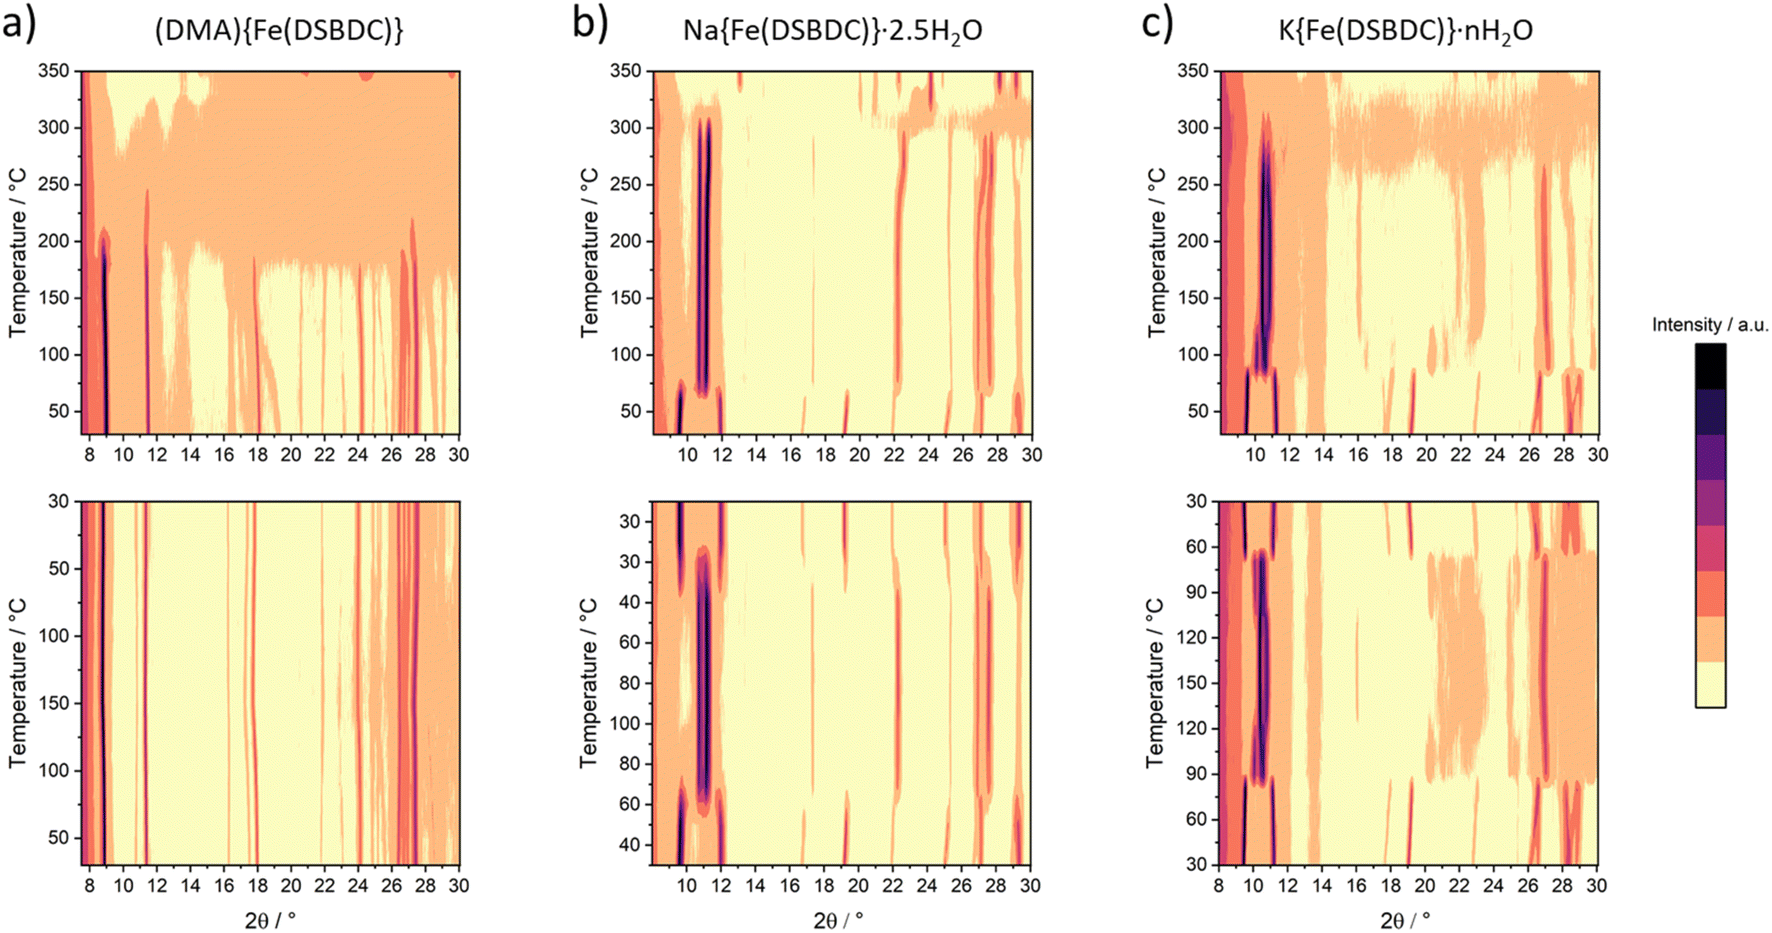 | ||
| Fig. 4 VTPXRD analysis of (a) (DMA){Fe(DSBDC)}, (b) Na{Fe(DSBDC)}·2.5H2O and (c) K{Fe(DSBDC)}·nH2O carried out under air. Top: evaluation of the thermal stability (heating procedure: 30 to 350 °C with a 10 °C step); bottom: evaluation of the reversibility of the structural transformation (heating procedure: 30 to 100–150 to 30 °C with a 10 °C step). | ||
For Na{Fe(DSBDC)}·2.5H2O, the behaviour strongly differs. The TG curve presents an initial weight loss of ∼11% below 100 °C, with two distinct slopes attributed to the stepwise departure of free and bound water molecules (Fig. S13†). After that, two additional weight losses can be observed at 350 and 600 °C corresponding to the combustion of the linker and the partial oxidation of the combustion products. Similarly to (DMA){Fe(DSBDC)}, the powder recovered after the combustion was a mixture of several phases and highly dependent on the calcination temperature (Fig. S7 and S8†). VTPXRD (Fig. 4b) showed a phase transition at 70 °C associated with the departure of water molecules and the formation of Na{Fe(DSBDC)}, whose structure is different from the hydrated one. At 320 °C the amorphization of the material occurred and crystallization of various sulfates and oxides (Na3Fe(SO4)3 and Fe2O3) was observed at ∼350 °C (Fig. S7†). Finally, the behaviour of K{Fe(DSBDC)}·nH2O is similar to that of the Na analogue. The TG curve presents an initial weight loss of ∼12% (Fig. S14†), attributed to the loss of water molecules followed by the combustion of the linker above 350 °C. VTPXRD (Fig. 4c) showed that the water departure is associated with a structure transition and that the PXRD pattern of the dried form is similar to that of the high-temperature form of the Na analogue, with only a slight shift of the Bragg peaks to lower angles, in line with the larger ionic radius of K vs. Na (Fig. S6†). These analyses then suggested that the dried form A{Fe(DSBDC)} (A = Na, K) can be isolated and that its structure is different from that of the hydrated phase. Na{Fe(DSBDC)} was then prepared by heating the hydrated phase under vacuum at 100 °C and stored in the absence of humidity. Its crystal structure was elucidated thanks to synchrotron PXRD data (see Fig. S5 and Table S2† for the final Rietveld plot and crystallographic parameters, respectively). The unit-cell parameters are directly related to that of the hydrated phases: a and b, corresponding to the intrachain and interchain Fe–Fe distances in the layer which are unaffected by the dehydration (variation < 1%), while c, α and β evolve, in line with the reduction of the cell volume of ∼15% (Table 1). The {Fe(DSBDC)}n layers are indeed not disturbed by the phase transition, with Fe–S and Fe–O bonds distances remaining close to that found in the hydrated phase and consistent with the +3 oxidation state for Fe (Table 2). On the opposite, the surrounding of the Na was dramatically affected. The departure of the bound water molecule (2 per Na, see Fig. 2a) is accompanied by a shift of the layers with respect to each other and a decrease in the interlayer distance (Fig. 2b). As a result of this transformation, Na+ cations remain in distorted octahedral coordination, with four symmetry-related oxygen atoms (O2) in the equatorial plane and two others in axial positions (O1), all coming from the carboxylate groups of the ligands (Fig. 2b, bottom). This structural modification is accompanied by a slight modification of the Na–O bond distances, as detailed in Table S3.† Mössbauer spectroscopy confirms that the oxidation state of Fe does not change during the dehydration. While three doublets are required to properly fit the spectrum (Fig. 3c), the deduced isomer shifts are all consistent with the presence of HS Fe(III) exclusively (Table 3). The existence of three doublets could be due to a distribution in the Fe–O/S bond length of the FeS4O2 local environment, induced by the structural reorganization during dehydration.
This change in the local environment of Na is supported by 23Na MAS NMR experiments (Fig. 5). In the spectrum of the hydrated phase, a single, sharp signal with its spinning sidebands is observed. This sharp signal suggests that the Na+ ions are rather mobile in the interlayer space. Upon dehydration, the signal becomes broadened. This broadening arises from the reduction of the distance between Na+ and the paramagnetic Fe(III) from 5.41 to 4.13 Å upon dehydration and confirms that all the Na+ ions are affected by the transformation. In addition, a significant shift from 65 to 120 ppm can be observed during the dehydration process, both assigned to hyperfine shifts due to the presence of paramagnetic Fe(III). While the number of Fe connected through chemical bonds to Na does not change during the dehydration process, pathways for unpaired electron spin density transfer through Fe 3d, O 2p and Na 1s orbital overlapping, change quite significantly. In the hydrated compounds, Fe and Na are connected by the organic ligand and 4 chemical bonds while in the anhydrous compound, Fe and Na share an oxygen from their respective coordination sphere leading to a more efficient electron spin density transfer and thus a larger hyperfine shift.
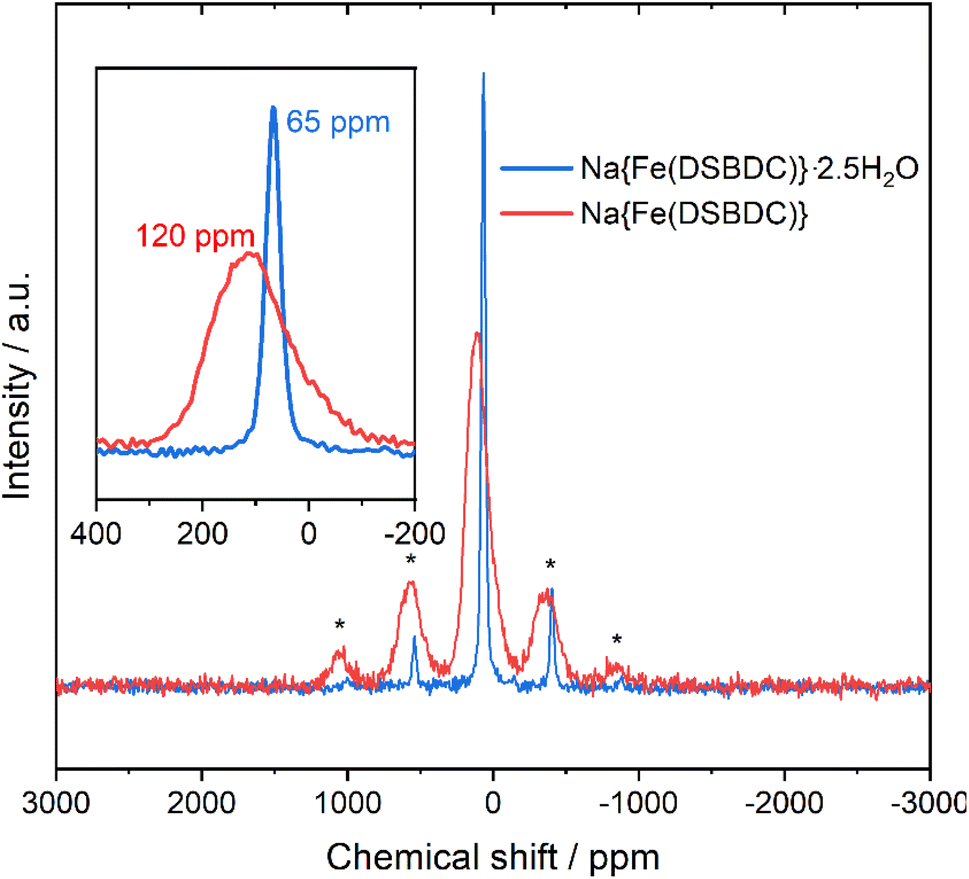 | ||
| Fig. 5 Comparison of the 23Na MAS NMR spectra of Na{Fe(DSBDC)}·2.5H2O (blue) and Na{Fe(DSBDC)} (red). * = Spinning sidebands). | ||
The reversibility of the dehydration process of A{Fe(DSBDC)}·2.5H2O (A = Na, K) was evaluated by VTPXRD. Na{Fe(DSBDC)}·2.5H2O (as well as K{Fe(DSBDC)}·nH2O) was subjected to the thermal cycle 30 °C → 100 °C → 30 °C. As shown in Fig. 4 (bottom), the shift of the Bragg peaks associated with the dehydration is fully reversible upon cooling. This observation indicates that water is readily re-adsorbed and thus that the interlayer spacing is accessible at least to certain guests. Nevertheless, Na{Fe(DSBDC)} showed no nitrogen uptake in sorption experiments carried out at 77 K, suggesting that the resulting channels are too small to accommodate N2, and that the interactions between N2 molecules and the framework are too weak to induce the structural transition toward a more open structure.
As evidenced by the VTPXRD experiments, all solids were found to be stable in air. Their chemical stability was also evaluated by suspending the compounds in a selection of polar solvents (DMF, ethanol and water) for 10 days at room temperature at a concentration of 1 mg mL−1 (see the ESI† for further details). The structural integrity of the materials was then evaluated by PXRD and FTIR (Fig. S15–S17†), and visual inspection of the supernatants. For (DMA){Fe(DSBDC)} (Fig. S15†), no changes were observed in any of the techniques, suggesting a rather high stability. For both K{Fe(DSBDC)}·nH2O and Na{Fe(DSBDC)}·2.5H2O, no change was detected in organic solvents. In water, a slight coloration of the supernatants was detected, suggesting a partial dissolution of the solid (∼5 wt% from control weighting), together with a slight shift of the carboxylate stretching modes on the IR spectra (Fig. S16 and S17†). Nevertheless, the PXRD patterns were almost unaffected, suggesting that the degradation is rather limited. On the whole, all {Fe(DSBDC)}n-based solids are relatively chemically stable, more than the related Fe2(DSBDC)(DMF)2, which is in line with the higher chemical stability of Fe(III) vs. Fe(II) MOFs.34
3.3 Optical, electronic and magnetic properties
The optoelectronic properties of the solids were evaluated by solid UV-Vis reflectance spectroscopy. The spectra are shown in Fig. S18.† They present a similar shape for the three materials, with a strong absorption spanning the entire visible range. This is in good agreement with the black colour of the powder (Fig. S19†), and likely the result of the strong ligand-to-metal charge transfer occurring in conjugated thiolate-iron complexes.The magnetic properties of Na{Fe(DSBDC)}·2.5H2O were studied by SQUID magnetometry. The temperature-dependent magnetic susceptibility χ(T) is displayed in Fig. 6. χ(T) is characterized by a broad maximum centred at ≈92 K, suggesting short-range antiferromagnetic (AF) ordering. Such a broad maximum is expected to occur above the long-range ordering temperature (TN) in low-dimensional AF compounds. A sharp maximum in the d(χT)/dT versus T curve (shown in Fig. S20†) indicates a Néel temperature TN ≈ 72 K. Note that the existence of a magnetic ordering below 72 K is in agreement with the low-temperature Mössbauer experiment, where two sextuplets characteristic of an AF magnetic ordering dominate the spectrum at 7 K (Fig. S21†). In the high-temperature regime, T > 250 K, the susceptibility follows the Curie–Weiss law, χ(T) = C/T − θ. The Curie–Weiss fit to the 1/χ(T) data shown in Fig. 6 yields C ≈ 4.68 cm3 K mol−1 and θ ≈ −49 K. The effective paramagnetic moment calculated from the Curie constant C is 6.1 μB/Fe, in reasonable agreement with the spin-only value 5.9 μB/Fe for high-spin S = 5/2 Fe3+ ions. The negative value of the Weiss temperature θ indicates that the dominant spin-exchange interactions between Fe3+ ions are AF.
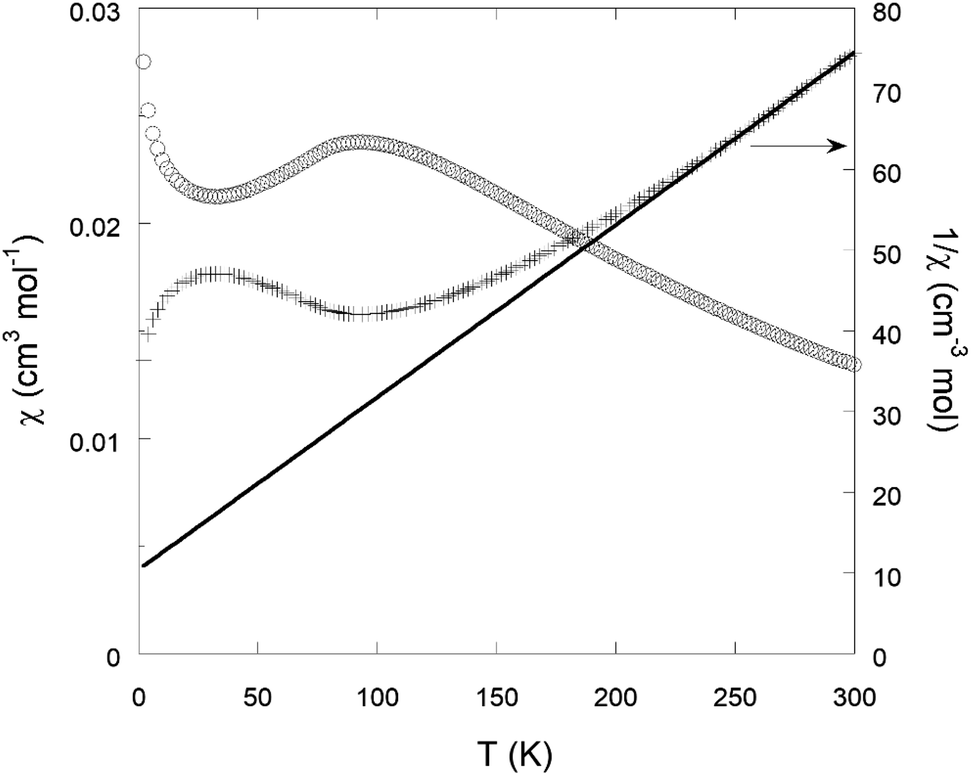 | ||
| Fig. 6 Magnetic susceptibility χ of a Na{Fe(DSBDC)}·2.5H2O sample as a function of temperature T in an applied field of 1000 Oe (open circles; left scale). The inverse susceptibility 1/χ(Τ) is visualized by plus sign symbols (right scale). The solid line is a Curie–Weiss fit in the temperature range of 250–300 K (see the text). | ||
Eventually, the redox activity of Na{Fe(DSBDC)} was studied, with the aim of evaluating its potential as a positive electrode material for Li-, Na- and K-ion batteries. As commonly done in the field, the evaluation was done on the anhydrous phase, as water could give rise to irreversible parasitic reactions with the alkali and the fluorinated anions. Layered solids bearing redox-active centres (either organic or inorganic) have indeed been shown to be very suitable active materials for electrochemical energy storage, as the interlayer spacing facilitates the ion intercalation/deintercalation processes associated with the redox events. The pristine material is in its oxidized form (Fe(III)) but contains Na cations. Hence, the expected electrochemical process involving the iron (reduction) requests the intercalation of additional alkali ions to maintain the charge balance, while the removal of the pristine sodium would require an oxidation necessarily centred on the organic moieties. At this stage it should be recalled that several salts and coordination polymers based on DOBDC have already demonstrated their interest as positive electrode materials for both Li- and Na-ion batteries with an electrochemical activity associated with the quinone/phenolate redox couple,46–51 but to the best of our knowledge there is currently no report on the sulphur-based analogue DSBDC. The electrochemical activity of Na{Fe(DSBDC)} was evaluated in half-cells with alkali metals as counter electrodes, under galvanostatic conditions, starting with a reduction (see the Experimental section for details). Potential vs. capacity and capacity retention curves are shown in Fig. 7–9, for Li, Na and K, respectively. For Li, the typical potential-composition cycling curve (Fig. 7a) exhibits a pseudocapacitive behaviour52,53 but with a marked hysteresis in potential between the reduction and the subsequent oxidation curves probably due to kinetic limitations. The average working potential is similar to that observed for other Fe(III)-based MOFs (e.g. MIL-53, -68, -101),54–58 and attributed to the reversible reduction of Fe(III) to Fe(II). This potential is nevertheless slightly lower than that found in purely oxygenated MOFs (2.7 vs. >2.8 V vs. Li+/Li), in line with the lower electronegativity of sulphur vs. oxygen. At the initial cycling rate (1 e− exchanged per Fe in 20 h), the reversible capacity is 53 mA h g−1, which corresponds to the reduction of ∼60% of the Fe in the structure (the theoretical capacity considering 1 e− exchanged per formula unit Na{Fe(DSBDC)} is equal to 88 mA h g−1), which is again in line with previous findings on Fe(III) MOFs (0.35 to 0.62 Fe reversibly reduced). No extra activity is detected in oxidation, suggesting that the DSBDC is inactive, at least under these experimental conditions. Finally, a rate capability cycling test was performed in order to evaluate the activity of Na{Fe(DSBDC)} at different current densities (Fig. 7b). As could be expected, upon increasing the current density, the capacity slightly decreases but still reaches 44 mA h g−1 for 1 e− exchanged per Fe in 2 h, corresponding to the reversible reduction of 50% of Fe(III). If a lower rate is again applied, the initial charge capacity is recovered, and remains stable for more than 70 cycles, evidencing the good stability of the material upon cycling.
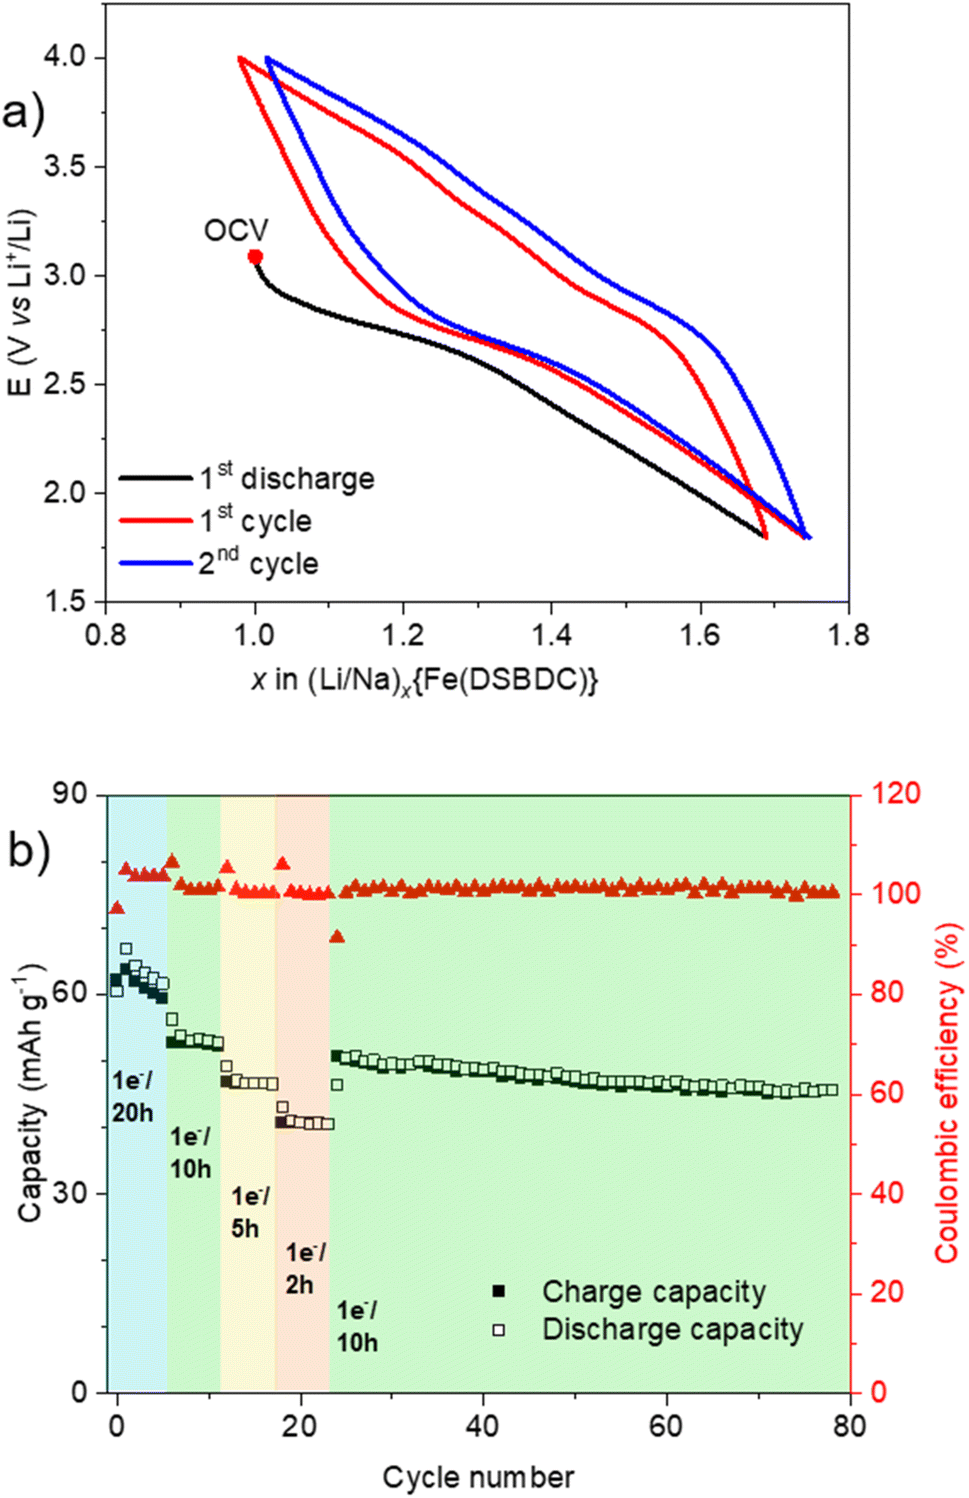 | ||
| Fig. 7 Electrochemical behaviour of Na{Fe(DSBDC)} measured in a half-cell vs. Li cycled in the voltage range of 1.8–4.0 V vs. Li+/Li. (a) Potential composition trace for the first two cycles at 1 e− exchanged per Fe in 20 h (OCV = open circuit voltage); (b) rate capability cycling test and corresponding coulombic efficiency trace. | ||
The electrochemical behaviour of Na{Fe(DSBDC)} vs. Na is similar to Li during the first reduction with a sloping plateau located at ∼2.7 V vs. Na+/Na followed by a constant decrease of the potential trace suggesting a sluggish insertion reaction in the more cathodic region (Fig. 8a). This potential value is similar to the Fe(III)/Fe(II) redox potential observed in other Fe-MOFs when cycled vs. Na.59,60 0.76 Na+ can be inserted, corresponding to the reduction of 76% of Fe(III), in the first discharge (Fig. S22a†). The subsequent cycles are better shaped compared to data recorded in the Li half-cell since the sloping plateau appears reversible upon cycling. However, the coulombic efficiency within the first 20 cycles is quite poor. Note that an unexpected capacity was detected during the first charge above 3.5 V vs. Na+/Na associated with electrolyte decomposition, and is completely irreversible (Fig. S22a†). For a cycling rate corresponding to 1 e− exchanged per Fe in 20 h, the reversible capacity reaches 60 mA h g−1, corresponding to 0.75 e− exchanged per mole of iron. This capacity moderately decreased to approximately 40 mA h g−1 when the current density is multiplied by ten, but recovered to its initial value when the rate went back to the initial value (Fig. S22b†). To reduce parasitic reactions that occur at voltages above 3.5 V vs. Na+/Na, subsequent galvanostatic cycling was performed between 3.25 and 1.5 V vs. Na+/Na at a current density corresponding to 1 e− exchanged per Fe in 10 h (Fig. 8a). The capacity decay during the first cycles is reduced, and the electrode material can still retain a reversible capacity of 40 mA h g−1 after 80 cycles (Fig. 8b).
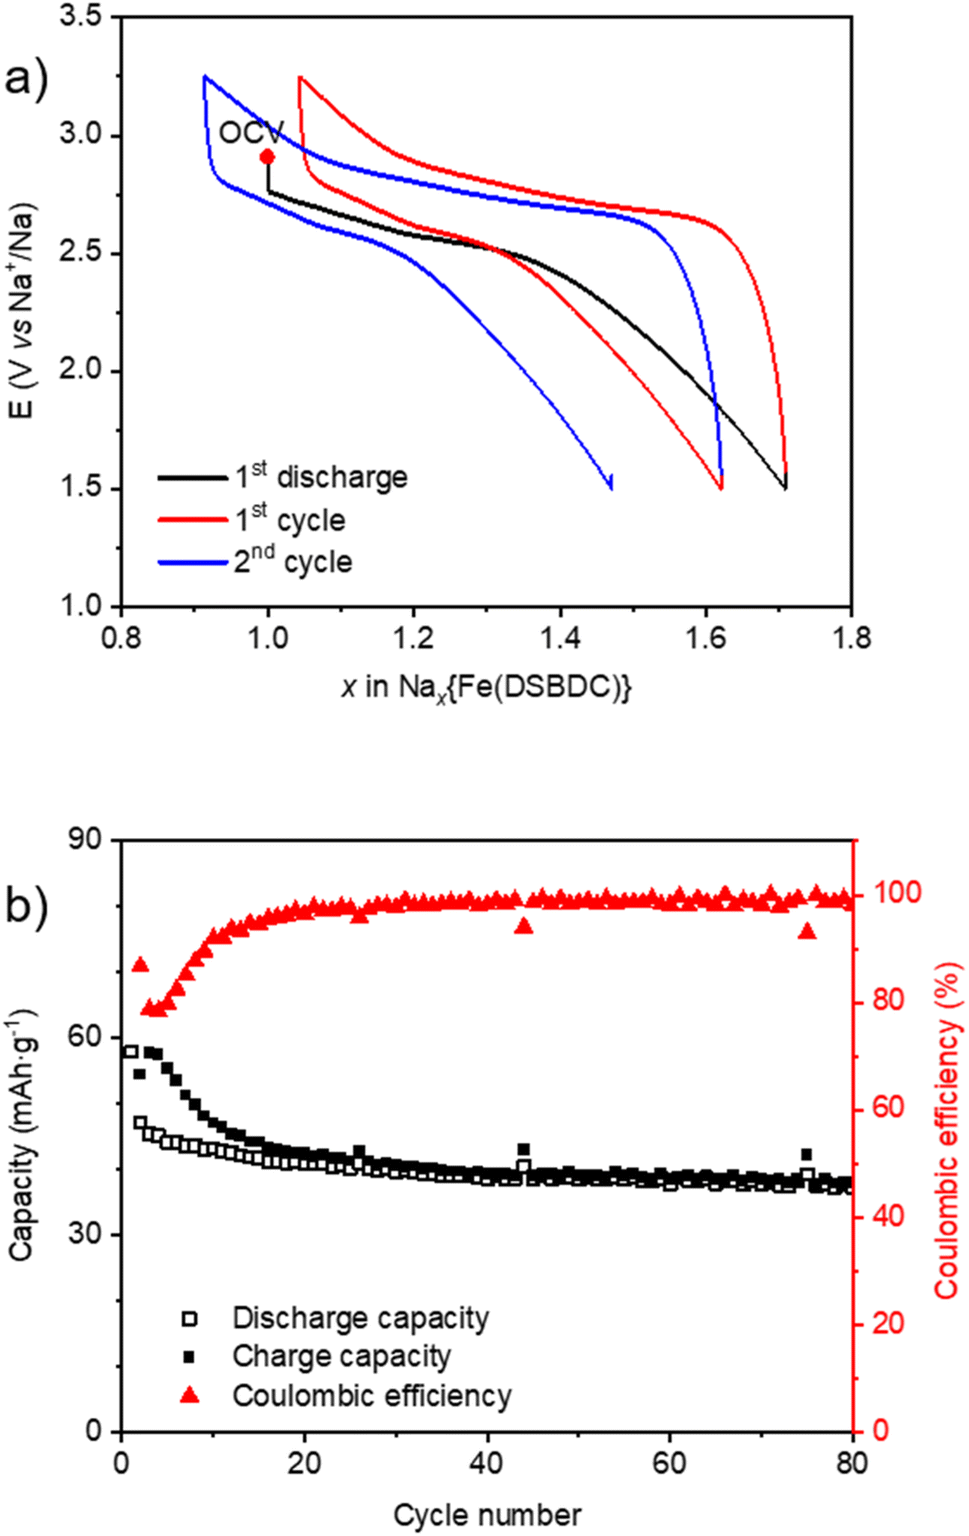 | ||
| Fig. 8 Electrochemical behaviour of Na{Fe(DSBDC)} in a half-cell vs. Na cycled in the voltage range of 1.5–3.25 V vs. Na+/Na (1 e− exchanged per Fe in 10 h). (a) Potential vs. a number of inserted/extracted Na+ in the first two cycles. (b) Corresponding capacity retention and coulombic efficiency curves upon long-term cycling. | ||
Finally, when cycled in a K half-cell, the recorded electrochemical behaviour for Na{Fe(DSBDC)} is even better, exhibiting several interesting electrochemical properties (Fig. 9). The typical first sloping plateau is still observed during the first discharge and is fully recovered during the subsequent recharge with a low polarization value. More interestingly, the second part of the cycling curve at more cathodic potentials, which was featureless in both Li and Na half-cells, reveals now a second reversible sloping plateau. 0.8 K+ can be inserted into the structure in the first discharge followed by a good recovery of 0.65 K+ in the subsequent recharge according to an overall two-step electrochemical reaction with a small polarization. To the best of our knowledge, such an electrochemical behaviour has never been reported for MOF- or DOBDC-based electrode materials for K-ion batteries (KIBs) until now. The first discharge capacity is 84 mA h g−1, and after a few stabilisation cycles, it remains stable at 86 mA h g−1 at least up to 75 cycles. These results demonstrate the stability of the host network upon long-term cycling as well as its particular compatibility with K+.
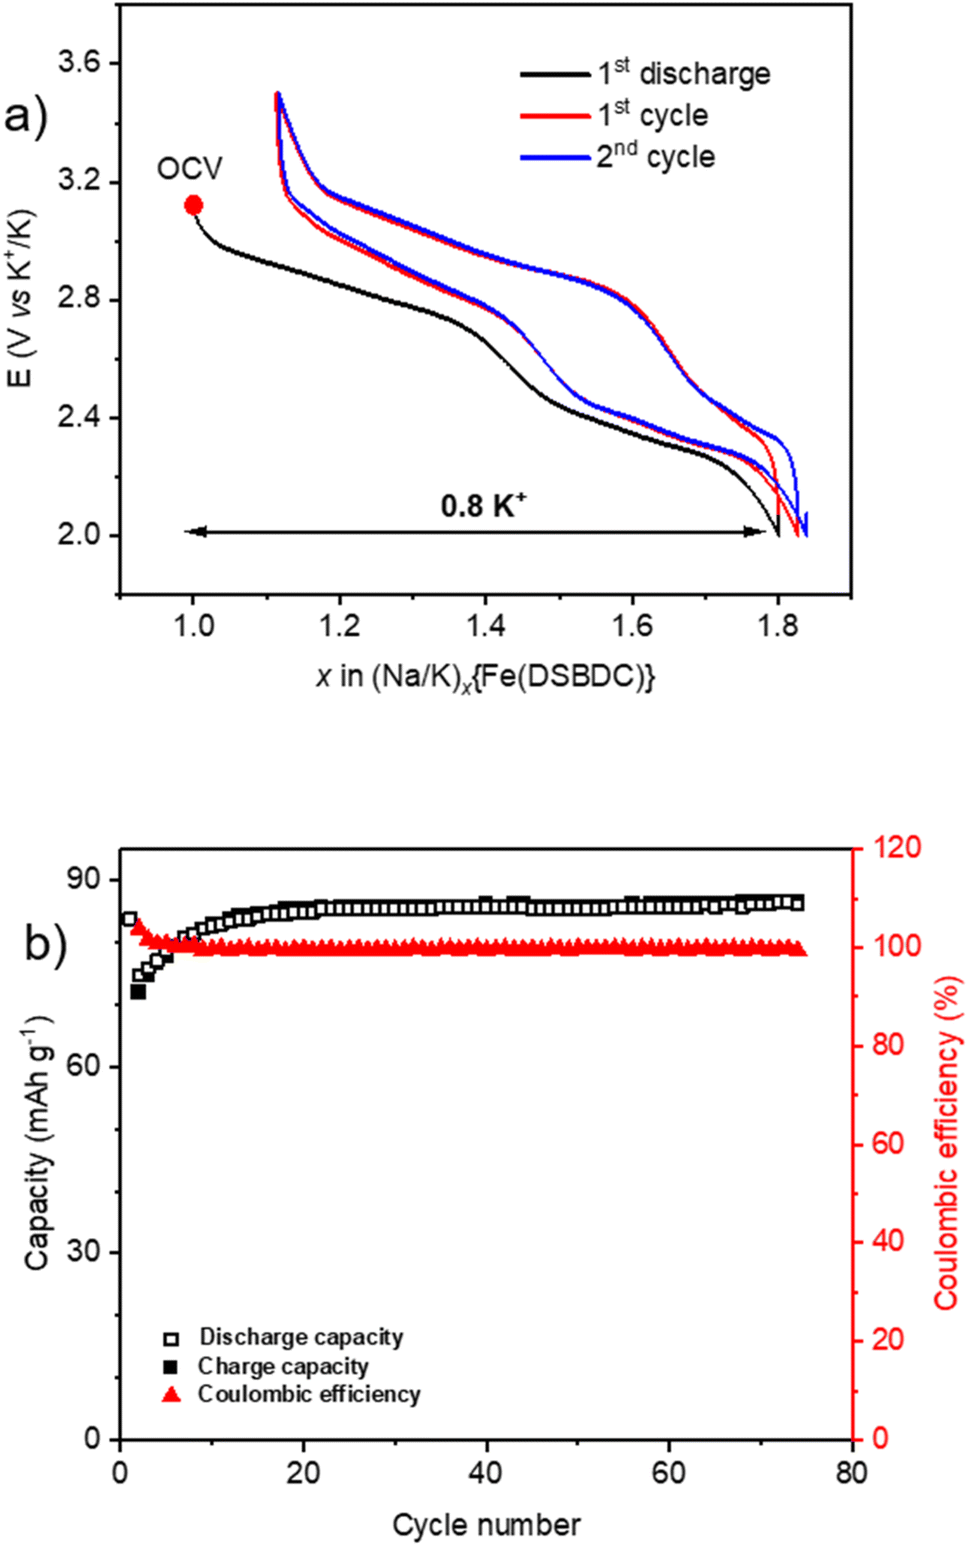 | ||
| Fig. 9 Electrochemical behaviour of Na{Fe(DSBDC)} in a half-cell vs. K cycled in the voltage range of 2.0–3.25 V vs. K+/K (1 e− exchanged per Fe in 10 h). (a) Potential vs. a number of inserted/extracted K+ in the first two cycles. (b) Corresponding capacity retention and coulombic efficiency curves upon long-term cycling. | ||
Whatever the alkali, only the inorganic redox centre (Fe) was found to be active, while no electrochemical response associated with DSBDC (oxidation) was detected.
To sum up, the electrochemical profile of Na{Fe(DSBDC)} when cycled vs. Li, Na or K shows significant discrepancies (Fig. 7a, 8a and 9a), suggesting that the electrode reaction mechanism is highly dependent on the nature of the intercalated cation. This can be clearly seen in Fig. S23,† which represents the first cycle for each alkali on an homogenized voltage axis. For Li, the potential evolves more or less linearly with the amount of electrons exchanged with an undesirable hysteresis profile (polarization > 500 mV), suggesting a peculiar pseudocapacitive behaviour. Further characterization will be needed to thoroughly clarify this point. For Na, a reversible sloping plateau is first visible followed by a monotonous potential evolution suggesting a sluggish insertion reaction within the more cathodic region, especially in reduction. The resulting polarization (∼200–300 mV) is still noticeable but improved vs. the Li half-cell. For K, the electrochemical curves exhibit a reversible K+ storage in two main steps, suggesting that the electrochemical reaction might occur through two bi-phasic reactions; the overall polarization (∼100–250 mV) being more reasonable. The variation in the polarization value when altering the intercalated cations suggests that the host structure might be ion selective and the facilitation of the ion diffusion increases in the order Li+ < Na+ < K+. Deeper operando characterization studies are in due course to gain a better understanding of this phenomenon, but similar differences were already observed in other layered materials such as covalent organic frameworks.61
Eventually, while the electrochemical behaviour of Na{Fe(DSBDC)} vs. Li and Na is standard, that related to K is more interesting. Indeed, the development of KIBs has been accelerated in the last five years; however, the number of structures that can allow reversible K+ intercalation/de-intercalation process is still quite limited. Some notable structures can be mentioned, such as KxMO2 layered oxides,62–64 KVPO4F polyanion,65–67 and Prussian blue analogues.68–70 In this study, the {Fe(DSBDC)}n-layered network was identified as a new and promising structure that can allow a selective and fast K+ diffusion process upon long-term cycling. Even though the redox potential and reversible capacity of this new compound are still limited, this discovery opens new opportunities for the development of analogous materials with better electrochemical performance through optimization of the cation and ligand composition. Substitution of Fe(III) by Mn(III), of redox-inert DSBDC by redox-active DOBDC, is currently under study in our laboratories.
4 Conclusion
A series of novel Fe(III)-carboxythiolate-based materials were successfully synthesized and characterized. These materials shared the 2D anionic motif {Fe(DSBDC)}n which consists of chains of edge-sharing FeS4O2 octahedra connected through fully deprotonated DSBDC ligands. By tuning the synthetic conditions, both organic and inorganic cations were successfully incorporated between these layers. These compounds are among the few materials built up from conjugated thiolate–M(III) bonds, and this unique bonding gave rise to a strong absorption in the visible range. Na{Fe(DSBDC)} exhibits a reversible redox activity through the reduction of Fe(III) to Fe(II) when cycled vs. Li, Na and K metal. Noteworthily, a small polarization and a negligible capacity loss upon long-term cycling (>70 cycles) were achieved in K-ion half-cells, implying that the host structure is highly compatible with K+, and {Fe(DSBDC)}n-based structures might be promising electrode materials for KIBs. This study also demonstrates the possibility of stabilizing thiolate-based MOFs with high oxidation state Mn+ (n ≥ 3) cations, which could find application not only in the field of electrochemical energy storage, but also in other areas involving light absorption and electron transfer such as photoelectrocatalysis.Author contributions
The manuscript was written through contributions of all authors. All authors have given approval to the final version of the manuscript.Conflicts of interest
There are no conflicts to declare.Acknowledgements
This work was supported by the Marie Skłodowska-Curie Actions (HeatNMof ITN project, grant 860942) and by the Agence Nationale de la Recherche (ThioMOFs project, grant ANR-19-CE08-0029-01, -03 and -04). The authors acknowledge the synchrotron Soleil for providing access to the CRISTAL beamline. We thank Erik Elkaïm (CRISTAL) for the PXRD data collection, Stéphane Grolleau (IMN) for the thermogravimetric analyses, Nicolas Stephant (IMN) for his help in the scanning electron microscopy experiments, Corine Reibel (ICGM) for the magnetic measurements, and Denis Loquet (Ceisam) for the elemental analyses. The ICP-AES analyses were performed at the LPG-UMR 6112 (C. La, M. Rivoal), Nantes Université, which is also thanked. We thank Laure Montconduit, Moulay Tahar Sougrati and Fabrice Salles (ICGM) for fruitful discussions.References
- N. E. Horwitz, J. Xie, A. S. Filatov, R. J. Papoular, W. E. Shepard, D. Z. Zee, M. P. Grahn, C. Gilder and J. S. Anderson, J. Am. Chem. Soc., 2019, 141, 3940–3951 CrossRef CAS PubMed.
- H. Maeda, R. Sakamoto and H. Nishihara, Langmuir, 2016, 32, 2527–2538 CrossRef CAS PubMed.
- J. He, S. Cheng and Z. Xu, Chem.–Euro. J., 2019, 25, 8654–8662 CrossRef CAS PubMed.
- T. Kusamoto and H. Nishihara, Coord. Chem. Rev., 2019, 380, 419–439 CrossRef CAS.
- H. Zhao, D. Yin, J. Wang, Y. Zheng and Y. Du, J. Mater. Chem. A, 2019, 7, 20176–20181 RSC.
- Y. Wu, Y. Chen, M. Tang, S. Zhu, C. Jiang, S. Zhuo and C. Wang, Chem. Commun., 2019, 55, 10856–10859 RSC.
- J. Xie, X.-F. Cheng, X. Cao, J.-H. He, W. Guo, D.-S. Li, Z. J. Xu, Y. Huang, J.-M. Lu and Q. Zhang, Small, 2019, 15, 1903188 CrossRef CAS PubMed.
- Z. Wu, D. Adekoya, X. Huang, M. J. Kiefel, J. Xie, W. Xu, Q. Zhang, D. Zhu and S. Zhang, ACS Nano, 2020, 14, 12016–12026 CrossRef CAS PubMed.
- Y. Wu, Y. Zhang, Y. Chen, H. Tang, M. Tang, S. Xu, K. Fan, C. Zhang, J. Ma, C. Wang and W. Hu, Energy Environ. Sci., 2021, 14, 6514–6525 RSC.
- H. Banda, J.-H. Dou, T. Chen, N. J. Libretto, M. Chaudhary, G. M. Bernard, J. T. Miller, V. K. Michaelis and M. Dincă, J. Am. Chem. Soc., 2021, 143, 2285–2292 CrossRef CAS PubMed.
- Y. Kamakura, S. Fujisawa, K. Takahashi, H. Toshima, Y. Nakatani, H. Yoshikawa, A. Saeki, K. Ogasawara and D. Tanaka, Inorg. Chem., 2021, 60, 12691–12695 CrossRef CAS PubMed.
- H. Banda, J.-H. Dou, T. Chen, Y. Zhang and M. Dincă, Angew. Chem., Int. Ed., 2021, 60, 27119–27125 CrossRef CAS PubMed.
- S.-W. Ke, Y. Wang, J. Su, K. Liao, S. Lv, X. Song, T. Ma, S. Yuan, Z. Jin and J.-L. Zuo, J. Am. Chem. Soc., 2022, 144, 8267–8277 CrossRef CAS PubMed.
- B. Wang, J. Li, M. Ye, Y. Zhang, Y. Tang, X. Hu, J. He and C. C. Li, Adv. Funct. Mater., 2022, 32, 2112072 CrossRef CAS.
- T. Kambe, R. Sakamoto, T. Kusamoto, T. Pal, N. Fukui, K. Hoshiko, T. Shimojima, Z. Wang, T. Hirahara, K. Ishizaka, S. Hasegawa, F. Liu and H. Nishihara, J. Am. Chem. Soc., 2014, 136, 14357–14360 CrossRef CAS PubMed.
- X. Huang, S. Zhang, L. Liu, L. Yu, G. Chen, W. Xu and D. Zhu, Angew. Chem., Int. Ed., 2018, 57, 146–150 CrossRef CAS PubMed.
- L. Sun, T. Miyakai, S. Seki and M. Dinca, J. Am. Chem. Soc., 2013, 135, 8185–8188 CrossRef CAS PubMed.
- L. Sun, C. H. Hendon, M. A. Minier, A. Walsh and M. Dinca, J. Am. Chem. Soc., 2015, 137, 6164–6167 CrossRef CAS PubMed.
- E. D. Bloch, L. J. Murray, W. L. Queen, S. Chavan, S. N. Maximoff, J. P. Bigi, R. Krishna, V. K. Peterson, F. Grandjean, G. J. Long, B. Smit, S. Bordiga, C. M. Brown and J. R. Long, J. Am. Chem. Soc., 2011, 133, 14814–14822 CrossRef CAS PubMed.
- R. G. Pearson, J. Am. Chem. Soc., 1963, 85, 3533–3539 CrossRef CAS.
- J. He, C. Yang, Z. Xu, M. Zeller, A. D. Hunter and J. Lin, J. Solid State Chem., 2009, 182, 1821–1826 CrossRef CAS.
- S. Du, M. Cui and Z. He, Inorg. Chem., 2021, 60, 19053–19061 CrossRef CAS PubMed.
- J. He, X. Ye, Z. Liu, L. Tang, J. Hu and Z. Xu, Mater. Res. Lett., 2022, 10, 496–500 CrossRef CAS.
- K.-K. Yee, N. Reimer, J. Liu, S.-Y. Cheng, S.-M. Yiu, J. Weber, N. Stock and Z. Xu, J. Am. Chem. Soc., 2013, 135, 7795–7798 CrossRef CAS PubMed.
- A. S. Munn, F. Millange, M. Frigoli, N. Guillou, C. Falaise, V. Stevenson, C. Volkringer, T. Loiseau, G. Cibin and R. I. Walton, CrystEngComm, 2016, 18, 8108–8114 RSC.
- M.-Q. Li, Y.-L. Wong, T.-S. Lum, K. S.-Y. Leung, P. K. S. Lam and Z. Xu, J. Mater. Chem. A, 2018, 6, 14566–14570 RSC.
- Y.-L. Wong, Y. Diao, J. He, M. Zeller and Z. Xu, Inorg. Chem., 2019, 58, 1462–1468 CrossRef CAS PubMed.
- S. Cheng, J. Ouyang, M. Li, Y. Diao, J. Yao, F. Li, Y.-F. Lee, H. H.-Y. Sung, I. Williams, Z. Xu and Y. Quan, Angew. Chem., Int. Ed., 2023, 62, e202300993 CrossRef CAS PubMed.
- J. S. Bashkin, J. C. Huffman and G. Christou, J. Am. Chem. Soc., 1986, 108, 5038–5039 CrossRef CAS.
- K. Hegetschweiler, T. Keller, M. Baeumle, G. Rihs and W. Schneider, Inorg. Chem., 1991, 30, 4342–4347 CrossRef CAS.
- G. B. Karet, S. L. Castro, K. Folting, J. C. Bollinger, R. A. Heintz and G. Christou, J. Chem. Soc., Dalton Trans., 1998, 67–72 RSC.
- N. Duran, W. Clegg, L. Cucurull-Sánchez, R. A. Coxall, H. R. Jiménez, J.-M. Moratal, F. Lloret and P. González-Duarte, Inorg. Chem., 2000, 39, 4821–4832 CrossRef CAS PubMed.
- S. Goswami, A. Adhikary, H. S. Jena, S. Biswas and S. Konar, Inorg. Chem., 2013, 52, 12064–12069 CrossRef CAS PubMed.
- T. Devic and C. Serre, Chem. Soc. Rev., 2014, 43, 6097–6115 RSC.
- L. Vial, R. F. Ludlow, J. Leclaire, R. Pérez-Fernández and S. Otto, J. Am. Chem. Soc., 2006, 128, 10253–10257 CrossRef CAS PubMed.
- G. M. Sheldrick, Acta Crystallogr., Sect. A: Found. Crystallogr., 2008, 64, 112–122 CrossRef CAS PubMed.
- G. M. Sheldrick, Acta Crystallogr., Sect. C: Struct. Chem., 2015, 71, 3–8 Search PubMed.
- TOPAS V5, 0: General Profile and Structure Analysis Software for Powder Diffraction Data, Bruker AXS Ltd, 1999, 2014 Search PubMed.
- G. Grosse, PC-Moss II, Version 1.0 Manual and Program Documentation 1993 Search PubMed.
- N. Stock, Microporous Mesoporous Mater., 2010, 129, 287–295 CrossRef CAS.
- N. E. Brese and M. O'Keeffe, Acta Crystallogr., Sect. B: Struct. Sci., 1991, 47, 192–197 CrossRef.
- M.-E. Pandelia, N. D. Lanz, S. J. Booker and C. Krebs, Biochim. Biophys. Acta, 2015, 1853, 1395–1405 CrossRef CAS PubMed.
- L. Stievano and F. E. Wagner, in Characterization of Solid Materials and Heterogeneous Catalysts, John Wiley & Sons, Ltd, 2012, pp. 407–452 Search PubMed.
- B. Fultz, in Characterization of Materials, John Wiley & Sons, Ltd, 2012, pp. 1–21 Search PubMed.
- K. M. Jablonka, D. Ongari, S. M. Moosavi and B. Smit, Nat. Chem., 2021, 13, 771–777 CrossRef CAS PubMed.
- S. Renault, S. Gottis, A.-L. Barres, M. Courty, O. Chauvet, F. Dolhem and P. Poizot, Energy Environ. Sci., 2013, 6, 2124–2133 RSC.
- S. Wang, L. Wang, K. Zhang, Z. Zhu, Z. Tao and J. Chen, Nano Lett., 2013, 13, 4404–4409 CrossRef CAS PubMed.
- S. Wang, L. Wang, Z. Zhu, Z. Hu, Q. Zhao and J. Chen, Angew. Chem., Int. Ed., 2014, 53, 5892–5896 CrossRef CAS PubMed.
- A. Jouhara, N. Dupré, A.-C. Gaillot, D. Guyomard, F. Dolhem and P. Poizot, Nat. Commun., 2018, 9, 4401 CrossRef PubMed.
- D. Rambabu, A. E. Lakraychi, J. Wang, L. Sieuw, D. Gupta, P. Apostol, G. Chanteux, T. Goossens, K. Robeyns and A. Vlad, J. Am. Chem. Soc., 2021, 143, 11641–11650 CrossRef CAS PubMed.
- M. Denis, H. Chevreau, P. Salcedo-Abraira, P. Moreau, N. Dupré, M. Paris, P. Poizot and T. Devic, Mol. Syst. Des. Eng., 2023, 8, 1030–1039 RSC.
- P. Simon, Y. Gogotsi and B. Dunn, Science, 2014, 343, 1210–1211 CrossRef CAS PubMed.
- A. Noori, M. F. El-Kady, M. S. Rahmanifar, R. B. Kaner and M. F. Mousavi, Chem. Soc. Rev., 2019, 48, 1272–1341 RSC.
- G. Férey, F. Millange, M. Morcrette, C. Serre, M.-L. Doublet, J.-M. Grenèche and J.-M. Tarascon, Angew. Chem., Int. Ed., 2007, 46, 3259–3263 CrossRef PubMed.
- A. Fateeva, P. Horcajada, T. Devic, C. Serre, J. Marrot, J.-M. Grenèche, M. Morcrette, J.-M. Tarascon, G. Maurin and G. Férey, Eur. J. Inorg. Chem., 2010, 2010, 3789–3794 CrossRef.
- J. Shin, M. Kim, J. Cirera, S. Chen, G. J. Halder, T. A. Yersak, F. Paesani, S. M. Cohen and Y. S. Meng, J. Mater. Chem. A, 2015, 3, 4738–4744 RSC.
- S. Schmidt, D. Sheptyakov, J.-C. Jumas, M. Medarde, P. Benedek, P. Novak, S. Sallard and C. Villevieille, Chem. Mater., 2015, 27, 7889–7895 CrossRef CAS.
- T. Yamada, K. Shiraishi, H. Kitagawa and N. Kimizuka, Chem. Commun., 2017, 53, 8215–8218 RSC.
- M. L. Aubrey and J. R. Long, J. Am. Chem. Soc., 2015, 137, 13594–13602 CrossRef CAS PubMed.
- D. F. S. Gallis, H. D. P. Iii, T. M. Anderson and K. W. Chapman, J. Mater. Chem. A, 2016, 4, 13764–13770 RSC.
- J. Zou, K. Fan, X. Wang, Y. Chen, Y. Cao, H. Dai, C. Zhang, M. Fu, Y. Gao, H. Liu and C. Wang, Chem. Eng. J., 2023, 460, 141703 CrossRef CAS.
- Y. Hironaka, K. Kubota and S. Komaba, Chem. Commun., 2017, 53, 3693–3696 RSC.
- J.-Y. Hwang, J. Kim, T.-Y. Yu, S.-T. Myung and Y.-K. Sun, Energy Environ. Sci., 2018, 11, 2821–2827 RSC.
- M. G. T. Nathan, H. Yu, G.-T. Kim, J.-H. Kim, J. S. Cho, J. Kim and J.-K. Kim, Adv. Sci., 2022, 9, 2105882 CrossRef CAS PubMed.
- K. Chihara, A. Katogi, K. Kubota and S. Komaba, Chem. Commun., 2017, 53, 5208–5211 RSC.
- H. Kim, D.-H. Seo, M. Bianchini, R. J. Clément, H. Kim, J. C. Kim, Y. Tian, T. Shi, W.-S. Yoon and G. Ceder, Adv. Energy Mater., 2018, 8, 1801591 CrossRef.
- R. Wernert, L. H. B. Nguyen, E. Petit, P. S. Camacho, A. Iadecola, A. Longo, F. Fauth, L. Stievano, L. Monconduit, D. Carlier and L. Croguennec, Chem. Mater., 2022, 34, 4523–4535 CrossRef CAS.
- L. Li, Z. Hu, Y. Lu, C. Wang, Q. Zhang, S. Zhao, J. Peng, K. Zhang, S.-L. Chou and J. Chen, Angew. Chem., Int. Ed., 2021, 60, 13050–13056 CrossRef CAS PubMed.
- Y. Yang, J. Zhou, L. Wang, Z. Jiao, M. Xiao, Q. Huang, M. Liu, Q. Shao, X. Sun and J. Zhang, Nano Energy, 2022, 99, 107424 CrossRef CAS.
- P. N. L. Pham, R. Wernert, M. Cahu, M. T. Sougrati, G. Aquilanti, P. Johansson, L. Monconduit and L. Stievano, J. Mater. Chem. A, 2023, 11, 3091–3104 RSC.
Footnotes |
| † Electronic supplementary information (ESI) available. CCDC 2291657–2291659. For ESI and crystallographic data in CIF or other electronic format see DOI: https://doi.org/10.1039/d3ta05353a |
| ‡ These authors contributed equally. |
| This journal is © The Royal Society of Chemistry 2023 |