
Floating zone crystal growth, structure, and properties of a cubic Li5.5La3Nb1.5Zr0.5O12 garnet-type lithium-ion conductor†
Caleb
Ramette
 a,
Lucas
Pressley‡
bc,
Maxim
Avdeev
de,
Minseong
Lee
f,
Satya
Kushwaha
bg,
Matthew
Krogstad
h,
Suchismita
Sarker
i,
Paul
Cardon
a,
Jacob
Ruff
i,
Mojammel
Khan
bg,
Kunimitsu
Kataoka
j,
Tyrel
McQueen
bcg and
Huiwen
Ji
*a
a,
Lucas
Pressley‡
bc,
Maxim
Avdeev
de,
Minseong
Lee
f,
Satya
Kushwaha
bg,
Matthew
Krogstad
h,
Suchismita
Sarker
i,
Paul
Cardon
a,
Jacob
Ruff
i,
Mojammel
Khan
bg,
Kunimitsu
Kataoka
j,
Tyrel
McQueen
bcg and
Huiwen
Ji
*a
aDepartment of Materials Science & Engineering, University of Utah, Salt Lake City, Utah 84112, USA. E-mail: huiwen.ji@utah.edu
bDepartment of Chemistry, The Johns Hopkins University, Baltimore, Maryland 21218, USA
cDepartment of Materials Science and Engineering, The Johns Hopkins University, Baltimore, Maryland 21218, USA
dAustralian Centre for Neutron Scattering, Australian Nuclear Science and Technology Organisation (ANSTO), New Illawarra Rd, Lucas Heights, Sydney, NSW 2234, Australia
eSchool of Chemistry, University of Sydney, Sydney, NSW 2006, Australia
fNational High Magnetic Field Laboratory, Los Alamos National Laboratory, Los Alamos, New Mexico 87545, USA
gDepartment of Chemistry, Platform for the Accelerated Realization, Analysis and Discovery of Interface Materials (PARADIM), The Johns Hopkins University, Baltimore, Maryland 21218, USA
hAdvanced Photon Source, Argonne National Laboratory, Lemont, IL 60439, USA
iCornell High Energy Synchrotron Source (CHESS), Cornell University, Ithaca, NY 14853, United States
jNational Institute of Advanced Industrial Science and Technology, AIST Tsukuba Centre 5, Japan
First published on 25th September 2023
Abstract
As a promising candidate for solid-state electrolytes in Li-ion batteries, the garnet-type Li-ion conductor series Li5+xLa3Nb2−xZrxO12 (LLNZO) (0 ≤ x ≤ 2) exhibits high ionic conductivity at room temperature. However, no previous single-crystal growth or characterization has been reported for LLNZO compositions 0 ≤ x ≤ 1. To obtain a complete understanding of the trend in the structure–property relationship in this class of materials, we used the floating zone (FZ) method to grow a single crystal of Li5.5La3Nb1.5Zr0.5O12 that was 4 mm in diameter and 10 mm in length. Using Laue neutron single-crystal diffraction, two distinct Li sites were observed: tetrahedral 24d and octahedral 96h sites. The maximum entropy method (MEM) based on neutron single-crystal diffraction data was used to map Li nuclear density and estimate that the bottleneck of Li transport exists between neighboring tetrahedral and octahedral sites, and that Li is delocalized between split octahedral sites. Room-temperature Li-ion conductivity in Li5.5La3Nb1.5Zr0.5O12 measured with electrochemical impedance spectroscopy (EIS) was 1.37 × 10⁻⁴ S cm−1. The Li migration activation energy was estimated to be 0.50 eV from EIS and 0.47 eV from dielectric relaxation measurements. The Li-ion jump attempt rate was estimated to be 1.47 × 10¹² Hz while the time scale of successful migration is 10−7 to 10−6 s.
 Huiwen Ji | Huiwen Ji is an assistant professor in the Materials Science and Engineering Department at the University of Utah. She received her PhD in chemistry from Princeton University in 2014 and her thesis was dedicated to the study of topological insulators under the supervision of Professor Robert J. Cava. She then spent three years between 2016 and 2019 as a postdoctoral associate in Professor Gerbrand Ceder's group at UC Berkeley and studied lithium and multi-valent battery materials. Since 2019, she became a research scientist at the Lawrence Berkeley National Laboratory in the Energy Storage & Distributed Resources Division until she accepted a faculty position at the University of Utah in 2021. Her research focuses on establishing structure–property relationships in functional materials by coupling synthesis, property measurements and advanced total scattering and spectroscopic characterizations. She received an NSF Career award in 2022 to study the structural disorders in battery materials. |
Introduction
Development of all-solid-state lithium-ion batteries (LIBs) is a primary focus of research aiming to provide safer and more energy-dense secondary batteries for use in portable electronics and electric cars. In particular, solid-state electrolytes could significantly decrease risks of LIB leakage and flammability by replacing volatile liquid species used in current LIB electrolytes.1–3 Solid-state electrolytes could also be used to engineer batteries with high energy densities due to their likely compatibility with Li-metal anodes and high-voltage positive electrodes.4–7 Exhibiting wider chemical stability windows, oxide solid-state electrolytes are preferred over their sulfide counterparts.7–9 In particular, garnet-type oxides exhibit high Li-ion conductivity and electrochemical stability against Li metal, making this class of materials a particularly promising candidate for all-solid-state LIB electrolytes.10–12 The prototypical garnet structure can accommodate a wide range of metal species. Li-ion conductors adopting this structure share a general formula LiδB3C2O12 (commonly assigned space group Ia![[3 with combining macron]](https://www.rsc.org/images/entities/char_0033_0304.gif) d), where B is an alkali earth or rare-earth element (e.g., La, Y, Pr, Nd, Sm, Ca, Ba) occupying the dodecahedral site 24c and C is a higher-valent element (e.g. Zr, Hf, Sn, Nb, Ta, Te, W) occupying the octahedral site 16a.12–20 Li ions occupy tetrahedral 24d and/or octahedral 96h sites,21,22 of which the content δ can be continuously varied from 3 to 7 by element C substitution to systematically tune the ionic conductivity.10,12,23 The garnet-type Li-ion conductors Li5+xLa3Nb2−xZrxO12 (LLNZO) and Li5+xLa3Ta2−xZrxO12 (LLTZO) (both with 0 ≤ x ≤ 2) series exhibit particularly promising ionic conductivity as high as 10−3 S cm−1 at room temperature.24 The structure and properties of LLTZO have been widely reported as analogous to those of LLNZO.5,15,16,22,25–29 These systems undergo a tetragonal-to-cubic phase transition when the Li content falls below a threshold dependent on the dopant species and synthesis conditions.12,17,25,30 An overall trend that Li favors tetrahedral site occupancy at low concentrations and almost monotonically shifts to the octahedral site at high concentrations has been reported from both experimental and computational studies.31–34 This occupational shift is critically important for inducing the structural phase transition and forming the Li-ion conduction pathway.35
d), where B is an alkali earth or rare-earth element (e.g., La, Y, Pr, Nd, Sm, Ca, Ba) occupying the dodecahedral site 24c and C is a higher-valent element (e.g. Zr, Hf, Sn, Nb, Ta, Te, W) occupying the octahedral site 16a.12–20 Li ions occupy tetrahedral 24d and/or octahedral 96h sites,21,22 of which the content δ can be continuously varied from 3 to 7 by element C substitution to systematically tune the ionic conductivity.10,12,23 The garnet-type Li-ion conductors Li5+xLa3Nb2−xZrxO12 (LLNZO) and Li5+xLa3Ta2−xZrxO12 (LLTZO) (both with 0 ≤ x ≤ 2) series exhibit particularly promising ionic conductivity as high as 10−3 S cm−1 at room temperature.24 The structure and properties of LLTZO have been widely reported as analogous to those of LLNZO.5,15,16,22,25–29 These systems undergo a tetragonal-to-cubic phase transition when the Li content falls below a threshold dependent on the dopant species and synthesis conditions.12,17,25,30 An overall trend that Li favors tetrahedral site occupancy at low concentrations and almost monotonically shifts to the octahedral site at high concentrations has been reported from both experimental and computational studies.31–34 This occupational shift is critically important for inducing the structural phase transition and forming the Li-ion conduction pathway.35
Although Li-ion garnets are most often synthesized and characterized in a powder form, single crystals are more desirable for investigating solid-state ionic conductors. Generally, polycrystalline pellets exhibit lower ionic conductivity than single crystals due to unwanted impedance from grain boundaries.16,21,36,37 When paired with a Li metal anode, single-crystal electrolytes better suppress Li dendrites that otherwise grow along grain boundaries and thereby reduce cycle life via short circuits and thermal runaway.7,38–43 Furthermore, single crystals are indispensable for certain types of characterization. The correlation between lattice dynamics and ion transport has been speculated20–22,30,44,45 but still awaits experimental verification because the energy-momentum phonon dispersions must be measured using inelastic neutron scattering on sizable single-crystal samples. Single crystals are also preferred for the determination of crystal structures because well-resolved 3D k-space diffraction can be obtained to better solve the site distribution of the Li-ion sublattice.
The floating zone (FZ) method has been previously used to synthesize large single crystals of various LLNZO (x = 1.5, 1.95, 2)12,16,24 and LLTZO (x = 1.2, 1.4, 1.5, 1.6, 1.8)5,26 compositions with high Li contents. This container-free method is ideal for eliminating sample contamination, particularly from Al, and for reducing loss of volatile species, such as Li, by minimizing dwell time at high temperature.16,46–48 These studies demonstrated the exceptional difficulty or impossibility of stabilizing the molten zone during FZ crystal growths. The instability has been attributed to Li volatilization from the high-temperature molten zone.8,16 To offset Li loss and retain the target Li content, adding 20% over-stoichiometric Li-containing reactants was necessary; however, additional Li increased the amount of volatized material and further contributed to molten zone instability.5,12,16,24,26 To mitigate molten zone instability, an inert gas was applied to reduce vaporization of volatile species from FZ growth49 and air flow through the sample chamber was implemented to counteract molten zone instability in previously reported LLNZO and LLTZO FZ growths.5,24,26 In addition, translating and rotating the feed and seed rods at high speed to reduce the dwell time at high temperature was necessary because complete stabilization of the molten zone is nearly impossible.12,16,24
In this study, we report the growth of a centimeter-long single crystal of an LLNZO garnet with a low Li stoichiometry of 5.5 f.u.−1 (x = 0.5): Li5.5La3Nb1.5Zr0.5O12 (Li5.5-LLNZO). Single crystal growth or characterization has not been previously reported for this Li content; this work, together with the aforementioned single-crystal studies on higher Li content compositions, establishes a more complete trend in this technically important class of materials. The crystal structure, especially the Li sublattice, was carefully characterized by neutron single-crystal diffraction to better understand the superionic conductivity mechanism when combined with electrochemical impedance spectroscopy (EIS) and dielectric relaxation measurements. Our detailed account of crystal growth and the issues encountered will facilitate similar studies in the future with in-depth characterizations of solid-state ion conductors only possible on single crystal samples.
Experimental
Single crystal growth
The initial polycrystalline material was synthesized via a standard solid-state reaction. Lithium hydroxide (LiOH, ≥98%), lanthanum hydroxide (La(OH)3, 99.9%), niobium oxide (Nb2O5, 99.9%), and zirconium hydroxide (Zr(OH)4, 97%), all from Sigma-Aldrich, were mixed in a molar ratio of 6.6![[thin space (1/6-em)]](https://www.rsc.org/images/entities/char_2009.gif) :3:1.5:0.025 for a nominal composition of Li6.6La3Nb1.5Zr0.5O12. The amount of LiOH contained 20% excess to offset loss of volatilized lithium during the high temperature growth procedure. A slurry was made by mixing the precursor powder in ethanol and milling (Retsch PM 400 planetary ball mill) for 12 hours at 180 rpm with intervals of 30 minutes with a 5 minute rest and reversal of rotation after each interval. Agate jars and balls were used for the milling process. The ethanol was removed by evaporation at 383 K, after which the precursor was pressed into cylindrical pellets 13 mm in diameter with 2 tons of pressure in a stainless-steel die. The pellets were sintered at 1123 K in a muffle furnace for 12 hours on Au foil in alumina crucibles with covers. The pellets were then ground to fine powder with an agate mortar and pestle in a glovebox with argon (Ar) atmosphere and stored under Ar. To prepare the seed/feed rods for crystal growth, the powder was packed into a cylindrical latex balloon with approximate diameter of 7 mm and length of 60 mm, degassed under vacuum, and hydrostatically pressed with approximately 65 MPa of pressure. The rods were stored in a glovebox with Ar atmosphere until the growth procedure.
:3:1.5:0.025 for a nominal composition of Li6.6La3Nb1.5Zr0.5O12. The amount of LiOH contained 20% excess to offset loss of volatilized lithium during the high temperature growth procedure. A slurry was made by mixing the precursor powder in ethanol and milling (Retsch PM 400 planetary ball mill) for 12 hours at 180 rpm with intervals of 30 minutes with a 5 minute rest and reversal of rotation after each interval. Agate jars and balls were used for the milling process. The ethanol was removed by evaporation at 383 K, after which the precursor was pressed into cylindrical pellets 13 mm in diameter with 2 tons of pressure in a stainless-steel die. The pellets were sintered at 1123 K in a muffle furnace for 12 hours on Au foil in alumina crucibles with covers. The pellets were then ground to fine powder with an agate mortar and pestle in a glovebox with argon (Ar) atmosphere and stored under Ar. To prepare the seed/feed rods for crystal growth, the powder was packed into a cylindrical latex balloon with approximate diameter of 7 mm and length of 60 mm, degassed under vacuum, and hydrostatically pressed with approximately 65 MPa of pressure. The rods were stored in a glovebox with Ar atmosphere until the growth procedure.
An optical high-pressure floating zone (HPFZ) furnace (ScIDre GmbH, up to 300 bar, NSF's PARADIM Bulk Crystal Growth facility at Johns Hopkins University) with one 5 kW xenon arc lamp in vertical 2-mirror geometry was used to grow the single crystals. The seed and feed rods were translated at a rate between 10 and 20 mm h−1, which was varied as needed during growth to stabilize the molten zone. The seed and feed rods were initially rotated in parallel at 10 rpm with rotation changed to antiparallel after a stable melt formed. Counter-rotation resulted in considerably better mixing and formation of higher quality crystal. Close monitoring and real-time variation of the pulling rate was necessary throughout the growth process to maintain a stable molten zone. To prevent contamination of the sample surface from ambient moisture or carbon dioxide, the growth was performed under an applied Ar atmosphere. A pressure of ∼10 bar under Ar atmosphere with a flow rate of 0.1 L min−1 was applied to help control Li loss from vaporization and minimize obstruction of optical transmission from vapor coating the inside of the sample chamber.
Compositional and crystal structure analysis
The crystal boule was visually inspected with a ZEISS Stemi 508 apochromic stereo microscope. Digital images were taken with a ZEISS Axiocam 208 microscope camera attachment. Prior to any further analysis of the single crystal samples, the surface was polished to remove any Li-deficient impurities given that Li loss occurs mainly on the outer surface. The relative compositions of Li, La, Nb, and Zr were measured via inductively coupled plasma atomic emission spectroscopy (ICP-AES, Galbraith Laboratories, Inc.) from a small portion of single crystal Li5.5-LLNZO ground to fine powder in an agate mortar and pestle under argon atmosphere.A STOE STADI P X-ray diffractometer was used in transmission geometry to collect all laboratory data with Mo anode Kα1 radiation (λ = 0.70930 Å), a Ge(111) curved monochromator, and a Dectris MYTHEN2 detector. Data was collected at room temperature in static mode across the 2θ angle range of 2° to 60° from a small Li5.5-LLNZO crystal boule sample ground to fine powder. The sample was measured for 4.5 hours in triplicate across the full angular range, totaling 13.5 hours of measurement time. Refinement on laboratory XRD data was completed with GSAS-II software package. VESTA was used to visualize crystal structure results.
Scanning electron microscopy (SEM) (FEI QUANTA (600F)) was used to image a polished segment from the counter-rotated portion of the crystal boule using a secondary electron detector with a 10 kV high voltage beam, magnification of 5000×, and working distance of 10.1 mm. Two-axis X-ray diffractometer measurements (Bruker D2 Phaser) were also performed with this polished segment using Cu Kα1 radiation (λ = 1.5406 Å) and Cu Kα2 radiation (λ = 1.54439 Å) at ambient temperature over a 2θ range of 10°–70° (30 kV, 10 mA) and detected with a 1D LYNXEYE, 192 channel detector with a scan time of 991 s.
Single crystal Laue neutron diffraction data were collected on the KOALA diffractometer at the OPAL Research Reactor (ANSTO).50 First, several crystals of irregular shape were chipped off the boule and tested for quality. Each piece yielded excellent data (see Fig. 4 for a representative image). A crystal ∼0.5 mm across was selected and 13 images were collected in 15° rotation steps with exposure time of 6600 seconds per image. Image data processing, including indexing, intensity integration, and wavelength distribution normalization was performed using LaueG.51 Crystal structure refinement was carried out using Jana202052 and maximum entropy analysis (MEM) was performed with Dysnomia.53 The crystal structure and neutron scattering density maps were visualized with VESTA.54
The QM2 synchrotron beamline at CHESS was used to measure single crystal X-ray diffraction on a small crystal sample. Data was collected in transmission geometry with an incident beam energy of 37.0002 keV (λ = 0.335092 Å), selected with a 〈111〉 diamond double-crystal monochromator. Scattered X-rays were measured with a Dectris Pilatus 6M (6 megapixel) photon-counting pixel-array detector with a 1 mm-thick silicon sensor layer continuously counting as the sample was rotated with three tilted full 360° with a new exposure triggered every 0.1°. Data were processed using the NeXpy software package and reciprocal space volumes reconstructed using CCTW following previously established procedures.55
Ionic conductivity analysis
Alternating current (AC) EIS analysis was used to determine the Li-ion conductivity and activation energy of the LLNZO sample. A segment of single crystal with an unknown orientation from the best-quality counter-rotated segment was polished and sputter coated (Cressington sputter coater 108 auto) with a thin film of Au on parallel faces to create Li-ion blocking electrodes. Kapton® tape was used to prevent coating the perpendicular sides of the crystal sample and electronically bridging the Au-coated faces. The sample was inserted into a leak-tight controlled environment sample holder (CESH) cell (BioLogic) under Ar atmosphere. EIS spectra were measured (BioLogic SP-300) over a frequency range of 7 MHz to 100 mHz with an applied AC 10.0 mV in amplitude, 16 points per decade in logarithmic spacing, 0.10 s periods before each frequency, and 5 measures per frequency. The CESH cell was placed in an oven (VWR INCU-line) and allowed to thermally equilibrate for at least two hours at each temperature before each measurement was conducted at 296.3, 303.2, 308.2, 313.2, 318.2, 323.2, 328.2, 333.2, 338.2, and 343.2 K. The data was processed in ZView, including fitting EIS measurements to equivalent circuits. The thickness of the crystal segment was measured to be approximately 0.88 mm (Mitutoyo 547-500S digimatic thickness gauge) and the sample surface area was estimated to be 2.961 mm2 from image analysis in ImageJ.Dielectric measurement and analysis
For the dielectric measurement, a single crystalline sample was polished into a plate shape with area of 3.49 mm2 and thickness of 0.75 mm to achieve a parallel capacitor geometry. Electrical contacts were made with silver paint on the two flat surfaces. Pt wires were used to connect the sample to a custom-made measurement probe equipped with BNC cables and connectors. The capacitance and dissipation angle were measured at various frequencies from 5 kHz to 2 MHz using an E4980A LCR meter at a PPMS (Physical Property Measurement System, Quantum Design) from 400 K to 3 K while cooling. The measured capacitance and dissipation were converted to the dielectric constant (ε′) and dissipation (ε′′) using:
| ε′′ = Dε′ |
The same segment used for dielectric measurements was also used to measure the d.c. polarization of the Li5.5-LLNZO single crystal. The single crystal plate with silver paint contacts was placed into the leak-tight CESH cell (BioLogic) under Ar atmosphere, identical to the setup used for EIS measurements. D.C. polarization curves were recorded at 1.136 V, 1.636 V, 2.136 V, 2.636 V, and 3.136 V. The final current values after 1 minute relaxation at each volage were used to calculate the electronic conductivity from Ohm's law.
Results & discussion
Single crystal growth of Li5.5La3Nb1.5Zr0.5O12
A crystal boule of Li5.5La3Nb1.5Zr0.5O12 (Li5.5-LLNZO) was synthesized in a single-lamp high-pressure floating zone (HPFZ) furnace. High-temperature pre-sintering of the seed/feed rods was avoided because sintering resulted in darkening of the material from white to tan, possibly due to contamination from alumina combustion boats used during sintering. Skipping rod sintering also avoided lithium loss prior to growth but inevitably lead to significant volume change between polycrystalline, melted, and crystallized material during crystal growth. This effect particularly affected feed rod material supplied to the molten zone, so the translation of the feed rod was consistently faster and more varied than that of the seed rod.The setup of the HPFZ furnace is shown in Fig. 1a, featuring a vertical double-mirror setup with a single xenon arc lamp located at the focal point of the lower mirror. Light from the arc lamp is reflected from the lower mirror through a shutter aperture to the upper mirror, where the rays are focused to a focal point in the center of the sample rod position. The lamp output is tunable due to the power shutter aperture system above the lamp, which allows an effective power output even less than the minimum power necessary to ignite the lamp. This finely-tunable power output was critical to growth because the minimum power of the xenon lamp was greater than the power needed to melt Li5.5-LLNZO. Therefore, the shutter system was necessary to limit and tune the power output in real time to achieve and maintain a stable molten zone.
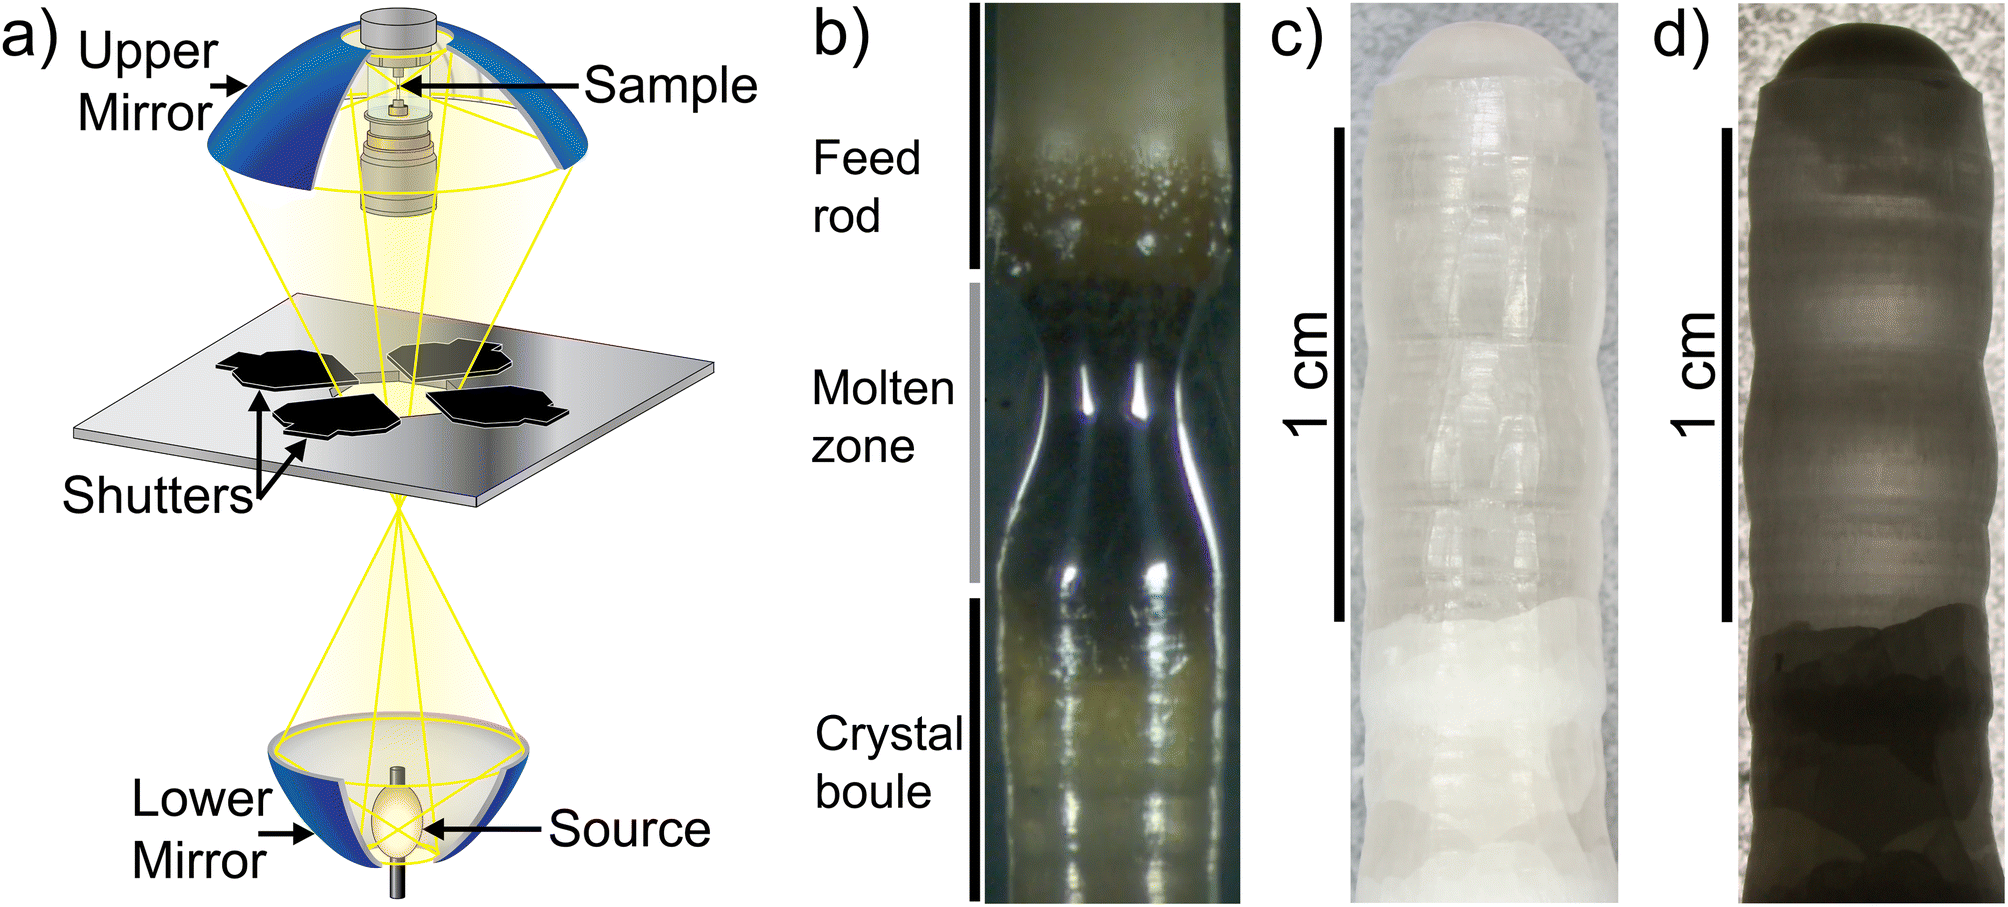 | ||
| Fig. 1 (a) High-pressure single-lamp floating zone furnace setup. Figure adapted from Scientific Instruments Dresden GmbH.70 (b) In-progress growth of Li5.5-LLNZO rod showing feed rod (top), molten zone (middle), and crystal formation (below). (c and d) Crystal boule segment synthesized with counter-rotation imaged with top lighting (c) and backlighting (d). | ||
The growth was initiated with parallel rotation of seed and feed rods. The xenon arc lamp was operated at 4140 W and the power shutter aperture was set to between 25–28% to use roughly 25–28% of the lamp power. The molten zone had a metallic luster and was highly reflective, suggesting a high refractive index (Fig. 1b). The feed rod near the molten zone transitioned from white to a darker hue, likely due to densification of the unsintered feed rod near the molten zone and feed rod porosity driving capillarity of liquified material from the molten zone. Bubbles were observed forming near the upper solid–liquid interface and not in the main portion of the molten zone and vapor was observed leaving the surface of the molten zone, likely due to loss of lithium. Once a stable melt formed, the direction of rotation of the feed rod was reversed. Counterrotation of feed and seed rods was necessary for forming larger crystal grains, and a rotation speed of 10 rpm was maintained throughout the rest of the growth. During and after crystal growth, a layer of cloudy white coating formed on the inside wall of the quartz tube around the molten zone, indicating significant Li evaporation (Fig. S1†). This evaporation was expected because 20% additional Li2OH was added to the precursor stoichiometry and the seed/feed rods were not sintered prior to growth. Since vapor coating of the quartz tube reduces light transmission to the molten zone and lowers the molten zone temperature, previous work has demonstrated that a high flow rate is necessary to prevent detrimental melt solidification during the growth process.56 In this study, a high Ar flow rate of 0.1 L min−1 was used to ensure vapor was carried away from the focal region of the upper mirror.
The as-grown crystal boule is shown in Fig. 1c and d. The boule was about 4 mm in diameter and about 30 mm in length. Previous literature on crystal growth of the Li-richer LLNZO indicates that the growth tends to be along a random direction with low index numbers.5 A clear distinction can be made between parallel-rotated and counter-rotated segments (Fig. S2†). Though the parallel-rotated segments appear cloudy and opaque, the counter-rotated segment is colorless and transparent due to better mixing in the melt during growth, especially the 10 mm-long portion toward the end of the crystal boule. Comparing top-lighting and back-lighting images under an optical microscope shows a monolithic domain in the top counter-rotated segment and polycrystalline domains in the lower counter-rotated segments.
Molten zone instability was often encountered during floating-zone crystal growth. A representative series of time-elapsed images of an unstable molten zone and its restoration are shown in Fig. 2. The zone was quickly solidifying, became narrow, and the height decreased (Fig. 2a). To restore stability, the power shutter aperture was increased, which led to the rapid melting of the feed rod and crystal boule regions bordering the molten zone, shown by the molten zone expanding above and below the optical range marked by white arrows (Fig. 2b). A ring of solid was even observed between the previously narrowed zone and the newly melted band immediately above the solid ring. This expanded molten zone can easily collapse by overcoming the surface tension that maintains the shape of the molten zone, as seen by the normally concave molten zone profile transitioning to a convex profile (Fig. 2c). The downward translation of the feed rod was then slowed to stretch the molten zone (Fig. 2c) and restore it to a stable shape (Fig. 2d).
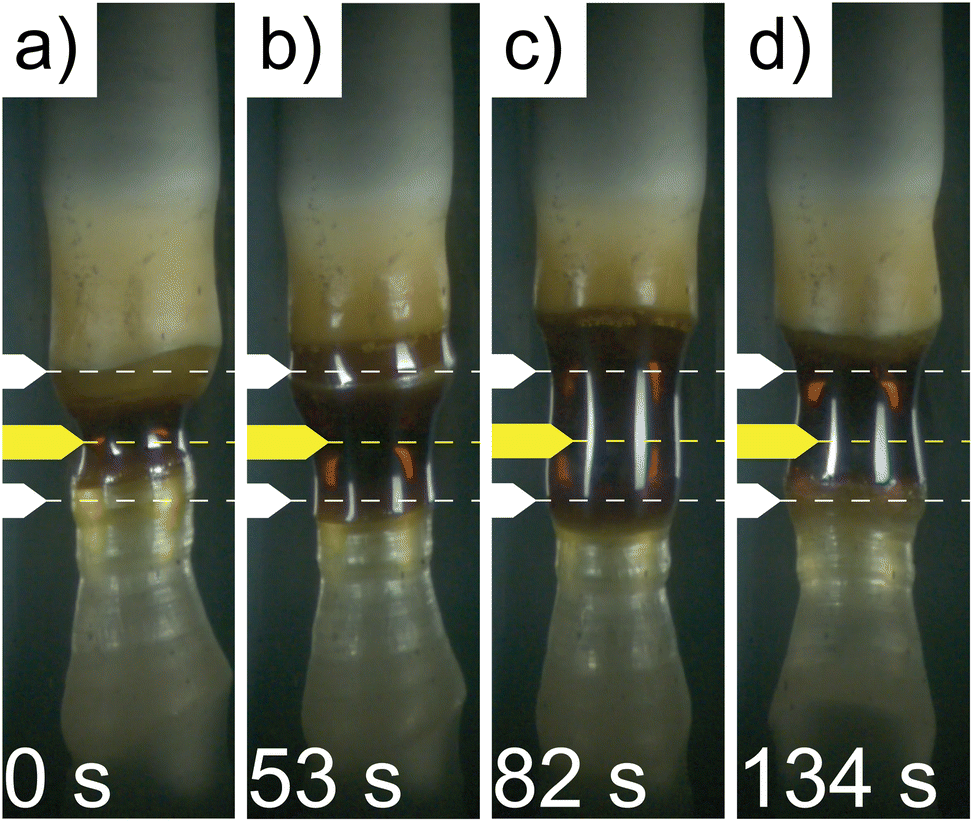 | ||
| Fig. 2 Representative time-elapse images of unstable molten zone during crystal growth. (a) Narrow, unstable molten zone. (b) The molten zone quickly expanded after the lamp power was increased. (c) The speed of downward feed rod translation was reduced to stretch and stabilize the expanded molten zone. (d) Restored stable molten zone. White labels mark the optical range border, the yellow label points toward upper mirror focal point. | ||
Inductively coupled plasma atomic emission spectroscopy (ICP-AES) elemental analysis was performed on a ground crystal piece to verify the relative amounts of Li, La, Nb, and Zr, which were determined to be 4.35, 47.6, 14.9, and 5.21 wt%, respectively. Due to errors in gross weight, the absolute values are less relevant than the relative ratios, which correspond to atomic ratios of 5.49:3.00:1.40:0.5 (Li:La:Nb:Zr) (Table 1) and are close to the expected 5.5:3.0:1.5:0.5 based on the chemical formula.
| Element | Wta (%) | Atomic ratiob |
|---|---|---|
| a Absolute weight percentages of Li, La, Nb, and Zr are less meaningful as the sample can absorb moisture during handling and initial weighing. b Atomic ratios of Li, La, Nb, and Zr from ICP-AES analysis are calculated by normalizing Zr to 0.5. | ||
| Li | 4.35 | 5.49 |
| La | 47.6 | 3.00 |
| Nb | 14.9 | 1.40 |
| Zr | 5.21 | 0.5 |
Crystal structure and Li distribution
Crystals were cleaved from the transparent counter-rotated rod and used for powder X-ray and single-crystal neutron diffraction measurements. Rietveld refinement of the powder diffraction pattern based on the Iad space group was performed to verify the phase purity of the Li5.5-LLNZO sample (bank 1 in Fig. 3, banks 2 and 3 in Fig. S3 and S4,† respectively). The refinement results are summarized in Table 2.
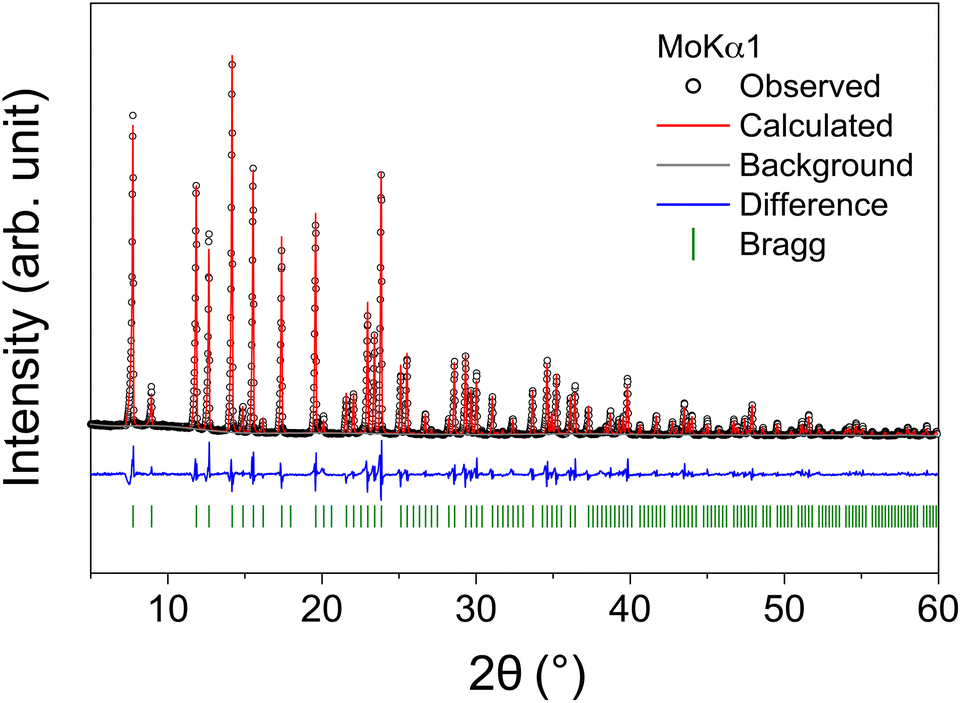 | ||
| Fig. 3 Rietveld refinement of X-ray powder diffraction pattern for Li5.5-LLNZO. The experimental data are shown as black circles, the calculated pattern in red, the difference profile in blue, and calculated Bragg reflection positions in green. | ||
d (#230), with wR = 12.9%, and GOF = 3.613
| Atom | X | Y | Z | Occ. | U eq [Å2] | Site |
|---|---|---|---|---|---|---|
| Li1 | 0.37500 | 0.00000 | 0.25000 | 0.58330 | 0.18400 | 24d |
| Li2 | 0.09720 | 0.68680 | 0.57900 | 0.31250 | 0.62110 | 96h |
| La | 0.12500 | 0.00000 | 0.25000 | 1.00000 | 0.00630 | 24c |
| Zr | 0.00000 | 0.00000 | 0.00000 | 0.75000 | 0.00330 | 16a |
| Nb | 0.00000 | 0.00000 | 0.00000 | 0.25000 | 0.00330 | 16a |
| O | 0.03179(26) | 0.04895(30) | 0.14478(31) | 1.00000 | 0.0060(11) | 96h |
Scanning electron microscopy (SEM) imaging of a polished crystal plate demonstrated the absence of voids and grain boundaries, as only scratches and debris from the polishing process were observed (Fig. S5†). To confirm that a single crystal was grown, a two-axis X-ray diffractometer in Bragg–Brentano geometry was used to measure a ∼3 × 1 × 1 mm3 polished crystal plate taken from the counter-rotated segment (Fig. S6†). Only the (752) peak was observed from the top crystal surface, which confirmed the single-crystal nature of the plate and that a monolithic domain in the boule is at least ∼1 mm-sized.
Because neutron scattering of Li has higher contrast with respect to La, Nb, Zr, and O compared to X-rays, Laue neutron single-crystal diffraction at room temperature was used to gain detailed structural insights about the Li-ion sublattice and determine the Li stoichiometry. Representative Laue images are shown in Fig. 4a and b. The sharp reflections and intensity profile indicate high crystal and data quality. The Laue neutron diffraction spots were successfully indexed with a cubic unit cell and space group Iad (#230) (Table S1†). No additional reflections of significant intensity indicating lower symmetry, such as I![[4 with combining macron]](https://www.rsc.org/images/entities/char_0034_0304.gif) 3d (#220) or I213 (#199), were observed. The refined atomic coordinates, site occupancies, and equivalent isotropic displacements were determined (Table 3) along with the anisotropic thermal displacement parameters (Table 4). Since Laue technique cannot accurately determine unit cell parameters, they are fixed to the values determined from the X-ray powder data.51 The refined structural model is shown in Fig. 5a. Two distinct Li coordination environments were observed: tetrahedral Li1 and octahedral Li2 sites. While splitting Li2 site occupancy led to significantly better refinement statistics, splitting of Li1 site occupancy from 24d into 96h did not improve the refinement reliability values and Li1 remained close to 24d within one estimated standard deviation. The Li site anisotropic thermal displacements are visualized in the left half of Fig. 5b. The Li ellipses are elongated in the octahedral site along the Li2–Li2 direction but flattened in the tetrahedral site with density equally stretched towards the four nearby octahedral sites. Unconstrained refinement of Li occupancies indicates that the Li1 site is 68% occupied while the Li2 site is 29.7% occupied, adding up to 5.60(11) Li per formula unit which agrees well with the target stoichiometry and the chemical analysis results. The maximum entropy method (MEM) was used because it reduces noise in the 3D densities by maximizing the information entropy. The obtained Li nuclear density iso-surfaces are overlaid on the refined Li anisotropic ellipses and viewed down the [001] direction in Fig. 5b (right half). A color-coded 2D nuclear density map in parallel to a possible Li-ion diffusion pathway along Li1–Li2–Li1–Li2–Li1 is shown in Fig. 5c. The split sites of Li2 have the same nuclear density but appear different in the color-coded map because they are slightly tilted out of the Li1–Li1 direction. This method demonstrates overlapping and continuous Li density at a surface threshold of 0.399 fm Å−3 between the two split sites within one octahedron whereas the density becomes disconnected between the tetrahedral Li1 and the octahedral Li2 sites, suggesting that Li ions are highly delocalized between split Li2 sites whereas the migration between Li1 and Li2 sites is significantly more hindered. The Li nuclear density along the Li2–Li1–Li2–Li1–Li2 direction based on the MEM results is shown in Fig. 5d. The nuclear density between the two split Li2 sites is significantly higher than between Li1–Li2 sites. We can further estimate the one-particle potential or migration barrier between the two split Li2 sites based on Boltzmann statistics. Assuming the nuclear density distribution is a probability field, we apply the following equation:
3d (#220) or I213 (#199), were observed. The refined atomic coordinates, site occupancies, and equivalent isotropic displacements were determined (Table 3) along with the anisotropic thermal displacement parameters (Table 4). Since Laue technique cannot accurately determine unit cell parameters, they are fixed to the values determined from the X-ray powder data.51 The refined structural model is shown in Fig. 5a. Two distinct Li coordination environments were observed: tetrahedral Li1 and octahedral Li2 sites. While splitting Li2 site occupancy led to significantly better refinement statistics, splitting of Li1 site occupancy from 24d into 96h did not improve the refinement reliability values and Li1 remained close to 24d within one estimated standard deviation. The Li site anisotropic thermal displacements are visualized in the left half of Fig. 5b. The Li ellipses are elongated in the octahedral site along the Li2–Li2 direction but flattened in the tetrahedral site with density equally stretched towards the four nearby octahedral sites. Unconstrained refinement of Li occupancies indicates that the Li1 site is 68% occupied while the Li2 site is 29.7% occupied, adding up to 5.60(11) Li per formula unit which agrees well with the target stoichiometry and the chemical analysis results. The maximum entropy method (MEM) was used because it reduces noise in the 3D densities by maximizing the information entropy. The obtained Li nuclear density iso-surfaces are overlaid on the refined Li anisotropic ellipses and viewed down the [001] direction in Fig. 5b (right half). A color-coded 2D nuclear density map in parallel to a possible Li-ion diffusion pathway along Li1–Li2–Li1–Li2–Li1 is shown in Fig. 5c. The split sites of Li2 have the same nuclear density but appear different in the color-coded map because they are slightly tilted out of the Li1–Li1 direction. This method demonstrates overlapping and continuous Li density at a surface threshold of 0.399 fm Å−3 between the two split sites within one octahedron whereas the density becomes disconnected between the tetrahedral Li1 and the octahedral Li2 sites, suggesting that Li ions are highly delocalized between split Li2 sites whereas the migration between Li1 and Li2 sites is significantly more hindered. The Li nuclear density along the Li2–Li1–Li2–Li1–Li2 direction based on the MEM results is shown in Fig. 5d. The nuclear density between the two split Li2 sites is significantly higher than between Li1–Li2 sites. We can further estimate the one-particle potential or migration barrier between the two split Li2 sites based on Boltzmann statistics. Assuming the nuclear density distribution is a probability field, we apply the following equation:
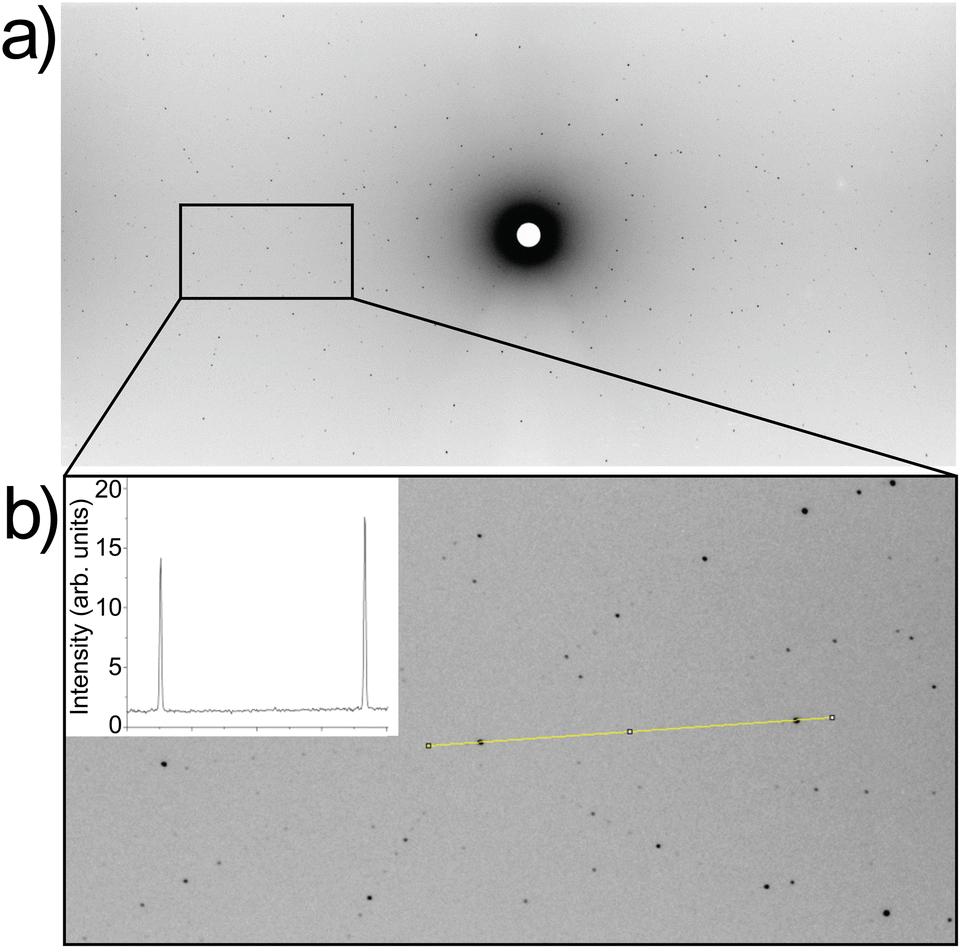 | ||
| Fig. 4 (a) Representative Laue neutron diffraction image for Li5.5-LLNZO. (b) Enlarged area indicated in (a). Intensity profile through several selected reflections highlighted in yellow is shown in inset, illustrating high crystal and data quality. | ||
d (#230) and a = 12.8341(7) Å, V = 2113.9(2) Å3 from powder XRD
| Atom | X | Y | Z | Occ. | U eq [Å2] | Site |
|---|---|---|---|---|---|---|
| a Fixed to the value from Kataoka, et al.36 | ||||||
| Li1 | 0.75 | 0.125 | 0 | 0.68(2) | 0.0355(16) | 24d |
| Li2 | 0.6505(5) | 0.1743(5) | 0.0624(5) | 0.297(8) | 0.026(2) | 96h |
| La | 0.25 | 0.125 | 0 | 1 | 0.00994(12) | 24c |
| Nb/Zr | 0.25 | 0.25 | 0.25 | 0.75/0.25 | 0.0024a | 16a |
| O | 0.19831(4) | 0.28014(4) | 0.10395(4) | 1 | 0.01321(12) | 96h |
| Atom | U 11 (Å2) | U 22 (Å2) | U 33 (Å2) | U 12 (Å2) | U 13 (Å2) | U 23 (Å2) |
|---|---|---|---|---|---|---|
| Li1 | 0.046(3) | 0.015(3) | 0.046(3) | 0 | 0 | 0 |
| Li2 | 0.037(5) | 0.017(3) | 0.023(3) | −0.012(3) | −0.017(3) | 0.000(2) |
| La | 0.00887(17) | 0.0121(3) | 0.00887(17) | 0 | 0.0022(2) | 0 |
| O | 0.0144(2) | 0.0141(2) | 0.0111(2) | 0.00152(16) | 0.00002(17) | 0.00055(17) |
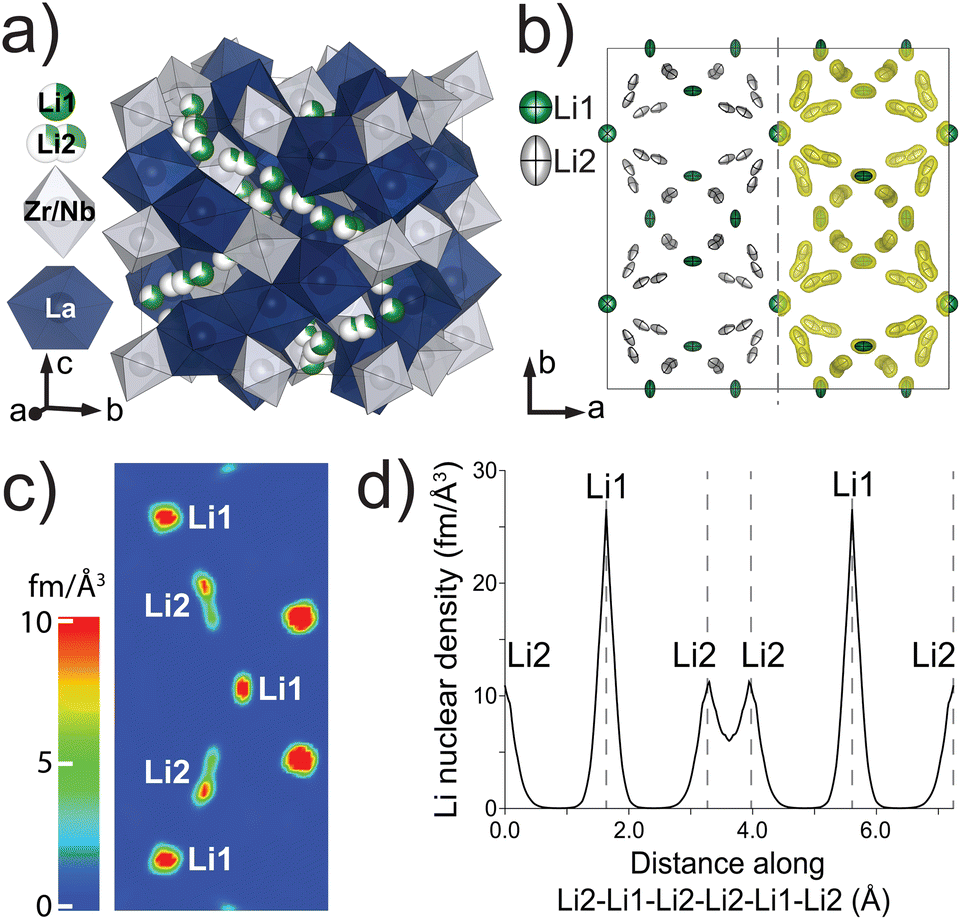 | ||
| Fig. 5 (a) Unit cell structure for Li5.5-LLNZO determined from neutron single-crystal diffraction. (b) (Left) Anisotropic thermal displacements of Li sites. (Right) Nuclear density iso-surfaces (0.399 fm Å−3) based on MEM analysis overlaid on displacement ellipsoids. (c) 2D nuclear density map from MEM analysis through Li1–Li1–Li1 direction. (d) MEM-determined Li nuclear density along Li2–Li1–Li2–Li2–Li1–Li2 direction. | ||
Synchrotron single-crystal diffraction revealed additional Bragg reflections that should otherwise be absent for an Iad space group, as shown in Fig. 6 in the hk0 plane. These include hk0 with h + k = 2n and h00 or 0k0 with h or k = 4n + 2, respectively, which together indicate a lower-symmetry and non-centrosymmetric space group I213 (#199), as observed in single-crystal Li6.5La3Zr1.5Nb0.5O12. Note that the streaks spiraling from some Bragg spots are detector artifacts. Symmetry lowering was also observed in Ga-doped LLZOs with space group I3d, but in their diffraction images we noticed a few h00/0k0 spots with h or k = 4n + 2 appearing with minimal intensity near the center, which would indicate an I213 space group but were likely too weak to change the refinement.57 The additional reflections we saw are two to three orders of magnitude weaker than other Bragg reflections from Iad, so the detector used was sensitive to low intensity but saturated at the stronger Bragg spots. Such symmetry lowering was not detected by neutron Laue diffraction because of the white beam and the resulting peak overlap. For example, a (101) reflection, if present, would overlap with (202) because the wavelength that fulfills Bragg's law for the former is exactly twice that for the latter, both of which are present in the Laue beam. Among high-index reflections that correspond to unique wavelengths in the white beam that has nearly zero intensity below 0.6 Å, we did not observe any reflections with significant intensity (I > 3σ) that breaks the Iad symmetry. Given that our single-crystal sample was never exposed to moisture and is free from Li-substituting dopants such as Ga3+, the symmetry lowering, which is observed in Li contents ranging from Li5La3Nb2O12 (ref. 58) to our Li5.5-LLNZO and in Li-richer LLNZOs, is more universal than previously thought and might arise from a second-order Jahn Teller (SOJT) effect of d0 elements such as Nb5+ and Zr4+.59 While the NbO6/ZrO6 octahedra are fully symmetrical for the Iad space group, they are distorted along the C3 axis in the I213 space group according to one of the various d0 SOJT scenarios outlined by Goodenough60 in Fe-61 or Ga-doped62 LLZOs, or in hydrated LLZOs.63
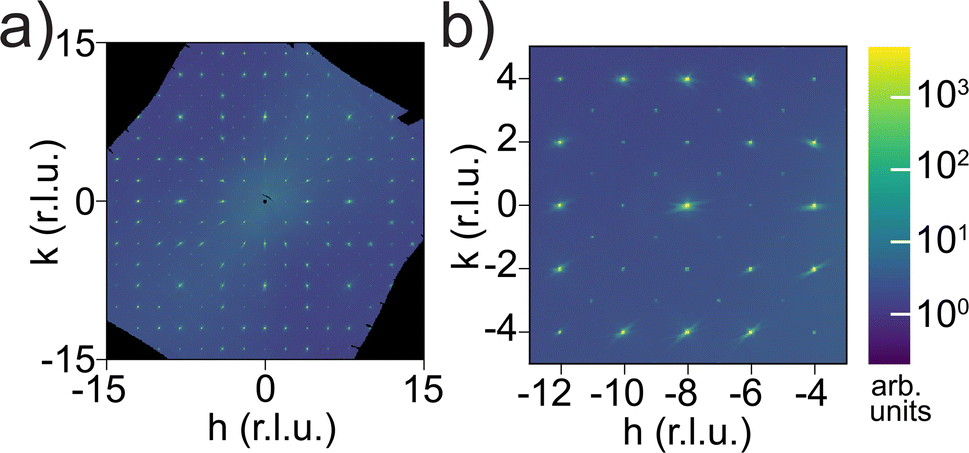 | ||
| Fig. 6 (a) Synchrotron single crystal scattering pattern for Li5.5–LLNZO in the hk0 plane. (b) Enlarged region of hk0 scattering plane showing additional Bragg reflections in hk0 with h + k = 2n and in h00 or 0k0 with h or k = 4n + 2. | ||
Ionic conductivity and dielectric measurements
Alternating current electrochemical impedance spectroscopy (AC EIS) was used to measure the Li-ion conductivity σ of a single-crystal segment of Li5.5-LLNZO in Ar atmosphere. Fig. 7a shows a Nyquist plot of Li5.5-LLNZO at 296.3 K with a single semicircle in the high-frequency region, indicating the absence of any grain boundary impedance. The data at 296.3 K was fit to an equivalent circuit consisting of one constant phase element (CPE) and resistor in parallel to account for bulk impedance with another CPE for ion-blocking electrode capacitance. The room-temperature Li-ion conductivity in Li5.5La3Nb1.5Zr0.5O12 was estimated to be 1.37 × 10⁻⁴ S cm−1. EIS spectra were also taken on the same crystal from 303.2–343.2 K in 5.0 K increments. The Li-ion conductivity was calculated at each temperature point with the aforementioned data fitting method. From the line of best fit in the Arrhenius plot of the relationship between temperature and ionic conductivity (Fig. 7b), the activation energy for Li5.5-LLNZO was estimated to be 0.50 eV, and the EIS measurements at each temperature point are shown in Fig. 7c and d. In addition, the d.c. polarization curves were measured as a function of time for a series of voltages (Fig. S7a†). The steady-state current values after relaxation (Fig. S7b†) were used to calculate the electronic conductivity σe = 5.89 × 10⁻⁹ S cm−1 from Ohm's law, confirming that Li5.5-LLNZO is electronically insulating.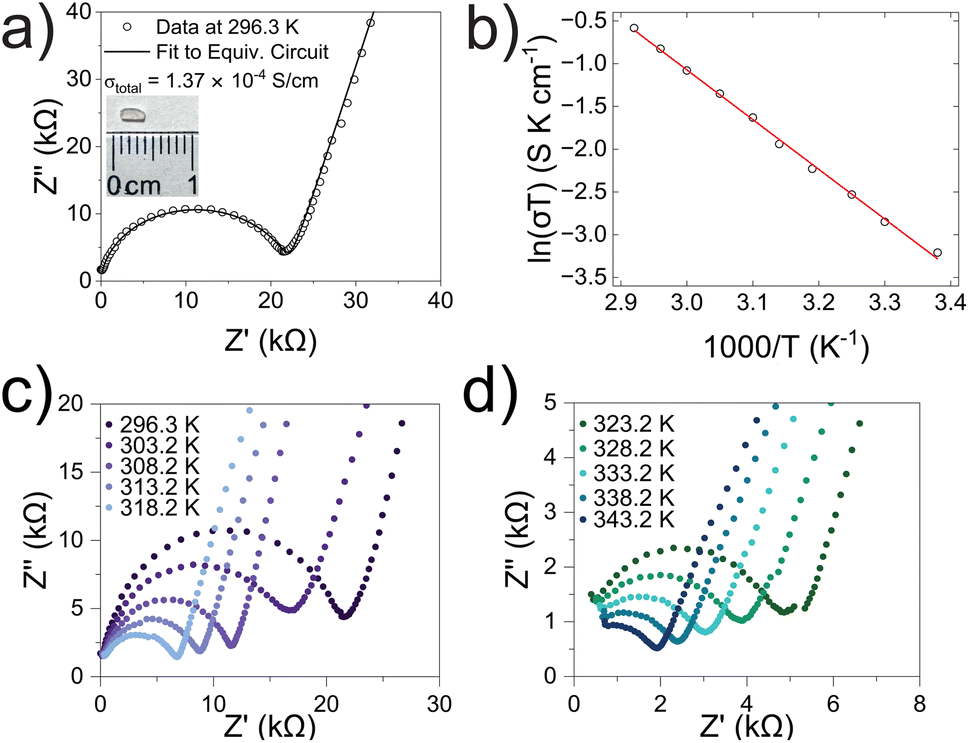 | ||
| Fig. 7 (a) Nyquist plot of Li5.5La3Nb1.5Zr0.5O12 single-crystal sample from EIS in argon atmosphere at 296.3 K. (Inset) Polished crystal plate for EIS measurements. (b) Arrhenius relationship and line of best fit for ln(σT) vs. 1000/T impedance data from 296.3 to 343.2 K (R2 = 0.998). Data shown as black circles, linear fit in red. (c and d) EIS spectra at progressive temperature points from 296.3 to 343.2 K. | ||
In solid-state electrolytes, the diffusion of Li ions (or vacancies) in the short range is equivalent to a re-orientation process of electric dipoles. This mechanism can be studied by dielectric relaxation measurements, which were performed on a second crystal plate from the same region in the crystal boule as that used for EIS. The temperature-variant dielectric constant ε′ and dissipation ε′′ between 3 to 400 K at various frequencies is plotted in Fig. 8a and b. The dielectric constant and dielectric loss tangent as a function of frequency at various temperatures are included in Fig. S5 and S6.† The peak position of the dielectric loss tangent shifted to higher frequencies as temperature increased, indicating that this peak corresponds to dipolar relaxation, the dielectric loss that results from polarization of dipoles. A dissipation peak superimposed on a temperature-dependent background was observed at roughly 281 K at a measuring frequency of 5000 Hz. The peak gradually shifted to higher temperatures as the frequency was increased to 2 MHz, suggesting that the origin of this peak must be a thermally-activated process. The stepwise increase in dielectric constant, which is frequency-dependent and accompanied by a peak structure in loss, serves as a signature of the relaxation behavior of carrier charges.64 Between 3 K and 200 K, most charges contributing significantly to the dielectric constant are frozen out, leading to a substantial reduction in the sample's dielectric constant and a small loss value, with only molecular dipole fluctuations remaining. As the temperature rises above 200 K, mobile charges—specifically Li ions in Li5.5-LLNZO—begin to migrate to different sites. This migration is highly responsive to electric fields, leading to a significant and irreversible increase in both the dielectric constant and loss. Above 350 K, additional charges—possibly electrons in the conduction band or interfacial charges between the sample and the ion-blocking electrode—become more prevalent. Arrhenius fitting was applied to the frequency vs. peak temperature relationship to obtain the relaxation parameters, shown in Fig. 8c. From the Arrhenius fitting, the activation energy of dipolar relaxation/rotation Ea was estimated to be 0.47 eV, which is very close to the energy barrier of 0.50 eV estimated based on EIS. This similarity indicates that the thermally-activated dielectric relaxation process is associated with Li-ion diffusion. A fitted pre-exponential factor of 1.47 × 10¹² Hz is therefore interpreted as the migration attempt rate of Li ions. Together with EIS and MEM analysis, the activation energy is attributed to the migration barrier between the Li1 and Li2 sites.
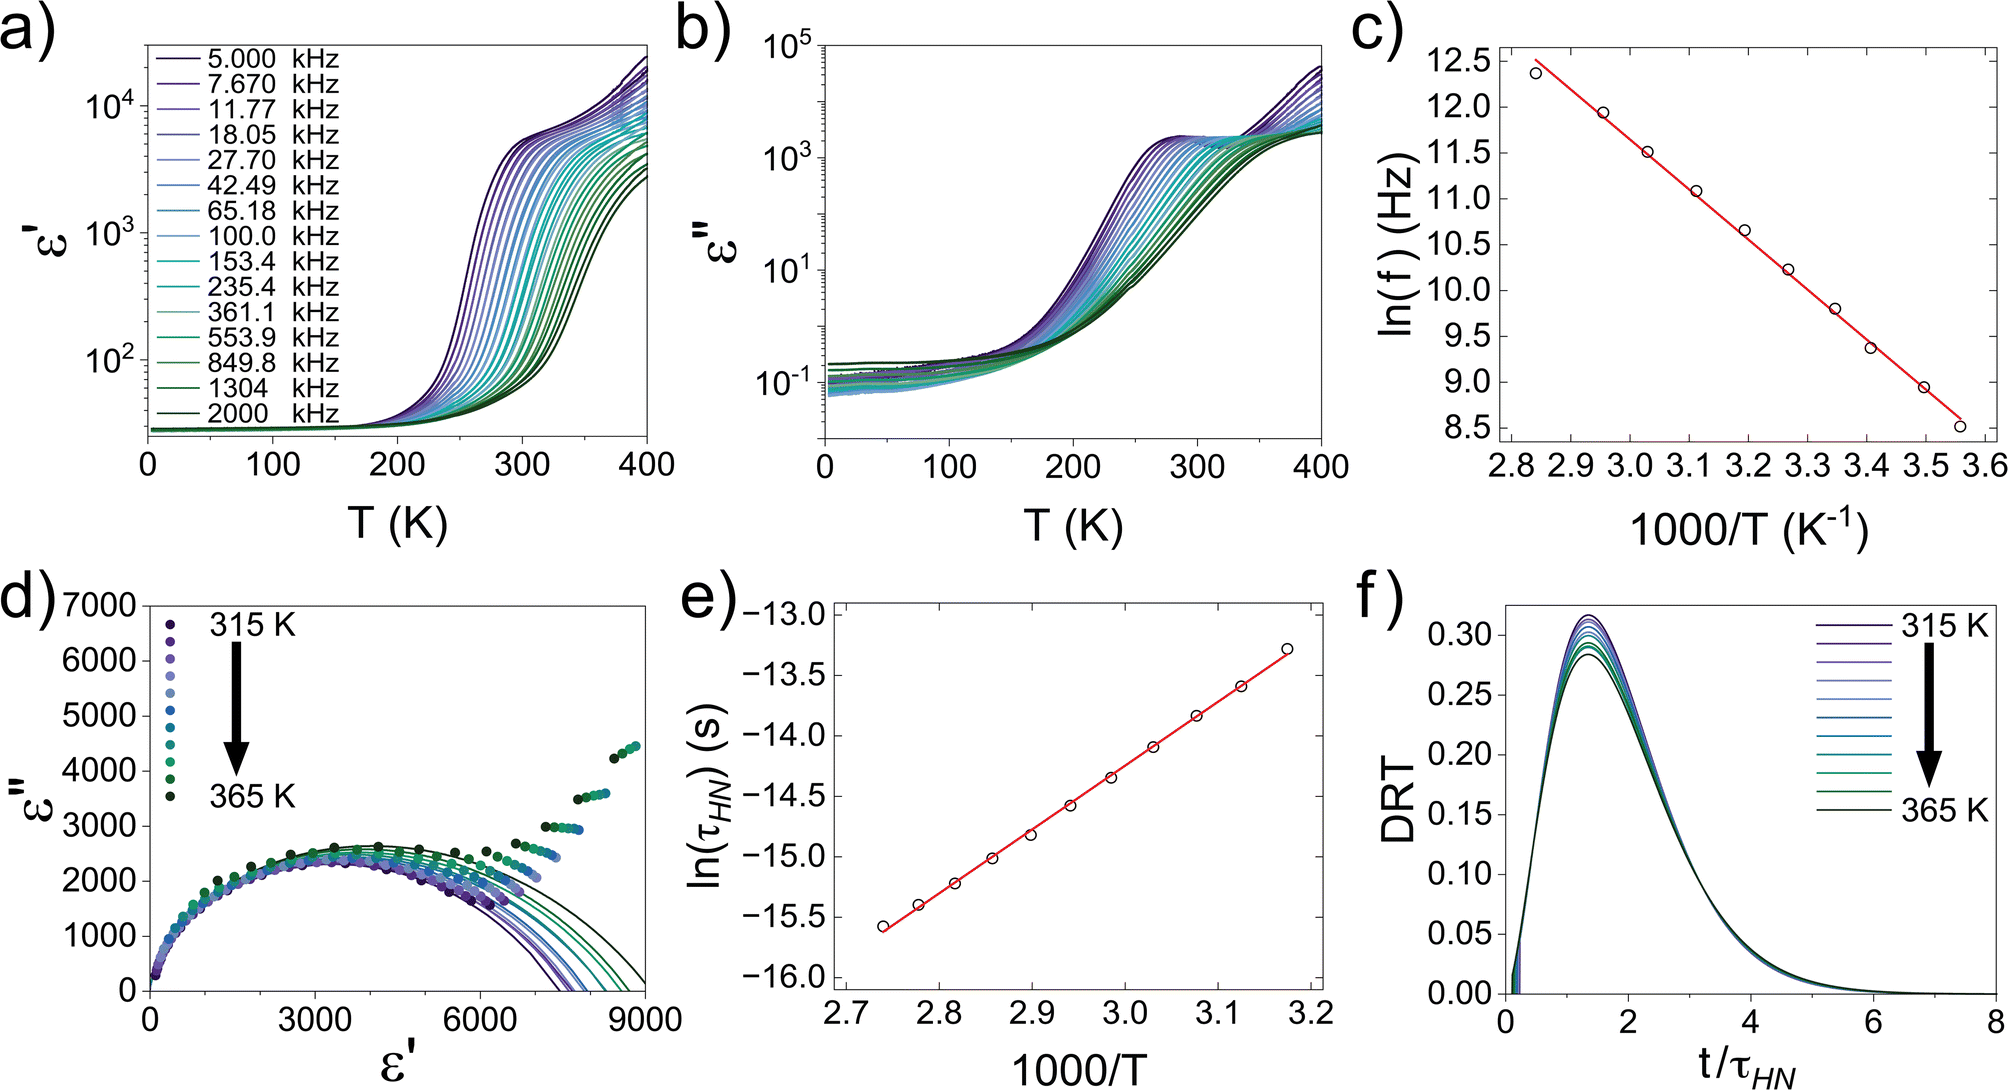 | ||
| Fig. 8 (a) Dielectric constant (ε′) and (b) dissipation (ε′′) of single crystal Li5.5-LLNZO as a function of temperature at frequencies from 5–2000 kHz. (c) Arrhenius fitting of frequency vs. temperature (R2 = 0.997). Data shown as black circles, linear fit in red. (d) Cole–Cole plots of the complex dielectric constant from 315–365 K in 5 K increments (symbols) and Havriliak–Negami function fittings (lines). (e) Arrhenius fitting of Havriliak–Negami relaxation time τHNvs. temperature from 315–365 K (R2 = 0.998). Data shown as black circles, linear fit in red. (f) Distribution of relaxation time (DRT) as a function of time normalized to Havriliak–Negami relaxation time τHN from 315–365 K in 5 K increments. | ||
The hopping conduction mechanism can be used to model Li-ion diffusion. Li-ion motion drags a negative counter-charge cloud. Successful Li-ion transport only occurs if this polarization cloud follows the Li-ion migration, which occurs over a temperature-dependent dielectric relaxation time τ. If the external electric field frequency f is faster than 1/τ, the external field suppresses Li-ion transport with a static polarization cloud that supports Li ions hopping back toward their initial positions. This suppression of polarization and opposition to Li-ion migration decreases the complex dielectric constant. Conversely, if f is less than 1/τ, the external field supports Li-ion transport with a dynamic polarization cloud that supports Li ions hopping away from their initial positions. This induced polarization supports Li-ion migration and increases the complex dielectric constant.64,65 Because of this direct correlation between polarization and Li-ion conduction, the relaxation time across a range of temperatures is technically important because it characterizes the dynamics of Li-ion migration.
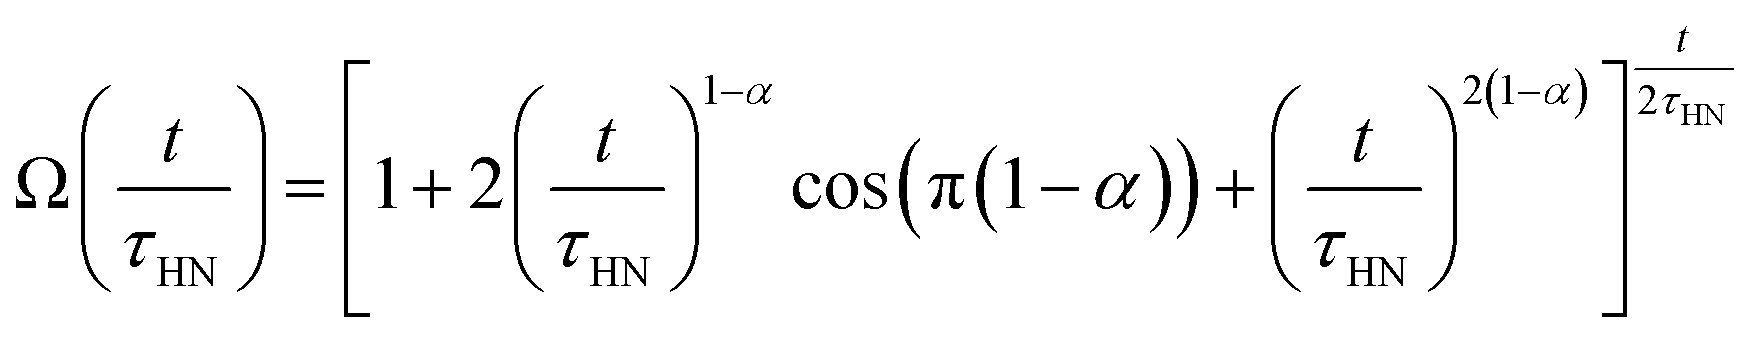
We extracted the temperature-dependent distribution of relaxation time by fitting the high-frequency region semi-circles of the ε′ vs. ε′′ plot with the Havriliak–Negami equation (Fig. 8d):66,67
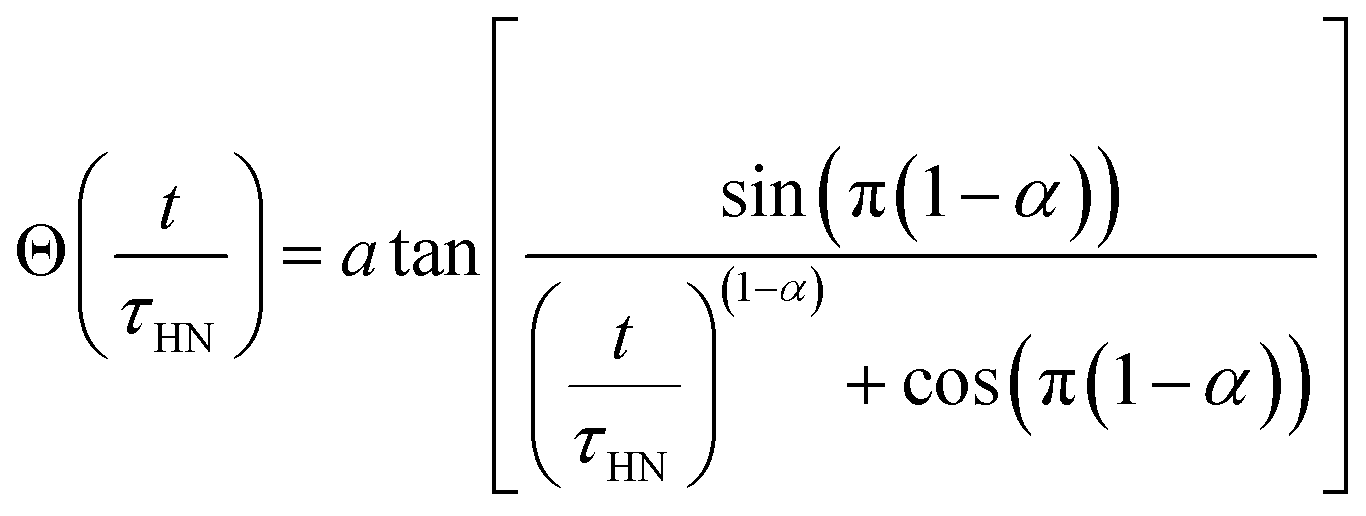
The obtained Havriliak–Negami relaxation time τHN as a function of temperature (Fig. 8e) decreases as the temperature increases, confirming the thermally-activated process of Li ion transport shown by the Arrhenius behavior of the external electric field frequency demonstrated in Fig. 8c. From the Arrhenius behavior of τHN, the migration energy Em associated with the Li-ion reorientation process of 0.46 eV and the pre-exponential factor τ0 of 8.55 × 10⁻¹⁴ s were determined. Using the exponents α and γ in the Havriliak–Negami equation, the distribution of relaxation time (DRT) as a function of time t can be calculated from the following set of equations:66,67
The DRTs at various temperatures were derived with this method and are presented in Fig. 8f. Compared to EIS, the DRTs have higher resolution toward relaxation processes with comparable time scales. With the current resolution, only one peak (process) was observed and can be assigned to bulk Li diffusion without any grain boundary contribution. The increased dispersion of the DRT with increased temperature appears to be correlated with higher Li thermal displacements and increased site disorder.
While we were able to successfully grow a centimeter-long single crystal of the Li5.5-LLNZO garnet with the HPFZ method of sufficient size for single-crystal characterization, including single-crystal EIS and dielectric relaxation, the molten zone instability has prevented us from obtaining longer monolithic crystals as previously reported by Kataoka et al.12,16,24,68 Three major factors contributed to the instability of the molten zone. First, to minimize contamination and unwanted Li loss, we skipped the sintering step prior to floating-zone growth, a procedure previously adopted for LiFePO4 growth to minimize oxidation.69 This inevitably led to significant volume change due to densification during growth, as seen immediately above the optical range in Fig. 2. Second, due to the poor thermal transport between particles in a cold-packed rod, the initial power needed to melt the material far exceeds the power necessary to maintain the melt. To overcome this power mismatch, the shutter aperture had to be rapidly adjusted from 26.3% to 22.3% once the tip of feed rod melted to prevent fracturing due to thermal shock. During growth, fine adjustments to the power transmitted through the shutter aperture were necessary to maintain melt stability because poor inter-particle thermal transport occasionally led to a narrower or wider molten zone, as seen in Fig. 2a and c. Third, evaporative loss of 20% excess Li during crystal growth gradually coated the inside of the quartz tube sample chamber, obstructing the transmitted light power. We therefore had to increase the power shutter aperture from near 23% after initial melting of the seed rod to 28% at the end of the procedure to prevent the collapse of the molten zone. These three factors can be significantly mitigated in the future by rod pre-sintering and adding less over-stoichiometric Li to the precursor material. In addition, a twice-scanning growth could be performed to use pre-melted LLNZO as a densified feed rod and avoid crucible impurities in rod sintering.
Once the single crystal sample was obtained, the structure and Li transport properties could be unambiguously determined with high-quality characterizations. The EIS measurement showed a room temperature conductivity of Li5.5-LLNZO of 1.37 × 10⁻⁴ S cm−1, which is comparable to the reported bulk conductivity of powder Li5.5La3Ta1.5 Zr0.5O12 (Li5.5-LLTZO, 1.03 × 10⁻⁴ S cm−1) but higher than the total conductivity of powder Li5.5-LLTZO (8.0 × 10⁻⁵ S cm−1) because of the absence of grain boundaries in our single crystal samples. Similarly, the measured Li migration barrier of 0.47–0.50 eV is lower than that of powder Li5.5-LLTZO (0.536 eV for bulk, 0.561 eV total).25
Our ionic conductivity is compared to single-crystal ionic conductivity measurements reported by Kataoka et al. in Fig. 9, including analysis of both LLNZO and LLTZO systems.12,26 The ionic conductivity appears to follow an exponential increase with nominal Li content up to 6.5–6.6 Li per f.u. (open red circles and triangles in Fig. 9). The Li occupancy in octahedral and tetrahedral sites of Li5.5-LLNZO as resolved by neutron single-crystal Laue diffraction fall along a generally linear trend of decreasing tetrahedral occupancy and increasing octahedral occupancy as the Li content increases (grey and blue ellipses in Fig. 9, respectively)16,22,24,25,27,28 until the reported cubic-to-tetragonal phase transition at the highest Li contents.12,25 Notably, site splitting of the tetrahedral Li2 site was reported with a Wyckoff position of 96h from structural refinement of neutron diffraction of the cubic-phase single crystal of Li6.5La3Nb0.5Zr1.5O12 (Li6.5-LLNZO) made by Kataoka et al.;5 in contrast, neutron diffraction on our Li5.5-LLNZO sample in the same series refines favorably without the Li1 site splitting, resulting in a Wyckoff position of 24d.24 Higher Li content in Li6.5-LLNZO likely results in stronger Li-ion interactions that push Li ions away from the potential well minimum in the tetrahedral site and give rise to correlated Li-ion motion and higher ionic conductivity compared to Li5.5-LLNZO.
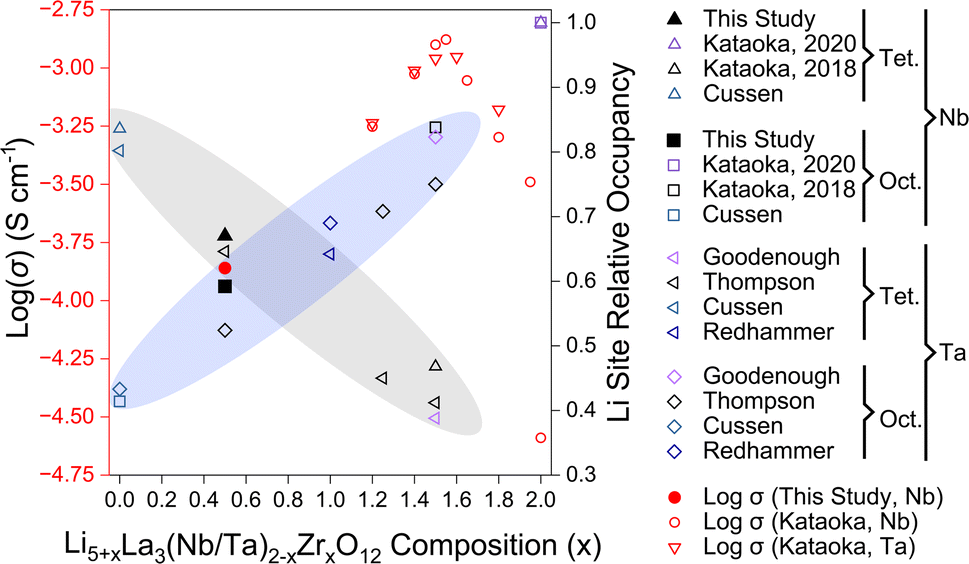 | ||
| Fig. 9 Relationship between composition, log(σ) at room temperature,12,26 and tetragonal (Tet) and octahedral (Oct) Li site occupancy16,22,24,25,27,28 for Nb-substituted Li5+xLa3Nb2−xZrxO12 (LLNZO) and Ta-substituted Li5+xLa3Ta2−xZrxO12 (LLTZO) compositions from x = 0 to x = 2. Trend in cubic LLNZO and LLTZO octahedral site occupancy increasing with Li content illustrated with blue ellipse and tetragonal site occupancy decreasing with increasing Li content illustrated with grey ellipse. The log(σ) at room temperature for LLNZO and LLTZO compositions are highlighted in red. | ||
Conclusions
We have successfully grown single crystals of Li5.5La3Zr1.5Nb0.5O12 in a class of promising solid-state Li-ion conductors by using a single lamp high-pressure floating-zone furnace. The shutter aperture on the furnace was critical for the control of power to maintain a molten zone without prior rod sintering. The largest crystal obtained was 10 mm in length and 4 mm in diameter, a sufficient size for a series of single-crystal characterizations. The crystal structure, especially the Li-ion sublattice, was resolved by neutron single-crystal Laue diffraction and MEM analysis to reveal nuclear density distribution and the bottlenecks in Li-ion migration pathways. Due to high crystal quality and absence of grain boundaries in our single crystal, EIS and dielectric relaxation measurements showed higher ionic conductivities and lower Li-ion migration barriers at room temperature compared to the reported powder Li5.5La3Ta0.5Zr1.5O12.Data availability
Additional data related to the chemcrystal growth is available at https://doi.org/10.34863/p4xm-q156. Crystallographic data for Li5.5La3Ta0.5Zr1.5O12 has been deposited at the CCDC website under [2285952].†Author contributions
Caleb Ramette: data curation, formal analysis, investigation, methodology, validation, visualization, original draft, review and editing. Lucas Pressley: investigation, methodology, review and editing. Maxim Avdeev: data curation, formal analysis, investigation, visualization, review and editing. Minseong Lee: data curation, formal analysis, investigation, visualization, review and editing. Satya Kushwaha: supervision, visualization, review and editing. Matthew Krogstad: data curation, investigation, validation, visualization, review and editing. Suchismita Sarker: investigation, review and editing. Paul Cardon: investigation. Jacob Ruff: supervision, review and editing. Mojammel Khan: investigation, methodology, supervision. Kunimitsu Kataoka: methodology, review and editing. Tyrel McQueen: funding acquisition, project administration, resources, supervision. Huiwen Ji: conceptualization, funding acquisition, methodology, project administration, resources, supervision, visualization, review and editing.Conflicts of interest
There are no conflicts to declare.Acknowledgements
This work made use of the bulk crystal growth facility of the NSF's Platform for the Accelerated Realization, Analysis, and Discovery of Interface Materials (PARADIM), which is supported by the National Science Foundation under Cooperative Agreement No. DMR-2039380. C. R. and H. J. acknowledge funding provided by NSF Career Grant 2145832 and The University of Utah. Acknowledgement is made to the donors of the American Chemical Society Petroleum Research Fund for partial support of this research. A portion of this work was performed at the National High Magnetic Field Laboratory, which is supported by National Science Foundation Cooperative Agreement No. DMR-2128556, the State of Florida, and the U.S. Department of Energy. Research conducted at the Center for High-Energy X-ray Science (CHEXS) is supported by the National Science Foundation (BIO, ENG and MPS Directorates) under award DMR-1829070.Notes and references
- Q. Yang and C. Li, Energy Storage Mater., 2018, 14, 100–117 CrossRef
.
- K. Xu, Chem. Rev., 2014, 114, 11503–11618 CrossRef
- Z. Zhang, Y. Zhao, S. Chen, D. Xie, X. Yao, P. Cui and X. Xu, J. Mater. Chem. A, 2017, 5, 16984–16993 RSC
- J. Janek and W. G. Zeier, Nat. Energy, 2016, 1 Search PubMed
- K. Kataoka and J. Akimoto, ChemElectroChem, 2018, 5, 2551–2557 CrossRef CAS
- F. Han, A. S. Westover, J. Yue, X. Fan, F. Wang, M. Chi, D. N. Leonard, N. J. Dudney, H. Wang and C. Wang, Nat. Energy, 2019, 4, 187–196 CrossRef CAS
- A. Banerjee, X. Wang, C. Fang, E. A. Wu and Y. S. Meng, Chem. Rev., 2020, 120, 6878–6933 CrossRef CAS
- W. D. Richards, L. J. Miara, Y. Wang, J. C. Kim and G. Ceder, Chem. Mater., 2016, 28, 266–273 CrossRef CAS
- Y. Zhu, X. He and Y. Mo, J. Mater. Chem. A, 2016, 4, 3253–3266 RSC
- R. Murugan, V. Thangadurai and W. Weppner, Angew. Chem., Int. Ed., 2007, 46, 7778–7781 CrossRef CAS
- R. Murugan, W. Weppner, P. Schmid-Beurmann and V. Thangadurai, Mater. Sci. Eng., B, 2007, 143, 14–20 CrossRef CAS
- K. Kataoka and J. Akimoto, Inorg. Chem., 2020, 59, 14376–14381 CrossRef CAS
- H. Buschmann, J. Dölle, S. Berendts, A. Kuhn, P. Bottke, M. Wilkening, P. Heitjans, A. Senyshyn, H. Ehrenberg, A. Lotnyk, V. Duppel, L. Kienle and J. Janek, Phys. Chem. Chem. Phys., 2011, 13, 19378–19392 RSC
- R. Jalem, M. J. D. Rushton, W. Manalastas, M. Nakayama, T. Kasuga, J. A. Kilner and R. W. Grimes, Chem. Mater., 2015, 27, 2821–2831 CrossRef CAS
- N. Hamao, K. Kataoka, N. Kijima and J. Akimoto, J. Ceram. Soc. Jpn., 2016, 124, 678–683 CrossRef CAS
- K. Kataoka and J. Akimoto, Solid State Ionics, 2020, 349, 115312 CrossRef CAS
- J. Awaka, A. Takashima, K. Kataoka, N. Kijima, Y. Idemoto and J. Akimoto, Chem. Lett., 2011, 40, 60–62 CrossRef CAS
- J. Awaka, N. Kijima, K. Kataoka, H. Hayakawa, K. ichi Ohshima and J. Akimoto, J. Solid State Chem., 2010, 183, 180–185 CrossRef CAS
- C. Galven, J.-L. Fourquet, M.-P. Crosnier-Lopez and F. Le Berre, Chem. Mater., 2011, 23, 1892–1900 CrossRef CAS
- F. Abbattista, M. Vallino and D. Mazza, Mater. Res. Bull., 1987, 22, 1019–1027 CrossRef CAS
- A. K. Baral, S. Narayanan, F. Ramezanipour and V. Thangadurai, Phys. Chem. Chem. Phys., 2014, 16, 11356–11365 RSC
- E. J. Cussen, Chem. Commun., 2006, 412–413 RSC
- S. Ohta, T. Kobayashi and T. Asaoka, J. Power Sources, 2011, 196, 3342–3345 CrossRef CAS
- K. Kataoka, H. Nagata and J. Akimoto, Sci. Rep., 2018, 8, 9965–9973 CrossRef PubMed
- T. Thompson, A. Sharafi, M. D. Johannes, A. Huq, J. L. Allen, J. Wolfenstine and J. Sakamoto, Adv. Energy Mater., 2015, 5, 1500096 CrossRef
- K. Kataoka and J. Akimoto, J. Ceram. Soc. Jpn., 2019, 127, 521–526 CrossRef CAS
- Y. Li, J. T. Han, C. A. Wang, H. Xie and J. B. Goodenough, J. Mater. Chem., 2012, 22, 15357–15361 RSC
- G. J. Redhammer, M. Meven, S. Ganschow, G. Tippelt and D. Rettenwander, Acta Crystallogr., Sect. B: Struct. Sci., Cryst. Eng. Mater., 2021, 77, 123–130 CrossRef CAS
- Y. Li, C. A. Wang, H. Xie, J. Cheng and J. B. Goodenough, Electrochem. Commun., 2011, 13, 1289–1292 CrossRef CAS
- J. Awaka, N. Kijima, H. Hayakawa and J. Akimoto, J. Solid State Chem., 2009, 182, 2046–2052 CrossRef CAS
- B. Kozinsky, S. A. Akhade, P. Hirel, A. Hashibon, C. Elsässer, P. Mehta, A. Logeat and U. Eisele, Phys. Rev. Lett., 2016, 116, 055901 CrossRef PubMed
- M. Xu, M. S. Park, J. M. Lee, T. Y. Kim, Y. S. Park and E. Ma, Phys. Rev. B: Condens. Matter Mater. Phys., 2012, 85, 052301 CrossRef
- J. Han, J. Zhu, Y. Li, X. Yu, S. Wang, G. Wu, H. Xie, S. C. Vogel, F. Izumi, K. Momma, Y. Kawamura, Y. Huang, J. B. Goodenough and Y. Zhao, Chem. Commun., 2012, 48, 9840–9842 RSC
- A. Logéat, T. Köhler, U. Eisele, B. Stiaszny, A. Harzer, M. Tovar, A. Senyshyn, H. Ehrenberg and B. Kozinsky, Solid State Ionics, 2012, 206, 33–38 CrossRef
- N. Bernstein, M. D. Johannes and K. Hoang, Phys. Rev. Lett., 2012, 109, 205702 CrossRef CAS PubMed
- V. Thangadurai, H. Kaack and W. J. F. Weppner, J. Am. Ceram. Soc., 2003, 86, 437–440 CrossRef CAS
- D. C. Dube and A. K. Saraswat, J. Appl. Phys., 1982, 53, 7095–7096 CrossRef CAS
- R. Hongahally Basappa, T. Ito, T. Morimura, R. Bekarevich, K. Mitsuishi and H. Yamada, J. Power Sources, 2017, 363, 145–152 CrossRef CAS
- Y. Tian, F. Ding, H. Zhong, C. Liu, Y. B. He, J. Liu, X. Liu and Q. Xu, Energy Storage Mater., 2018, 14, 49–57 CrossRef
- Y. Ren, Y. Shen, Y. Lin and C. W. Nan, Electrochem. Commun., 2015, 57, 27–30 CrossRef CAS
- E. J. Cheng, A. Sharafi and J. Sakamoto, Electrochim. Acta, 2017, 223, 85–91 CrossRef CAS
- A. G. Squires, D. W. Davies, S. Kim, D. O. Scanlon, A. Walsh and B. J. Morgan, Phys. Rev. Mater., 2022, 6, 085401 CrossRef CAS
- P. Gorai, T. Famprikis, B. Singh, V. Stevanović and P. Canepa, Chem. Mater., 2021, 33, 7484–7498 CrossRef CAS
- V. Thangadurai, S. Adams and W. Weppner, Chem. Mater., 2004, 16, 2998–3006 CrossRef CAS
- L. Van Wüllen, T. Echelmeyer, H. W. Meyer and D. Wilmer, Phys. Chem. Chem. Phys., 2007, 9, 3298–3303 RSC
- E. Rangasamy, J. Wolfenstine and J. Sakamoto, Solid State Ionics, 2012, 206, 28–32 CrossRef CAS
- C. A. Geiger, E. Alekseev, B. Lazic, M. Fisch, T. Armbruster, R. Langner, M. Fechtelkord, N. Kim, T. Pettke and W. Weppner, Inorg. Chem., 2011, 50, 1089–1097 CrossRef CAS PubMed
- Y. Jin and P. J. McGinn, J. Power Sources, 2011, 196, 8683–8687 CrossRef CAS
- N. Wizent, G. Behr, W. Löser, B. Büchner and R. Klingeler, J. Cryst. Growth, 2011, 318, 995–999 CrossRef CAS
- A. J. Edwards, Aust. J. Chem., 2011, 64, 869–872 CrossRef CAS
- R. O. Piltz, J. Appl. Crystallogr., 2018, 51, 635–645 CrossRef CAS
- V. Petříček, M. Dušek and L. Palatinus, Z. Kristallogr. - Cryst. Mater., 2014, 229, 345–352 CrossRef
- K. Momma, T. Ikeda, A. A. Belik and F. Izumi, Powder Diffr., 2013, 28, 184–193 CrossRef CAS
- K. Momma and F. Izumi, J. Appl. Crystallogr., 2011, 44, 1272–1276 CrossRef CAS
- M. J. Krogstad, S. Rosenkranz, J. M. Wozniak, G. Jennings, J. P. C. Ruff, J. T. Vaughey and R. Osborn, Nat. Mater., 2020, 19, 63–68 CrossRef CAS
- S. M. Koohpayeh, D. Fort and J. S. Abell, Prog. Cryst. Growth Charact. Mater., 2008, 54, 121–137 CrossRef CAS
- R. Wagner, G. J. Redhammer, D. Rettenwander, A. Senyshyn, W. Schmidt, M. Wilkening and G. Amthauer, Chem. Mater., 2016, 28, 1861–1871 CrossRef CAS
- H. Hyooma and K. Hayashi, Mater. Res. Bull., 1988, 23, 1399–1407 CrossRef CAS
- P. S. Halasyamani and K. R. Poeppelmeier, Chem. Mater., 1998, 10, 2753–2769 CrossRef CAS
-
J. B. Goodenough and J. M. Longo, in Landolt-Bornstein, ed. K. H. Hellwege and A. M. Hellwege, Springer-Verlag, Berlin, 1970, vol. 4, pp. 126–314 Search PubMed
- R. Wagner, G. J. Redhammer, D. Rettenwander, G. Tippelt, A. Welzl, S. Taibl, J. Fleig, A. Franz, W. Lottermoser and G. Amthauer, Chem. Mater., 2016, 28, 5943–5951 CrossRef CAS PubMed
- L. Robben, E. Merzlyakova, P. Heitjans and T. M. Gesing, Acta Crystallogr., Sect. E: Crystallogr. Commun., 2016, 72, 287–289 CrossRef CAS
- G. J. Redhammer, G. Tippelt and D. Rettenwander, Acta Crystallogr., Sect. C: Struct. Chem., 2022, 78, 1–6 CrossRef CAS PubMed
-
Broadband Dielectric Spectroscopy, ed. F. Kremer and A. Schönhals, Springer, Berlin, Heidelberg, 1st edn, 2002 Search PubMed
-
H. Block, in Advances in Polymer Science, Springer Berlin, Heidelberg, Berlin, 1st edn, 1979, vol. 33, pp. 93–167 Search PubMed
- S. Havriliak and S. Negami, Polymer, 1967, 8, 161–210 CrossRef CAS
- R. Zorn, J. Polym. Sci., Part B: Polym. Phys., 1999, 37, 1043–1044 CrossRef CAS
- K. Kataoka, J. Ceram. Soc. Jpn., 2020, 128, 7–18 CrossRef
- D. P. Chen, A. Maljuk and C. T. Lin, J. Cryst. Growth, 2005, 284, 86–90 CrossRef CAS
- Scientific Instruments Dresden GmbH - HKZ, https://scidre.de/index.php?id=12, accessed 13 February 2023.
Footnotes |
| † Electronic supplementary information (ESI) available. CCDC 2285952. For ESI and crystallographic data in CIF or other electronic format see DOI: https://doi.org/10.1039/d3ta04606k |
| ‡ Present address: Oak Ridge National Laboratory, Oak Ridge, TN 37830, USA. |
| This journal is © The Royal Society of Chemistry 2023 |