Simultaneous optimization of the electrical and thermal transport properties of LuNiSb via aliovalent doping†
Pu
Miao‡
a,
Cheng
Yang‡
b,
Shen
Han
 a,
Shengnan
Dai
b,
Airan
Li
a,
Lili
Xi
a,
Shengnan
Dai
b,
Airan
Li
a,
Lili
Xi
 *bc,
Jiong
Yang
 bc,
Tiejun
Zhu
 a and
Chenguang
Fu
 *a
*a
aState Key Laboratory of Silicon and Advanced Semiconductor Materials, School of Materials Science and Engineering, Zhejiang University, 310058 Hangzhou, China. E-mail: chenguang_fu@zju.edu.cn
bMaterials Genome Institute, Shanghai University, 99 Shangda Road, 200444 Shanghai, China. E-mail: lilyxi@t.shu.edu.cn
cZhejiang Laboratory, 311100 Hangzhou, China
First published on 22nd June 2023
Abstract
Rare earth-based half-Heusler compounds are potential thermoelectric materials with inherently low thermal conductivity. Here, LuNiSb-based compounds were successfully prepared and their electrical and thermal transport properties were simultaneously improved via aliovalent doping of Sn and Co. In addition to optimizing the carrier concentration, a huge suppression of lattice thermal conductivity κL (∼40% at 300 K) was observed, despite the atomic mass and radius of Sn and Co having only small differences compared with those of the substituted matrix atoms. With the help of first-principles calculations, it is discovered that the suppression of κL mainly originates from the deceleration of optical phonons and the enhancement of phonon–phonon (p–p) scattering phase space. Compared with Co-doped LuNiSb-based compounds, Sn-doped ones exhibit better electrical performance, which is probably because of the weaker perturbation of the valence band. Finally, a peak zT of about 0.4 was obtained at 775 K for LuNiSb0.92Sn0.08. This work highlights the simultaneous optimization of electrical and thermal transport properties only by aliovalent doping, which helps develop high-performance thermoelectrics.
Introduction
Thermoelectric (TE) materials allow direct conversion of heat into electrical energy.1 The figure of merit, zT = S2σT/(κe + κL), where S, σ, T, κe, and κL are the Seebeck coefficient, the electrical conductivity, the absolute temperature, and the electronic and lattice components of thermal conductivity, respectively, is used to gauge the conversion efficiency of TE materials.2 Aiming at improving the TE performance of new semiconductor materials, choosing a suitable dopant to optimize carrier concentration (n) is usually the first and foremost step.2 Further, enhancing the phonon scattering can be implemented to suppress the κL.3Half-Heusler (HH) materials, which are thermally stable, non-toxic, and low cost, generally possess good electrical transport properties, but their high κL impedes the improvement of TE performance. Given this, numerous previous studies focused on the suppression of κL, by introducing point defect scattering,4,5 phase separation,6,7 and grain boundary scattering,8,9 for instance. To date, several HH systems, including MNiSn (M = Ti, Zr, Hf),10,11 RFeSb (R = V, Nb, Ta),12–14 MCoSb15–17 and R1−δCoSb,4 have been discovered to be good TE materials.
ReNiSb-based (Re: rare earth elements) HH compounds, as another typical narrow-gap semiconductor system, were predicted to have inherently low κL and good electrical transport performance. Yang et al.18 carried out the theoretical evaluation of HH compounds as potential TE materials, in which n-type YNiSb was suggested to exhibit good electrical performance. Zhou et al.19 predicted high carrier mobility in ReNi(Sb,Bi). In 2021, by comparing the phonon spectra of YNiBi and LuNiBi, Hong et al.20 anticipated the latter which consists of “two heavy and one light” atom will exhibit ultralow κL (∼0.7 W m−1 K−1 at 300 K). All of this aroused our interest in studying the TE performance of ReNiSb-based HH compounds with probably inherently low κL. However, owing to the challenge of synthesis and complex intrinsic defects, Re-based HH compounds have been rarely studied experimentally.21 In 2020, DyNiSb, ErNiSb, TmNiSb, and LuNiSb were successfully prepared by Ciesielski et al.,22 of which the κL were reported to be about 2.0–5.0 W m−1 K−1 at 300 K. The κL of YbNiSb, prepared by Huang et al.,21 was reported to be about 2.2 W m−1 K−1 at 300 K. Compared to other typical HH compounds (κL: 12 W m−1 K−1 for VFeSb,23 6 W m−1 K−1 for ZrNiSn,11 18 W m−1 K−1 for ZrCoSb24), the experimentally reported low κLs in ReNiSb-based HH compounds might be favorable for good TE performance. To verify this, more systematic studies on the optimization of TE performance should be carried out.
In this work, LuNiSb polycrystalline samples were successfully synthesized via levitation melting and high-energy mechanical alloying, followed by the spark plasma sintering (SPS) process. Considering the doping efficiency and solubility, Co and Sn, as the adjacent elements to the matrix Ni and Sb, respectively, were initially chosen to optimize the electrical performance of LuNiSb while it was surprisingly found that the κL was reduced effectively as well. First-principles calculations were further carried out and reveal that the reduction of group velocities of phonons in the high-energy range plays a key role in suppressing the κL. Meanwhile, it is found that the optimized power factor of Sn-doped LuNiSb compounds is better than that of the Co-doped ones. A peak zT of 0.4 was obtained at 775 K for LuNiSb0.92Sn0.08. This work highlights the simultaneous optimization of electrical and thermal transport properties via aliovalent doping.
Experimental and computational methods
Synthesis
Ingots with a nominal composition of LuNiSb1−xSnx and LuNi1−yCoySb (x, y = 0, 0.02, 0.04, 0.06, 0.08, 0.12) were prepared by levitation melting of the stoichiometric amount of Lu (block, 99.99%), Ni (block, 99.99%), Sb (block, 99.99%), Sn (block, 99.99%), and Co (block, 99.99%) under an argon atmosphere for 3 minutes and excess Sb and Sn blocks of about 2% were added considering possible loss during the melting process. Each ingot was remelted three times to ensure homogeneity and no raw material remained. The ingots were manually ground into powders and mechanically milled (SPEX-8000D, PYNN Corporation) for an hour under argon protection. The fine powders were compacted by SPS (LABOX-650F, Sinter Land Inc.) at 1173 K under 65 MPa under vacuum for 15 minutes. Besides, LuNiSb1−zBiz (z = 0.2, 0.4, 0.6, 0.8, 1.0) ingots were prepared in two steps. The stoichiometric Lu (block, 99.99%) and Ni (block, 99.99%) were first weighed and melted to obtain the LuNi ingot, which was then cracked by hand milling. Then, stoichiometric Sb (powder, 99.99%) and Bi (powder, 99.99%) were subjected to the process of mechanical milling for 4 hours to obtain fine powders, and the following sintering steps are the same as those of LuNiSb1−xSnx.Measurements
The phase structure of the powders and sintered bulks was studied by X-ray diffraction (XRD) on a PANalytical/Areis diffractometer using Cu Kα radiation (λ = 1.5406 Å). The Seebeck coefficient and electrical conductivity from 300 to 900 K were measured on a commercial Linseis LSR-3 system with an accuracy of ±5% and ±3%, respectively. The thermal conductivity κ was calculated by using κ = DρCp, where ρ is the sample density estimated by the Archimedes method and D is the thermal diffusivity measured by a laser flash method on a Netzsch LFA457 instrument (the D of LuNiSb1−xSnx, LuNi1−yCoySb, and LuNiSb1−zBiz are shown in Fig. S1†). The specific heat at constant pressure Cp was calculated from the measured sound velocity and density.16 Normal and shear ultrasonic measurements were performed at room temperature using input from a Panametrics 5052 pulser/receiver with a filter at 0.03 MHz. The response was recorded via a Tektronix TDS5054B-NV digital oscilloscope. The room temperature Hall coefficients were measured in a Mini Cryogen Free Measurement System (Cryogenic Limited, UK) under a variable magnetic field of ±4 T. The Hall carrier concentration (pH) was calculated by pH = 1/eRH, where e is the unit charge and RH is the Hall coefficient. The estimated error of the Hall coefficient is within ±10%. The carrier mobility μH was calculated by μH = σRH. The chemical compositions of all sintered samples were checked using an electron probe microanalyzer (EPMA, JEOL JXA-8100) with a wavelength dispersive spectrometer (WDS). Raman active vibration modes were identified by Raman spectroscopy at room temperature with a solid-state argon laser at λ = 532 nm using a LabRAM HR (UV) system equipped with a CCD detector. The spectral resolution is around 1 cm−1.First-principles calculations
The ab initio calculations were performed by using the projector augmented wave method, as implemented in the Vienna ab initio simulation package (VASP).25 The generalized gradient approximation26 was used for the exchange–correlation function, and a plane-wave energy cutoff of 400 eV was adopted. The phonon density of states (DOS) and dispersions of LuNiSb1−xSnx (x = 0.00–0.12) were calculated by using the frozen phonon method, as implemented in the Phonopy package.27 The phonon scattering rates and κLs were obtained using the shengBTE28 package, in which we considered the interactions between atoms to their fourth nearest neighbors. A 2 × 2 × 2 LuNiSb primitive cell, with 24 atoms in total, was adopted to accommodate 1/8 content of dopants in this work. For the structural optimization of the unit cell, the k-points were chosen as 4 × 4 × 4, and the convergence accuracy of force was 10−5 eV Å−1. For the supercells with displacements (2 × 2 × 2 of the 24-atom-cell, 192 atoms in total), which were used in the calculations of second- and third-order force constants, only Γ point was considered. The energy convergence criterion was 10−7 eV throughout the work. Furthermore, the Quantum ESPRESSO29 package and EPW30 package with norm-conserving pseudopotentials31 and the Perdew–Burke–Ernzerhof exchange and correlation functional26 were used to perform the electron–phonon (e–p) interaction of the 24-atom-cell (LuNiSn0.875Sb0.125). A plane wave cutoff of 100 Ry was employed, and the initial k and q meshes were both 4 × 4 × 4, which were interpolated to 15 × 15 × 15 meshes to calculate the e–p interaction matrix. Finally, we used a homemade code32–35 to combine the phonon–phonon (p–p) and e–p scattering rates and calculate the lattice thermal conductivity.Results and discussion
Crystal structure and thermal transport properties
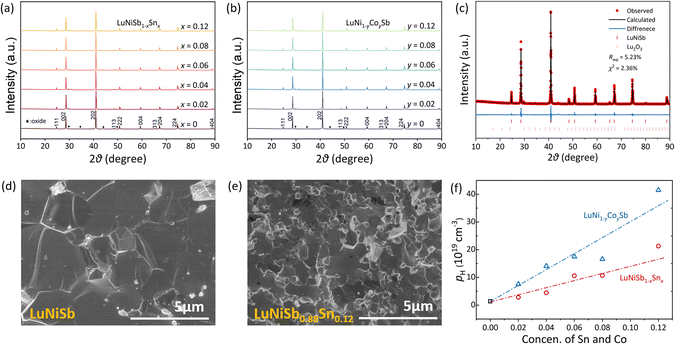
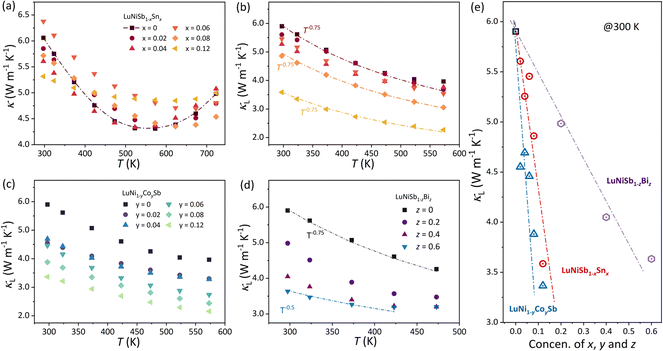
The powder XRD patterns of LuNiSb1−xSnx and LuNi1−yCoySb samples are presented in Fig. 1a and b, respectively. Their main phases are indexed to the cubic MgAgAs-type half-Heusler structure. Owing to the similar atomic radius of matrix and dopant atoms (Sn in the Sb site and Co in the Ni site), the diffraction peaks of these samples do not shift noticeably. Additional tiny diffraction peaks, which are indexed to Lu2O3 (about 1.7 wt% according to the refinement result), are observed in the range of 30–50°. The Rietveld refinement (Fig. 1c) indicates the crystalline structure of LuNiSb corresponds to space group 216 with the Lu atom located at 4a (0,0,0), Ni at 4c (1/4,1/4,1/4), and Sb at 4d (1/2,1/2,1/2) Wyckoff positions. The lattice parameter of LuNiSb at room temperature was estimated to be 6.2256 Å, matching with the literature data.36 The secondary electron morphology of the fracture surface was analyzed for LuNiSb and LuNiSb0.88Sn0.12, as shown in Fig. 1d and e, respectively. The analysis shows that the sample of LuNiSb has a grain size of a few micrometres, which is several times larger than that of the sample doped with 12% Sn. After the measurement of the Hall coefficient, it is found that nH increases positively with the introduction of the dopant (Fig. 1f), which suggests that Sn and Co can adjust carrier concentration (n) effectively. Compared with Sn, the doping of Co gives a higher doping efficiency, and thus higher nH is achieved at the same nominal doping concentration.The temperature dependence of total thermal conductivity κ and lattice thermal conductivity κL of LuNiSb1−xSnx is presented in Fig. 2a and b, respectively. The electronic thermal conductivity κe is obtained by the Wiedemann–Franz law: κe = LσT (Fig. S2†), where L is the Lorenz number calculated using the single parabolic band (SPB) model.37 The κL of LuNiSb at room temperature is about 5.9 W m−1 K−1, which is relatively lower compared with other typical 18-electron HHs. With increasing temperature, the κL decreases and approaches a minimum value of about 3.9 W m−1 K−1 at 575 K. By increasing Sn doping from 0 to 12%, a sharp suppression of the room temperature κL by 39% is observed. A similar suppression in the κL occurs in the Co-doped LuNi1−yCoySb (Fig. 2c). For instance, a drop of 42% is observed for LuNi0.88Co0.12Sb, resulting in a κL of about 3.4 W m−1 K−1 at 300 K.
As the atomic mass and radius between the matrix and the dopants (Sb in the Sn site and Co in the Ni site) are similar, the significant reduction of κL in LuNiSb caused by doping is surprising. For LuNiSb1−xSnx, the κL of all the samples maintains a temperature dependence of T−0.75, which suggests the point defect scattering brought about by Sn doping might not be serious.38,39 A series of LuNiSb1−zBiz were further prepared to elucidate the effect of point defect scattering on the κL of LuNiSb,40,41 and the phase characterization is presented in Fig. S3.† With increasing Bi alloying content, the κL is suppressed and the temperature dependence changes from T−0.75 to T−0.5 (Fig. 2d), which demonstrates the additional point defect scattering of phonons was induced. The κL of all the LuNiSb1−xSnx, LuNi1−yCoySb, and LuNiSb1−zBiz at room temperature are presented together in Fig. 2e, from which one can find that the aliovalent doping of Co and Sn is a more effective method to reduce κL than the isoelectronic alloying of Bi. Based on the model proposed by Klemens and Abeles (eqn S1†),42,43 the normalized disorder of mass field brought about by Sn doping and Bi alloying is presented in Fig. S4,† where LuNiSb1−xSnx can be found to have much lower mass fluctuations than those of LuNiSb1−zBiz. This suggests the lower κL observed in LuNiSb1−xSnx probably does not originate from the enhanced point defect scattering of phonons. The effect of grain boundary scattering was excluded as discussed in ESI Note 1 and Fig. S5 and S6.† Besides, it was recently found that aliovalent doping might play an important role in affecting the intrinsic phonon dispersion of the matrix compounds and thus their thermal transport.44
In recent years, first-principles calculations of phonons have become an effective method for understanding the intrinsic phonon–phonon and electron–phonon interactions. For PbTe, the calculated thermal conductivity shows a six-times increase if the acoustic–optical scattering process was removed, which highlights the effect of the coupling between the low-lying transverse optical phonons and the longitudinal acoustic phonons.45 In 2023, Dai et al.32 showed the different contributions of e–p scattering for several HH systems by calculating their EP coupling matrix. By means of thermal transport measurement, inelastic neutron scattering measurements, and first-principles calculations, Han et al.44 found that aliovalent doping-induced optical phonon softening can significantly suppress phonon transport in NbFeSb. Herein, first-principles calculations are used to further analyze the intrinsic thermal transport characteristics for LuNiSb.
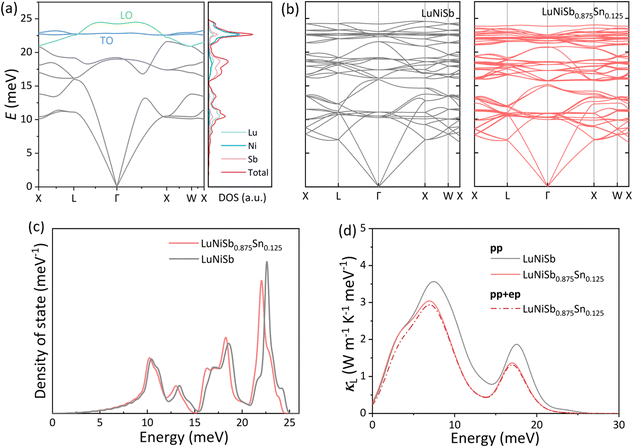
In polar materials, due to the long-range polarization field produced by the longitudinal optical (LO) phonon vibration, the degeneracy of the LO phonon and transverse optical (TO) phonon is lifted around the Brillouin zone center, corresponding to the LO–TO splitting.46 For instance, free carriers brought by the Sb dopant in ZrNiSn screen the Coulomb interaction, resulting in the collapse of LO–TO splitting.47 According to the calculated phonon dispersion (Fig. 3a), it is found that LO–TO splitting exists in LuNiSb as well. With 12.5% Sn doping into LuNiSb, high-energy optical phonon branches become flat and the collapse of LO–TO splitting appears (Fig. 3b). Moreover, a remarkable softening of the optical phonon branches occurs at the energy range of 15–25 meV which matches the movement of the two peaks (at ∼18 meV and ∼23 meV) presented in the total DOSs (Fig. 3c). At the same time, phonon softening is also captured by Raman spectroscopy, in which the redshift of the main Raman peaks with increasing Sn doping content for LuNiSb1−xSnx can be observed. Based on the expression of κL = 1/3Cvvg2τ, where Cv is the heat capacity, vg is the group velocity, and τ is the relaxation time, the calculated phonon energy-dependent κL is presented in Fig. 3d.
With aliovalent Sn doping, the increased n ensures that the e–p scattering might not be ignored anymore.33,48 Then, e–p scattering is further considered in the calculations of LuNiSb0.875Sn0.125 (dotted line in Fig. 3d). For LuNiSb0.875Sn0.125, the scattering rate of p–p scattering being considered varies from ∼10−2 to ∼104 ps−1 while the counterpart of e–p just varies from ∼10−4 to ∼10−2 ps−1 (Fig. S8†). The large difference in the scattering rate between these two processes further suggests additional e–p scattering with Sn doping is weak, which only results in a weak suppression of κL (Fig. S9†). Compared to other HH materials, the inapparent e–p scattering in this system may be caused by the small  and e–p coupling matrix.32
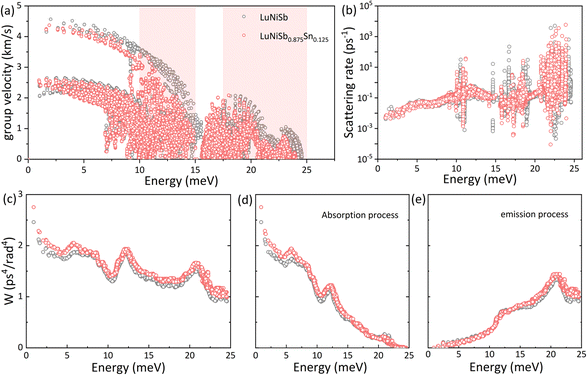
As discussed above, optical phonon softening is induced in LuNiSb with Sn doping, and this phenomenon will result in flattened optical branches at the same time. Owing to these two points, the optical phonons (vg = dω/dk) are decelerated inevitably. When the energy-dependent group velocity for both LuNiSb and LuNiSb0.875Sn0.125 is presented in one figure, an obvious deceleration of the group velocity can be observed at the range of 10–15 meV and 17.5–25 meV (Fig. 4a), corresponding to the ranges where the κL declines significantly (Fig. 3d). Below 10 meV, the group velocity does not reduce obviously, corresponding to the negligible change of the measured sound velocities (Table S1†).
The three-phonon process usually dominates the thermal transport of TE materials at elevated temperatures. The behavior of two phonons colliding and creating a new phonon beyond their primary Brillouin zone will produce thermal resistance under the law of conservation of energy and momentum: k1 + k2 = k3 + G and ℏωk1 + ℏωk2 = ℏωk3, where G is a reciprocal lattice vector. G = 0 refers to the normal (N) process with no direct generation of thermal resistance and G ≠ 0 refers to the Umklapp (U) process with thermal resistance. Determined by the energy conservation, new phonon k3 can stay at the higher energy and whether the U process can occur depends on whether a phonon state exists at the corresponding energy or not. Therefore, with Sn doping in LuNiSb, phonon softening and optical branch flattening result in the rearrangement of phonon modes, which is going to change the probability of the three-phonon process. After calculating the energy-dependent p–p scattering rate of LuNiSb and LuNiSb0.875Sn0.125, the prominent variation of both scattering profiles is presented in Fig. 4b. What is hidden behind the variation of phonon scattering is the enhancement of phonon scattering phase space, which can be observed at almost all energy ranges (Fig. 4c). The p–p scattering is further resolved into two processes, i.e., the absorption and emission processes. The enlargement of phase scattering space occurs prominently at the range of <10 meV for the absorption process (Fig. 4d) and >15 meV for the emission process (Fig. 4e). That is, the rearrangement of phonon modes enhances the probability of the three-phonon process.
In short, with the help of first-principles calculations, it is discovered that the reduced group velocity and enhanced three-phonon process play a key role in the suppression of κL for Sn-doped LuNiSb0.875Sn0.125.
Electrical transport properties
The electrical transport properties of Sn- and Co-doped LuNiSb1−xSnx and LuNi1−yCoySb are presented in Fig. 5. The positive S of pristine LuNiSb rises with increasing temperature and reaches the maximum at 475 K (Fig. 5a) while σ exhibits an opposite trend (Fig. 5b), which indicate that this compound is a typical p-type narrow-gap semiconductor. With the p-type dopant of Sn & Co, S shows a noticeable decrease while σ is enhanced (Fig. 5a, b, d and e), suggesting more holes are induced into the compounds. The power factor (PF = S2σ) for Sn- and Co-doped LuNiSb reaches a maximum value of about 27 × 10−4 W m−1 K−2 at 625 K (Fig. 5c) and about 22 × 10−4 W m−1 K−2 at 675 K (Fig. 5f), respectively. Compared with pristine LuNiSb (∼16 × 10−4 W m−1 K−2 at 575 K), an enhancement of PF by 68% is brought through Sn doping and 37.5% for Co doping.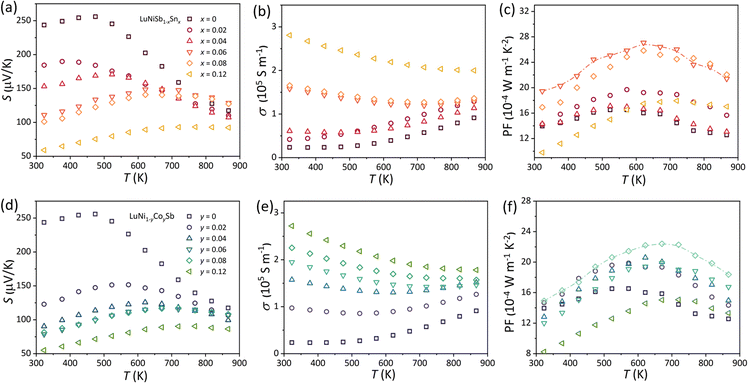 | ||
| Fig. 5 Temperature-dependent (a and d) S, (b and e) σ, and (c and f) PF for LuNiSb1−xSnx and LuNi1−yCoySb, respectively. | ||
Hall measurements were carried out to further reveal the possible origin of the distinction in the electrical transport properties of Sn- and Co-doped LuNiSb. The μH of pristine LuNiSb is about 107 cm2 V−1 s−1 at 300 K. Compared to LuNiSb1−xSnx, the μH of LuNi1−yCoySb presents a larger drop (Fig. 6a), which finally results in the difference of their electrical PF (Fig. 5c and f). Generally, a lower μH may be caused by heavier effective mass or increased carrier scattering. The relationship between S and pH of Sn-doped and Co-doped samples is presented in Fig. 6b, where all the experimental data match well with the Pisarenko curve calculated using the SPB model with  of 1.2 me at room temperature, suggesting the electrical structure might not change obviously with doping of both Sn and Co. Considering the almost unchanged
  , the enhanced carrier scattering becomes the most probable factor that results in the difference of electrical transport performance. From the calculated partial DOS of LuNiSb, it is discovered that compared with the Sb atom, the Ni atom contributes more to the top of the valence band (Fig. 6c and d). When Co is doped at the site of Ni, the periodic lattice field will be disturbed more seriously,49 which might result in additional alloy scattering.
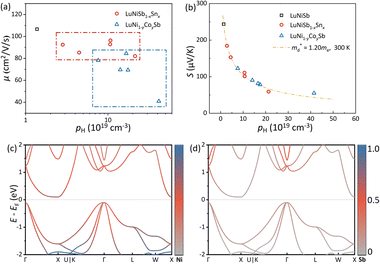 | ||
Fig. 6 (a) μH as a function of pH and (b) the Pisarenko curves with  ≈ 1.2 me for LuNiSb1−xSnx and LuNi1−yCoySb at room temperature. The projected band structure of (c) Ni and (d) Sb for LuNiSb. ≈ 1.2 me for LuNiSb1−xSnx and LuNi1−yCoySb at room temperature. The projected band structure of (c) Ni and (d) Sb for LuNiSb. | ||
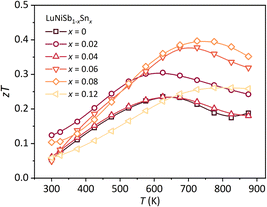
For pristine LuNiSb, the peak zT of 0.23 is obtained at 625 K (Fig. 7). Benefiting from Sn doping, an enhanced peak zT of 0.4 is obtained at 775 K for LuNiSb0.92Sn0.08. The enhanced zT value for LuNi1−yCoySb is presented in Fig. S10.† These results suggest that the TE performance of ReNiSb can be optimized by doping with either Sn or Co, resulting from the suppression of κL and the optimization of PF at the same time.
Conclusions
In summary, rare-earth-based HH compound LuNiSb has been successfully prepared via levitation melting and high-energy mechanical alloying followed by SPS. A relatively low κL of ∼5.9 W m−1 K−1 at 300 K is obtained. Sn and Co dopants are found to simultaneously optimize the electrical performance and decrease κL. With first-principles calculations, it is found that the Sn doping induces the softening of optical phonons, resulting in reduced sound velocities and enhanced phonon scattering phase space, thereby suppressing κL effectively. Benefiting from the improved PF and reduced κL arising from Sn doping, a maximum zT of 0.4 is obtained at 775 K for LuNiSb0.92Sn0.08, a large improvement by 70% compared with that of LuNiSb. This work highlights the simultaneous optimization of the electrical and thermal transport properties of LuNiSb via aliovalent doping, which is probably also suitable for improving the thermoelectric performance of other rare-earth-based HH compounds.Conflicts of interest
There are no conflicts to declare.Acknowledgements
This work was supported by the National Natural Science Foundation of China (No. 52101275, 92163203, and 52172216). J. Yang acknowledges the support of the Key Research Project of Zhejiang Lab (No. 2021PE0AC02).References
- J. He and T. M. Tritt, Science, 2017, 357, eaak9997 CrossRef PubMed.
- G. J. Snyder and E. S. Toberer, Nat. Mater., 2008, 7, 105–114 CrossRef CAS PubMed.
- K. Biswas, J. He, I. D. Blum, C.-I. Wu, T. P. Hogan, D. N. Seidman, V. P. Dravid and M. G. Kanatzidis, Nature, 2012, 489, 414–418 CrossRef CAS PubMed.
- J. Yang, G. P. Meisner and L. Chen, Appl. Phys. Lett., 2004, 85, 1140–1142 CrossRef CAS.
- K. Xia, P. Nan, S. Tan, Y. Wang, B. Ge, W. Zhang, S. Anand, X. Zhao, G. J. Snyder and T. Zhu, Energy Environ. Sci., 2019, 12, 1568–1574 RSC.
- M. Schwall and B. Balke, Phys. Chem. Chem. Phys., 2013, 15, 1868–1872 RSC.
- M. Sato, Y. W. Chai and Y. Kimura, ACS Appl. Mater. Interfaces, 2021, 13, 25503–25512 CrossRef CAS PubMed.
- A. Bahrami, P. Ying, U. Wolff, N. P. Rodríguez, G. Schierning, K. Nielsch and R. He, ACS Appl. Mater. Interfaces, 2021, 13, 38561–38568 CrossRef CAS PubMed.
- R. Bueno Villoro, M. Wood, T. Luo, H. Bishara, L. Abdellaoui, D. Zavanelli, B. Gault, G. J. Snyder, C. Scheu and S. Zhang, Acta Mater., 2023, 249, 118816 CrossRef CAS.
- X. Li, P. Yang, Y. Wang, Z. Zhang, D. Qin, W. Xue, C. Chen, Y. Huang, X. Xie, X. Wang, M. Yang, C. Wang, F. Cao, J. Sui, X. Liu and Q. Zhang, Research, 2020, 4630948 CAS.
- X. Li, H. Yao, S. Duan, X. Bao, W. Xue, Y. Wang, F. Cao, M. Li, Z. Chen, Y. Wang, X. Lin, X. Liu, Z. Feng, J. Mao and Q. Zhang, Acta Mater., 2022, 118591 Search PubMed.
- J. Yu, C. Fu, Y. Liu, K. Xia, U. Aydemir, T. C. Chasapis, G. J. Snyder, X. Zhao and T. Zhu, Adv. Energy Mater., 2018, 8, 1701313 CrossRef.
- R. Bueno Villoro, D. Zavanelli, C. Jung, D. A. Mattlat, R. Hatami Naderloo, N. Pérez, K. Nielsch, G. J. Snyder, C. Scheu, R. He and S. Zhang, Adv. Energy Mater., 2023, 13, 2204321 CrossRef CAS.
- W. Li, B. Poudel, R. A. Kishore, A. Nozariasbmarz, N. Liu, Y. Zhang and S. Priya, Adv. Mater., 2023, 2210407 CrossRef CAS PubMed.
- Y. Liu, C. Fu, K. Xia, J. Yu, X. Zhao, H. Pan, C. Felser and T. Zhu, Adv. Mater., 2018, 30, 1800881 CrossRef PubMed.
- Y. Xing, R. Liu, J. Liao, Q. Zhang, X. Xia, C. Wang, H. Huang, J. Chu, M. Gu, T. Zhu, C. Zhu, F. Xu, D. Yao, Y. Zeng, S. Bai, C. Uher and L. Chen, Energy Environ. Sci., 2019, 12, 3390–3399 RSC.
- C. Hu, K. Xia, C. Fu, X. Zhao and T. Zhu, Energy Environ. Sci., 2022, 15, 1406–1422 RSC.
- J. Yang, H. Li, T. Wu, W. Zhang, L. Chen and J. Yang, Adv. Funct. Mater., 2008, 18, 2880–2888 CrossRef CAS.
- J. Zhou, H. Zhu, T.-H. Liu, Q. Song, R. He, J. Mao, Z. Liu, W. Ren, B. Liao, D. J. Singh, Z. Ren and G. Chen, Nat. Commun., 2018, 9, 1721 CrossRef PubMed.
- X. Yu and J. Hong, J. Mater. Chem. C, 2021, 9, 12420–12425 RSC.
- J. Huang, R. Liu, Q. Ma, Z. Jiang, Y. Jiang, Y. Li and C. Wang, ACS Appl. Energy Mater., 2022, 5, 12630–12639 CrossRef CAS.
- K. Ciesielski, K. Synoradzki, I. Veremchuk, P. Skokowski, D. Szymański, Y. Grin and D. Kaczorowski, Phys. Rev. Appl., 2020, 14, 054046 CrossRef CAS.
- C. Fu, T. Zhu, Y. Pei, H. Xie, H. Wang, G. J. Snyder, Y. Liu, Y. Liu and X. Zhao, Adv. Energy Mater., 2014, 4, 1400600 CrossRef.
- R. He, T. Zhu, Y. Wang, U. Wolff, J.-C. Jaud, A. Sotnikov, P. Potapov, D. Wolf, P. Ying, M. Wood, Z. Liu, L. Feng, N. P. Rodriguez, G. J. Snyder, J. C. Grossman, K. Nielsch and G. Schierning, Energy Environ. Sci., 2020, 13, 5165–5176 RSC.
- G. Kresse and J. Furthmüller, Phys. Rev. B: Condens. Matter Mater. Phys., 1996, 54, 11169–11186 CrossRef CAS PubMed.
- J. P. Perdew, K. Burke and M. Ernzerhof, Phys. Rev. Lett., 1996, 77, 3865–3868 CrossRef CAS PubMed.
- A. Togo and I. Tanaka, Scr. Mater., 2015, 108, 1–5 CrossRef CAS.
- W. Li, J. Carrete, N. A. Katcho and N. Mingo, Comput. Phys. Commun., 2014, 185, 1747–1758 CrossRef CAS.
- P. Giannozzi, S. Baroni, N. Bonini, M. Calandra, R. Car, C. Cavazzoni, D. Ceresoli, G. L. Chiarotti, M. Cococcioni, I. Dabo, A. D. Corso, S. de Gironcoli, S. Fabris, G. Fratesi, R. Gebauer, U. Gerstmann, C. Gougoussis, A. Kokalj, M. Lazzeri, L. Martin-Samos, N. Marzari, F. Mauri, R. Mazzarello, S. Paolini, A. Pasquarello, L. Paulatto, C. Sbraccia, S. Scandolo, G. Sclauzero, A. P. Seitsonen, A. Smogunov, P. Umari and R. M. Wentzcovitch, J. Phys.: Condens. Matter, 2009, 21, 395502 CrossRef PubMed.
- J. Noffsinger, F. Giustino, B. D. Malone, C.-H. Park, S. G. Louie and M. L. Cohen, Comput. Phys. Commun., 2010, 181, 2140–2148 CrossRef CAS.
- D. R. Hamann, Phys. Rev. B: Condens. Matter Mater. Phys., 2013, 88, 085117 CrossRef.
- S. Dai, C. Liu, J. Ning, C. Fu, J. Xi, J. Yang and W. Zhang, Mater. Today Phys., 2023, 100993 CrossRef CAS.
- Z. Zhu, J. Xi and J. Yang, J. Mater. Chem. A, 2022, 10, 13484–13491 RSC.
- J. Ding, C. Liu, L. Xi, J. Xi and J. Yang, J. Materiomics, 2021, 7, 310–319 CrossRef.
- C. Liu, M. Yao, J. Yang, J. Xi and X. Ke, Mater. Today Phys., 2020, 15, 100277 CrossRef.
- V. V. Romaka, L. Romaka, A. Horyn, P. Rogl, Y. Stadnyk, N. Melnychenko, M. Orlovskyy and V. Krayovskyy, J. Solid State Chem., 2016, 239, 145–152 CrossRef CAS.
- P. H. M. Böttger, G. S. Pomrehn, G. J. Snyder and T. G. Finstad, Phys. Status Solidi A, 2011, 208, 2753–2759 CrossRef.
- J. Callaway, Phys. Rev., 1959, 113, 1046–1051 CrossRef CAS.
- J. Callaway and H. C. von Baeyer, Phys. Rev., 1960, 120, 1149–1154 CrossRef CAS.
- Y. Pei, L. Zheng, W. Li, S. Lin, Z. Chen, Y. Wang, X. Xu, H. Yu, Y. Chen and B. Ge, Adv. Electron. Mater., 2016, 2, 1600019 CrossRef.
- H. Zhu, R. He, J. Mao, Q. Zhu, C. Li, J. Sun, W. Ren, Y. Wang, Z. Liu, Z. Tang, A. Sotnikov, Z. Wang, D. Broido, D. J. Singh, G. Chen, K. Nielsch and Z. Ren, Nat. Commun., 2018, 9, 2497 CrossRef PubMed.
- P. G. Klemens, Phys. Rev., 1960, 119, 507–509 CrossRef CAS.
- C. L. Wan, W. Pan, Q. Xu, Y. X. Qin, J. D. Wang, Z. X. Qu and M. H. Fang, Phys. Rev. B: Condens. Matter Mater. Phys., 2006, 74, 144109 CrossRef.
- S. Han, S. Dai, J. Ma, Q. Ren, C. Hu, Z. Gao, M. Duc, D. Sheptyakov, P. Miao, S. Torii, T. Kamiyama, C. Felser, C. Fu and T. Zhu, arXiv, preprint, arXiv:2303.10899, 2023, DOI:10.48550/arXiv.2303.10899.
- Z. Tian, J. Garg, K. Esfarjani, T. Shiga, J. Shiomi and G. Chen, Phys. Rev. B: Condens. Matter Mater. Phys., 2012, 85, 184303 CrossRef.
- B. Max and K. Huang, Dynamical Theory of Crystal Lattices, Clarendon Press, 1954 Search PubMed.
- Q. Ren, C. Fu, Q. Qiu, S. Dai, Z. Liu, T. Masuda, S. Asai, M. Hagihala, S. Lee, S. Torri, T. Kamiyama, L. He, X. Tong, C. Felser, D. J. Singh, T. Zhu, J. Yang and J. Ma, Nat. Commun., 2020, 11, 3142 CrossRef CAS PubMed.
- T. Zhu, G. Yu, J. Xu, H. Wu, C. Fu, X. Liu, J. He and X. Zhao, Adv. Electron. Mater., 2016, 2, 1600171 CrossRef.
- H. Wang, X. Cao, Y. Takagiwa and G. J. Snyder, Mater. Horiz., 2015, 2, 323–329 RSC.
Footnotes |
| † Electronic supplementary information (ESI) available. See DOI: https://doi.org/10.1039/d3ta02735j |
| ‡ These authors contributed equally. |
| This journal is © The Royal Society of Chemistry 2023 |


