
 Open Access Article
 This Open Access Article is licensed under a
 Creative Commons Attribution 3.0 Unported Licence
Self-limiting thin film deposition of amorphous metal oxides from aprotic solvents for oxygen evolution electrocatalysis†
Rafael A.
Prato M.
ab,
Jan
Fransaer
b and
Xochitl
Dominguez-Benetton
 *a
*a
aSeparation and Conversion Technologies, VITO-Flemish Institute for Technological Research, Boeretang 200, 2400, Mol, Belgium. E-mail: xoch@vito.be
bDept. Materials Engineering, KU Leuven, Kasteelpark Arenberg 44 – Box 2450, 3001 Leuven, Belgium
First published on 19th September 2023
Abstract
In the context of global energy and environmental challenges, developing efficient and sustainable methods for energy storage and conversion is essential. Amorphous thin films of nanoporous single and mixed Ni, Co, Fe metal oxides were deposited using in situ generated superoxide from dimethyl formamide (DMF) solutions, presenting a promising advancement in oxygen evolution reaction (OER) catalysis. The OER is a critical process in technologies such as water electrolysis for hydrogen production and metal–air batteries. The oxygen reduction reaction (ORR) was investigated in DMF containing tetrabutylammonium chloride (TBAC) and transition metal chlorides (Co2+, Ni2+, Fe2+). The ORR exhibited pseudo-reversibility in 0.1 M TBAC/DMF due to the stable superoxide–TBA complex (TBAO2). Diffusion coefficients for TBAO2 and dissolved oxygen in DMF were measured with a rotating ring-disk electrode (RRDE) setup, obtaining values of 9.4 × 10⁻¹⁰ m2 s−1 and 4.4 × 10⁻⁹ m2 s−1, respectively. In the presence of metal ions, the superoxide radicals react rapidly, initiating oxidative precipitation of metal oxides. Amorphous oxide layers grow until the electrode passivation towards the ORR occurs, resulting in thin films. The as-deposited films displayed exceptional oxygen evolution reaction (OER) catalytic performance, with overpotentials and Tafel slopes as low as 330 mV (@10 mA cm−2) and 42 mV dec−1 for NiOx on glassy carbon (GC). The self-limiting deposition process was investigated on porous substrates, such as reticulated vitreous carbon (RVC), which demonstrated a 100 mV reduction in OER overpotential compared to GC at the same current density. This self-limiting electrodeposition method offers potential environmental benefits, including resource efficiency and reduced environmental impact. The charge transfer mechanism and long term stability of the films were explored, with results showing stability up to 160 h on GC/RVC and 600 h on Ni foam. This study reveals insights in the ORR in aprotic solvents with transition metals oxides and presents a simple, self-limiting electrodeposition method for amorphous metal oxides, paving the way for coating complex structures and advancing energy storage and conversion technologies.
Introduction
As the global demand for clean and sustainable energy solutions grows, the development of efficient water splitting processes for hydrogen generation becomes increasingly important. One key component in this process is the oxygen evolution reaction (OER), which plays a crucial role in alkaline water electrolysers and metal–air batteries.1,2 The sluggish kinetics of the multi-step OER remains a limiting factor,3 and overcoming energy losses, stability issues, and high costs of electrocatalysts is essential for achieving economical water splitting.3 Precious metal catalysts, such as iridium or ruthenium oxide, set the benchmark for OER overpotential reduction.4,5 However, their high costs make them unsuitable for large-scale industrial applications.6Significant research has focused on engineering transition metal oxides (or hydroxides) catalysts, such as Mn, Ni, Co, and Fe, as cost-effective alternatives to iridium oxide in OER applications.7–9
Innovative solutions are required to reconcile the excellent electrocatalytic properties of these transition metal oxides with their poor electronic conductivity.7,10 Strategies include the use of conductive structures such as carbon11 or graphene,12 metallic supports like Ni,13 and limiting catalyst thickness through thin-film techniques.14 Synergistic effects between two or more can also reduce overpotential.15 While crystalline oxides and hydroxides have received the bulk of the attention,8 amorphous transition metal oxides are also gaining interest for OER electrocatalysis.15–17 Nano-structuring and employing high aspect ratio structures and 3D electrodes offer opportunities for further performance optimization.18,19 Electrodeposition is a suitable method for leveraging these structures.14,20
Depositing thin films of functional materials for electrochemical applications has been a staple in nanomaterial research.21 Limiting film thickness minimizes ohmic losses due to the poor conductivities of the oxide films, lowers overpotentials and, ultimately, increases energy savings.10 Electrodeposition is a fast, cost-effective method for creating nanostructured surfaces on conductive supports.20 To exploit nanostructured or porous electrodes, deposition methods must coat as much of the surface area as possible, including the inside of pore walls in the case of porous electrodes. Self-limiting electrodeposition allows coating grow to a certain thickness on outer layers, then continue on the exposed inner substrate walls.22 The underlying principle is that the coating should passivate the electrode enough for the reaction to occur, preferentially on the (more conductive) exposed substrate.20 This process requires balancing film thickness with pore accessibility.23 The choice of substrate and its pore structure is critical for achieving the desired equilibrium, as mass transport of the precursors to the inner pore walls must not be limiting. Thus, both deposition method and the choice of substrate are essential for achieving a successful coating. Furthermore, once the coated electrodes are polarized for the oxygen evolution reaction, rapid transport of oxygen out of the structure must be managed.
In this study, we present a cathodic electrodeposition method to produce self-limiting thin films of amorphous mixed metal oxides without the use of complex precursors. Building on the work of Vanhoutte et al.,20 we use dimethylformamide (DMF) as an aprotic solvent to promote the 1 electron oxygen reduction to superoxide, which reacts with and deposits metals from solution as metal oxides (MOx). Due to the high reactivity of superoxide, the method results in a fast deposition process capable of uniformly precipitating mixtures of metal ions. We investigate the oxygen reduction reaction in metal-free DMF and use a quaternary ammonium ion to stabilize the superoxide radical. This increased stability enables probing diffusion coefficients, saturation concentrations, and the electrochemical behavior of the system. The method is then used to deposit Ni, Co and Fe oxide films onto flat glassy carbon electrodes for structural and electrochemical characterization. Reticulated vitreous carbon is coated to showcase the self-limiting behavior of the deposition technique. The porous structures serve as an ideal substrate for enhanced OER performance after coating. Finally, we use of Ni foam as a substrate, providing increased surface area, increased OER catalytic activity, and improved substrate-coating interfacial stability with promising results. This self-limiting electrodeposition method offers potential environmental benefits, including resource efficiency and reduced environmental impact, while advancing energy storage and conversion technologies.
Experimental methods
ORR study
To study the ORR, we prepared 0.1 M tetrabutyl ammonium chloride (TBAC, VWR MFCD00011635) in dimethyl formamide (VWR N,N-dimethylformamide, Extra Dry ≥99.8%, AcroSeal™). All reactants were purchased dry, and used dry, under nitrogen or oxygen atmosphere. For the oxygen-saturated solutions, oxygen was bubbled for at least 30 minutes before each experiment. Otherwise, nitrogen was bubbled similarly, for nitrogen-saturated solutions. During the experiments the appropriate gas was introduced on top of the solutions.A saturated calomel electrode (SCE) with a ceramic frit was used as the reference electrode, and a carbon electrode served as the anode. Prior to each experiment, the reference electrodes were calibrated vs. a pristine Ag/AgCl reference electrode (never used in an experiment) in a 3 M KCl solution. Calibrating the SCE against a pristine Ag/AgCl reference electrode, as done in our study, involved comparing the potential readings of the SCE to the potential readings of the Ag/AgCl electrode, both of which were immersed in the same electrolyte solution. This calibration step was undertaken to ensure the accurate reporting of the potentials in the system. Using a pristine Ag/AgCl electrode for all the experiments we conducted could have been an option for a few short-term experiments. But this was not the case for the long-term, as the Ag/AgCl electrode may face stability issues, not due to the nature of the electrode but due to the type of junction (i.e., a single junction of glass). The SCE electrode was primarily chosen due to it ceramic frit. Ceramic frits are often selected for their chemical inertness and robustness in various solvent systems, including non-aqueous solvents like dimethylformamide (DMF). Glass frits might be more susceptible to interactions with certain solvents or experimental conditions. Given that your experiments are conducted in DMF, the ceramic frit in the SCE was deemed as a more compatible and stable choice under these conditions. Ceramic frits have less potential drift compared to an Ag/AgCl electrode with a glass frit. The potential stability of the SCE itself (with a ceramic frit), thus contributed to the reliability of our calibration. Plus, here are numerous studies in literature using SCE in DMF, and thus it has a well characterized behavior in this medium.
The working electrodes consisted of 3 mm diameter glassy carbon disks (EDAQ ET074-1). Cyclic voltammetries were performed using a BioLogic VMP3 potentiostat, with potential ranges from 0.0 V vs. SCE to −2.0 V, 1.5 V, or 1.0 V vs. SCE as indicated, at a scan rate of 20 mV s−1.
Rotating ring-disk electrode (RRDE) experiments were carried out with a WaveVortex 10 (PINE research) rotator and an E6R2 RRDE tip electrode (PINE research), featuring a 5.5 mm diameter GC disk and a platinum ring with 6.5 mm inner and 8.5 outer diameter, respectively. The CV–CA experiments involved a CV applied to the disk with a scan rate of 50 mV s−1 and a chronoamperometry (CA) at the ring at 0.0 V vs. SCE. Transient time experiments were executed by applying a potential at the ring of either −1.3 V or 0.0 V vs. SCE; meanwhile, the disk was stepped from open circuit potential (OCP) to −1.3 V vs. SCE.
The ORR study in DMF provides insights into the behavior of the oxygen reduction reaction in aprotic solvents, which is essential for understanding and optimizing the electrodeposition process of amorphous metal oxides for energy and environmental applications.
Thin film deposition
The films of amorphous metal oxides were deposited using the same equipment as described earlier, from solutions containing 0.1 M metal chlorides (NiCl2, CoCl2, and FeCl2) in DMF. The solutions were saturated with O2 following the same procedure as for the ORR study.The CVs were limited to −1.0 V vs. SCE, and performed between 1 and 20 times with a scan rate of 20 mV s−1. The solutions were either of single metal precursors, or equimolar mixtures of 2 metals totaling 0.1 M. The concentration of the solutions was measured via Inductive Coupled Plasma – Optical Emission Spectroscopy (ICP-OES). The Ni foam electrodes used were cleaned via sonication in 3 M HCl for 15 min, followed by sonication in water, and then DMF.
By optimizing the deposition process for thin films of amorphous metal oxides, this study aimed to enhance the efficiency and sustainability of the system.
OER catalyst evaluation
The coated electrodes were evaluated for their OER catalytic performance, by placing them in a 250 mL 1.0 M KOH solution under heavy stirring in a 3-necked flask, fitted a pH meter, a Ag/AgCl reference electrode, and a carbon cloth counter electrode.Before all experiments, the ohmic drop was determined via electrochemical impedance spectroscopy (EIS) to apply an IR correction (at 85%) of the subsequent measurements. The working electrode was cycled 100 times from 0.3 V to 0.6 V vs. Ag/AgCl at a scan rate of 20 mV s−1. Upon completion of the CVs, 3 Linear Scan Voltammetries (LSVs) were applied at 5 mV s−1 again from OCP to 0.6 V vs. Ag/AgCl. Five more CVs were performed from −0.1 V to 0 V vs. Ag/AgCl at 10 mV s−1, 20 mV s−1, 100 mV s−1, 200 mV s−1, and 500 mV s−1, to determine the capacitance of the films. Finally, EIS was used to probe the reaction mechanism at different overpotentials (calculated using 1.23 V vs. RHE as the OER onset potential) by first fixing the potential at the desired level for 5 minutes, and then starting the EIS experiments. A peak-to-peak amplitude of 10 mV was chosen, with frequencies between 200 kHz to 10 mHz.
Stability tests were performed by drawing a fixed current density and measuring the potential in a 1.0 M KOH solution under heavy stirring. The potential conversion from the reference electrode to OER overpotential was performed with the following formula: η = E(vs. Ag/AgCl) + EREF + pH 0.059 − 1.233, where E(vs. Ag/AgCl) is the potential measured for the working electrode and EREF is the potential of the Ag/AgCl reference electrode used. This reference potential was calibrated prior to each experiment vs. a pristine reference electrode in a 3 M KCl solution, to account for the measured potential, reference potential, and pH.
By evaluating the OER catalytic performance, the efficiency, stability, and overall effectiveness of the developed catalysts can be determined. This information is crucial for optimizing the catalyst design and improving the performance of energy storage and conversion systems.
Material characterization
X-Ray Diffraction (XRD). The films were deposited on flat glassy carbon plates to analyze by X-ray diffraction (XRD) in a PanAlytical X'Pert Pro diffractometer using a Cu Kα radiation source. Measurements were performed with a spinner at 40 mA–40 kV spending 4 s per step with a step size of 0.04° 2θ in the 10–110° 2θ range. The analysis was performed using HighScore Plus software. Additional XRD characterization was performed using an in-plane attachment to measure the grazing incidence diffraction on the films.Scanning Electron Microscopy (SEM). Micrographs of the films were taken with a FEI Nova NanoSEM 450. SEM micrographs presented were taken with secondary electrons and an acceleration voltage of 5.00 kV. The films for microscopy were either deposited on the flat glassy carbon plates or on the foam electrodes.
Results and discussion
Oxygen reduction in DMF
Investigating the ORR is of critical importance in addressing the energy-environment nexus and tackling broader energy and environmental challenges. A deeper understanding of the ORR process can pave the way for advancements in energy storage and conversion technologies, such as water electrolysis for hydrogen production and metal–air batteries, as these technologies hold great potential in promoting a sustainable energy landscape and mitigating climate change by reducing our dependence on fossil fuels and lowering greenhouse gas emissions.Optimizing the ORR process in DMF-based electrolytes can lead to improved efficiency and performance of electrochemical devices, enabling the development of cleaner and more effective energy solutions. This, in turn, can contribute to resource efficiency and reduced environmental impact, aligning with global goals for sustainable development and environmental protection. In this study, the oxygen reduction reaction (reaction (1)) was thoroughly investigated in different DMF-based electrolytes using a glassy carbon electrode to understand the fundamental electrochemical behavior of these systems. An initial assessment of the undisturbed ORR and its reversibility was carried out using 0.1 M Tetrabutyl Ammonium Chloride (TBAC) in DMF electrolyte.
CVs of an oxygen saturated TBAC/DMF solution were obtained at scan rates of 10 mV s−1, 100 mV s−1, 500 mV s−1, 1000 mV s−1, as depicted in Fig. 1a. Redox peaks for the forward and backward reaction (1) appear at −0.8 V/−0.9 V vs. SCE at 10 mV s−1, indicating the pseudo-reversibility of the reaction due to a 100 mV shift in peak potential. The ORR in these systems commences with the 1-electron reduction of dissolved oxygen (O2),24 followed by the re-oxidation of the superoxide radical (O2˙−); however, the reaction is not completely reversible.25 As superoxide radicals are unstable in DMF, leading to solvent degradation,26 quaternary ammonium ions (e.g., TBA+) are employed to form a complex and stabilize the species (reaction (2)).27,28 The resulting TBA+–O2˙− species, being much larger, impedes full reversibility in terms of mass transport. The expected re-oxidation peaks are observed, but the charge resulting from the negative sweep is slightly larger than the reverse, suggesting the loss of radicals during the cycling time due to diffusion away from the electrode. The peak currents from the CVs in Fig. 1a are collected in Fig. S1 (see ESI†). The TBA+–O2˙− itself can react with DMF and decompose the solvent at longer timescales (reaction (2)). Nonetheless, even at 10 mV s−1 (a peak-to-peak time of 230 s), the reaction is demonstrated to be mostly reversible, attesting to the (short term) stability of the system.
| O2 + e− ↔ O2˙− | (1) |
| O2˙− + TBA+ → [TBA+ − O2˙−] | (2) |
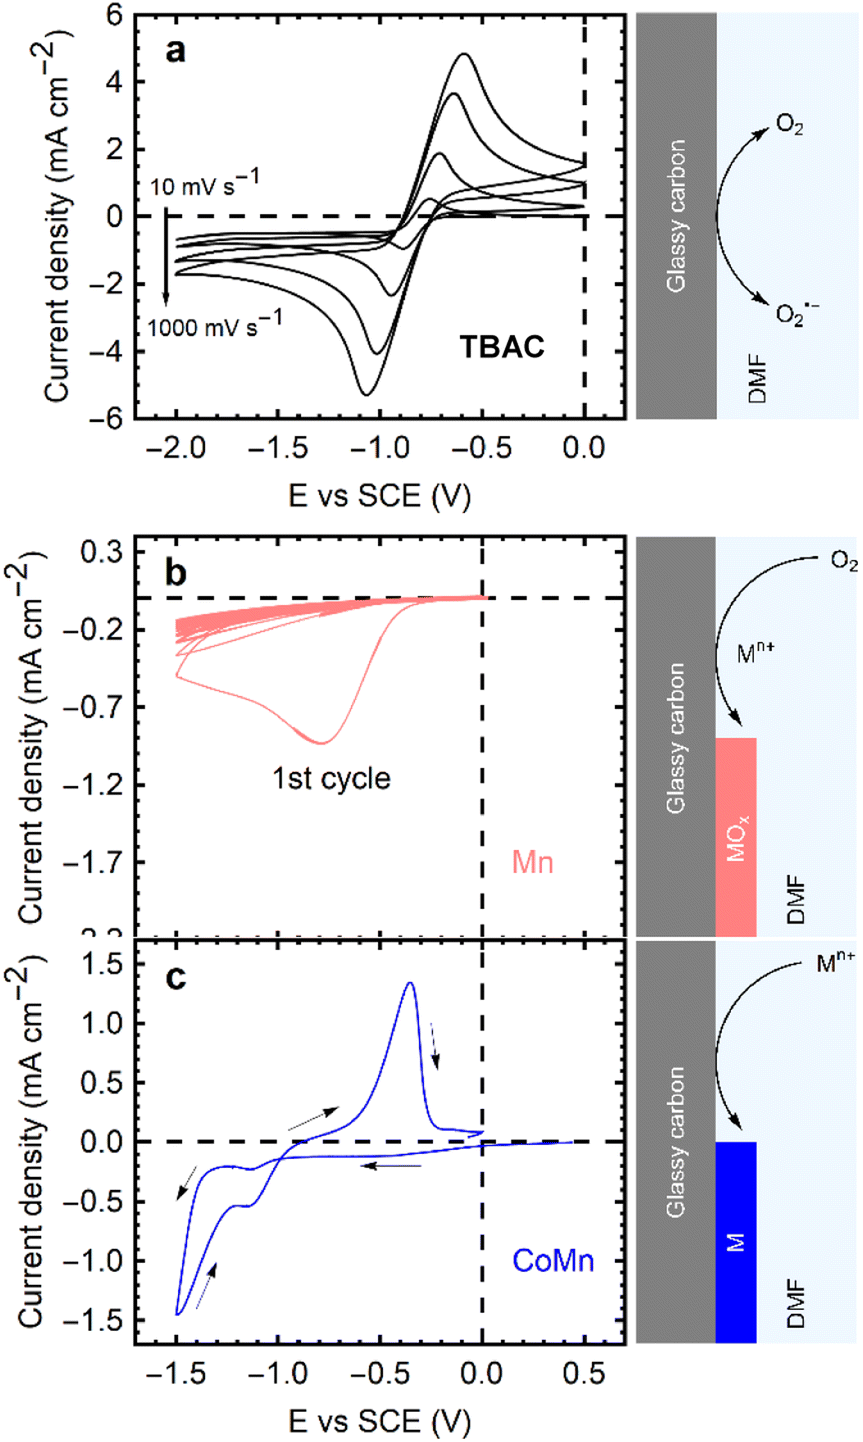 | ||
| Fig. 1 Current density vs. potential cycles of a GCE in DMF with: (a) 0.1 M TBAC, saturated with oxygen, at scan rates of 10 mV s−1, 100 mV s−1, 500 mV s−1, 1000 mV s−1. (b) 0.1 M MnCl2 saturated with oxygen, at 50 mV s−1. (c) 0.05 M CoCl2, 0.05 M MnCl2, de-oxygenated, at 50 mV s−1. Sketches of the respective processes accompany the curves. | ||
To further investigate the reaction, a rotating ring-disk electrode was employed. Oxygen is reduced at the disk, where convection pushes the radicals outwards towards the ring. The stability of the TBA+–O2˙− enables its transport to the ring, facilitating oxidation back to O2. The ring current was calibrated using the ferri/ferro redox couple to measure the collection efficiency of the electrode (38%), arising from the electrode's geometry.
Fig. 2a shows CVs on the disk at 50 mV s−1 for the reduction of oxygen, and the resulting ring currents (polarized at 0.0 V vs. SCE) to oxidize the superoxide. At rotation speeds below 200 rpm, an oxidation peak is observed on the reverse sweep at the disk, indicating the presence of residual TBA+–O2˙− at the surface of the disk electrode. The convection at low rotation speeds is insufficient to completely remove the species from the disk surface before the reverse sweep. To examine these diffusion rates and determine the diffusion coefficients of both species, transient experiments were conducted on the RRDE. Two experiments were designed to measure the diffusion coefficients of O2 and TBA+–O2˙−. First, the ring is polarized at 0.0 V vs. SCE, a potential at which TBA+–O2˙− is oxidized, representing a key advancement in the understanding of the electrochemical behavior of this species. A step in potential brings the disk to −1.2 V vs. SCE, performed at different rotation speeds, allowing for an in-depth study of the reaction kinetics. The current onset on the ring is used to determine the time required for the TBA+–O2˙− to reach the ring (Ts). This transient time is given by eqn (3).
 | (3) |
![[thin space (1/6-em)]](https://www.rsc.org/images/entities/char_2009.gif) log10(r2/r1)2/3) where r2 is the inner ring radius (m), r1 is the disk radius (m), ω is the rotation speed (rpm), D is the diffusion coefficient (m2 s−1), and ν is the kinematic viscosity (9.74 × 10⁻⁷ m2 s−1 at 20 °C). This approach enables a more precise determination of the diffusion coefficient, a crucial parameter for understanding the electrochemical behavior of the TBA+–O2˙− species. The same experiment was repeated for the O2 diffusion coefficient, but in this case, the ring potential was set to −1.2 V vs. SCE. The relationship between the transient times and the inverse of the rotation speed can be used to calculate the diffusion coefficients, as shown in Fig. 2b. The larger TBA+–O2 TBA+–O2˙− species yielded a diffusion coefficient 4.7 times smaller than that of O2 in DMF, 9.43 ± 0.02 × 10⁻¹⁰ m2 s−1 and 4.80 ± 0.01 × 10⁻⁹ m2 s−1, respectively. This results in very close agreement with Vasudevan's measurement of DO2 = 4.89 × 10⁻⁹ m2 s−1, as well as others in the scientific literature.27–29 Details of the transient time measurements are provided in Fig. S3.†
log10(r2/r1)2/3) where r2 is the inner ring radius (m), r1 is the disk radius (m), ω is the rotation speed (rpm), D is the diffusion coefficient (m2 s−1), and ν is the kinematic viscosity (9.74 × 10⁻⁷ m2 s−1 at 20 °C). This approach enables a more precise determination of the diffusion coefficient, a crucial parameter for understanding the electrochemical behavior of the TBA+–O2˙− species. The same experiment was repeated for the O2 diffusion coefficient, but in this case, the ring potential was set to −1.2 V vs. SCE. The relationship between the transient times and the inverse of the rotation speed can be used to calculate the diffusion coefficients, as shown in Fig. 2b. The larger TBA+–O2 TBA+–O2˙− species yielded a diffusion coefficient 4.7 times smaller than that of O2 in DMF, 9.43 ± 0.02 × 10⁻¹⁰ m2 s−1 and 4.80 ± 0.01 × 10⁻⁹ m2 s−1, respectively. This results in very close agreement with Vasudevan's measurement of DO2 = 4.89 × 10⁻⁹ m2 s−1, as well as others in the scientific literature.27–29 Details of the transient time measurements are provided in Fig. S3.†
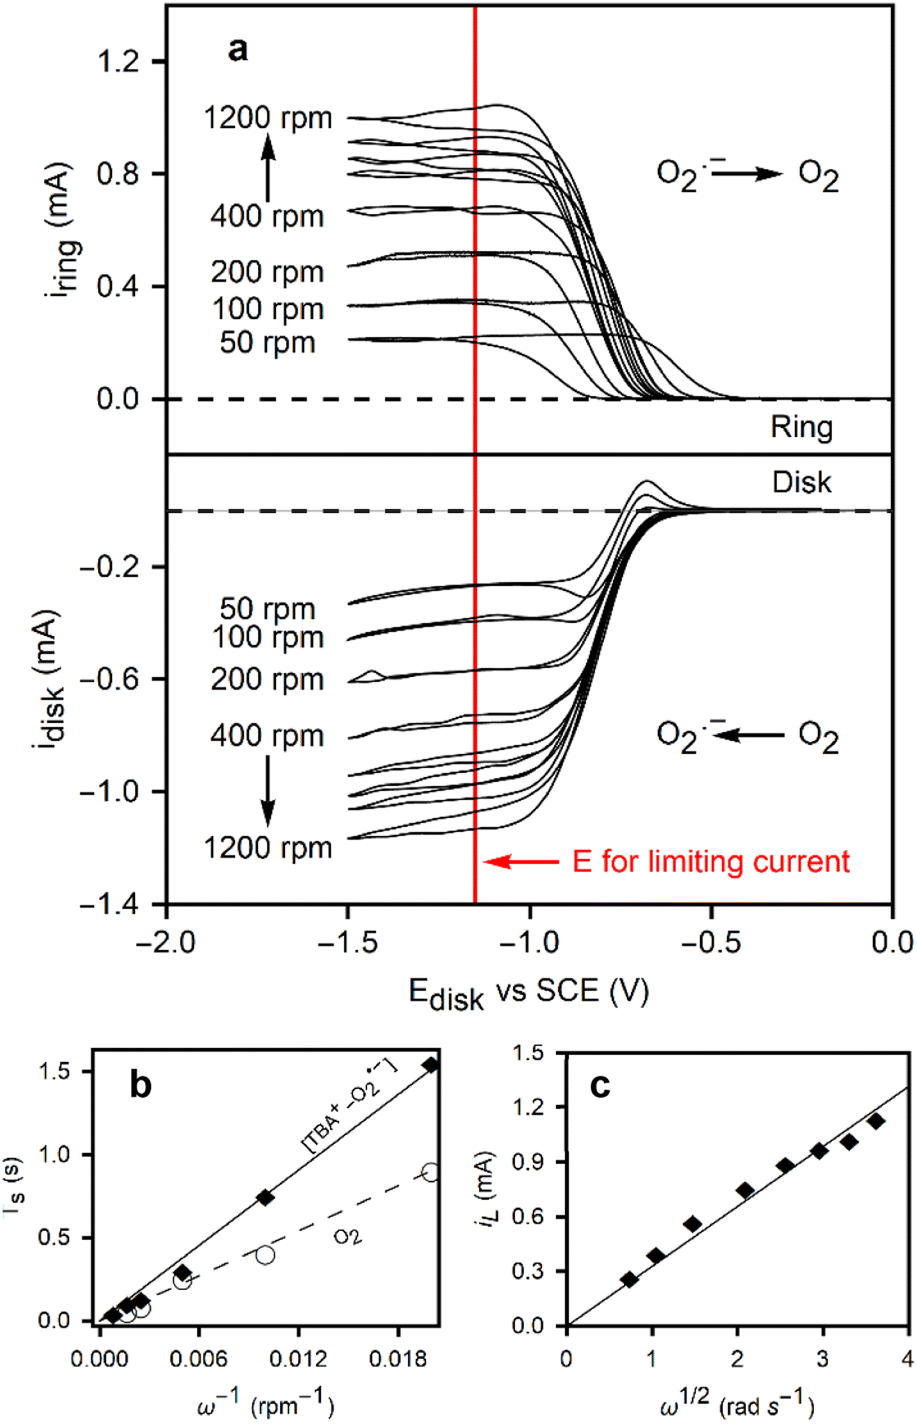 | ||
| Fig. 2 (a) Rotating ring disk electrode experiment with a cyclic voltammetry applied to the disk electrode with a 50 mV s−1 at various rotating speeds, and a chronoamperometry with 0.0 V vs. SCE at the ring, in a 0.1 M TBACl solution saturated with oxygen. The red line denotes the potential at which transient time experiments are performed and the limiting current is taken. (b) Transient time of oxygen/superoxide during the ORR in the RRDE setup at different rotation speeds. (c) Levich plot of the limiting currents as a function of rotation speed. The solid line is the fit from eqn (5). | ||
Given the diffusion coefficient, the limiting currents in the RRDE experiments in Fig. 2c can be used to calculate the oxygen concentration, a critical parameter for understanding the electrochemical behavior of the system. The Levich eqn (4) is as follows:
| IL = 0.620nFAD2/3ν−1/6Cω1/2 | (4) |
I L (A) refers to the limiting current measured in the RRDE experiments in Fig. 2a at the potential marked by the red line. A is the surface area (m2), F is Faraday's constant (C mol−1), n is the number of moles transferred in the electrochemical reaction (1), and C is the oxygen concentration (mol m−3). Using the diffusion coefficient calculated via the transient time experiments, an oxygen concentration of 2.75 mM results, representing a reliable determination of oxygen concentration in DMF.
The Randles–Sevcik equation (eqn (5)), and the voltammetry data in Fig. S1,† can be used to corroborate the diffusion coefficients obtained from the RRDE experiments:
 | (5) |
Besides the O2 + TBAC/DMF electrolyte, two alternative electrolytes were examined, as shown in Fig. 1b and c. Metal chlorides (0.1 M) were prepared in DMF, with oxygen bubbled into the solution to saturation, for Fig. 1b, and nitrogen bubbled for Fig. 1c eliminate oxygen from the solution.
In presence of transition metals and oxygen, the ORR peak appears as in the TBAC electrolyte, albeit with a significantly lower peak current density and no reversibility. Starting from the second cycle, no distinct reduction peak is discernible; instead, a diminished cathodic current appears, which decreases in magnitude with every subsequent peak (Fig. 1b). This decrease in maximum lessens as the cycle number increases, eventually until it pseudo-stabilizing (with less than a 2% change) by the 20th cycle. Cui et al. explored the superoxide radical reaction with divalent cobalt ions in solution via disproportionation:30
| 4O2˙− + 2Co2+ → 2CoO(s) + 3O2 | (6) |
As the superoxide reacts with the metal ions, no oxidation current is seen on the reverse sweeps (Fig. 1b). The metal oxides deposit as thin films and passivate the electrode,20,30 inhibiting further oxygen reduction and thus limiting the ORR in each subsequent sweep. When both the metal chloride and TBAC are used in oxygen-saturated electrolytes, the effects fluctuate depending on electrolyte concentration. Fig. S2 (ESI†) demonstrates the impact of increasing metal concentration in a TBAC electrolyte. In addition to the heightened current density resulting from the increased solution conductivity, larger amounts of metal ions decrease the reversibility of the solution, even in the presence of TBA+. The superoxide produced via the ORR can react with cations in solution, regardless of the presence of the TBA+ complex (reaction (7)).
| 4[TBA+ − O2˙−] + 2M2+ → MO2(s) + 4TBA+ + 3O2 | (7) |
In the absence of oxygen, CVs such as the one in Fig. 1c are obtained. No reduction peaks are observed between 0.0 and −1.0 V vs. SCE. At more negative potentials, direct metal electrodeposition begins. Conductive metallic films, evidenced by the stronger currents in the return sweep, are deposited on the electrode at reducing potentials. The metal films are oxidized at −0.5 V vs. SCE. Consequently, to circumvent electrodeposition of metallic films, all subsequent deposition experiments are performed in a potential range of 0.0 V to −1.0 V vs. SCE in oxygen saturated solutions.
Beyond the purposes of the present study, these findings serve as a stepping stone for gaining deeper understanding of the limiting factors in ORR, developing new approaches to overcome these limitations, and designing improved electrolytes and electrodes for electrochemical applications with the potential to significantly improve their performance.
NMCF single and mixed oxide films as OER electrocatalysts
The general scheme for depositing single and mixed metal oxide films via the ORR is shown in Fig. 1b. Fig. 3 showcases the deposition cycles for each metal ion and their binary mixes. The nanoSEM image in Fig. S4 (see ESI†) reveals the morphology of a CoOx film, which consists of rough nanostructures forming a densely packed film that covers the entire substrate. These oxide films exhibit amorphous characteristics (see Fig. S5 in ESI†), a consequence of the rapid deposition process, insufficient thermal energy, and the inhomogeneous formation method, which are expected to result in low crystallinity.20 The same deposition behavior is observed for all tested electrolytes, except for those containing FeCl2 (Fig. 3).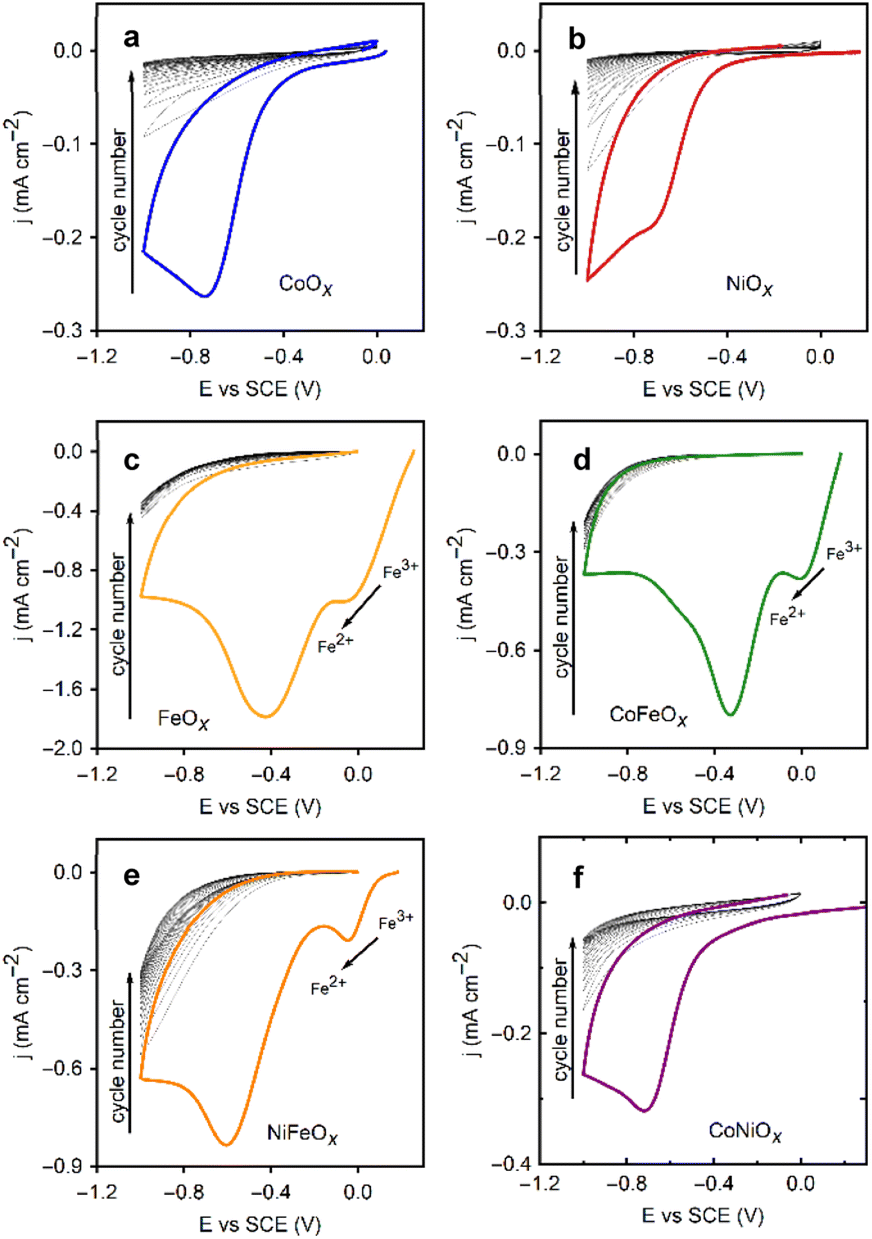 | ||
| Fig. 3 Cyclic voltammograms at 20 mV s−1 of the deposition of the single (Ni, Co, Fe) and mixed (CoFe, NiFe, CoNi) metal oxides over 20 cycles. Potential regions for the electrochemical reactions discussed are noted. The cycle number increases from each initial cycle highlighted, to the subsequent cycles trending towards 0 current. (a) Co. (b) Ni. (c) Fe. (d) CoFe. (e) NiFe. (f) CoNi. | ||
Oxygen dissolution in the saturation step prior to electrochemical experiments oxidizes Fe(II) to Fe(III), altering the color of the solution from yellow to brown. Upon starting the CV, a reduction peak appears at 0.0 V vs. SCE for the reverse reaction (Fe(III) → Fe(II)), followed by the expected oxygen reduction peak. In this case, a larger reduction current persists throughout the CVs for the reduction of Fe3+. For mixed metal solutions containing FeCl2, the magnitude of the current in the CVs lies between that of each single metal deposition, with the Fe(III) reduction peak still visible. The presence of metal ions in all cases reduces the overpotential for the ORR in the initial deposition cycle relative to that in the TBAC electrolytes.
A benchmark test of these metal oxide films was performed to identify trends in terms of OER electrocatalytic activity and to compare this technique with similar existing methods in scientific literature. The most common benchmark parameters include overpotential at set current densities and Tafel slopes. Fig. 4b presents the polarization curves of the films before and after electrochemical conditioning, along with the extracted Tafel slopes, and the conditioning process itself. The first polarization curve (Fig. 4a) for FeOx shows no significant precatalytic current, indicating full Fe(III) content, which is expected given that the solubility of oxygen in the Fe(II)/DMF solution is sufficient to oxidize all iron ions. CoOx exhibits a small oxidative peak at +1.08 V vs. RHE during the first polarization curve, attributed to the Co(II) to Co(III) oxidation prior to the onset of the OER at +1.35 V vs. RHE.16 The low peak current (<0.2 mA cm−2) suggests that only a small amount of the initial Co(II) remains after the deposition. On the other hand, NiOx films display a larger oxidation current peak (0.6 mA cm−2) at +1.46 V vs. RHE, coinciding with the OER onset. The peak potential aligns with the expected value for the oxidation of Ni(II)(OH)2 to Ni(III)OOH, the more electrocatalytic species of Ni for the OER.10,16,31 While the exact valence structure of the materials is left for further work and optimization, it can be concluded that the oxides contain a majority Fe(III) and Co(III), with partial Co(II), Ni(II), and Ni(III) content, respectively.
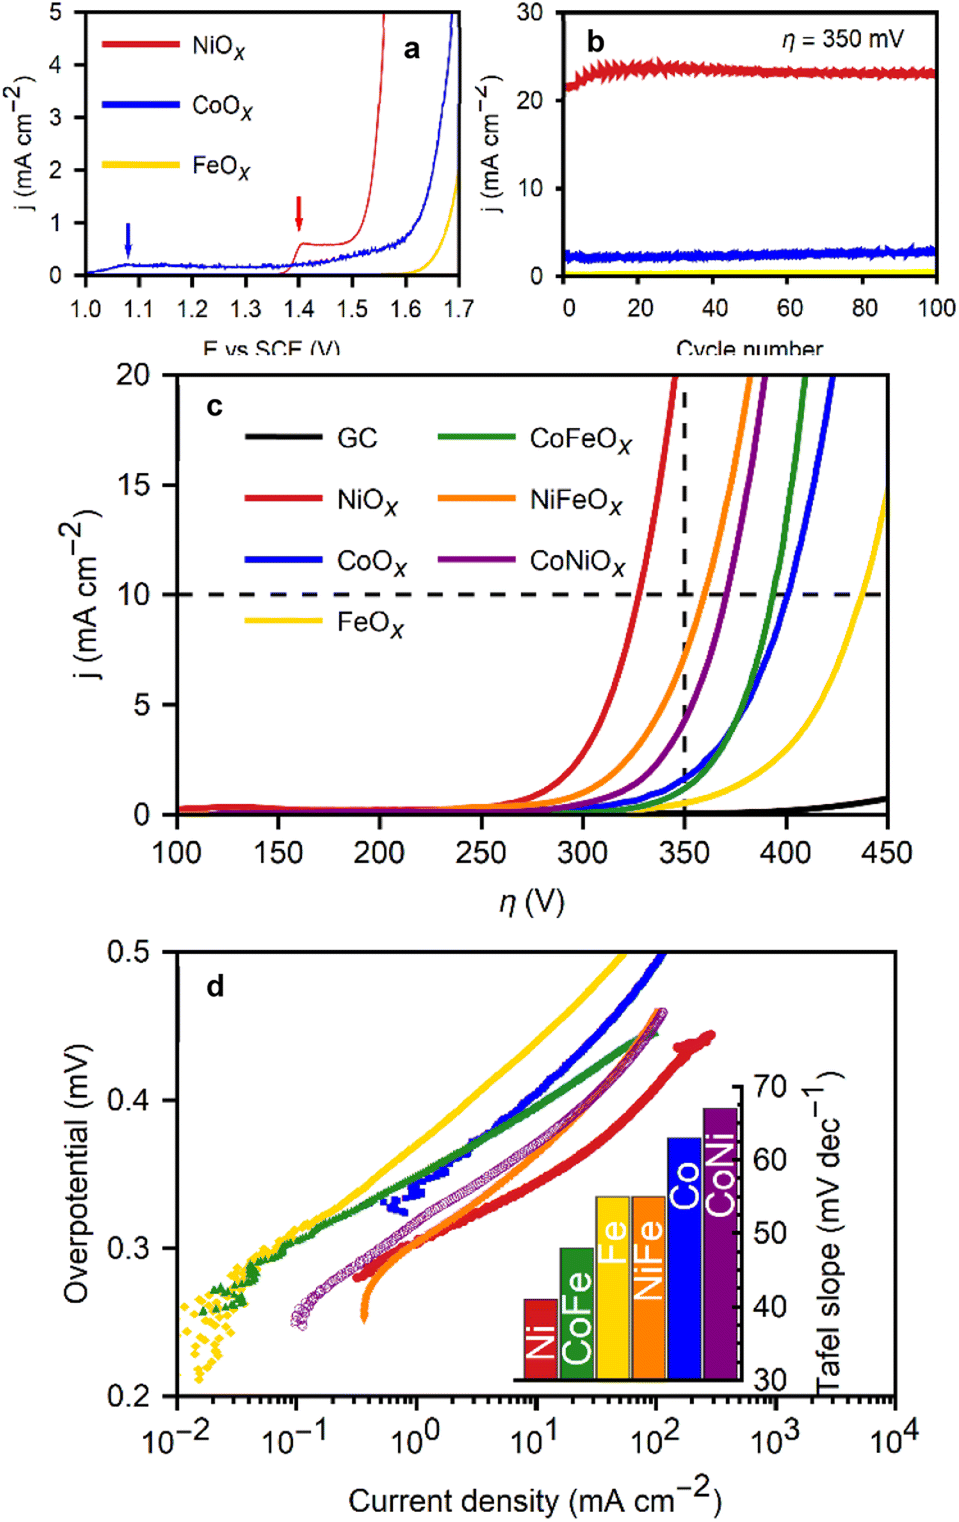 | ||
| Fig. 4 Electrocatalytic response from metal oxide films on glassy carbon for the OER in 1 M KOH. (a) First polarization curves for Fe, Co, and Ni oxide films. (b) Current density at an overpotential of 350 mV during 100 conditioning cycles for Fe, Co, and Ni oxides. (c) Polarization curves for all oxides studied and the bare glassy carbon substrate, relevant conditions of 10 mA cm−2 and 350 mV of overpotential are noted (d) Tafel plots with the slopes as an inset of the metal oxide films OER activity. | ||
The as-deposited NiOx films initially produced slightly reduced currents and larger Tafel slopes. However, their performance improved with electrochemical conditioning of the films through 100 CVs in a 1 M KOH solution. The current experienced a significant increase after the first cycle, continuing to rise for the first 20 cycles, after which the voltammetries stabilized. Subsequently, LSVs at a slower scan rate (5 mV s−1) were performed to obtain the characteristic values of the films. Fig. 4b displays the current densities at 350 mV overpotential during the conditioning cycles for FeOx, NiOx, and CoOx films. Conditioning for Ni oxide films is known to enhance performance due Ni2+ oxidation during cycling at potentials greater than 1.4 V vs. RHE, supporting the hypothesis of incomplete oxidation of the Ni ions during the deposition, with some divalent ions likely still present in the oxide. Films without Ni did not exhibit as pronounced changes during conditioning.
A clear activity trend is seen from the data: NiOx films exhibited the best performance (η10mAcm−2 = 330 mV), followed by CoOx (η10mAcm−2 = 395 mV), and lastly FeOx (η10mAcm−2 = 440 mV). Depositing films from binary mixtures of Fe, Co and Ni results in an increase in overpotential for NiFeOx (η10mAcm−2 = 370 mV) and consistent performance to CoFeOx (η1010mAcm−2 = 380 mV) relative to the individual metal oxides. Predictably, the η10mAcm−2 of the CoNiOx films (370 mV) falls between the overpotentials of the individual metal oxide benchmarks. A full table of overpotentials is available in Fig. S6 (see ESI†). The best performing film, NiOx, excels in terms of both Tafel slope (43 mV dec−1), and characteristic overpotentials (η1mAcm−2 = 280 mV and η10mAcm−2 = 325 mV). These values rank among the lowest found in the literature for non-noble metal electrodeposited catalysts, where overpotentials (η10mAcm−2) commonly range between 350 mV and 430 mV.4,32 Crystalline nanoparticles with tailored structured such as nanosheets of layered double hydroxides can exhibit slightly better performance. Otherwise, the NiOx films presented here favourably compare with most transition metal oxides,7–9,33,34 and even iridium oxide catalysts.4,5,7,35
The area used for the current density calculation is the projected area of the glassy carbon electrodes: 0.07 cm2. After deposition, the roughness of the films yields a larger surface, which in turn contributes to the electrochemical activity of the catalysts. The electrochemically active surface area (ECSA) was calculated using the ratio of the double-layer capacitance (Cdl), measured via CVs in the non-faradaic region, and the specific capacitance for a smooth film (Cs). The slope of the charge passed versus the scan rate in the CVs is equal to double the Cdl (eqn (8)). The calculated Cdl can be compared with the commonly used reference value of 0.04 mF cm−2 for smooth oxide films in alkaline media,17,18,36,37 resulting in the ECSA (eqn (9)). By dividing the ECSA by the geometric surface area, a roughness factor (Rf) is obtained.4
 | (8) |
 | (9) |
The Rf ranged from 7 (NiOx) to 25 (CoOx). The ECSA (and by extension Rf) increases with the number of deposition cycles from the first to the 5th one (Fig. S7†). These are estimates of the order of magnitude by which the real surface area multiplies the geometric one, and are generally similar to the range found in other cathodic electrodeposition methods.4
The results obtained emphasize the improved performance of electrodeposited amorphous NiOx films as catalysts for the oxygen evolution reaction (OER). The enhancement of these catalysts' performance, reflected in their low overpotentials and Tafel slopes, demonstrates their potential as a cost-effective and environmentally friendly alternative to noble metal catalysts, such as iridium oxide. The optimization of these transition metal oxide catalysts, specifically the NiOx films, aligns with the broader research agenda of addressing global energy and environmental challenges by contributing to the advancement of efficient, sustainable, and economically viable hydrogen production technologies.
Characterization of the OER in NiOx/GC
To elucidate the morphology and electrochemical activity of the NiOx films, advanced electrochemical measurements were conducted. Fig. 5a presents the deposition cycles for NiOx films and the diminishing peak current discussed in previous sections. The polarization curves for NiOx films deposited in 1, 5, and 20 cycles (Fig. 5b) demonstrate a marked improvement in OER performance after the first deposition cycle, while the performance of the films resulting from 5 or 20 deposition cycles remains indistinguishable, suggesting a saturation effect of the electrocatalytic activity.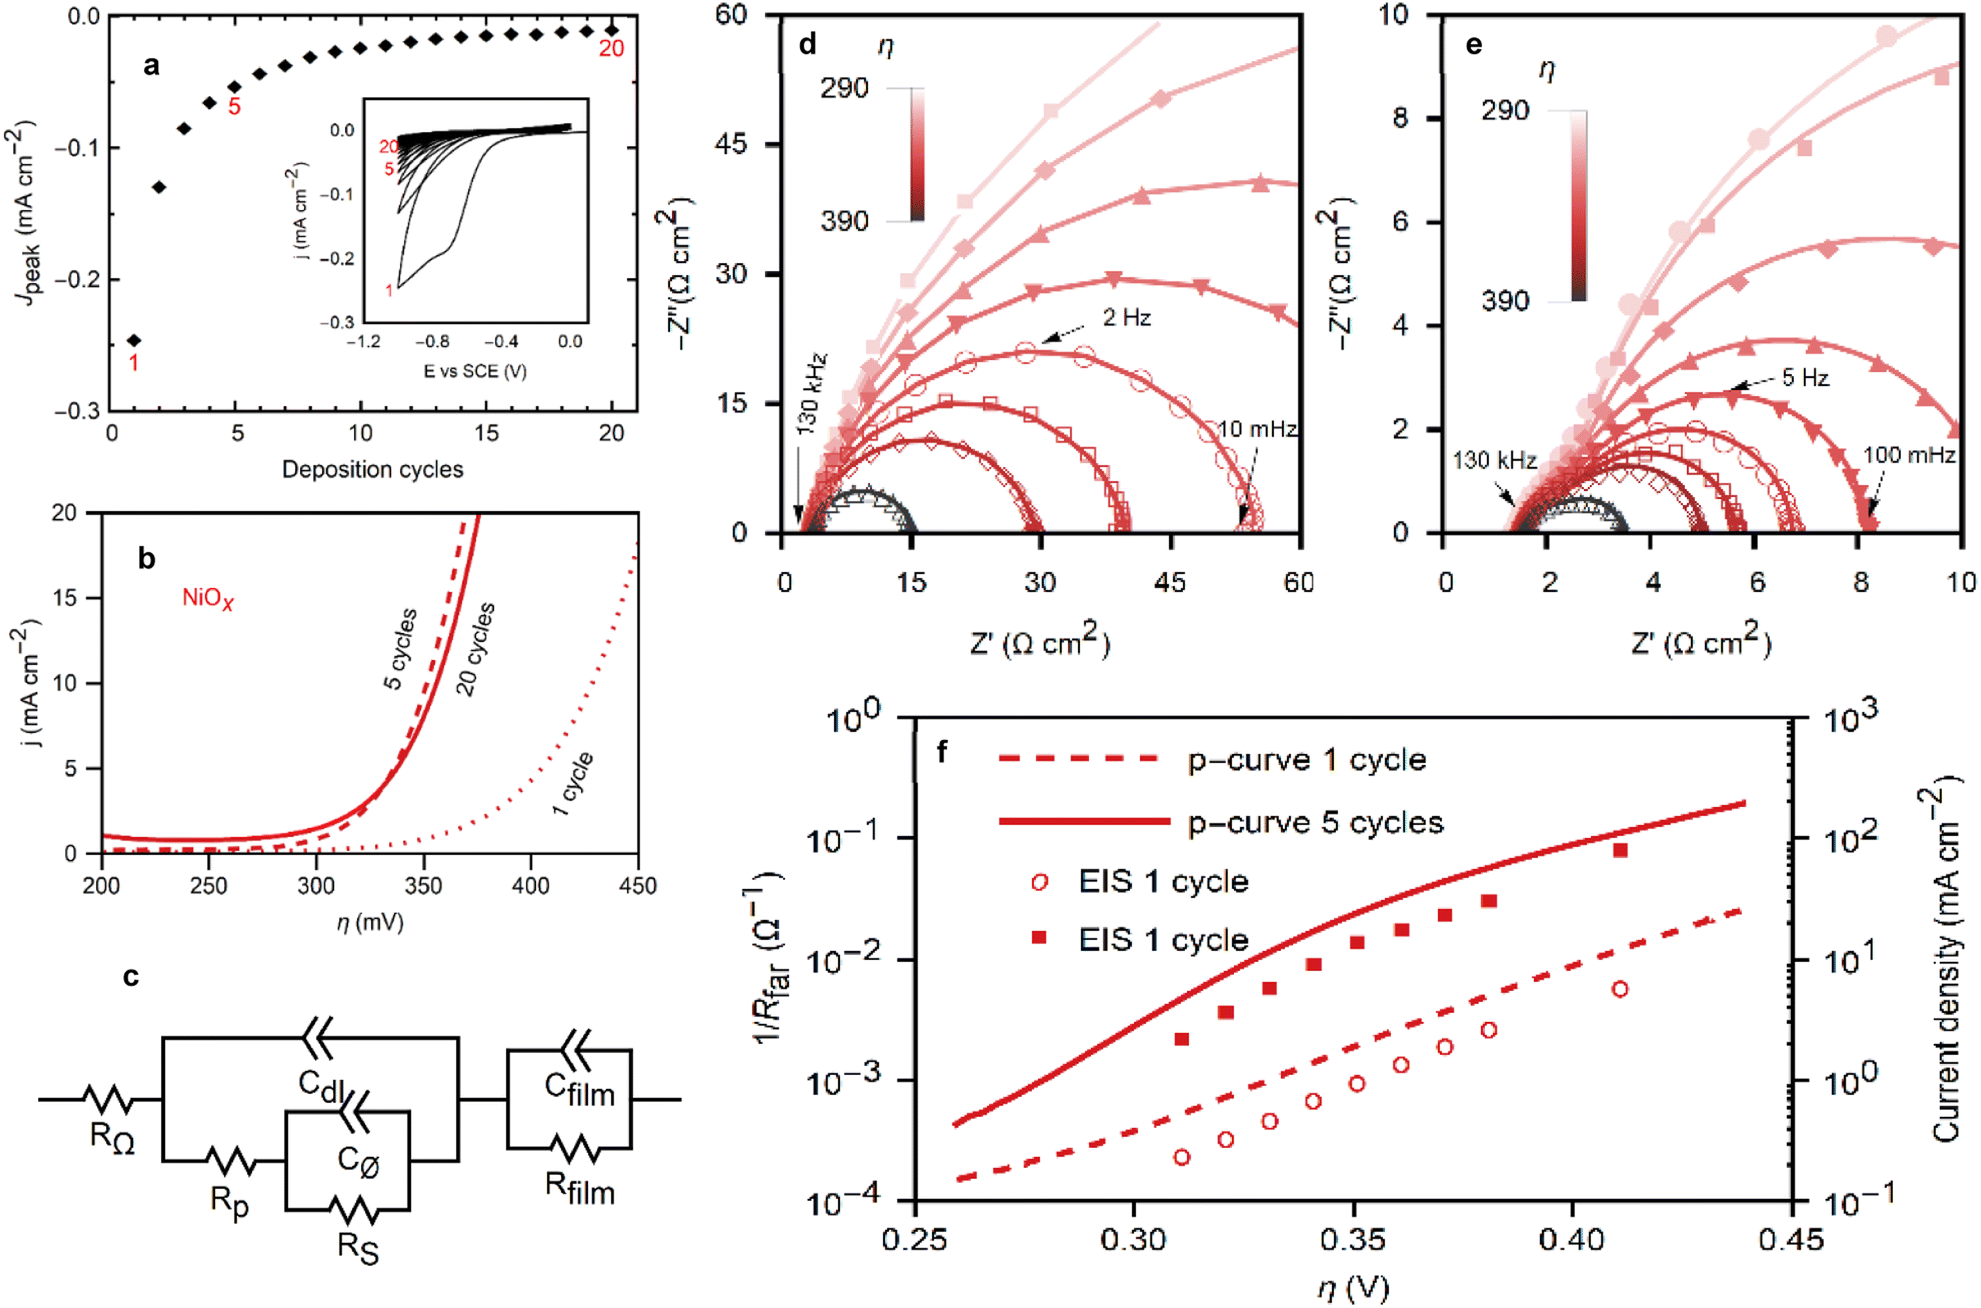 | ||
| Fig. 5 (a) The peak currents of each deposition cycle from the inset are plotted with cycles 1, 5 and 20 highlighted and (inset) cyclic voltammograms at 20 mV s−1 of the deposition of the nickel oxides over 20 cycles. (b) Polarization curves for the OER with NiOx films deposited from 1, 5, and 20 cycles. (c) Equivalent circuit for the impedance process adapted from Lyons et al.38 EIS Nyquist plots of NiOx films ((d) deposited with 1 cycle, (e) deposited with 5 cycles) on GCE in 1 M KOH at applied overpotentials ranging from 290 mV to 390 mV. (f) Tafel plots made from EIS and dc polarization data of NiOx of films deposited from 1 and 5 cycles. | ||
Electrochemical impedance spectroscopy (EIS) was performed at steady-state operation in a range of applied potentials covering the low- and high-overpotential regions in the Tafel plot of Fig. 5f, providing valuable insight into the reaction kinetics and film properties. Nyquist representations of the EIS responses of NiOx films (Fig. 5d and e) emphasize the significance of the exchange in OER between films deposited from 1 cycle in NiCl2 (NiOx1C) and 5 cycles (NiOx5C). Nine different potentials were applied during the EIS experiments ranging from 290 mV to 390 mV in overpotential for the OER reaction.
The Nyquist plot for NiOx1C displays a single semicircle across all potentials, between the 100 kHz to 10 mHz, consistent with a passive Ni oxide film covering the electrode (i.e., the magnitude of the impedance decreases with increasing overpotential). The Bode plots in Fig. S8 (see ESI†) show more explicitly the frequency ranges for the impedance. By employing an equivalent circuit model (Fig. 5c) based on the work of Lyons et al., a comprehensive analysis of the film properties and reaction kinetics can be performed, shedding light on the interfacial charge transfer processes and the impact of the catalytically active Ni(III) surface species (NiOOH) on the OER kinetics. RΩ represents the uncompensated electrolyte resistance, Rfilm and Cfilm relate to the resistivity and dielectric properties of the film, Cdl is the double layer capacitance, Rp, Rs, and Cφ relate to the kinetics of the interfacial charge transfer reaction and the relaxation of the charge associated with the adsorbed intermediates.38–41
With a Tafel slope of 60 mV dec−1 and phase maxima in the frequency region commonly associated with the RsCφ time constant, the NiOx1C film exhibits the features of a film with kinetics that depend on the formation of the catalytically active Ni(III) surface species (NiOOH).38,42 The fitted parameters are plotted in Fig. S8 (see ESI†). Note that only RS and Cφ are shown for NiOx1C. The magnitude of the impedance obscures the contributions from the other elements. The single semicircle seen in the Nyquist plot is a superposition of both time constants, RsCφ and RpCdl, making the latter elements inaccessible from these data.38 Meanwhile, the dielectric properties of the film are expected to result in an impedance response that lays outside of the scanned frequency range.15,43 For all capacitive elements in the impedance modelling, Constant Phase Elements (CPEs) were used instead of ideal capacitors. Frequency dispersion in CPEs (α < 1) is generally attributed to deviations from ideality, i.e., roughness and inhomogeneity in the film,44 as expected for a rough film (high Rf). The CPE exponent for the NiOx1C films (αφ1) was constant and equal to 0.87 for all applied overpotentials between 290 mV to 390 mV.
In contrast, the NiOx5C cycle exhibits 2 distinct semicircles: a higher frequency response between 103 Hz and 102 Hz that is smaller in magnitude, and a lower frequency response with a peak between 102 Hz and 101 Hz that dominates the spectra at low overpotentials. This is indicative of an increase in the number of active sites and a more intricate interplay between the film properties and reaction kinetics. The low-frequency response for NiOx5C is strongly dependent on the applied potential, and the high-frequency semicircle, which has a less pronounced dependency on it (Fig. 5e and S8 in ESI†), is attributed to the double-layer capacitance of the film. This element is partially masked by the RsCφ response at lower overpotentials. At a high overpotential (>390 mV) the RpCdl loop becomes the larger contributor. The increased roughness factor from 6 (NiOx1C) to 9 (NiOx5C) increases the capacitive contribution, as well as the number of active sites. While the roughness increases by 50%, roughness alone cannot account for the increase in catalytic performance (Fig. 5b). At η = 350 mV the current density increases by a factor of 10 in NiOx5C films relative to NiOx1C films. Furthermore, the Tafel slope decreases to 48 mV dec−1. A slope of ca. 40 mV dec−1 is commonly ascribed to a rate-determining step (RDS) after the formation of the active metal intermediary. While the specific mechanism is uncertain, the RDS may involve a charge transfer process related to the oxidation of the adsorbed oxygen species, such as peroxide formation on the catalyst surface (Ni–OH → Ni–O2H2).45 Thus we propose that the ORR deposition cycles not only increase the surface coverage of the electrode with the NiOx film, but also oxidize the surface cations to their catalytically active form (Ni(III)). As such, with a higher roughness and a more active surface, the ten-fold increase in the catalytic activity of the films after 4 ORR cycles can be explained. The Nyquist plot for NiOx5C reflects these morphological changes, the lower faradaic resistance is comparable to the higher capacitive contribution, and is characteristic of active Ni oxide films.38 Nonetheless, as shown in the previous section, some unoxidized Ni(II) sites remain on the film after 5 deposition cycles. The apparent double-layer capacitance calculated from the impedance data is larger than that obtained by cyclic voltammetry (Fig. S7†). While the voltammetry experiments were performed in a less oxidative potential range to approach a purely non-faradaic current, the potential used for the impedance experiments overlaps with that of Ni(II) oxidation (Fig. 4a). This redox reaction leads to an inflated value for Cdl. Rather than a true double-layer capacitance, the capacitance includes a pseudo-capacitance contribution due to a redox reaction in the film.14 Recapping, this analysis provides a deeper understanding of the factors contributing to the ten-fold increase in catalytic activity observed in NiOx5C films compared to NiOx1C films, such as the higher roughness and the presence of a more active surface.
EIS was also employed for the Tafel analysis. A comparison with the values obtained through the polarization curves described earlier is shown in Fig. 5f. The faradaic resistance (Rfar) is extracted from the Nyquist plots as the low-frequency resistance minus the ohmic and film resistances (Rfar = Rp + Rs).42 The decreased faradaic resistance from the higher concentration of active sites in NiOx5C films vs. NiOx1C films is seen in the impedance spectra. The Tafel equation relates the current with overpotential:
| i = i0exp(2.303η/b) | (10) |
With b the Tafel slope, and i0 the exchange current density. Differentiating with respect to the overpotential
 | (11) |
Substituting di/dη with 1/Rfar, and taking the logarithm yields a form of the Tafel equation:40
 | (12) |
The results from the Tafel analysis concur with the values obtained through standard polarization curves. EIS Tafel slopes yielded 48 mV dec−1 and 74 mV dec−1, respectively, for the low and high overpotential regions. These values are in close agreement with the 48 mV dec−1 and 82 mV dec−1 obtained from direct polarization curves for the 5 cycle film. For NiOx1C, a single Tafel slope is observed at 65 mV dec−1 with both methods. The higher Tafel slope at higher overpotentials is attributed to the formation and detachment of oxygen bubbles from the active sites at high currents. The absence of two slopes observed for the NiOx1C is attributed to the lower current densities over the analyzed range. Even at the highest overpotentials, the resulting current lies below that of the potential inflection point for NiOx(5C). Not enough current is drawn so as to shift the kinetics of the process.
This advanced morphological and electrochemical analysis provides a more convincing and insightful understanding of the improved OER performance observed in NiOx films.
High current OER through porous substrates
To further explore the capabilities of the film growth method and address the needs of industrial applications, which require higher current densities than those achieved on flat substrates,15,46 reticulated vitreous carbon (RVC) electrodes were utilized. The geometric surface area of the glassy carbon disks is limiting to the mass loading of the films. Microporous RVC (24 pores per cm, ∼250 μm pore diameter, 2.5 mm thick) has the same electrochemical behaviour as glassy carbon, while offering a larger surface area for coating. In this way, the electrocatalytic properties of the films can be studied on 3D substrates without the interference of the substrate itself during the OER. The film deposition procedure remained consistent: ORR via CVs between 0.0 and −1.0 V vs. SCE in the presence of metal chlorides in DMF. However, more deposition cycles were employed for the RVC foams to ensure total surface coverage, as the diffusion of oxygen through the pores into the inner structure of the foam slows down the deposition process. Thirty cycles were applied in this case. The self-limiting nature of the method allows for the use of more deposition cycles to coat the foam over a longer period of time, without risking clogging the pores with thick layers of material.Fig. 6 presents the micrographs of uncoated-RVC (a), alongside progressively higher magnifications of the Co oxide coated RVC (b–d). The conformal, full-coverage, coating is shown. The carbon foam is covered homogeneously, including the inner foam walls. The self-limiting nature of the technique allows for the coating to continue onto unexposed inner walls instead of covering only the outside structure.
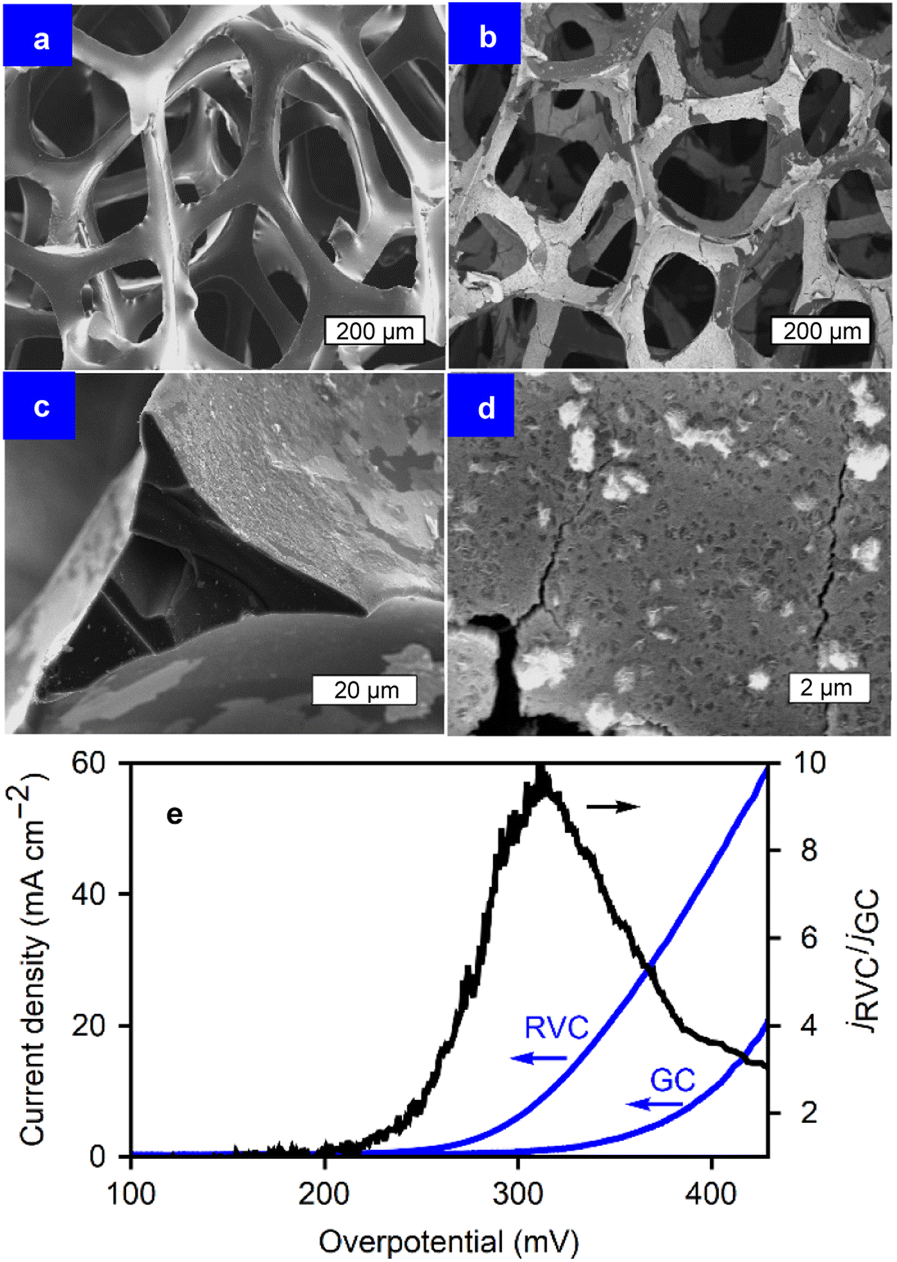 | ||
| Fig. 6 SEM images of RVC electrodes (un-)coated with CoOx. (a) Pristine RVC. (b–d) Progressively higher magnification of CoOx films on RVC after 30 deposition cycles and electrochemical conditioning. (c) Cross section of the CoOx films on RVC. | ||
The increased surface area enables a larger current output during the OER, resulting in a significantly larger current density than that of flat substrates (e.g., GC) when considering the projected surface area. The method from Friedrich et al. was used to estimate the specific surface area per unit volume (As = 40 cm−1),47 taking into account the RVC strut dimensions from the SEM images and a density of 0.05 g cm−3 with 24 pores per cm. With a known As, the ratio of real surface area to the projected one was calculated to be 10 for this specific RVC sample. Fig. 6e displays the polarization curves for the OER performed on CoOx for both RVC and GC, where the current increases considerably above an overpotential of 200 mV. This is likely due to a combination of the capacitive and faradaic contributions, amplifying that of the CoOx/GC by a factor of up to 10 at η = 300 mV. This represents an 85 mV decrease in overpotential at 10 mA cm−2 (η10), from 401 mV for CoOx/GC to 316 mV for CoOx/RVC. Such a significant decrease in η is in agreement with the expected surface area ratio of 10, and highlights the advantages of a porous substrate and the coating method's ability to exploit those advantages. The increased number of deposition cycles were sufficient to overcome mass transport limitations inside the porosity during coating. The ECSA of 5.9 mF cm−2 is 6 to 20 times higher than that of CoOx films on glassy carbon, depending on the deposition cycles applied. Nonetheless, at high current densities, bubble formation and transport limitations become problematic. Due to the pore size, bubbles can become trapped inside the structure, impeding further reaction at the covered sites. Consequently, the current density ratio (jRVC/jGC) falls to approximately 3 for a jRVC > 60 mA cm−2. If only the projected surface area on the front and back of the RVC electrodes were active, the value of jRVC/jGC should approach 2. With the sides of the material also being active, as well as a (diminished) contribution from the porosity, jRVC/jGC remains above 2 for these current densities.
It is important to note that, similar to coated GC electrodes, the metal-oxide/RVC also eventually fails during constant anodic polarization (OER). Fig. 7 shows the chronopotentiometry, demonstrating the stability of the film during 1 week of operation. After 170 hours, the catalysts begin a slow failure process. The micrographs in Fig. 7 reveal the morphology of the material before and after operation. While the initial state exhibits a mostly covered RVC substrate, during failure, the electrocatalytic oxide film is partially removed from the substrate. This delamination process is thought to be due to the poor adhesion between the glassy carbon and the metal oxides. The formation of bubbles damages the films during operation. The stability during the first 160 hours of operation, followed by a delamination process, underscores the necessity to examine catalyst stability longer than values commonly found in literature, such as 1 h, 24 h, or 100 cycles. Another contributing factor can be damage to the carbon support itself during prolonged testing.
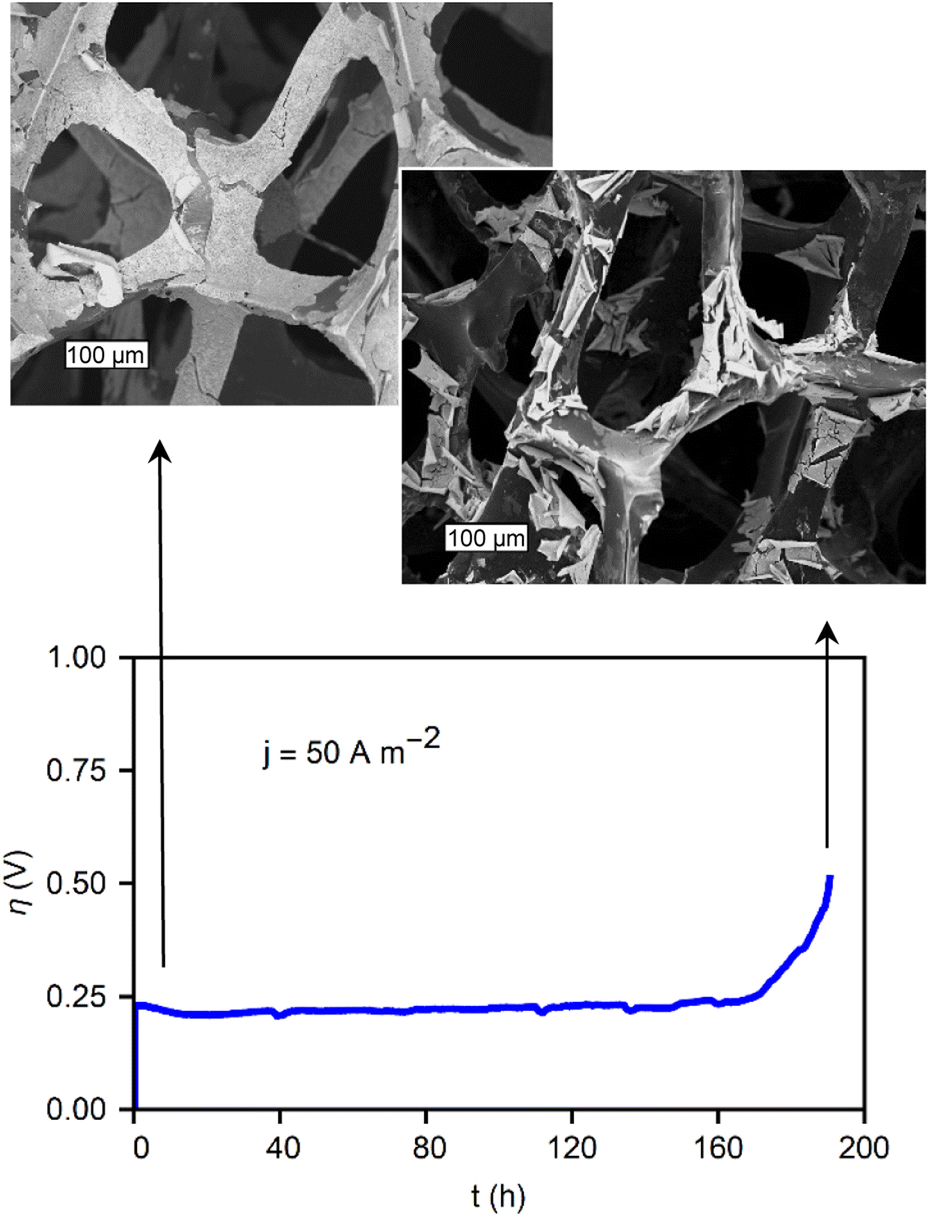 | ||
| Fig. 7 CP showing the stability of a CoOx/RVC film under a current of 50 A m−2 with micrographs of the material at its initial state, and after failure. The scale bars are 100 μm. | ||
This study provides valuable insights into the benefits of using porous substrates and serves as a basis for future research focused on enhancing the long-term stability and performance of metal-oxide/RVC systems for industrial applications.
Stability through better interfacial film/substrate contact
The deposition procedure was also applied to Ni-foam (NF), leveraging the porous structure to exploit the self-limiting nature of the coating method, as observed with the RVC electrodes. Additionally, NF offers superior OER electrocatalytic activity, high conductivity, and a metal/metal oxide interface.13,48 The metal oxide deposition exhibits similar diminishing current densities across the subsequent deposition cycles, as observed with the GC electrode. Fig. S9 (see ESI†) presents the ORR in TBAC/DMF and CoCl2 + FeCl2/DMF, indicating that, unlike carbon supports, the nickel electrode can oxidize by reacting with superoxide, even in the presence of TBA+. This reactivity leads to a loss of reversibility in the absence of metal ions in solution. Consequently, both the surface nickel and metal ions in solution can be oxidized, forming mixed-metal structures coating the metallic foam.The SEM images in Fig. 8 display the structure of the foam at different magnifications, revealing a uniform, thin, rough surface covering the structure. EDS images in Fig. 6 highlight the foam coated with NiCoFeOx after 20 deposition cycles in a CoCl2 and FeCl2 bath. Fig. S9 (see ESI†) provides SEM images of the TBAC cycled foam. The metals can be seen coating the entire structure. XRD traces of the coated foam, as shown in Fig. S9 (ESI†), are primarily composed of sharp reflections of metallic Ni, with small peaks of NiO and an amorphous component from the deposited metal oxide.
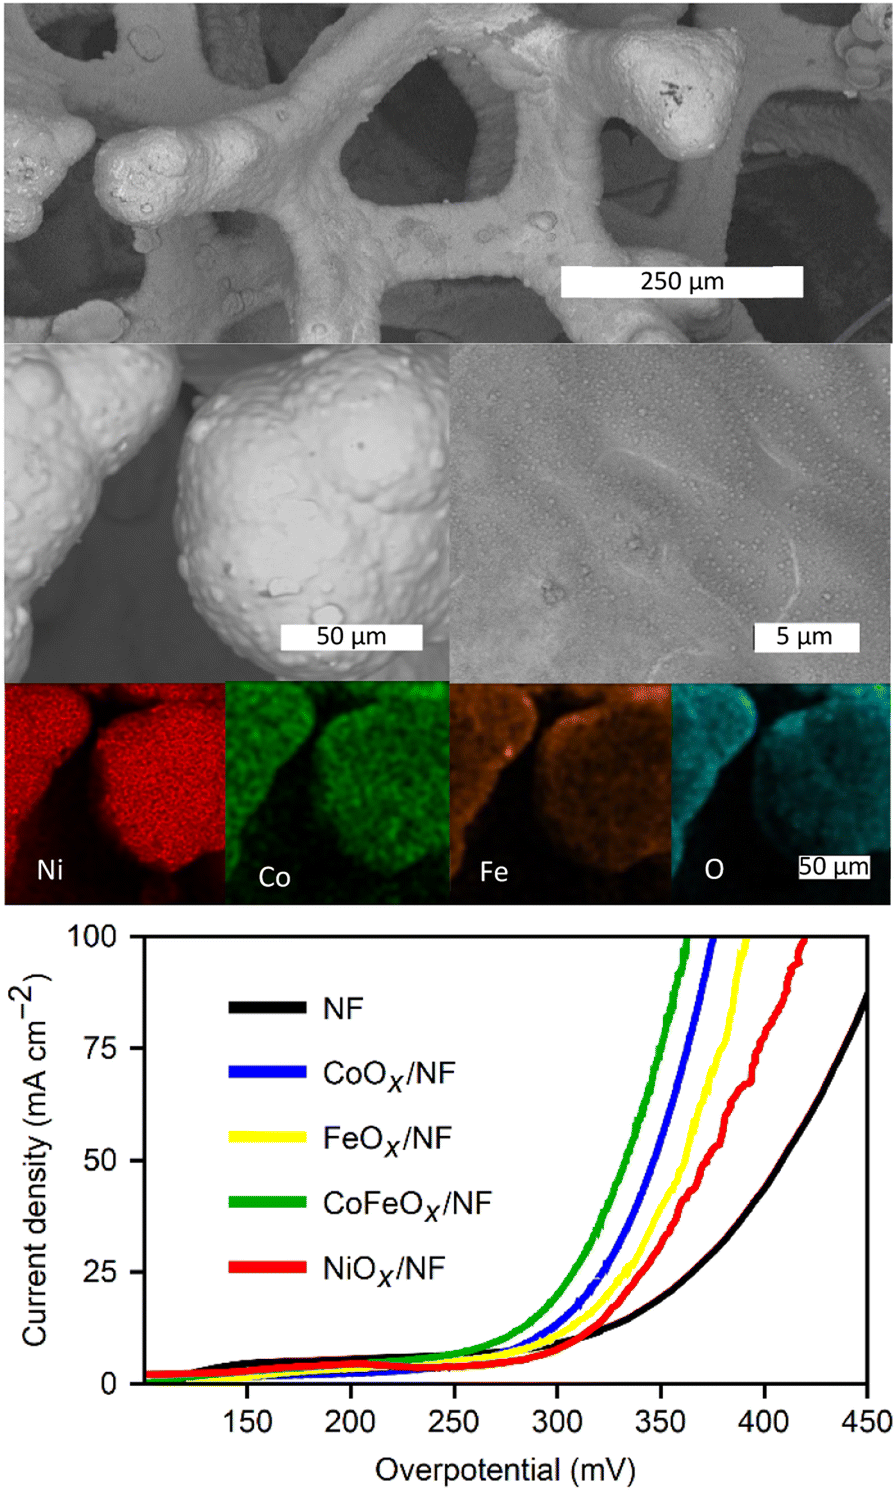 | ||
| Fig. 8 SEM images from backscattered electrons of nickel foam first cycled 20 times in DMF solutions of CoCl2 + FeCl2 and then cycled 20 times in 1.0 M KOH/H2O for the OER tests. EDX elemental mapping of the constituent metals, and oxygen. Bottom: polarization curves in 1.0 M KOH for the different oxide films. | ||
As the amorphous films deposited on carbon exhibited similar electrochemical behavior, the same electrochemical testing protocol was used for the foam electrodes. In Fig. S10 (ESI†) displays the CVs between 0.1 V and 0.5 V vs. SCE, demonstrating the pseudo-capacitance on the films. CoOx films on GC were previously found to possess up to 3 times the capacitance of the other films tested. The same trend is observed on the nickel foams: CoOx/NF exhibits significantly higher capacitance than the rest of the samples, all producing comparable CVs. The redox peak potentials shift with the addition of Fe and Co over the bare nickel foam, but the capacitance is similar overall.
The electrocatalytic performance of the films was evaluated after 100 cycles in the shown potential range. The resulting polarization curves (Fig. 8) indicate significant improvement in NF. Fe (η100mAcm−2 = 380 mV), Co (η100mAcm−2 = 365 mV), and CoFe (η100mAcm−2 = 355 mV) all produce similar current densities at the scanned potentials. As oxide growth occurs on a Ni substrate, all surfaces contain a mixture of Ni and the respective metals present in the deposition bath. The TBAC cycled nickel foam (η100mAcm−2 = 400 mV), denoted as NiOx/NF, exhibited a substantial increase over the pristine NF (η100mAcm−2 > 400 mV), albeit with lower performance than the deposited oxide films. Since all the oxides deposited on nickel foam result in binary or ternary metal oxide mixes due to the oxidation of the foam itself, similar OER performance is expected with FeOx as the least effective performer and CoFeOx/NiOx/Ni (CoFeOx/NF) as the best.
The improved performance of the NF when cycled in TBAC is noteworthy. The oxidized foam (via ORR/superoxide) performed significantly better than bare Ni foam, and only slightly worse than the rest of the deposited films. Simply applying ORR cycles as pre-treatment to the electrode significantly improves its performance. This treatment paves the way for an even simpler activation of the foam for OER applications if these overpotentials are sufficient. Remarkably, all deposited films perform well compared to the state of the art electrocatalyst of similar composition.9,11,12,19,34 Table S1 (ESI†) presents a collection of benchmarks from literature, better situating the performance of the materials presented here.
After conditioning, the CoOx/NF was polarized at 10 mA cm−2 to test stability and potential evolution (Fig. 9). Over three days of polarization, the overpotential decreased. At this point (“2”) new polarization curves were performed. Fig. 9 (inset) shows the polarization curves at the different points noted in the stability tests above it. The CoOx/NF electrode exhibited increased performance, with a 75 mV reduction in overpotential at 100 mA cm−2, reaching this current density at only 1.53 V vs. RHE (η100mAcm−2 = 300 mV). This performance is impressively low overpotential for electrodes with this geometry and composition. After point “2” the current density was increased to 100 mA cm−2, the usual benchmark for high-current density tests in similar studies. After 528 h of polarization the electrode was rechecked (point “3”). The polarization curve exhibited a slight decrease (η100mAcm−2 = 325 mV) compared to peak performance but maintained an overall increase in performance over the initial, electrochemically-conditioned, CoOx/NF electrode.
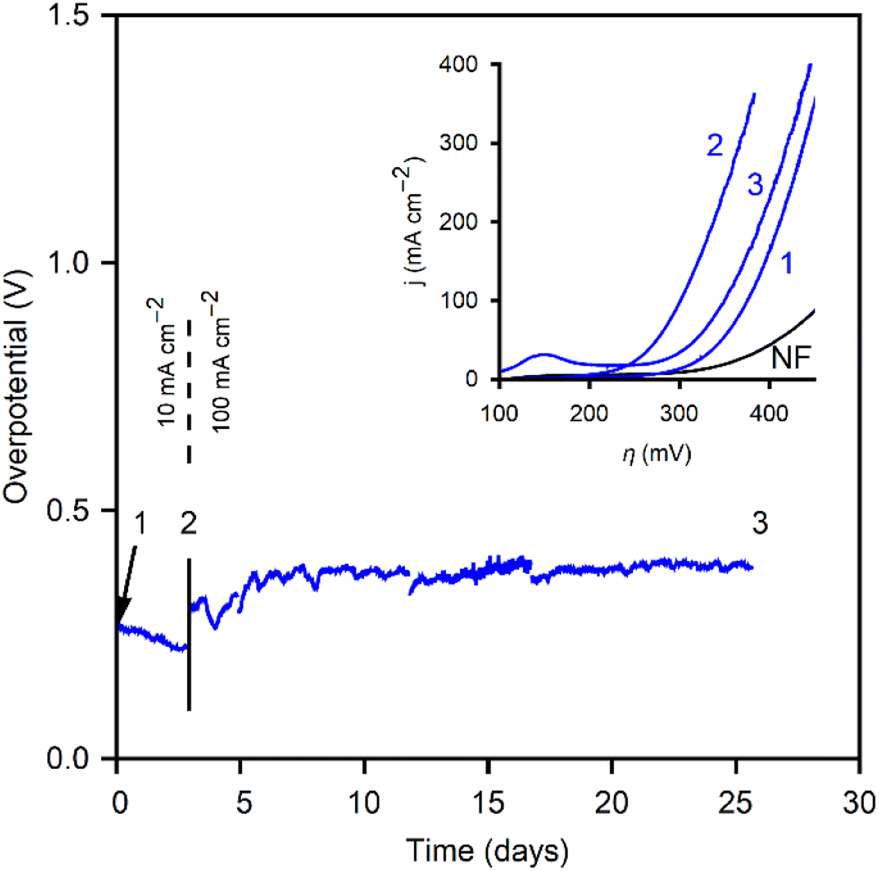 | ||
| Fig. 9 CP curves of a CoNF electrode for 10 mA cm−2 (up to the black line) and 100 mA cm−2. Numbered points where the LSVs are taken are noted. Inset: polarization curves for the bare ANF and the three CoANF points noted in the CP curves. | ||
Fig. 9 graphically compares the OER electrocatalytic activity for the materials4,34 and substrates studied in this work. This representation highlights the benefits of the method developed here, and compares the stability of the films at 10 hours of polarization vs. their initial performance. It serves to emphasize the advantages of using porous materials as electrodeposition substrates for high current densities. CoOx films demonstrate the improvement gained moving from GC to RVC, attributable to the ten-fold increase in surface area, and to NF as an electrocatalytic material itself. Therefore, optimizing the performance based on Fig. 10 involves selecting a high surface area substrate (RVC or NF) that is electrocatalytically active (NF), followed by choosing a film that allows for high performance (to the left in the x-axis), and high stability (down in y-axis). While the benefits of using RVC and NF over GC are evident, it is important to note that bubble formation can inhibit performance at high current densities by blocking the electrochemically active surface area, thus reducing the advantages of a porous electrode over a flat one. The 10 mA cm−2 used as a benchmark is too low to cause this issue, but at more industrially relevant current densities (>100 mA cm−2), the current density ratio jRVC/jGC diminishes from 10 to 2. Engineering of the pore size and arrangement in the foam electrodes remains a future perspective to address these issues and lead to improved performances by making use of the full surface area at higher current densities. Nickel foam already addresses some of these issues, providing a significant contribution to the overpotential reduction due to its inherent catalytic activity for the OER and improved stability.
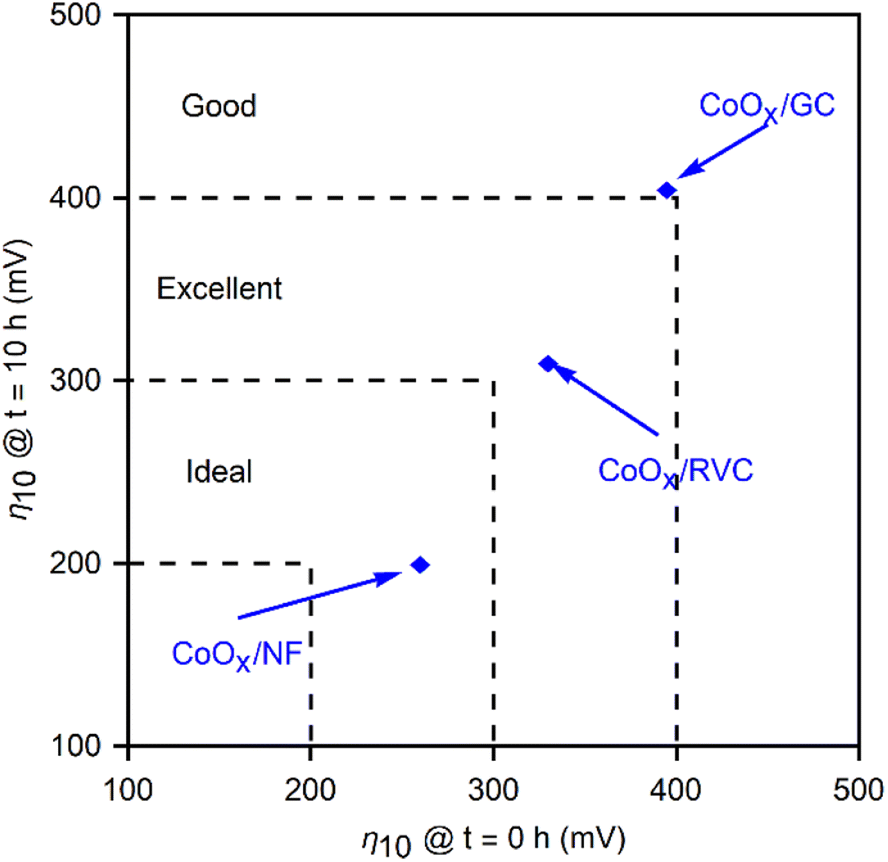 | ||
| Fig. 10 Parametric plot of the overpotentials at a current density of 10 mA cm−2 at the start of polarization (x-axis) and at t = 10 h (y-axis) for three CoOx films deposited on the three substrates: GC, RVC and NF, as well as the shaded regions representing where the (Ni/Co/FeOx) films deposited on different substrates fall. The dashed lines catalogue different activity regions into qualitative terms. All reported values are for the OER performed in 1.0 M KOH. | ||
These results demonstrate significant advancements in the electrocatalytic performance and stability of OER catalysts, using the novel deposition method on nickel foam portrayed in our research. The porous nature of nickel foam not only allows for a high surface area but also contributes to the overpotential reduction due to its inherent catalytic activity for OER. Additionally, the simple pre-treatment of the electrode through ORR cycling serves as an effective activation method, further improving the OER performance of the films. The CoOx/NF electrode, in particular, exhibits impressive stability and activity, outperforming the state-of-the-art catalysts of similar composition.
Conclusions
In this study, we successfully developed an innovative cathodic electrodeposition method for amorphous thin films of metal oxides by employing the oxygen reduction reaction in dimethylformamide. The stability of superoxide radicals in the absence of metal ions, complexed by tetrabutylammonium, was probed via the pseudo-reversibility of the 1-electron oxygen reduction reaction on glassy carbon. Diffusion coefficients for oxygen and TBA+–O2*− were accurately determined using a rotating ring disk electrode.In the presence of metals, the superoxide radical serves as the reactive species responsible for metal oxide precipitation. The highly reactive nature of this species enables rapid, oxidative deposition of any metals present near the electrode, allowing for electrodeposition without the use of complex precursors, or very low potentials. Additionally, the passivation of the electrode upon coating with thin films regarding the oxygen reduction reaction renders this method self-limiting.
Porous substrates, such as reticulated vitreous carbon and nickel foam, were coated to showcase the method's capabilities. NiOx/GC, CoOx/RVC, and CoFeNiOx/NF were further investigated and exhibited outstanding OER performance compared to similar materials. Stability differences are attributed to substrate/MOx interactions. The long-term stability of CoFeNiOx/NF was confirmed over 25 days at a constant polarization of 1000 A m2.
In conclusion, this novel electrodeposition method has been comprehensively explored, from understanding the underlying deposition reaction and oxygen-related kinetics, to characterizing the OER electrocatalytic performance, and evaluating the long-term stability of films coated on porous substrates.
The electrodeposition method presented in this study stands out as a groundbreaking and agenda-setting approach in the field of electrocatalysis, as it has several distinctive advantages that make it unique and outstanding compared to traditional methods in terms of versatility, simplicity, self-limiting nature, exceptional OER performance, and enhanced stability. Overall, the findings of this study provide valuable insights and offer significant advancements in the development of efficient, stable, and cost-effective OER catalysts for various energy conversion and storage applications.
Author contributions
RP, JF, and XDB conceptualized the study, analyzed and discussed the data. RP performed experiments, acquired and processed the data. RP wrote the first draft of the manuscript. JF and XDB wrote additional parts, as well as edited and reviewed the all drafts of the manuscript. JF and XDB supervised the work. All authors discussed the results and contributed to the final manuscript.Conflicts of interest
There are no conflicts to declare.Acknowledgements
RP acknowledges VITO Strategic PhD grant funding no. 1510774. RP, JF, and XDB thank the support from the Flemish SIM MaRes programme, under grant agreement no. 150626 (Get-A-Met project). This work received funding from the European Union's Horizon Europe research and innovation programme under Grant Agreement No. 101091715 (FIREFLY project). The authors thank Omar Martinez Mora for his support acquiring some of the electronic microscopy images, and Myrjam Mertens for her support in conducting the XRD measurements. The authors thank Maximilian König for the fruitful discussion during the revision stages of this paper.References
- N. S. Lewis and D. G. Nocera, Powering the planet: Chemical challenges in solar energy utilization, Proc. Natl. Acad. Sci. U. S. A., 2006, 103, 15729–15735 CrossRef CAS PubMed
.
- J. A. Turner, Sustainable hydrogen production, Science, 2004, 305, 972–974 CrossRef CAS PubMed
- Z. W. Seh,
et al.
, Combining theory and experiment in electrocatalysis: Insights into materials design, Science, 2017, 355, eaad4998 CrossRef PubMed
- C. C. McCrory, S. Jung, J. C. Peters and T. Jaramillo, Benchmarking heterogeneous electrocatalysts for the oxygen evolution reaction, J. Am. Chem. Soc., 2013, 135, 16977–16987 CrossRef CAS PubMed
- T. Nakagawa, C. A. Beasley and R. W. Murray, Efficient electro-oxidation of water near its reversible potential by a mesoporous IrO x nanoparticle film, J. Phys. Chem. C, 2009, 113, 12958–12961 CrossRef CAS
- M. Carmo, D. L. Fritz, J. Mergel and D. Stolten, A comprehensive review on PEM water electrolysis, Int. J. Hydrogen Energy, 2013, 38, 4901–4934 CrossRef CAS
- F. Song and X. Hu, Ultrathin cobalt–manganese layered double hydroxide is an efficient oxygen evolution catalyst, J. Am. Chem. Soc., 2014, 136, 16481–16484 CrossRef CAS PubMed
- G. Gardner,
et al.
, Structural basis for differing electrocatalytic water oxidation by the cubic, layered and spinel forms of lithium cobalt oxides, Energy Environ. Sci., 2016, 9, 184–192 RSC
- N. Yuan, Q. Jiang, J. Li and J. Tang, A review on non-noble metal based electrocatalysis for the oxygen evolution reaction, Arabian J. Chem., 2020, 13, 4294–4309 CrossRef CAS
- L. Trotochaud, J. K. Ranney, K. N. Williams and S. W. Boettcher, Solution-cast metal oxide thin film electrocatalysts for oxygen evolution, J. Am. Chem. Soc., 2012, 134, 17253–17261 CrossRef CAS PubMed
- H. Jin,
et al.
, In situ cobalt–cobalt oxide/N-doped carbon hybrids as superior bifunctional electrocatalysts for hydrogen and oxygen evolution, J. Am. Chem. Soc., 2015, 137, 2688–2694 CrossRef CAS PubMed
- Y. Liang,
et al.
, Co3O4 nanocrystals on graphene as a synergistic catalyst for oxygen reduction reaction, Nat. Mater., 2011, 10, 780–786 CrossRef CAS PubMed
- B. Dong,
et al.
, Two-step synthesis of binary Ni–Fe sulfides supported on nickel foam as highly efficient electrocatalysts for the oxygen evolution reaction, J. Mater. Chem. A, 2016, 4, 13499–13508 RSC
- C. G. Morales-Guio, L. Liardet and X. Hu, Oxidatively electrodeposited thin-film transition metal (oxy) hydroxides as oxygen evolution catalysts, J. Am. Chem. Soc., 2016, 138, 8946–8957 CrossRef CAS PubMed
- Y. K. Kim, J. H. Kim, Y. H. Jo and J. S. Lee, Precipitating Metal Nitrate Deposition of Amorphous Metal Oxyhydroxide Electrodes Containing Ni, Fe, and Co for Electrocatalytic Water Oxidation, ACS Catal., 2019, 9, 9650–9662 CrossRef CAS
- R. D. Smith, M. S. Prévot, R. D. Fagan, S. Trudel and C. P. Berlinguette, Water oxidation catalysis: electrocatalytic response to metal stoichiometry in amorphous metal oxide films containing iron, cobalt, and nickel, J. Am. Chem. Soc., 2013, 135, 11580–11586 CrossRef CAS PubMed
- Y. Yang, H. Fei, G. Ruan, C. Xiang and J. M. Tour, Efficient electrocatalytic oxygen evolution on amorphous nickel–cobalt binary oxide nanoporous layers, ACS Nano, 2014, 8, 9518–9523 CrossRef CAS PubMed
- V. D. Silva, L. S. Ferreira, T. A. Simões, E. S. Medeiros and D. A. Macedo, 1D hollow MFe2O4 (M= Cu, Co, Ni) fibers by Solution Blow Spinning for oxygen evolution reaction, J. Colloid Interface Sci., 2019, 540, 59–65 CrossRef CAS PubMed
- Y. Zhang,
et al.
, Rapid synthesis of cobalt nitride nanowires: highly efficient and low-cost catalysts for oxygen evolution, Angew. Chem., Int. Ed., 2016, 55, 8670–8674 CrossRef CAS PubMed
- G. Vanhoutte,
et al.
, Electro-precipitation via oxygen reduction: a new technique for thin film manganese oxide deposition, J. Mater. Chem. A, 2016, 4, 13555–13562 RSC
- D. R. Rolison,
et al.
, Multifunctional 3D nanoarchitectures for energy storage and conversion, Chem. Soc. Rev., 2009, 38, 226–252 RSC
- S. Deheryan,
et al.
, Self-limiting electropolymerization of ultrathin, pinhole-free poly (phenylene oxide) films on carbon nanosheets, Carbon, 2015, 88, 42–50 CrossRef CAS
- C. P. Rhodes, J. W. Long, M. S. Doescher, B. M. Dening and D. R. Rolison, Charge insertion into hybrid nanoarchitectures: mesoporous manganese oxide coated with ultrathin poly (phenylene oxide), J. Non. Cryst. Solids, 2004, 350, 73–79 CrossRef CAS
- M. Hayyan, M. A. Hashim and I. M. AlNashef, Superoxide ion: generation and chemical implications, Chem. Rev., 2016, 116, 3029–3085 CrossRef CAS PubMed
- D. T. Sawyer, G. Chiericato, C. T. Angelis, E. J. Nanni and T. Tsuchiya, Effects of media and electrode materials on the electrochemical reduction of dioxygen, Anal. Chem., 1982, 54, 1720–1724 CrossRef CAS
- J. A. Fee and P. G. Hildenbrand, On the development of a well-defined source of superoxide ion for studies with biological systems, FEBS Lett., 1974, 39, 79–82 CrossRef CAS PubMed
- C. O. Laoire, S. Mukerjee, K. Abraham, E. J. Plichta and M. A. Hendrickson, Influence of nonaqueous solvents on the electrochemistry of oxygen in the rechargeable lithium− air battery, J. Phys. Chem. C, 2010, 114, 9178–9186 CrossRef CAS
- J. D. Wadhawan, P. J. Welford, H. B. McPeak, C. E. Hahn and R. G. Compton, The simultaneous voltammetric determination and detection of oxygen and carbon dioxide: a study of the kinetics of the reaction between superoxide and carbon dioxide in non-aqueous media using membrane-free gold disc microelectrodes, Sens. Actuators, B, 2003, 88, 40–52 CrossRef CAS
- D. Vasudevan and H. Wendt, Electroreduction of oxygen in aprotic media, J. Electroanal. Chem., 1995, 392, 69–74 CrossRef
- C. Cui, S. Jiang and A. Tseung, Reactive Deposition of Cobalt Electrodes: VIII. Effect of Oxygen Reduction on the Deposition of Cobalt in Co (II) Chloride DMF Solution, J. Electrochem. Soc., 1992, 139, 1535 CrossRef CAS
- D. A. Corrigan and R. M. Bendert, Effect of coprecipitated metal ions on the electrochemistry of nickel hydroxide thin films: cyclic voltammetry in 1M KOH, J. Electrochem. Soc., 1989, 136, 723–728 CrossRef CAS
- M. D. Merrill and R. C. Dougherty, Metal Oxide Catalysts for the Evolution of O2 from H2O, J. Phys. Chem. C, 2008, 112, 3655–3666 CrossRef CAS
- L. Han, X. Y. Yu and X. W. Lou, Formation of prussian-blue-analog nanocages via a direct etching method and their conversion into ni–co-mixed oxide for enhanced oxygen evolution, J. Adv. Mater., 2016, 28, 4601–4605 CrossRef CAS PubMed
- M. Tahir,
et al.
, Electrocatalytic oxygen evolution reaction for energy conversion and storage: a comprehensive review, Nano Energy, 2017, 37, 136–157 CrossRef CAS
- Y. Zhao, E. A. Hernandez-Pagan, N. M. Vargas-Barbosa, J. L. Dysart and T. Mallouk, A high yield synthesis of ligand-free iridium oxide nanoparticles with high electrocatalytic activity, J. Phys. Chem. Lett., 2011, 2, 402–406 CrossRef CAS
- J. S. Sagu, D. Mehta and K. U. Wijayantha, Electrocatalytic activity of CoFe2O4 thin films prepared by AACVD towards the oxygen evolution reaction in alkaline media, Electrochem. Commun., 2018, 87, 1–4 CrossRef CAS
- X. Liu, S. Cui, M. Qian, Z. Sun and P. Du, In situ generated highly active copper oxide catalysts for the oxygen evolution reaction at low overpotential in alkaline solutions, Chem. Commun., 2016, 52, 5546–5549 RSC
- M. E. Lyons and M. P. Brandon, The significance of electrochemical impedance spectra recorded during active oxygen evolution for oxide covered Ni, Co and Fe electrodes in alkaline solution, J. Electroanal. Chem., 2009, 631, 62–70 CrossRef CAS
- R. L. Doyle, I. J. Godwin, M. P. Brandon and M. E. Lyons, Redox and electrochemical water splitting catalytic properties of hydrated metal oxide modified electrodes, Phys. Chem. Chem. Phys., 2013, 15, 13737–13783 RSC
- R. L. Doyle and M. E. Lyons, An electrochemical impedance study of the oxygen evolution reaction at hydrous iron oxide in base, Phys. Chem. Chem. Phys., 2013, 15, 5224–5237 RSC
- R. Doyle and M. Lyons, Kinetics and mechanistic aspects of the oxygen evolution reaction at hydrous iron oxide films in
base, J. Electrochem. Soc., 2013, 160, H142–H154 CrossRef CAS
- J. R. Swierk, S. Klaus, L. Trotochaud, A. T. Bell and T. D. Tilley, Electrochemical study of the energetics of the oxygen evolution reaction at nickel iron (oxy) hydroxide catalysts, J. Phys. Chem. C, 2015, 119, 19022–19029 CrossRef CAS
- H. Kamal, E. Elmaghraby, S. Ali and K. Abdel-Hady, Characterization of nickel oxide films deposited at different substrate temperatures using spray pyrolysis, J. Cryst. Growth, 2004, 262, 424–434 CrossRef CAS
- M. S. Abouzari, F. Berkemeier, G. Schmitz and D. Wilmer, On the physical interpretation of constant phase elements, Solid State Ionics, 2009, 180, 922–927 CrossRef
- M. E. Lyons and M. P. Brandon, The oxygen evolution reaction on passive oxide covered transition metal electrodes in aqueous alkaline solution. Part 1-Nickel, Int. J. Electrochem. Sci., 2008, 3, 1386–1424 CrossRef CAS
- D. M. Santos, C. A. Sequeira and J. L. Figueiredo, Hydrogen production by alkaline water electrolysis, Quim. Nova, 2013, 36, 1176–1193 CrossRef CAS
- J. Friedrich, C. Ponce-de-León, G. Reade and F. Walsh, Reticulated vitreous carbon as an electrode material, J. Electroanal. Chem., 2004, 561, 203–217 CrossRef CAS
- W. Zhu, R. Zhang, F. Qu, A. M. Asiri and X. Sun, Design and application of foams for electrocatalysis, ChemCatChem, 2017, 9, 1721–1743 CrossRef CAS
Footnote |
| † Electronic supplementary information (ESI) available. See DOI: https://doi.org/10.1039/d3ta02647g |
| This journal is © The Royal Society of Chemistry 2023 |