 Open Access Article
Unveiling the structure and ion dynamics of amorphous Na3−xOHxCl antiperovskite electrolytes by first-principles molecular dynamics†
Tan-Lien
Pham
a,
Mohammed
Guerboub
 b,
Assil
Bouzid
 c,
Mauro
Boero
 b,
Carlo
Massobrio
 b,
Young-Han
Shin
 *a and
Guido
Ori
 *b
*b
aMultiscale Materials Modeling Laboratory, Department of Physics, University of Ul-san, Ulsan 44610, Republic of Korea. E-mail: xxxx@aaa.bbb.ccc
bUniversité de Strasbourg, CNRS, Institut de Physique et Chimie des Matériaux de Strasbourg, UMR 7504, F-67034 Strasbourg, France. E-mail: guido.ori@ipcms.unistra.fr
cInstitut de Recherche sur les Céramiques, UMR 7315 CNRS-Univesité de Limoges, Centre Européen de la Céramique, 12 Rue Atlantis, 87068 Limoges Cedex, France
First published on 27th September 2023
Abstract
Sodium oxyhalide and hydroxyhalide antiperovskites are promising solid-state electrolytes (SSEs) because of their low melting point and rapid synthesis and, as such, they are becoming competitive with respect to other systems. While the structure and the mechanism underlying the ion dynamics are increasingly well understood in crystalline antiperovskites, their amorphous counterpart lacks precise structural characterization, hampering any conclusive insight into their properties. In this work, we resort to first-principles molecular dynamics within the Car–Parrinello scheme to assess the structure and ion dynamics of amorphous Na3−xOHxCl (with x = 0, 0.5, and 1) antiperovskites at a quantitative level. We obtain a detailed structural description of these amorphous systems, unveiling the mechanism inherent to the dynamics of Na ions, the role of H atoms, and the resulting ionic conductivity. Our results demonstrate that the structure of amorphous Na3OCl significantly differs from its crystal phase, showing very limited intermediate-range order and a short-range order mainly driven by four-fold Na atoms. Our results reveal that there is no evidence of phase separation in the amorphous Na3−xOHxCl, unlike the previous conjectured model of glassy Li3OCl. The amorphous structure of Na3OCl features remarkable Na ion dynamics and ionic conductivity, rivaling that of defective crystalline phases and highlighting its potential as a promising solid-state electrolyte. In hydroxylated models, the presence of hydroxyl OH− anions plays a crucial role in the mobility of Na ions. This is facilitated by the rapid rotation of O–H bonds and paddlewheel-type mechanisms, leading to enhanced ion mobility in the amorphous Na3−xOHxCl systems. This work provides unprecedented physical and chemical insight into the interplay between the structure, bonding, and ion transport in amorphous sodium-rich oxyhalide and hydroxyhalide antiperovskites, paving the way to their practical realization in next-generation SSEs.
1 Introduction
Over the past decade, low-melting-point Li- and Na-rich antiperovskite solid electrolytes (SEs) have been targeted worldwide as promising materials for solid-state batteries because of their structural flexibility, high ionic conductivity, wide electrochemical window, and stability.1–5 In particular, sodium oxyhalide and hydroxyhalide antiperovskites hold the potential to be used in the SE domain due to their low melting point (Tm < 300 °C), affordable cost and low environmental impact of the constituent elements (Na, H, O, and Cl), and rapid synthesis.6 By exploiting their versatile structure, expressed as X3OA (X= Li+ or Na+; A = halides (Cl−, Br−, I−) or other anions (BH4− and NO2−)), the properties, performance and ion dynamics mechanisms of antiperovskite SEs can be tailored through chemical doping, defect tuning, and structural manipulation, thereby providing an exploitable multifaceted chemistry.1,7–15 By virtue of aliovalent doping or via mixed hydroxides, Li-rich antiperovskites have been shown to yield “superionic” ion conductivities, i.e. ∼0.1 mS cm−1.6,16 Beyond the stoichiometric X3OA crystalline systems, attention has been drawn to the use of cation- and anion-doped X3OA as well as glassy (or amorphous) antiperovskite electrolytes.7,17,18 Glassy Li3OCl- and Na3OCl-based antiperovskites have been originally exploited by the teams of Braga and Goodenough, showing a glass transition temperature in the range 390–450 K and a conductivity of the order of 10−2 S cm−1 at room temperature.19–21 However, attempts at reproducing the original laboratory synthesis were not conclusive and, to date, the structure and ion conduction mechanism of glassy antiperovskite electrolytes remain unsolved issues.1,17,22–24The original work of Braga et al.19 was later questioned by Hanghofer et al.,22 who ascribed the high conductivity of Li+ ions to the presence of impurities and the stability of the sample, and the formation of LiCl·H2O to the presence of H2O. The results of ref. 19 have been substantiated by ab initio and classical molecular dynamics (MD) simulations agreeing on the existence of a subnanoscale phase separation of Li3OCl into Li2O and LiCl phases together with an intermixed phase. The formation of such subnanoscale separation was considered to be the promoter of the high conductivity of Li ions as well as a non-negligible Cl ion mobility.25 Choi et al. further characterized by ab initio MD the structural and electrochemical stability of amorphous Li3OCl.26
Successful use of an electrolyte composite was recently reported by Tian et al.27–29 In this application, amorphous Li3OCl was used as a matrix embedding Li6.75La3Zr1.75Ta0.25O12 garnet-type oxide particles exhibiting a high room temperature conductivity of 2.27 × 10⁻⁴ S cm−1 and an extremely wide electrochemical stability window up to 10 V. In this particular case, the added value promoted by the amorphous X3OA phase was the ability to act as a binder and filling agent ensuring the formation of an integrated composite SE with a continuous widespread ionic conductive network. The key role of the amorphous phase was also assigned to the excellent affinity to the lithium metal, greatly decreasing the interfacial resistance between the anode and the electrolyte.27–29
A detailed understanding of the atomic structure is a key step to further capture the details of the transport mechanisms behind its conductivity performance. Recent reviews on the use of anti-perovskites for solid-state batteries underlined the limited nature of the available structural characterization and pointed out the severe need for a quantitative structural assessment to avoid any misinterpretation of the correlations between the structure and performances.1,30,31 Overall, the structure and ion dynamics mechanisms are well known for crystalline X3OA compounds. This is not the case for amorphous antiperovskites, especially in both hydrogen-free and hydroxylated phases (e.g., oxyhalide X3OA vs. hydroxyhalide X3−xOHxA).
In view of these considerations, this work relies on predictive atomic-scale modelling, as first-principles molecular dynamics (FPMD), to elucidate the structure and transport properties of amorphous H-free and hydroxylated Na3−xOHxCl systems.32 In terms of structural analysis, we provide a detailed study of both X-ray and neutron structure factors. If the X-ray probe is of high importance, neutron studies are particularly needed in the case of antiperovskite electrolyte investigation, being capable of detecting low-Z elements (or light elements, such as H and Li) that are out of reach of X-ray (synchrotron source) techniques.1,2,17,33
Our paper is organized as follows. Section 2 describes the methodologies and model systems employed within first-principles molecular dynamics. We give details on the production of the amorphous systems allowing for the calculation of static and dynamical properties. A specific subsection is devoted to a set of definitions for structural (disorder degree) and dynamical (ionic diffusion and conductivities) quantities targeted in this work for their potential applications in solid-state electrolytes. Results are presented in Section 3 and separated into two subsections, with the first one (3.1) devoted to structural properties and the second one (3.2) to dynamical properties. The analysis of the structural properties features, firstly, calculated properties in reciprocal and real space (3.1.1 and 3.1.2), namely the structure factors and the pair correlation functions. The following parts are devoted to the analysis of the coordination numbers (3.1.3) and the structural units (3.1.4), with special attention paid to the chemical nature of the various motifs and their variations with the composition. A final part is devoted to the assessment of the structural disorder degree of the studied models (3.1.5).
Subsection 3.2 is organized into three parts, describing respectively the different trends shown by the mean square displacements (3.2.1), a dynamical structural rearrangement involving the hydroxyl group (the “paddlewheel” effects, 3.2.2), and the behavior of the diffusion coefficients (3.2.3) leading to the assessment of the ionic conductivity (3.2.4). Concluding remarks are collected in Section 4.
2 Calculation methodology and models
2.1 Producing Na3−xOHxCl amorphous models at 300 K
The Car–Parrinello (CP) method34 was used to produce dynamical trajectories of the targeted Na3−xOHxCl systems. The exchange–correlation functional selected is the generalized gradient approximation (GGA) proposed by Perdew, Burke and Ernzerhof (PBE).35 The valence–core interaction was described by numerical norm-conserving Troullier–Martins (TM)36 pseudopotentials for all elements (Na, O, H, and Cl). In the case of Na, semi-core states were included to ensure a good description of the energetics and electronic features dependent on its cationic nature. This amounts to electronic configurations He 2s2, 2p6, 3s1 for Na; He 2s2, 2p4 for O; 1s1 for H and Ne 3s2, 3p5 for Cl. Valence electrons are treated explicitly and represented on a plane-wave basis set with the sampling of the Brillouin zone restricted to the Γ point. A fictitious electron mass of 600 a.u. and a time step of 0.12 fs ensured optimal conservation of the constants of motion. FPMD simulations were performed in a canonical NVT ensemble with the ionic temperature controlled with a Nosé–Hoover37–39 thermostat chain.40 For the simulations performed at high temperature (>1000 K) we used a Blöchl–Parrinello electronic thermostat41 with a target kinetic energy of 0.1 a.u. to control the fictitious motion of the electronic degrees of freedom. Our FPMD approach34,42 has been extensively used and benchmarked in the last few decades and contributed to the improvement of our understanding of both the physical and chemical properties of chalcogenide and chalcohalide glasses,43–45 hybrid46,47 and porous48 systems, and nanomaterials.49–52The Na3OCl glass model was generated by quenching from the melt. The initial configuration consisted of a Na3OCl crystal cubic unit cell replicated 3 × 3 × 3 times to obtain a 135 atom model (81 Na, 27 O, and 27 Cl) in a cubic simulation cell of side length 13.6148 Å.53 The initial box was expanded by 15% with respect to crystal density in order to ease melting at a high temperature. A similar approach was followed for the case of glassy Li3OCl.25 Periodic boundary conditions were applied throughout. The model underwent a thermal cycle via canonical NVT simulations, according to the following protocol: 1.3 ps at T = 300 K, 1.2 ps at T = 1200 K, 3.1 ps at T = 1500 K, 46.5 ps at T = 1800 K, 38.6 ps at T = 1000 K, 33.7 ps at T = 750 K and 35 ps at T = 300 K (see Fig. 1). At the end of the cycle of T = 300 K, the density of the system was set to 2.04 g cm−3 (corresponding to a final volume expansion of +5% with respect to the crystal phase) in order to reduce the stress tensor to values very close to 0 GPa. Along the thermal cycle the energy cutoff for the plane wave expansion was REc = 80 Ry. This value was increased at T = 300 K (REc = 160 Ry) with a reduced time step of 0.072 fs to achieve the convergence of the stress tensor (see Fig. S1 in the ESI†). By using the final configuration of amorphous Na3OCl at T = 300 K, we randomly replaced an appropriate number of Na atoms with H atoms to obtain Na2.5OH0.5Cl and Na2OHCl (corresponding to ∼17% and ∼33% of Na replaced, respectively). These systems underwent a thermal cycle via canonical NVT simulations with the following time schedule: 20 ps at T = 1800 K, 22 ps at T = 1000 K, 19 ps at T = 750 K, and 30 ps at T = 300 K. To obtain vanishing pressure at T = 300 K, the density of the system was set to 1.93 g cm−3 (Na2.5OH0.5Cl) and 1.75 g cm−3 (Na2OHCl) (Fig. 1 inset). In what follows, the results on the atomic structure are presented as time-average values over the last 20 ps of the thermal cycles at T = 300 K. For all the simulations performed here, we used the developer version of the CPMD package.54
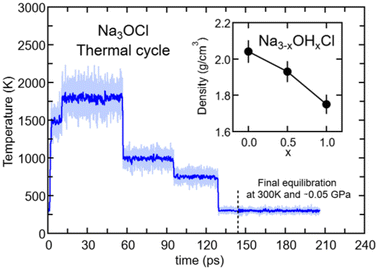 | ||
| Fig. 1 (Color online) Temperatures along the thermal cycle for amorphous Na3OCl: light blue line, instantaneous T values; blue line, T value sliding average with a window of 0.1 ps. The dashed vertical grey line sets the time at which the optimization of the volume at T = 300 K and 0 GPa was implemented. Inset: final density values optimized at T = 300 K for the three Na3−xOHxCl models. Error bars are estimated with tests at different volumes performed on several final configurations (300 K) to obtain a final stress tensor close to 0 GPa (see Fig. S1 in the ESI†). | ||
With respect to the quantification of the disorder degree of the different models, herein we report the main feature of the smooth overlap of the atomic positions (SOAP) descriptor employed. In the SOAP formalism, the density of the neighborhood surrounding the i-th atom is smoothed using descriptor functions that encode regions of atomic geometries with respect to atomic neighbor environments within a finite cutoff radius using a local expansion of a Gaussian smeared atomic density ρi,a(r) with orthonormal functions based on spherical harmonics Yml(![[r with combining circumflex]](https://www.rsc.org/images/entities/b_char_0072_0302.gif) ) and radial basis functions Rn(r).55,56 In this study, we computed the average summation p(r) vector for the Cl atoms,57 being the only element present in equal amounts in all three models. The formula for computing the SOAP p(r) vector is given by:
) and radial basis functions Rn(r).55,56 In this study, we computed the average summation p(r) vector for the Cl atoms,57 being the only element present in equal amounts in all three models. The formula for computing the SOAP p(r) vector is given by:
 | (1) |
 | (2) |
where the sum is over neighbours j of element a that is within the cutoff and fcut(r) is a cutoff function that smoothly goes to zero at rcut. The hyperparameter σa has units of length and determines the regularity (smoothness) of the representation. The absolute value of the SOAP p(r) vector depends on the number of species, number of descriptors calculated, and cutoff radius, making it a valuable tool for analyzing specific systems. For this study, a = Cl and a′ is one of those elements Cl, Na, O, or H with a cutoff radius of 5.5 Å that was chosen to encompass the next-nearest neighbor environments. σa = 1, nmax = 10 and lmax = 8. The final number of descriptors computed correspond to 4185 for Na3OCl and 7380 for the two hydroxylated models.
2.2 Dynamical simulations at finite temperatures
FPMD simulations allow the assessment of the transport properties of mobile ions in amorphous materials.58,59 In this work, the ion dynamics and transport properties were studied at different temperatures, specifically T = 300 K, 450 K, 600 K, 800 K, 1000 K, and 1200 K (Na3OCl only). The three systems were equilibrated in a NVT canonical ensemble for a total simulation time of ∼50 ps. Trajectories were collected every 20 steps (1.45 fs). The mean square displacements (MSDs) of all ions were computed according to | (3) |
 is the MSD averaged on all realizations of eqn (3) for a given value of time t. It should be noted that in its standard definition, the mean square displacement is normalized to the number of particles, say N, so as to appear as an intensive property resulting from an average over the whole system. However, for the sake of convenience, we prefer to take advantage of a definition of the MSD taking the form of eqn (3). To assess the so-called tracer diffusive D* behavior of the ions, the MSD is analysed in log–log plots via the slopes β(t) as a function of time,
 | (4) |
At very short t, a value of β(t) equal to two is expected, corresponding to a free, ideally ballistic motion of the ions, while at very long times, β(t) should reach a value equal to one, corresponding to a real diffusive regime, with the MSD growing linearly with time. We would like to stress here that this analysis is crucial to determine the effective achievement of diffusive behavior and identify the portion of the MSD plot that should be used to extract diffusion coefficients. This is particularly important in the case of disordered materials such as glasses,60 ionic liquids,61 and molten salts.62 In the present work, the lower and upper bounds of the real diffusive regime were defined within the interval delimited by (lower boundary) the t at which β(t) reaches a value of one up to (upper boundary) the value of t corresponding to a length of trajectory 15% shorter than the total one.63 For the systems that reach the diffusive regime at a given temperature, the ion diffusion coefficients (e.g. tracer diffusivity) were calculated by using the Einstein relation given by:64,65
 | (5) |
 | (6) |
From the tracer diffusivity D*, the idealized ionic conductivity can be calculated based on the Nernst–Einstein relation:
 | (7) |
 | (8) |
The charge-diffusion coefficient Dσ, which refers to the displacement of the center of mass of all the diffusing ions and is used here to consider possible correlation effects, is defined as:
 | (9) |
The Haven ratio is a measure of the degree by which the trajectories of different atoms are correlated to each other.66,70 For single ion conductors, it is
 | (10) |
 | (11) |
 | (12) |
 | (13) |
 | (14) |
 | (15) |
N is the total number of ions in the electrolyte, and zi is the charge number of ion i.61 The sum in eqn (11) can be re-expressed as shown in eqn (12)–(15). HσR is computed by considering correlation effects only promoted by Na ions, whereas with HtotR the contribution of possible correlation effects due to O and Cl ions is also taken into account. These equations are an alternative to the methods based on quantifying collective correlated effects by integration of the ion velocity autocorrelation functions.74–76
3 Results and discussion
3.1 Structural properties
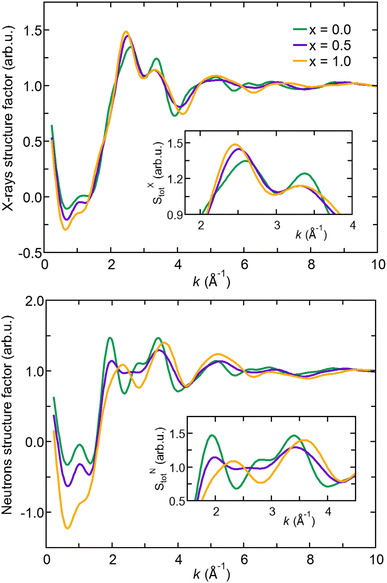
In the following, we analyze X-ray and neutron FFT ST(k) in terms of peak positions and intensities comparing the three Na3−xOHxCl systems. We remark that SXT(k) of Na3OCl features a first peak at about k ∼2.5 Å−1 with a shoulder at k ∼2.0 Å−1 and a second peak at k ∼3.5 Å−1. These first two peaks are followed by much broader maxima and minima and rapidly damped oscillations up to k ∼8.0 Å−1. Na2.5OH0.5Cl and Na2OHCl SXT(k) have very similar profiles and minor differences with respect to pristine Na3OCl. In contrast, while the X-ray structure factor SXT(k) exhibits similarities across all three cases, the neutron structure factor SNT(k) displays significant distinctions, indicating that it may be a better diagnostic tool for discerning models containing varying amounts of hydrogen. Higher intensities are found in SNT(k) for Na3OCl. By increasing x, maxima and minima are reduced and different profiles appear in between k ∼2 Å−1 and k ∼4 Å−1 to signify a lower degree of structural organization. The relatively small peak at about k ∼1 Å−1 reveals that the intermediate range order is very limited in these amorphous systems. Overall, Fig. 2 shows modifications taking place within the networks affecting an ordered structural sequence made of distinct shells of neighbors.
| Exp.53,79 | FPMD, this work | |||
|---|---|---|---|---|
| Crystal | Na3OCl | Na2.5OH0.5Cl | Na2OHCl | |
| r NaO | 2.25 | 2.28(2) | 2.27(2) | 2.32(2) |
| FWHM | 0.28 | 0.31 | 0.33 | |
| r NaCl | 3.18 | 2.75(2) | 2.75(3) | 2.74(4) |
| FWHM | 0.47 | 0.46 | 0.52 | |
| r NaNa | 3.18 | 3.14(3) | 3.22(4) | 3.34(4) |
| FWHM | 0.92 | 1.01 | 1.02 | |
| r OO | 4.50 | 3.85(1) | 3.72(4) | 3.61(4) |
| FWHM | 0.86 | 0.77 | 0.72 | |
| r OCl | 3.89 | 4.00(4) | 3.91(2) | 3.78(4) |
| FWHM | 0.79 | 1.00 | 0.93 | |
| r ClCl | 4.50 | 4.06(3) | 3.87(3) | 4.05(3) |
| FWHM | 0.82 | 1.04 | 1.01 | |
| r OH | — | — | 0.98(2) | 0.97(2) |
| FWHM | — | — | 0.02 | 0.02 |
| n t Na | 14 | 8.01(3) | 7.26(2) | 6.04(2) |
| n p Na | 6 | 4.0(1) | 4.30(1) | 4.58(2) |
| n t O | 6 | 6.30 (2) | 6.44(2) | 6.09(4) |
| n p Na | 6 | 6.29 (3) | 5.94(2) | 5.40(2) |
| n t Cl | 12 | 5.73(3) | 5.45(2) | 4.93(3) |
| n p Cl | 12 | 5.72(1) | 5.37(1) | 4.78(3) |
| n t H | — | — | 1.00(2) | 1.02(3) |
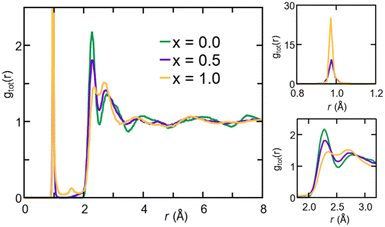
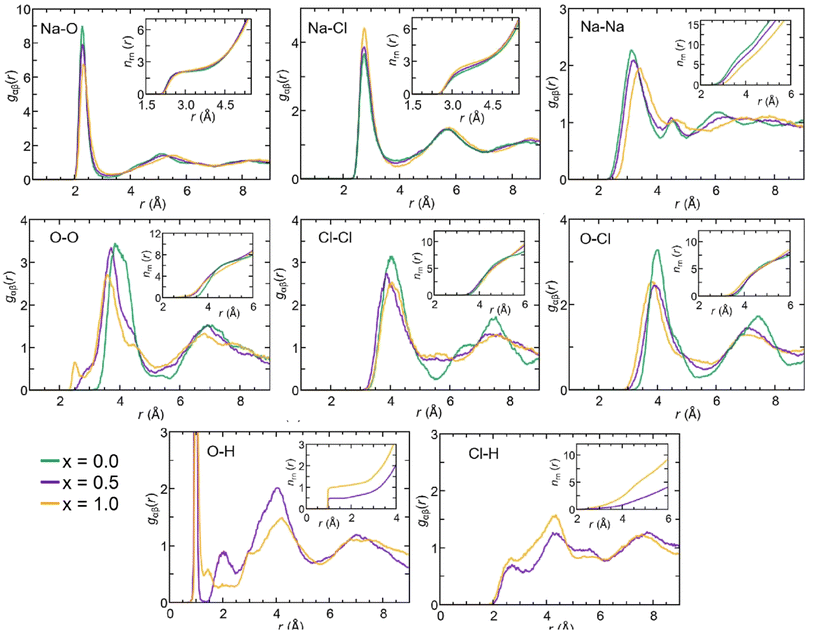
The gOH(r) partial pair correlation functions of Na2.5OH0.5Cl and Na2OHCl show that all H atoms are bonded to O atoms, forming OH hydroxyl groups with a typical O–H bond distance equal to ∼0.98 Å. This observation is further supported by the analysis of gClH(r), for which the Cl–H interatomic distance lies at values higher than ∼2.0 Å for both the hydroxylated phases, much larger than the typical Cl–H bond distance, i.e. ∼1.3 Å. For what concerns gOH(r), a few differences can be pointed out between the two hydroxylated phases. In Na2.5OH0.5Cl, a second peak exists at about ∼2.0 Å, which reflects the presence of a H-bonding network promoted between neighboring hydroxyl groups or free oxygen atoms in the form of OH⋯OH and OH⋯O interactions, respectively. In Na2OHCl, such a peak is minimally visible but a small peak at a shorter distance (∼1.5 Å) is discernible. This latter peak is the one that generally identifies H atoms (or protons) hopping between neighboring hydroxyl groups and giving rise to stable or metastable water molecules.80–85 In terms of anion–anion pair correlation functions, all three gOO(r), gClCl(r) and gOCl(r) are characterized by a first main peak centered at around ∼3.7–4.0 Å. There are interesting differences to be pointed out when comparing gOO(r) for the three Na3−xOHxCl models. In particular, Na3OCl exhibits a relatively broad first peak at ∼3.85 Å (FWHM of ∼0.86 Å), whereas the two hydroxylated models feature intense peaks at ∼3.72 Å and ∼3.61 Å (FWHM of ∼0.77 Å and ∼0.72 Å, respectively), followed by a shoulder centered at about ∼4.5 Å. Also, a small peak at ∼2.5 Å for Na2.5OH0.5Cl and a shoulder at about ∼2.9 Å for Na3−xOHxCl are worth noticing, while in the case of Na3OCl gOO(r) goes to zero for distances <3.2 Å. In terms of gClCl(r) and gOCl(r), the three models show very similar profiles, although the intensity of the main peak of the two hydroxylated systems is smaller for a higher degree of disorder with respect to Na3OCl.
Proportions ![[n with combining macron]](https://www.rsc.org/images/entities/i_char_006e_0304.gif) α(l) (%) α(l) (%) |
||||
|---|---|---|---|---|
| x = 0 | x = 0.5 | x = 1 | ||
| Na | ||||
| l = 3 | 14.6(1.9) | 8.4(1.0) | 3.5(1.0) | |
| O2Cl1 | 10.4 | 4.4 | 1.3 | |
| O3 | 3.6 | 2.5 | 0.6 | |
| l = 4 | 70.0(2.9) | 56.9(2.2) | 43.8(2.1) | |
| O2Cl2 | 36.6 | 23.8 | 13.1 | |
| O3Cl1 | 18.1 | 13.9 | 14.5 | |
| O1Cl3 | 9.9 | 11.8 | 11.0 | |
| O4 | 3.7 | 5.7 | 2.6 | |
| l = 5 | 13.8(1.5) | 30.4(1.6) | 43.7(2.3) | |
| O2Cl3 | 5.4 | 9.7 | 10.7 | |
| O1Cl4 | 4.4 | 6.7 | 11.6 | |
| O3Cl2 | 0.4 | 7.1 | 13.2 | |
| Cl5 | 1.5 | 2.5 | 1.5 | |
| l = 6 | 3.3(0.5) | 5.5(0.7) | 11.1(1.2) | |
| O4Cl2 | — | 0.3 | 2.3 | |
| O3Cl3 | — | 1.3 | 2.3 | |
| O2Cl4 | 0.5 | 1.0 | 1.8 | |
| O1Cl5 | 0.2 | 1.1 | 1.7 | |
![[thin space (1/6-em)]](https://www.rsc.org/images/entities/char_2009.gif) |
||||
| O | ||||
| l = 4 | — | <0.5 | 8.6(1.8) | |
| Na2H2 | — | — | 2.0 | |
| Na3H1 | — | 0.4 | 6.6 | |
| l = 5 | 2.1(2.0) | 20.8(3.9) | 44.4(6.6) | |
| Na3H2 | — | — | 5.7 | |
| Na4H1 | — | 16.5 | 38.6 | |
| Na5 | 1.9 | 4.3 | 0.1 | |
| l = 6 | 69.1(6.6) | 63.6(4.9) | 44.7(6.9) | |
| Na5H1 | — | 24.9 | 36.0 | |
| Na6 | 69.1 | 38.6 | 7.3 | |
| l = 7 | 27.6(6.1) | 15.0(3.8) | 2.1(1.9) | |
| Na6H1 | — | 6.1 | 2.0 | |
| Na7 | 27.6 | 8.9 | — | |
![[thin space (1/6-em)]](https://www.rsc.org/images/entities/char_2009.gif) |
||||
| Cl | ||||
| l = 3 | Na3H0 | — | 1.2(1.0) | 4.8(3.8) |
| l = 4 | Na4H0 | 8.2(4.6) | 14.2(8.7) | 31.5(7.3) |
| l = 5 | Na5H0 | 31.6(8.0) | 40.0(8.6) | 45.4(7.4) |
| l = 6 | Na6H0 | 39.8(9.0) | 36.4(7.7) | 16.9(6.1) |
| l = 7 | Na7H0 | 17.1(6.4) | 7.7(4.4) | — |
| l = 8 | Na8H0 | 2.4(1.9) | — | — |
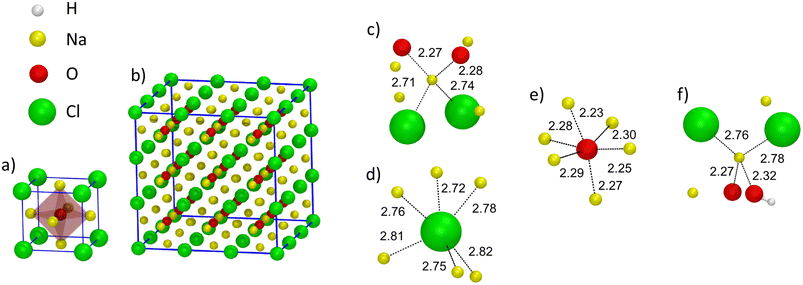
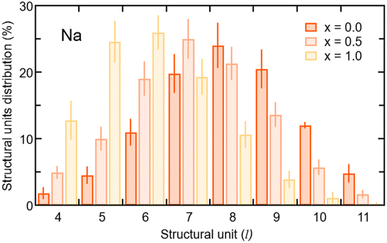
In terms of the cation–anion partial coordination, we observe a slight increase of npNa, the values being ∼4.0 for Na3OCl, ∼4.3 for Na2.5OH0.5Cl and ∼4.6 Na2OHCl. Correspondingly, the distribution of the structural units given in Table 2 reveals that the percentage of Na atoms fourfold coordinated decreases (from ∼70.0% to ∼56.9% and ∼43.8%, respectively) with a concomitant increase of the fivefold ones (from ∼13.8% up to ∼30.4% and ∼43.7%). The larger number of fivefold Na-centered units at the expense of fourfold ones can be traced back to a concomitant decrease of the number of O2Cl2 units (from ∼36.6% to ∼23.8% and ∼13.1%) and a net increase of the O2Cl3, O1Cl4 and O3Cl2 units (the latter from ∼0.4% to ∼7.1% and ∼13.2%).
The behavior of the total and partial coordination numbers of O atoms is worth noticing. npO decreases from ∼6.3 in Na3OCl to ∼5.9 and ∼5.4 for Na2.5OH0.5Cl and Na2OHCl, respectively. This decrease is due to a clear increase of lower coordinated units of O at the expense of the higher-coordinated units. Na2OHCl shows a minimal content of l = 7 units and a comparable content of l = 5 and l = 6 units (∼44% versus ∼45%). The trend in the local environment of O in the hydroxylated phases results from the fact that in Na2.5OH0.5Cl ∼52% of O atoms are coordinated only by Na atoms with the remaining having, in addition to Na, one H atom as a neighbor within hydroxyl OH groups. These percentages change in Na2OHCl to accommodate more H atoms. Regarding Cl atoms the behavior is similar to the one of O atoms after partial replacement of Na by H atoms. In particular, npCl decreases from ∼5.7 in Na3OHCl to ∼5.4 and ∼4.8, for Na2.5OH0.5Cl and Na2OHCl, respectively. The amorphous nature of the network favors relatively short Na–Cl distances (∼2.75 Å) when compared to those found in the crystalline phase, where each Cl atom is surrounded by twelve Na atoms at a distance of ∼3.18 Å.
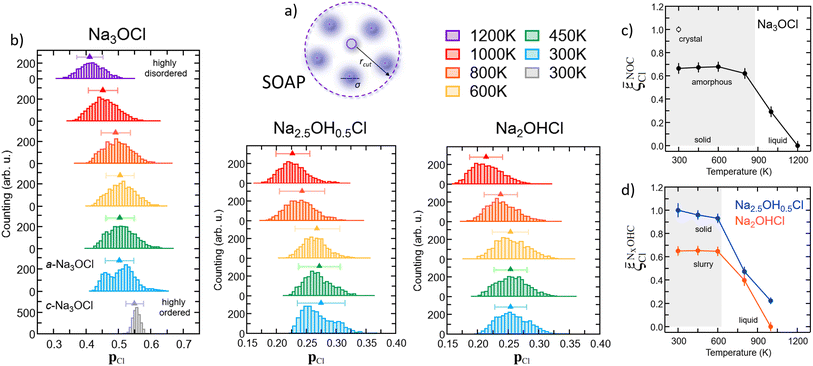
![[p with combining macron]](https://www.rsc.org/images/entities/b_char_0070_0304.gif) Cl(r) value and its standard deviation. For Na3OCl, the crystalline phase at 300 K exhibits a narrow SOAP pCl(r) distribution with
Cl(r) value and its standard deviation. For Na3OCl, the crystalline phase at 300 K exhibits a narrow SOAP pCl(r) distribution with ![[p with combining macron]](https://www.rsc.org/images/entities/b_char_0070_0304.gif) Cl = 0.55, with a standard deviation of 0.04. Conversely, amorphous Na3OCl at 300 K shows a more spread bimodal distribution with two main peaks (approximately 0.45 and 0.52), an average SOAP
Cl = 0.55, with a standard deviation of 0.04. Conversely, amorphous Na3OCl at 300 K shows a more spread bimodal distribution with two main peaks (approximately 0.45 and 0.52), an average SOAP ![[p with combining macron]](https://www.rsc.org/images/entities/b_char_0070_0304.gif) Cl(r) value of 0.5, and a standard deviation of 0.07. As the temperature increases from 300 K to 450 K and up to 800 K, the pCl(r) value distributions transition from a bimodal to a symmetrical distribution, while the average SOAP
Cl(r) value of 0.5, and a standard deviation of 0.07. As the temperature increases from 300 K to 450 K and up to 800 K, the pCl(r) value distributions transition from a bimodal to a symmetrical distribution, while the average SOAP ![[p with combining macron]](https://www.rsc.org/images/entities/b_char_0070_0304.gif) Cl(r) remains relatively constant up to 800 K (around 0.5). However, at higher temperatures, a noticeable shift towards lower values is observed (approximately 0.45 and 0.40 at 1000 K and 1200 K, respectively), indicating a clear increase in the disordering degree of the system, potentially leading to a phase change (e.g., from solid to liquid). Furthermore, the amorphous Na2.5OH0.5Cl model also exhibits a bimodal SOAP pCl(r) distribution at 300 K, although less structured compared to amorphous Na3OCl, whereas Na2OHCl shows a more spread SOAP pCl(r) distribution. Both Na2.5OH0.5Cl and Na2OHCl models demonstrate a symmetrical pCl(r) distributions from 450 K to 600 K, with a clear shift towards lower averaged
Cl(r) remains relatively constant up to 800 K (around 0.5). However, at higher temperatures, a noticeable shift towards lower values is observed (approximately 0.45 and 0.40 at 1000 K and 1200 K, respectively), indicating a clear increase in the disordering degree of the system, potentially leading to a phase change (e.g., from solid to liquid). Furthermore, the amorphous Na2.5OH0.5Cl model also exhibits a bimodal SOAP pCl(r) distribution at 300 K, although less structured compared to amorphous Na3OCl, whereas Na2OHCl shows a more spread SOAP pCl(r) distribution. Both Na2.5OH0.5Cl and Na2OHCl models demonstrate a symmetrical pCl(r) distributions from 450 K to 600 K, with a clear shift towards lower averaged ![[p with combining macron]](https://www.rsc.org/images/entities/b_char_0070_0304.gif) Cl(r) values at temperatures T ≥ 800 K.
Cl(r) values at temperatures T ≥ 800 K.
Capitalizing on these insights, for Na3OCl we have developed similarity metrics (on a ![[small xi, Greek, macron]](https://www.rsc.org/images/entities/i_char_e0cf.gif) Cl scale from 0 to 1) to quantify the degree of disorder with reference to the highly ordered crystalline phase and the highly disordered liquid phase. In Fig. 7c and d, we report the average
Cl scale from 0 to 1) to quantify the degree of disorder with reference to the highly ordered crystalline phase and the highly disordered liquid phase. In Fig. 7c and d, we report the average ![[p with combining macron]](https://www.rsc.org/images/entities/b_char_0070_0304.gif) Cl(r) as a function of temperature, normalized with respect to the average value of the crystalline phase for Na3OCl (Fig. 7c), and normalized with respect to the amorphous phase at 300 K for the two hydroxylated phases (Fig. 7d) such as:
Cl(r) as a function of temperature, normalized with respect to the average value of the crystalline phase for Na3OCl (Fig. 7c), and normalized with respect to the amorphous phase at 300 K for the two hydroxylated phases (Fig. 7d) such as:
 | (16) |
 | (17) |
![[small xi, Greek, macron]](https://www.rsc.org/images/entities/i_char_e0cf.gif) Cl metric is defined by the average
Cl metric is defined by the average ![[p with combining macron]](https://www.rsc.org/images/entities/b_char_0070_0304.gif) Cl(r) value of Na2.5OH0.5Cl at 300 K, not having at disposal any information related to their crystalline phases and consistently on the basis of the same number of elements and total number of descriptors computed (see Section 2.1). These metrics have enabled us to identify ranges of structural disorder corresponding to its crystalline (
Cl(r) value of Na2.5OH0.5Cl at 300 K, not having at disposal any information related to their crystalline phases and consistently on the basis of the same number of elements and total number of descriptors computed (see Section 2.1). These metrics have enabled us to identify ranges of structural disorder corresponding to its crystalline (![[small xi, Greek, macron]](https://www.rsc.org/images/entities/i_char_e0cf.gif) NOCCl = 1), amorphous solid (
NOCCl = 1), amorphous solid (![[small xi, Greek, macron]](https://www.rsc.org/images/entities/i_char_e0cf.gif) NOCCl ∼ 0.68,
NOCCl ∼ 0.68, ![[small xi, Greek, macron]](https://www.rsc.org/images/entities/i_char_e0cf.gif) NCl2.5OH0.5C ∼ 0.95 and
NCl2.5OH0.5C ∼ 0.95 and ![[small xi, Greek, macron]](https://www.rsc.org/images/entities/i_char_e0cf.gif) NCl2OHC ∼ 0.65) and liquid phases (
NCl2OHC ∼ 0.65) and liquid phases (![[small xi, Greek, macron]](https://www.rsc.org/images/entities/i_char_e0cf.gif) NOCCl ≤ 0.3,
NOCCl ≤ 0.3, ![[small xi, Greek, macron]](https://www.rsc.org/images/entities/i_char_e0cf.gif) NCl2.5OH0.5C ≤ 0.5 and
NCl2.5OH0.5C ≤ 0.5 and ![[small xi, Greek, macron]](https://www.rsc.org/images/entities/i_char_e0cf.gif) NCl2OHC ≤ 0.4). It is pertinent to highlight that, at 300 K, the partial substitution of Na ions with H ions leads to heightened disordering, concurrent with a lower temperature threshold for the transition from a solid to a liquid phase (at T > 800 K for Na3OCl and at T > 600 K for Na3−xOHxCl). Furthermore, at 300 K, the disordering degree exhibited by Na2OHCl is described as a ‘slurry’ solid, indicating a significantly lower value when compared to Na2.5OH0.5Cl.
NCl2OHC ≤ 0.4). It is pertinent to highlight that, at 300 K, the partial substitution of Na ions with H ions leads to heightened disordering, concurrent with a lower temperature threshold for the transition from a solid to a liquid phase (at T > 800 K for Na3OCl and at T > 600 K for Na3−xOHxCl). Furthermore, at 300 K, the disordering degree exhibited by Na2OHCl is described as a ‘slurry’ solid, indicating a significantly lower value when compared to Na2.5OH0.5Cl.
3.2 Dynamical properties
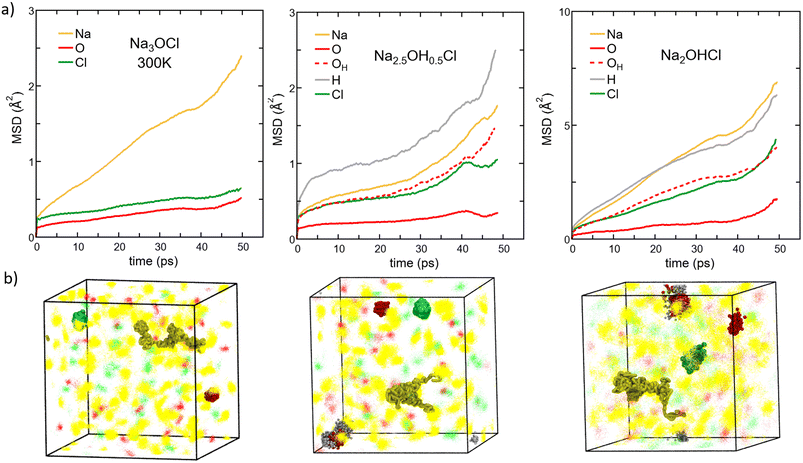 | ||
| Fig. 8 (Color online) (a) MSD versus time for each element in amorphous Na3−xOHxCl (x = 0, x = 0.5, and x = 1) at T = 300 K. Colors legend: Na, yellow; O non-bonded to H atoms, red (solid line); O bonded to H atoms, red (dashed line); H, grey; Cl, green. Note that the MSD calculated at the temperatures T = 300 K, T = 450 K, T = 600 K, T = 800 K, and T = 1000 K are reported in the ESI (Fig. S1†). (b) Density plots of ∼50 ps trajectories of all elements are shown as dots for the three models simulated at 300 K. Na, O, and Cl atom positions are given in yellow, red, and green, respectively. H atoms are omitted for clarity. Examples of an individual local Na migration path and Cl, O and OH local vibrations are highlighted in spheres. | ||
Different behaviors are recorded in the case of the hydroxylated systems. For both the hydroxylated phases, we reported the MSD data of individual oxygen atoms and those bonded to H atoms (as OH− anions) separately (corresponding to about ∼50% of oxygen atoms in Na2.5OH0.5Cl and only to a small % for Na2OHCl). At T = 300 K, we found that Na and individual O ions in Na2.5OH0.5Cl have MSD values similar to those found in Na3OCl. The MSD of Cl reaches ∼0.9 Å2 over ∼40 ps followed by stabilization, and O atoms involved in OH groups show a MSD value of about ∼1 Å2, whereas H atoms show a steady time increase of the MSD. The enhanced mobility of H atoms can be ascribed to the high rotational dynamical disorder of H atoms around an O atom of a hydroxyl group (see Fig. S3 in the ESI†). Individual O atoms show the least mobility of all, with a MSD stable at ≤0.5 Å2. This trend is clearly supported by the MSD of Na2.5OH0.5Cl as a function of temperature. Focusing on Na ions at higher temperature, their MSD after ∼50 ps is ∼1.4 and ∼2.0 times larger than the one found in Na3OCl at 450 K and 600 K, respectively. Therefore, it appears that the presence of H atoms promotes an increase in Na ion mobility at temperatures higher than T = 300 K. This occurs also for Cl ions and both O and H involved in OH groups. In contrast, individual O ions (i.e. non-bonded to H) are found somewhat less mobile.
To complete our case study and extract a global picture from the behaviour of the mean square displacement, we focus on Na2OHCl. A first observation from Fig. 8 (rightmost part) reveals that similar trends for the MSD are found. However, OH− anions boost the MSD of the other species significantly already at room temperature. This effect can be fully appreciated by noting that in Na2OHCl ∼92% of O atoms bind at least one H atom either as OH− anions or in water molecules. At T = 300 K and after ∼50 ps, Na ions in Na2OHCl reached a value of MSD ∼3.2 times larger than the one found in Na3OCl, and with H equally highly mobile and with Cl and O involved in OH groups showing a certain degree of mobility although lower than for Na ions. Individual O atoms show a stable MSD value of ≤3.5 Å2, indicating mere local vibrations. At 300 K, by considering density plots spanning the 50 picosecond simulation period (Fig. 8b), we observe that atoms other than Na ions only exhibit localized vibrations around central positions. This vibration's extension increases in the order Na3OCl < Na2.5OH0.5Cl < Na2OHCl, with Na ions showcasing extended migration paths. To enhance comprehension of atom dynamics throughout the simulation timeframe, we highlighted in Fig. 8b individual local migration paths for Na, Cl, O, and OH in the density plot visualizations. These visualizations further corroborate our MSD-based observations, with Na ions demonstrating extended migration paths. Meanwhile, individual O ions (not involved in OH groups) exhibit highly localized vibrations, and Cl and OH ions show slightly extended vibrations, though consistently localized.
We conclude that all three models at 300 K exhibit solid-state dynamical characteristics. At higher temperature, in Na2OHCl Na the MSD after ∼50 ps is about ∼4.5 times larger than the one found in Na3OCl at 450 K and 600 K. These results indicate, by all means, that the mobility of Na ions is further boosted by the presence of H atoms. Overall, it is evident that Na3OCl exhibits a consistent profile from 300 K to 800 K, wherein Na ions remain highly mobile with their MSD progressively increasing. In contrast, Cl and O ions stay localized around their initial positions. Notably, these latter two ions begin steady migration only from T = 1000 K. In the hydroxylated phases, Na2.5OH0.5Cl and Na2OHCl, the profiles remain akin to those observed at 300 K up to 600 K. Both Na and H ions experience escalating MSD values, whereas individual O ions (not involved in OH groups) maintain a constant position with minimal vibrations. Remarkably, as Na2OHCl features only a minor concentration of individual O atoms, we can assert that only a small portion of the model exhibits solid-like behavior up to 600 K. Beyond this temperature, no individual O atoms ‘live’, as all O atoms are either bonded or interact with H atoms, and the systems behave as a liquid phase. These results are fully consistent with the previous structural analysis based on the SOAP descriptor.
The Na MSD value obtained for Na2OHCl at 450 K (∼21 Å2) is remarkably larger than the one reported by Dawson et al.12 for crystalline Li2OHCl (∼6 Å2 after ∼50 ps at T = 800 K). What we found for Na2OHCl differs drastically from what has been reported for crystalline Li2OHCl antiperovskites, where only rotational dynamics were highlighted for the hydroxyl OH− groups and no long-range mobility.12 In this crystalline phase, H atoms are characterized by a constant MSD of ∼2 Å2 at T = 600 K on a time scale of ∼50 ps, whereas the present Na2OHCl model features an increase of the MSD to a value of ∼60 Å2 after ∼50 ps at T = 600 K (Fig. S2 in the ESI†).
Unlike in crystalline materials, the paddlewheel dynamics in glassy matrices can contribute to the ion mobility also at room temperature,30via the strong coupling between the rotational motion of the anions and the translational motion of the alkaline cations.30,96,98 Based on the above analyses, we propose that H-containing amorphous Na3−xOHxCl compounds show three distinct features that facilitate the occurrence of paddlewheel dynamics. The degree to which these dynamics manifest themselves is temperature-dependent. First, these systems contain hydroxyl groups which are free to rotate, impacting the neighbouring cations. Second, the amorphous matrix has a lower density than its crystalline counterpart that makes available additional free volume for O–H rotations, facilitating anion reorientations. Third, while it is typical for most glasses to exhibit a lower density compared to their crystalline form, amorphous Na3−xOHxCl systems have a potentially unusual characteristic – the absence of covalent bonding in their atomic structure. These features are found in strong accordance with the features of paddlewheel dynamics reported for 75Li2S-25P2S5 glass.30
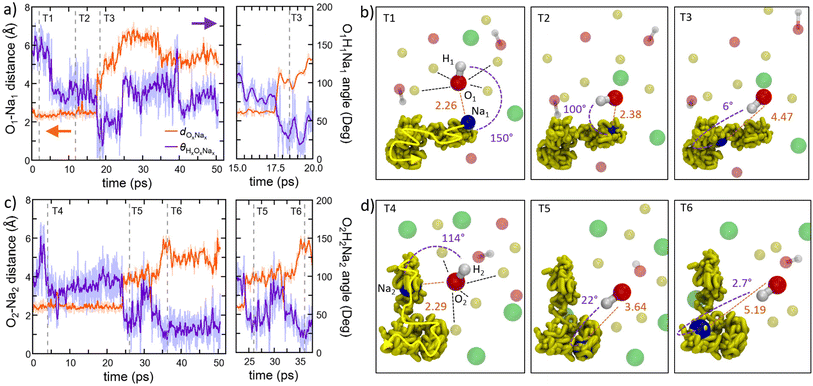
A more detailed view of the dynamical mechanism is shown in Fig. 9a–d. These panels illustrate the rotation of two hydroxyl (OH) groups nearest neighbor to one sodium (Na) ion during Na migration. Throughout the entire process, O(OH) and Na maintain their coordination of six cations and four-to-five anions, respectively. The coordination of Na is preserved by means of rotational displacements of the anion through a paddlewheel-type mechanism. Another salient feature observed in these migration events is the dissociation or undocking of Na from a subset of its neighboring anions at the onset of the process, followed by its association or docking to new anions towards the end.30
Former experimental and computational results have also stirred a debate about the formation of water molecules in antiperovskites. Based on the analysis presented above, Na2.5OH0.5Cl appears not to show any water formation since all H atoms are bound in OH groups, while our Na2OHCl model system does, with ∼9.3% of O atoms involved in H2O molecules. The formation of these water molecules can be elucidated by , as shown in Fig. 10a, a typical H hopping process involving OH groups in Na2OHCl at T = 300 K. We first show the temporal evolution of two representative distances. The first is the one between the H atom termed H1 belonging to a water molecule, previously formed, and the O atom termed O1 atom to which it is bonded (dO1H1, initially at ∼0.98 Å). The second one concerns the same H1 atom and a second O atom termed O2 atom belonging to a neighbouring OH group (dO2H1, initially at ∼3.8 Å; Fig. 10b). After about ∼15 ps, H1 starts to form a strong hydrogen bond (H-bond) with the neighbouring O2 atom of one OH hydroxyl group at a distance of ∼1.9 Å. The mean lifetime of this transient H-bond is ∼2.5 ps. Then, H1 is shared between O1 and O2via forming and breaking O–H bonds showing an average dO1,2H1 distance of ∼1.6 Å and forming eventually a water molecule upon H transfer (Fig. 10c and d). Its transition rate, defined as the number of inter-unit transitions per ps observed within a given process (H-bond or water molecule formation), is of about 1.0 before the formation of a stable new H2O molecule. In Fig. 10 panels (e–f) exemplify the dynamical evolution of the previous environment toward H transfer to a third hydroxyl group (from O2 to O3), resulting in the formation of a new water molecule. The presented mechanism is very similar to the known Grotthuss one,80–85 in which the H atom switches between a σ bond and a hydrogen bond to propagate and eventually stabilize in a newly formed water molecule, as in proton-conducting solid-oxide materials.
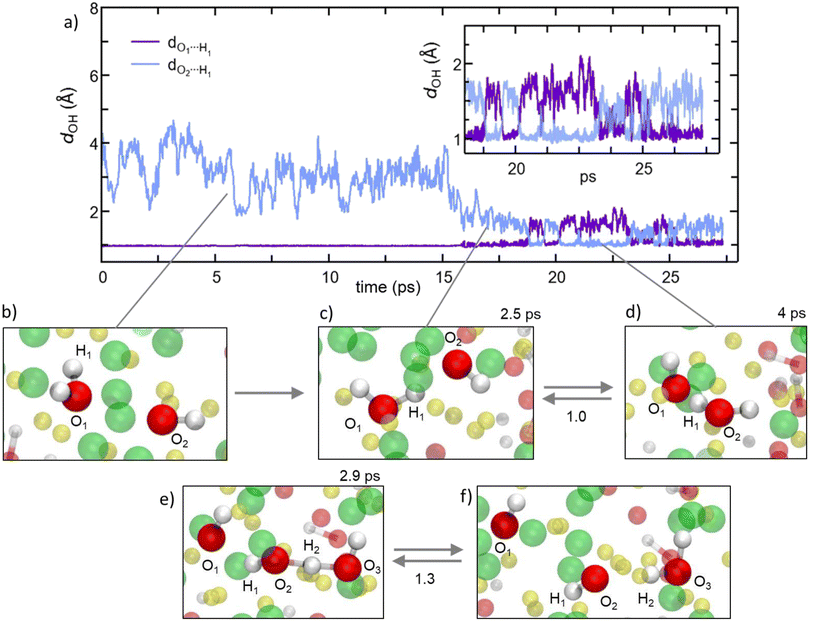 | ||
| Fig. 10 (Color online) For the Na2OHCl system: the proton hopping process by which H atoms migrate through a dynamical switch between σ and hydrogen bonds giving rise to the formation of metastable water molecules (i.e. Grotthuss-like mechanism).80–85 (a) Temporal evolution of the interatomic distance between one H atom labelled H1 atom, belonging to a water molecule initially formed, and its bonded O atom labelled O1. Also shown is the temporal evolution of the distance between H1 and a second O atom labelled O2 that is part of a neighboring hydroxyl group. Inset: zoomed-in view of the temporal window along which H1 is shared between two O1 and O2, leading to the transient formation and breaking of the OH bond and water molecules. (b–f) Inter-unit transitions between structural units in amorphous Na2OHCl at 300 K. Indicatively, the mean lifetimes of the transient H-bonds and water molecules are reported on top of the panels, whereas the transition rates are reported between the panels. Here, the transition rate is defined as the number of inter-unit transitions per ps observed within a given process (H-bond or water molecule formation). Color legend: Na, yellow; O, red; Cl, green. | ||
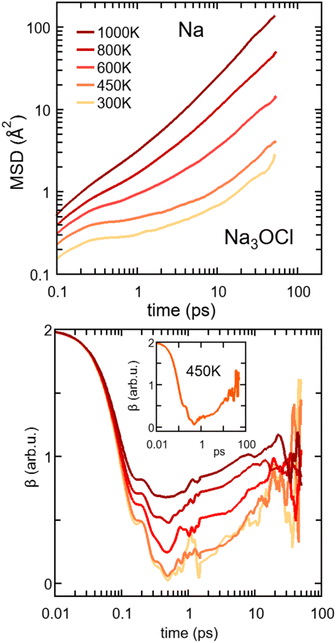 | ||
| Fig. 11 (Color online) Top: log–log plot of MSD vs. time for Na in Na3OCl at temperatures in between T = 300 K and 1200 K. Bottom: corresponding values of β. Inset: β value as a function of time at T = 800 K. Note that the log–log plots of MSD vs. time data for the Na3−xOHxCl (x = 0, x = 0.5, and x = 1) systems are reported in the ESI (Fig. S2†). | ||
The onset of the diffusive regime can be monitored via the time behaviour of β (eqn (4)), given in Fig. 11 for Na3OCl. As expected, the higher the temperature the faster the β approaches ∼1, i.e. at T = 450 K, 600 K, 800 K, and 100 K and this target value is reached after ∼33 ps, ∼23 ps, ∼15 ps, and ∼8 ps respectively. At 300 K, the diffusive regime is not reached within ∼50 ps, the behaviour of β being affected by statistical noise for increasing time. Analogous information on the MSD of the two hydroxylated systems is given in Fig. S2, ESI† (linear plot) and Fig. S4, ESI† (log–log plot, as in Fig. 11). Remarkably, for T ≤ 450 K, the cage regime disappears for Na2.5OH0.5Cl and Na2OHCl. This is consistent with the boosted Na ion dynamics due to the OH anion rotational mechanism discussed before. Also, the MSD trend of H atoms features high values at short times (<∼1 ps) for any given temperature, again due to the rotational disordered of OH anions. At longer times, the MSD profiles of H and Na atoms do superpose as a result of a fully enhanced diffusive behavior concerning all Na and OH groups.
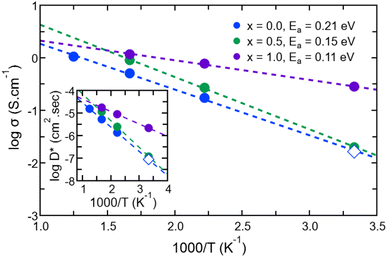
Having identified the temperatures at which Na ions reached the diffusive regime (range 450 K–800 K for Na3OCl and 300 K–600 K for Na2.5OH0.5Cl and Na2OHCl), we calculated for the three systems the self-diffusion coefficients (tracer, D*) for Na by using the Einstein equation (eqn (5)) and then converted them into Na-ion conductivities with eqn (7). By plotting these data according to the relationship logD* vs. 1000/T (Fig. 12) and fitting it in the Arrhenius form, we obtain by extrapolation the uncorrelated tracer conductivity σ* of Na ions at T = 300 K, as customarily done for crystalline solid-state electrolytes.7,12D* and σ* values are reported in Table 3, together with the calculated activation energy (Ea) of Na ion transport. We have also computed the tracer diffusion coefficient (D*) for the least mobile element, namely individual O atoms, at 300 K for all three models. The calculated values are 1.7 × 10⁻⁷ cm2 s−1, 1.5 × 10⁻⁷ cm2 s−1, and 3.9 × 10⁻⁷ cm2 s−1 for the three respective models. Notably, these values are lower by two orders of magnitude than the typical diffusion coefficients observed in liquids (∼10−5 cm2 s−1),42 thus providing additional reinforcement to the previous observations that underline the solid-like nature of the three models at 300 K.
| T (K) | x = 0 | x = 0.5 | x = 1.0 | |
|---|---|---|---|---|
| a Data extrapolated at T = 300 K. | ||||
| D* (cm2 s−1) | 300 Ka | 8.65 × 10⁻⁸ | 1.20 × 10⁻⁷ | 2.13 × 10⁻⁶ |
| σ* (S cm−1) | 300 Ka | 0.016 | 0.08 | 0.28 |
| E a (eV) | 300 K | 0.21 | 0.15 | 0.11 |
| D* (cm2 s−1) | 450 K | 1.36 × 10⁻⁶ | 2.47 × 10⁻⁶ | 8.74 × 10⁻⁶ |
| σ* (S cm−1) | 450 K | 0.17 | 0.27 | 0.77 |
| σ ion (S cm−1) | 450 K | 0.08 | 0.10 | 0.22 |
| σ totion (S cm−1) | 450 K | 0.67 | 0.75 | 0.99 |
| H σR | 450 K | 2.03 | 2.67 | 3.50 |
| H totR | 450 K | 0.89 | 1.84 | 2.51 |
For Na2.5OH0.5Cl and Na2OHCl, we obtained at 300 K Ea = 0.15 eV, Ea = 0.11 eV and a Na tracer conductivity equal to ∼80 mS cm−1 and ∼280 mS cm−1, respectively. These data demonstrate that Na ion transport is promoted by the addition of H atoms. These values correspond to the ideal case where no collective effects are taken into account, as those due to alike-Na ions or different ions. However, since these effects are present in experiments, it is appropriate to account for them by considering the so-called Haven ratio (HR) which can be obtained viaeqn (9) and (10) in order to quantify the contribution of alike-Na ions (HσR)66–68,71 or a total contribution coming from all positive and negative ions (HtotR, eqn (11)).61
Often, previous studies on crystalline Li/Na antiperovskites assumed a Haven ratio equal to 1 disregarding collective effects.7,12 While single-ion conducting glasses typically exhibit Haven ratios of ∼0.1–0.6 indicative of positive correlating effects,60,99 ionic liquids61 and molten salts62 behave oppositely with HR values larger than 1. For comparison, in Table 3 we report the values of HσR, HtotR and the corresponding Na and total conductivities obtained at T = 450 K. We obtained HσR values larger than 1, indicating a strong negative effect of the collective correlations of alike-Na ions. Therefore, at this temperature, the behaviour of amorphous Na3−xOHxCl systems in terms of conductivity is closer to ionic liquids and molten salts than to a glassy matrix. We also remark that this specific effect is more important when Na is partially replaced by H (from 2.0 for Na3OCl to 2.7 and 3.5 for the two hydroxylated phases). Finally, the resulting Na charge conductivities (σion) are lower than the uncorrelated Na tracer conductivity σ* for the three systems.
In terms of HtotR, we obtained for Na3OCl a much lower value than HσR (0.89 vs. 2.03), which indicates significant positive collective correlated effects when the mobility of all ions is taken into consideration. The value obtained for Na3OCl is found close to the typical values found for single-ion conducting glasses.60,99 This is not the case for the two hydroxylated models, which showed values always larger than 1 for HtotR meaning that in the presence of H (OH hydroxyl groups) negative effects are more important. The corresponding final total ionic conductivities (σtotion) are moderately larger to the Na ions uncorrelated tracer ionic conductivity (σ*) estimation for the three models Na3OCl (0.67 vs. 0.17 S cm−1), Na2.5OH0.5Cl (0.75 vs. 0.27 S cm−1), and Na2OHCl (0.99 vs. 0.77 S cm−1). The σtotion obtained here at 450 K is finally found 1.5 times higher in Na-deficient Na2OHCl than Na2OHCl, whereas in the case of Na2OHI/Na2OHI an increase of 102 times at about 550 K was reported.100
Therefore, the Na ionic conductivity of disordered Na3−xOHxCl systems can be a viable, effective alternative to the crystalline counterparts, with the partial replacement of Na with H enhancing ion transport. However, the mobility of the other ions (Cl, O, and H) is concomitantly boosted which might be detrimental to practical electrolyte applications.
4 Conclusions
X3OA-based antiperovskites have shown promising potential as solid-state electrolytes for ion batteries due to their structural and dynamical properties. However, while the structure and ion dynamics mechanisms of crystalline X3OA compounds are well-known, there is a lack of quantitative structural characterization for amorphous antiperovskites. In this study, we used first-principles molecular dynamics to quantitatively assess the structure and ion dynamics mechanisms of three amorphous Na3−xOHxCl (with x = 0, 0.5, and 1) Na-rich antiperovskites. We found that amorphous Na3OCl shows a substantially different structure compared to its crystalline counterpart, with a disordered structure exhibiting limited intermediate range order and short-range order driven by a majority of four-fold Na atoms (∼70%), in terms of counter-ion coordination by means of ionic bonds. Na–O bond distances are close to those reported in the crystalline phase, while Na–Cl distances are significantly shorter. As a result, a reduced number of neighboring counter-ions and Na atoms are favored in the local surrounding of Na atoms in the amorphous phase. Na is found primarily coordinated to both anions (O and Cl), with only a small percentage of Na atoms coordinated exclusively to O or Cl atoms. These results unveil contrasting differences in the structure of amorphous Na3OCl compared to previous models conjectured for glassy Li3OCl, which was based on the segregation of Li2O and LiCl-rich regions.The partial replacement of Na atoms with H in the two hydroxylated phases studied (Na2.5OH0.5Cl and Na2OHCl) gives rise to a lower degree of structural organization when compared to H-free Na3OCl, with all H atoms bonded to O atoms. At 300 K, the partial substitution of Na ions with H precipitates a heightened disordering degree concurrent with a lower temperature threshold for the solid-to-liquid transition. Particularly, Na2OHCl exhibits a disordering degree we characterize as ‘slurry’, owing to a degree to be significantly greater with respect to Na2.5OH0.5Cl. Amorphous Na3OCl has a unique microscopic structure that enables remarkable Na ion dynamics and ionic conductivity, challenging that of defective crystalline phases. The presence of hydroxyl OH− anions in the hydroxylated models is crucial for the mobility of Na ions, which is enhanced by rapid rotation of O–H bonds and paddlewheel-type mechanisms. This promotes the formation of available space, which is essential for achieving fast Na-ion transport. Interestingly, the paddlewheel dynamics in the hydroxylated models of glassy matrices can contribute to ion mobility even at room temperature, owing to the strong coupling between the rotational motion of the anions and the translational motion of the alkaline cations. In terms of correlated dynamical effects, the behaviour of amorphous Na3OCl is found closer to that of single-ion conducting glasses, whereas the two hydroxylated models are found closer to ionic liquids and molten salts than to a glassy matrix. We also observe a noticeable shift in favor of positive correlated effects for Na3OCl, whereas for the two hydroxylated phases negative effects are more important.
Concerning the presence of water molecules in antiperovskites, our study proves that the presence of H atoms promotes the formation of H-bonds in Na2.5OH0.5Cl, while only in the case of Na2OHCl the formation of a small amount of water is observed.
Overall, the results obtained in this work add to the growing evidence that disordered Na-rich antiperovskites provide a viable and effective alternative to their crystalline counterparts as solid state electrolytes. Our results underscore the significance of conducting quantitative structural assessments to better comprehend the impact of the structure on the performances of these systems.
Data availability
Representative trajectory files of the three Na3−xOHxCl models are available at the European Center of Excellence Novel Materials Discovery (CoE-NOMAD) repository.101Author contributions
Tan-Lien Pham: investigation, writing, and formal analysis. Mohammed Guerboub: investigation, writing, and formal analysis. Assil Bouzid: methodology and writing. Carlo Massobrio: methodology and writing. Mauro Boero: methodology and writing. Young-Han Shin: conceptualization, supervision, investigation, and writing. Guido Ori: conceptualization, supervision, investigation, and writing.Conflicts of interest
There are no conflicts to declare.Acknowledgements
This work was supported by the National Research Foundation of Korea (NRF) grants funded by the Ministry of Science and ICT (MSIT), government of South Korea (grant no. 2021R1F1A1048555). We acknowledge financial support from the Agence National de la Recherche (ANR) within the framework of the project AMSES No. ANR-20-CE08-0021, the Seed Money program (project MEDIA) of Eucor-The European Campus, the Interdisciplinary Thematic Institute QMat, as part of the ITI 2021–2028 program of the University of Strasbourg, CNRS and Inserm. This project has also received funding from the European Union’s Horizon 2020 research and innovation programme under the Marie Skłodowska-Curie grant agreement number 847471 (QUSTEC). Calculations were performed by using resources from GENCI (Grand Equipement National de Calcul Intensif, grant no. A0100807670, A0120807670, and A0140807670) and the Pole HPC Équipe@Meso of the Université de Strasbourg.References
- J. Dawson, T. Famprikis and K. Johnston, J. Mater. Chem., 2021, 9, 18746–18772 RSC.
- W. Xia, Z. Yang, Z. Feipeng, A. Keegan, Z. Ruo, L. Shuai, Z. Ruqiang, Z. Yusheng and S. Xueliang, Chem. Rev., 2022, 122, 3763–3819 CrossRef CAS PubMed.
- T. Shao, C. Liu, W. Deng, C. Li, X. Wang, M. Xue and R. Li, Batteries Supercaps, 2019, 2, 403–427 CrossRef.
- K. Kim, Y. Li, P. Tsai, F. Wang, S. Son, Y. Chiang and D. Siegel, Chem. Mater., 2022, 34, 947–958 CrossRef CAS.
- K. Yang, D. Liu, Z. Qian, D. Jiang and R. Wang, ACS Nano, 2021, 15, 17232–17246 CrossRef CAS PubMed.
- Y. Zhao and L. L. Daemen, J. Am. Chem. Soc., 2012, 134, 15042–15047 CrossRef CAS PubMed.
- B. Goldmann, M. Clarke, J. Dawson and M. Islam, J. Mater. Chem. A, 2022, 10, 2249–2255 RSC.
- H. Fang and P. Jena, Proc. Natl. Acad. Sci. U.S.A., 2017, 114, 11046–11051 CrossRef CAS PubMed.
- Z. Deng, D. Ni, D. Chen, Y. Bian, S. Li, Z. Wang and Y. Zhao, InfoMat, 2022, 4, 2567–3165 CrossRef.
- W. Yonggang, Q. Wang, Z. Liu, Z. Zhou, S. Li, J. Zhu, R. Zou, Y. Wang, J. Lin and Y. Zhao, J. Power Sources, 2015, 293, 735–740 CrossRef.
- J. Oh, L. He, B. Chua, K. Zeng and L. Lu, Energy Stor. Mater., 2021, 34, 28–44 Search PubMed.
- J. Dawson, H. Chen and M. Islam, J. Phys. Chem. C, 2020, 122, 23978–23984 CrossRef.
- E. Ahiavi, J. Dawson, U. Kudu, M. Courty, M. Islam, O. Clemens, C. Masquelier and T. Famprikis, J. Power Sources, 2020, 471, 228489 CrossRef CAS.
- X. Xu, K. S. Hui, K. N. Hui, H. Wang and J. Liu, Mater. Horiz., 2020, 7, 1246–1278 RSC.
- T.-L. Pham, W. I. Choi, A. Shafique, H. J. Kim, M. Shim, K. Min, W.-J. Son, I. Jang, D. S. Kim, M. Boero, C. Massobrio, G. Ori, H. S. Lee and Y.-H. Shin, Phys. Rev. Appl., 2023, 19, 034004 CrossRef CAS.
- S. Gao, C. Tassel, S. Fujii, H. Ubukata, T. Zhu, D. Zhang, T. Broux, T. Saito, C. Zhong, E. Yoruk and K. Yamamoto, Chem. Mater., 2022, 34, 6815–6823 CrossRef CAS.
- J. Zheng, B. Perry and Y. Wu, ACS Mater. Au, 2021, 1, 92–106 CrossRef CAS PubMed.
- M. H. Braga, N. S. Grundish, A. J. Murchison and J. B. Goodenough, Energy Environ. Sci., 2017, 10, 331–336 RSC.
- M. H. Braga, J. A. Ferreira, V. Stockhausen, J. E. Oliveira and A. El-Azab, J. Mater. Chem. A, 2014, 2, 5470–5480 RSC.
- M. H. Braga, A. J. Murchison, J. A. Ferreira, P. Singh and J. B. Goodenough, Energy Environ. Sci., 2016, 9, 948–954 RSC.
- M. H. Braga, J. A. Ferreira, A. J. Murchison and J. B. Goodenough, J. Electrochem. Soc., 2017, 164, A207–A213 CrossRef CAS.
- I. Hanghofer, G. J. Redhammer, S. Rohde, I. Hanzu, A. Senyshyn, H. M. R. Wilkening and D. Rettenwander, Chem. Mater., 2018, 30, 8134–8144 CrossRef CAS.
- D. A. Steingart and V. Viswanathan, Energy Environ. Sci., 2018, 11, 221–222 RSC.
- J. T. Frith, M. J. Lacey and U. Ulissi, Nat. Commun., 2023, 14(1), 420 CrossRef CAS PubMed.
- H. H. Heenen, J. Voss, C. Scheurer, K. Reuter and A. C. Luntz, J. Phys. Chem. Lett., 2019, 10, 2264–2269 CrossRef CAS PubMed.
- Y. W. Choi, C. M. Araujo and R. Lizarraga, J. Power Sources, 2022, 521, 230916 CrossRef CAS.
- Y. Tian, F. Ding, H. Zhong, C. Liu, Y.-B. He, J. Liu, X. Liu and Q. Xu, Energy Stor. Mater., 2018, 14, 49–57 Search PubMed.
- Y. Tian, F. Ding, L. Sang, Y. He, X. Liu and Q. Xu, Int. J. Electrochem. Sci., 2019, 14, 4781–4798 CrossRef CAS.
- Y. Gao, S. Sun, X. Zhang, Y. Liu, J. Hu, Z. Huang, M. Gao and H. Pan, Adv. Funct. Mater., 2021, 31, 2009692 CrossRef CAS.
- J. G. Smith and D. J. Siegel, Nat. Commun., 2020, 11, 1483 CrossRef CAS PubMed.
- W. Xia, Y. Zhao, F. Zhao, K. Adair, R. Zhao, S. Li, R. Zou, Y. Zhao and X. Sun, Chem. Rev., 2022, 112, 3763–3819 CrossRef PubMed.
- In the present manuscript we use the formula Na3−xOHxCl to denote the hydroxylated phases in accordance with the widely accepted and commonly used in the community and literature to describe this type of compound (see for instance ref. 1, 2, 12, 16 and 33).
- L. Gao, P. Jiangyang, D. Longbang, Z. Jinlong, W. Liping, G. Song, Z. Ruqiang, K. Le, H. Songbai and Y. Zhao, Chin. J. Chem., 2023, 42, 100048 Search PubMed.
- R. Car and M. Parrinello, Phys. Rev. Lett., 1985, 55, 2471–2474 CrossRef CAS PubMed.
- J. Perdew, K. Burke and M. Ernzerhof, Phys. Rev. Lett., 1996, 77, 3865 CrossRef CAS PubMed.
- N. Troullier and J. L. Martins, Phys. Rev. B: Condens. Matter Mater. Phys., 1991, 43, 1993–2006 CrossRef CAS PubMed.
- S. Nosé, Mol. Phys., 1984, 52, 255–268 CrossRef.
- S. Nosé, J. Chem. Phys., 1984, 81, 511–519 CrossRef.
- W. G. Hoover, Phys. Rev. A, 1985, 31, 1695–1697 CrossRef PubMed.
- G. J. Martyna, M. L. Klein and M. Tuckerman, J. Chem. Phys., 1992, 97, 2635–2643 CrossRef.
- P. Blochl and M. Parrinello, Phys. Rev. B: Condens. Matter Mater. Phys., 1992, 45, 9413–9416 CrossRef PubMed.
- C. Massobrio, The Structure of Amorphous Materials Using Molecular Dynamics, IOP Publishing, 2022 Search PubMed.
- A. Bouzid, T. Pham, Z. Chaker, M. Boero, C. Massobrio, Y. Shin and G. Ori, Phys. Rev. B, 2021, 103, 094204 CrossRef CAS.
- G. Ori, A. Bouzid, E. Martin, C. Massobrio, S. L. Roux and M. Boero, Solid State Sci., 2019, 95, 105925 CrossRef CAS.
- G. Ori, C. Massobrio, A. B. M. Boero and B. Coasne, Phys. Rev. B: Condens. Matter Mater. Phys., 2014, 90, 045423 CrossRef.
- Q. Evrard, Z. Chaker, M. Roger, C. M. Sevrain, E. Delahaye, E. Gallart, M. Gilliot, P. C. Leuvrey, J.-M. Rueff, P. Rabu, M. Boero, C. Massobrio, G. Ori and G. Rogez, Adv. Funct. Mater., 2017, 27, 1703576 CrossRef.
- Z. Chaker, G. Ori, M. Boero and C. Massobrio, Beilstein J. Nanotechnol., 2018, 8, 857–860 CrossRef PubMed.
- Z. Chaker, A. Bouzid, B. Coasne, C. Massobrio, M. Boero and G. Ori, J. Non-Cryst. Solids, 2018, 498, 288–293 CrossRef CAS.
- G. Cotin, C. Kiefer, F. Perton, M. Boero, B. Ozdamar, A. Bouzid, G. Ori, C. Massobrio, D. Begin, B. Pichon, D. Mertz and S. Begin-Colin, ACS Appl. Nano Mater., 2018, 1, 4306–4316 CrossRef CAS.
- B. Ozdamar, A. Bouzid, G. Ori, C. Massobrio and M. Boero, J. Chem. Theory Comput., 2018, 14, 225–235 CrossRef CAS PubMed.
- D. Gentili and G. Ori, Nanoscale, 2022, 14, 14385–14432 RSC.
- D. Gentili, G. Ori, L. Ortolani, V. Morandi and M. Cavallini, ChemNanoMat, 2017, 3, 874–878 CrossRef CAS.
- K. Hippler, S. Sitta, P. Vogt and H. Sabrowsky, Acta Crystallogr., 1990, 463, 736–738 Search PubMed.
- CPMD, Copyright 1990–2023 by IBM Corp. and 1994–2001 by Max Planck Institute, Stuttgart, https://github.com/CPMD-code Search PubMed.
- S. De, A. P. Bartók, G. Csányi and M. Ceriotti, Phys. Chem. Chem. Phys., 2016, 18, 13754–13769 RSC.
- V. L. Deringer, A. P. Bartók, N. Bernstein, D. M. Wilkins, M. Ceriotti and G. Csányi, Chem. Rev., 2021, 121, 10073–10141 CrossRef CAS PubMed.
- L. Himanen, M. O. Jäger, E. V. Morooka, F. F. Canova, Y. S. Ranawat, D. Z. Gao, P. Rinke and A. S. Foster, Comput. Phys. Commun., 2020, 247, 106949 CrossRef CAS.
- Molecular Dynamics Simulations of Disordered Materials, ed. C. Massobrio, J. Du, M. Bernasconi and P. Salmon, Springer International Publishing, Cham, 2015 Search PubMed.
- Theory and Simulation in Physics for Materials Applications: Cutting-Edge Techniques in Theoretical and Computational Materials Science, ed. E. Levchenko, Y. Dappe and G. Ori, Springer International Publishing, Cham, 2020 Search PubMed.
- J. Habasaki, Int. J. Appl. Glass Sci., 2020, 11, 421–431 CrossRef CAS.
- N. M. Vargas-Barbosa and B. Roling, ChemElectroChem, 2020, 7, 367–385 CrossRef CAS.
- A. Gheribi, K. Machado, D. Zanghi, C. Bessada, M. Salanne and P. P. Chartrand, Electrochim. Acta, 2018, 274, 266–273 CrossRef CAS.
- H. Fanf and P. Jena, Nat. Commun., 2022, 13, 2078 CrossRef PubMed.
- D. Frenkel and B. Smit, Understanding Molecular Simulation, from Algorithms to Applications, Computational Science, from Theory to Applications (Academic), 2001 Search PubMed.
- M. Allen and D. J. Tildesley, Computer Simulation of Liquids, Oxford University Press, USA, 1989 Search PubMed.
- A. V. der Ven, G. Ceder, M. Asta and P. Tepesch, Phys. Rev. B: Condens. Matter Mater. Phys., 2001, 64, 184307 CrossRef.
- L. Haarmann and K. Albe, Solid State Ionics, 2021, 363, 115604 CrossRef CAS.
- S. Sicolo, C. Kalcher, S. Sedlmaier, J. Janek and K. Albe, Solid State Ionics, 2018, 319, 83–91 CrossRef CAS.
- Y. Gao, A. Nolan, P. Du, Y. Wun, C. Yang, Q. Chen, Y. Mo and S. Bo, Chem. Rev., 2020, 120, 5954–6008 CrossRef CAS PubMed.
- G. Murch, Solid State Ionics, 1982, 7, 177–198 CrossRef CAS.
- W. Richards, T. Tsujimura, L. Miara, Y. Wang, J. Kim, S. Ong, I. Uechi, N. Suzuki and G. Ceder, Nat. Commun., 2016, 7, 1–8 Search PubMed.
- Z. Zhu, I. Chu, Z. Deng and S. Ong, Chem. Mater., 2015, 27, 8318–8325 CrossRef CAS.
- Y. Lin, A. Yong, W. Gustafson, C. Reedy, E. Ertekin, J. Krogstad and N. Perry, Curr. Opin. Solid State Mater. Sci., 2020, 24, 100875 CrossRef CAS.
- A. Marcolongo and N. Marzari, Phys. Rev. Mater., 2017, 1, 025402 CrossRef.
- N. Molinari, Y. Xie, I. Leifer, A. Marcolongo, M. Kornblutha and B. Kozinsky, Phys. Rev. Lett., 2021, 217, 025901 CrossRef PubMed.
- M. Mottet, A. Marcolongo, T. Laino and I. Tavernelli, Phys. Rev. Mater., 2019, 3, 035403 CrossRef CAS.
- P. Salmon and A. Zeidler, J. Condens. Matter Phys., 2015, 27, 133201 CrossRef PubMed.
- A. Zeidler, P. Salmon, T. Usuki, S. Kohara, H. Fischer and M. Wilson, J. Chem. Phys., 2022, 157, 094504 CrossRef CAS PubMed.
- T. Pham, A. Samad, H. Kim and Y. Shin, J. Appl. Phys., 2018, 124, 164106 CrossRef.
- D. Marx, ChemPhysChem, 2006, 7, 1848–1870 CrossRef CAS PubMed.
- M. Tuckerman, D. Marx and M. Parrinello, Nature, 2002, 417, 925–929 CrossRef CAS PubMed.
- M. Boero, T. Ikeshoji and K. Terakura, ChemPhysChem, 2005, 6, 1775–1779 CrossRef CAS PubMed.
- K. Kamiya, M. Boero, M. Tateno, K. Shiraishi and A. Oshiyama, J. Am. Chem. Soc., 2007, 129, 9663–9673 CrossRef CAS PubMed.
- H. Ali, F. Giberti, J. Cuny, T. D. Kühne and M. Parrinello, Proc. Natl. Acad. Sci. U.S.A., 2013, 110, 13723–13728 CrossRef PubMed.
- M. Hellstrom, M. Ceriotti and J. Behler, J. Phys. Chem. B, 2018, 122, 10158–10171 CrossRef PubMed.
- A. P. Bartók, R. A. Kondor and G. Csányi, Phys. Rev. B: Condens. Matter Mater. Phys., 2013, 87, 184115 CrossRef.
- Z. El-Machachi, M. Wilson and V. L. Deringer, Chem. Sci., 2022, 13, 13720–13731 RSC.
- N. Bernstein, B. Bhattarai, G. Csányi, D. A. Drabold, S. R. Elliott and V. L. Deringer, Angew. Chem., 2019, 131, 7131–7135 CrossRef.
- L. Sun, Y.-X. Zhou, X.-D. Wang, Y.-H. Chen, V. L. Deringer, R. Mazzarello and W. Zhang, npj Comput. Mater., 2021, 7, 29 CrossRef CAS.
- Z. Lu, C. Chen, Z. M. Baiyee, X. Chen, C. Niu and F. Ciucci, Phys. Chem. Chem. Phys., 2015, 17, 32547–32555 RSC.
- X. L. J. Howard, A. Chen, J. Zhu, S. Li, G. Wu, P. Dowden, H. Xu, Y. Zhao and Q. Jia, Adv. Sci., 2016, 3, 1500359 CrossRef PubMed.
- J. Serejo, J. Pereira, R. Mouta and L. Rego, Phys. Chem. Chem. Phys., 2021, 23, 6964–6973 RSC.
- A. Song, Y. Xiao, K. Turcheniuk, P. Upadhya, A. Ramanujapuram, J. Benson, A. Magasinski, M. Olguin, L. Meda, O. Borodin and G. Yushin, Adv. Energy Mater., 2018, 8, 1700971 CrossRef.
- J. Howard, Z. Hood and N. Holzwarth, Phys. Rev. Mater., 2017, 1, 075406 CrossRef.
- P.-C. Tsai, S. Mair, J. Smith, D. M. Halat, P.-H. Chien, K. Kim, D. Zhang, Y. Li, L. Yin, J. Liu, S. H. Lapidus, J. A. Reimer, N. P. Balsara, D. J. Siegel and Y.-M. Chiang, Adv. Energy Mater., 2023, 13, 2203284 CrossRef CAS.
- H. Fang and P. Jena, Nat. Commun., 2022, 13, 2078 CrossRef CAS PubMed.
- F. Fu, X. Chen, N. Yao, X. Shen, X. Ma, S. Feng, S. Wang, R. Zhang, L. Zhang and Q. Zhang, J. Energy Chem., 2022, 70, 59–66 CrossRef.
- Z. Zhang and L. Nazar, Nat. Rev. Mater., 2022, 7, 389–405 CrossRef.
- Molecular Dynamics of Nanostructures and Nanoionics, Simulations in Complex Systems, ed. J. Habasaki, eBook, Imprint Jenny Stanford Publishing, New York, 2020 Search PubMed.
- F. Wang, H. A. Evans, K. Kim, L. Yin, Y. Li, P.-C. Tsai, J. Liu, S. H. Lapidus, C. M. Brown, D. J. Siegel and Y.-M. Chiang, Chem. Mater., 2020, 32, 8481–8491 CrossRef CAS.
- Data Deposited and Available at NOMAD, https://doi.org/10.17172/NOMAD/2023.03.06-1 Search PubMed.
Footnote |
| † Electronic supplementary information (ESI) available. See DOI: https://doi.org/10.1039/d3ta01373a |
| This journal is © The Royal Society of Chemistry 2023 |


