Modulating oxygen vacancy concentration on Bi4V2O11 nanorods for synergistic photo-driven plastic waste oxidation and CO2 reduction†
Mengping
Liu‡
a,
Yu
Xia‡
a,
Wen
Zhao
a,
Ruiyi
Jiang
a,
Xin
Fu
a,
Brittney
Zimmerle
b,
Lihong
Tian
*a and
Xiaobo
Chen
 *b
*b
aCollaborative Innovation Center for Advanced Organic Chemical Materials Constructed by the Province and Ministry, Ministry of Education Key Laboratory for the Synthesis and Application of Organic Functional Molecules, College of Chemistry and Chemical Engineering, Hubei University, Wuhan 430062, China. E-mail: tian7978@hubu.edu.cn
bDivision of Energy, Matter and Systems, School of Science and Engineering, University of Missouri-Kansas City, Kansas City, USA. E-mail: chenxiaobo@umkc.edu
First published on 10th January 2023
Abstract
Sunlight-driven CO2 reduction coupled with photo-oxidation of plastic waste into value-added chemicals is a very attractive approach towards solving the greenhouse and environmental crisis. Herein, Bi4V2O11 nanorods with regulable O-vacancy concentration have been synthesized by the solvothermal method, aiming to provide abundant active sites for CO2 adsorption and boost the separation of photogenerated carriers. In a dual-function system, gas production (CO) mainly from the CO2 reduction-half-reaction reaches 64.7 μmol g−1 h−1 on Bi4V2O11 with rich oxygen vacancies (VO-BVO-15) in PET hydrolysis solution under 300 W Xe lamp irradiation, 24.5-fold higher than that in 2 M KOH solution. Moreover, a considerable amount of HCOOH product with a conversion rate of 0.7 mmol gcata.−1 is also achieved under 5 h of irradiation. Glyoxal (6.9 mmol gcata.−1) and glyoxylate (3.2 mmol gcata.−1) are produced mainly from the PET oxidation-half-reaction. This work presents an in-depth study of the development of Bi–O–V photocatalysts through defect engineering for photocatalytic CO2 reduction and demonstrates a promising strategy for reuse of plastic waste and realizing carbon cycle with low energy consumption.
Introduction
Photocatalytic carbon dioxide (CO2) reduction to obtain hydrocarbon solar fuels is one of the promising strategies to solve the energy crisis and complement carbon cycle.1,2 The construction of novel semiconductor photocatalysts with excellent photocatalytic activity and high stability has been regarded as one of the best strategies to solve the environmental and energy issues. To date, numerous novel semiconductor photocatalysts such as Bi-, W-, and Mo-containing photocatalysts have been designed and fabricated to solve the problems of traditional photocatalysts. In particular, Bi-containing photocatalysts have been widely investigated in photocatalytic applications because of their outstanding electronic and optical properties.As one of the important Bi-containing compounds, Bi4V2O11 has aroused considerable interest owing to its special lamellar structure and good light response. To date, numerous efforts have been made to improve its photocatalytic activity through the fabrication of structures with special morphologies and particle sizes.3–6 However, the structure and morphology have limited influence on its photocatalytic performance. Despite considerable efforts, the practical application of Bi4V2O11 in photocatalysis is still suppressed because of the low light absorption, high recombination rate of photoinduced charge pairs and inadequate surface reactive sites in pristine Bi4V2O11.
Oxygen vacancies (VOs) are of particular interest for the enhanced adsorption and activation of inert gas molecules and guiding chemical reactions through more efficient pathways that lower the energy barrier.7 Depending on the coverage and adsorption geometry, O2, CO2, and N2 are activated to their high-energy intermediates.8 The concept of VOs was firstly proposed by Tompkins et al. in the 1960s, where VOs were considered as a kind of species.9 Because of the special synthetic conditions and unstable surface structure of photocatalysts, O atoms are prone to move into random positions or even burst out of the crystal lattice.10 In general, VOs are more easily generated by high temperature and/or pressure, chemical reduction, ion doping or light irradiation, which can lead to the bond breaking with lattice distortion and formation of defective states and electronic compensation in photocatalysts, therefore promoting the critical steps in photocatalytic processes. VOs are recommended to be one of the most important and prevalent anion defects with a relatively lower formation energy on many oxide surfaces. In this regard, introducing VOs on photocatalysts could provide a new perspective to optimize the activity of CO2 photoconversion. Though Bi4V2O11 is an intrinsic oxygen deficient material, constituted by a [Bi2O2]2+ layered skeleton spaced by deficient perovskite-like VOx linkages11 and the oxygen environment around vanadium is adjustable, which results in the unique structure features of Bi4V2O11 based compounds,12–14 few studies focus on investigating the effect of VOs on photocatalytic CO2 reduction on Bi4V2O11.
The control of the oxidation half reaction is the key to promote charge carrier separation.15 In the research system of photocatalytic reduction of CO2, a certain amount of hole sacrificial agents, such as triethylamine, triethanolamine, ammonium oxalate, etc., is often added to the reaction, but they are generally expensive and toxic. Plastic is a precious resource that can store a large amount of energy and chemical raw materials, but most of it is simply thrown into landfills, which not only greatly wastes plastic resources, but also causes great damage to the environment.16 Recently several studies involving photo-reforming of plastics coupled with the photolysis of water to produce hydrogen successfully bring the treatment of waste plastics into the photocatalytic redox system to achieve maximum utilization of energy.17–20
Herein, we successfully synthesize Bi4V2O11 with gradient oxygen vacancies and first attempt to use plastic waste in the dual-function photocatalytic system, in the search for ways to mitigate the greenhouse effect and explore the degradation of plastic waste to alleviate the earth's “plastic crisis”. Our experimental results indicate that the PET photo-oxidation and CO2 photoreduction reinforce each other. In a dual-function system, the plastic pollutant PET is oxidated into some high value-added products, avoiding the use of commonly used expensive and often toxic hole sacrificial agents, thus achieving sustainable reduction of CO2 to CO and HCOOH. Although this idea is still in the experimental stage, the use of this dual-use technology provides a new pathway to tackle many major environmental challenges such as global warming, and plastic waste.
Experimental
Materials
Ethylene glycol (C2H6O2, AR, ≥98%), ammonia (NH3 H2O, AR, 25–28%) and sodium hydroxide (NaOH, AR, ≥96%) were purchased from Sinopharm Group. Bismuth nitrate pentahydrate (Bi(NO3)3·5H2O) and ammonium metavanadate (NH4VO3) were supplied by Aladdin-Reagent. All chemical reagents were used without further purification.Synthesis of defective Bi4V2O11 nanorods
The typical experimental procedure is as follows: first, 0.34 g urea and 1.30 g Bi(NO3)3·5H2O were added to 15.0 mL ethylene glycol (EG) marked as solution A under continuous stirring. Second, 0.156 g NH4VO3 was dissolved in another 15.0 mL ethylene glycol (EG) marked as solution B. Solution B was added to solution A under continuous stirring for 30 minutes, and the pH value of the final system was adjusted to 9.00 using dilute ammonia water at room temperature under constant magnetic stirring. Subsequently, the formed mixture was poured into a stainless-steel autoclave with a Teflon liner of 50 mL capacity and heated at 180 °C for different reaction times (hours). Finally, the reactor was cooled to room temperature naturally. The resulting samples were washed with deionized water and ethanol several times and dried at 80 °C in an oven overnight. The obtained powders were marked as VO-BVO-t, where t represents the reaction time.Characterization
The crystal structure of the samples was characterized by employing a Rigaku X-ray diffractometer with a Cu-Kα (λ = 1.540 Å) radiation source in the 2θ range of 10–60°. Raman spectroscopy data were collected using a Renishaw InVia Raman microscope with an excitation wavelength of 532 nm. The morphologies were observed on a high-resolution transmission electron microscope (HRTEM, FEI Tecnai F20). The X-ray photoelectron spectroscopy measurement of materials was carried out on a VG Multilab 2000 spectrometer with an Al Kα X-ray source (Thermo Electron Corporation), and all the spectra were calibrated to the C 1s peak at 284.8 eV. The CO2 adsorption experiment was performed on a V-Sorb 2800TP volumetric specific surface area and aperture analyzer. All samples were treated at 120 °C in a vacuum to remove trapped gas and humidity. High purity CO2 directly connects the analyzer. CO2 adsorption isotherms were determined in the range of 0.01 Pa to 1.8 bar at room temperature. A Micromeritics Autochem II chemisorption analyzer with a thermal conductivity detector was used to conduct CO2 temperature programmed desorption (CO2-TPD) on materials. The thermal desorption of chemisorbed CO2 was performed in flowing He at a ramp rate of 5 °C min−1 to a final temperature of 700 °C. Electrochemical measurements were implemented on an electrochemical apparatus (CHI760E, China) in a standard three-electrode system with the as-prepared samples as the working electrode, a Pt wire as the counter electrode and a saturated calomel electrode as the reference electrode. Time-resolved photoluminescence spectra (TRPL) were measured on an FLS980 fluorescence spectrometer (Edinburgh Instruments, UK) with an excitation wavelength of 250 nm.Substrate pre-treatment
PET powders were added into 1 L KOH aqueous solution, which was incubated at 40 °C with stirring at 480 rpm for 24 h in air to obtain different concentrations of PET hydrolysis solution.19 After cooling to room temperature, the mixture was centrifuged at 8000 rpm for 3 min, and the supernatant was then extracted for further use.Photocatalytic reaction
The photocatalytic experiment was conducted in a Pyrex glass reactor with a volume of 400 mL (Beijing Perfectlight Technology Co., Ltd, China). Typically, 25 mg catalyst was dispersed into 50 mL 2 M KOH aqueous solution and then 50 mL pre-treated PET solution was added. In order to achieve an adsorption–desorption balance between the catalyst and the substrate, the system was stirred continuously for 30 min in the dark. Prior to the light irradiation, the above system was vacuum-treated to remove the air completely, and purged with CO2 (99.999%) with a flow rate of 5 mL min−1 for 30 min. After that, the reactor was irradiated from the top using a high-pressure xenon lamp as the light source (CEL-HXF300, Beijing Perfect Light Technology Co., Ltd, China). The reaction was kept at constant temperature by a circulating water system. At the given interval, 1.0 mL of gas was taken from the reaction cell and analysed on a gas chromatograph (GC, Zhejiang Fuli Analytical Instrument Co., Ltd, China) equipped with a flame ionization detector (FID, GDX-01 columns). Liquid products were detected by 1HNMR spectra.Results and discussion
Characterization of defective Bi4V2O11
The targeted Bi4V2O11 is synthesized by the solvothermal method in ethylene glycol solvent, and oxygen vacancy concentration is modulated through controlling the reaction time. As shown in Fig. 1a, all diffraction peaks in powder XRD patterns of VO-BVO-9, VO-BVO-12 and VO-BVO-15 are well indexed to Bi4V2O11 without any observable impurity. The strongest peak in the magnified patterns (Fig. 1b) is located at about 28.6° in the former two materials, corresponding to orthorhombic Bi4V2O11 (β-Bi4V2O11, JCPDS 42-0135). However, this diffraction peak shifts to 28.7° in VO-BVO-15, indicating a possible phase distortion.11 When the reaction time exceeds 24 h, a small quantity of BiVO4 impurity is present (marked with an asterisk in Fig. 1a). Raman spectra further provide the fundamental information on the metal–oxygen bond in all as-prepared Bi4V2O11 materials. The Bi–O stretching modes are too weak to be accessible in low wavenumber. Raman modes of V–O bonds are visible between 600 and 1000 cm−1 (Fig. 1c). Two distinct split peaks at around 840 and 880 cm−1 are ascribed to the stretching vibrations of V–O bonds with different bond lengths, monometric V–O tetrahedron and perovskite-like V–O–V bond.21,22 The weak band at 685 cm−1 is related to the doubly coordinated (V–O–V) oxygen atom.21 It is worth noting that the vibrational bands of V–O–V bonds gradually decrease with prolonged reaction time, while the reverse happens to the VO4 tetrahedron (840 cm−1); especially, the additional shoulder at about 800 cm−1 indicates that the dramatic increase of V5+ occupied the perfect VO4 tetrahedral sites in VO-BVO-24, probably originating from the BiVO4 impurity.23 These results illustrate that the crystalline distortion of as-prepared Bi4V2O11 materials (XRD results) is determined by the structural variation of V–O polyhedra induced by oxygen vacancies.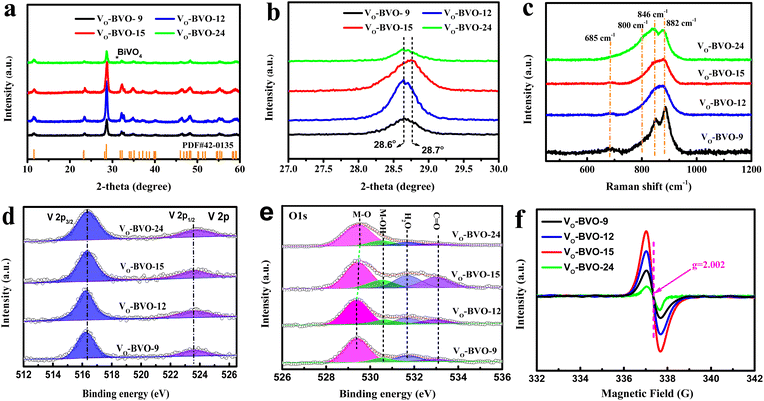 | ||
| Fig. 1 (a) XRD patterns, (b) the magnified XRD patterns, (c) Raman spectra, (d) V 2p and (e) O 1s XPS spectra, and (f) EPR spectra of VO-BVO-9, VO-BVO-12 and VO-BVO-15. | ||
V 2p and O 1s XPS spectra are recorded to further investigate the surface compositions and chemical interaction with the C 1s level at 284.8 eV as the binding energy (BE) reference. As shown in Fig. 1d, the BE of V 2p3/2 is located at ∼516.3 eV, much lower than the BE of V5+ (∼517 eV),24 suggesting the presence of VOs in all as-prepared Bi4V2O11 materials. In fitted O 1s spectra (Fig. 1e), the main peak at 529.3 eV is ascribed to lattice O2− anions in Bi4V2O11, and two signals at 1.3 and 2.4 eV higher BE of O2− can be assigned to adsorbed –OH and H2O on metal sites adjacent to VOs in order to maintain charge balance.25–27 The corresponding intensity of –OH and H2O peaks is indirectly proportional to the concentration of oxygen vacancies.28 Note that the intensity of –OH and H2O gradually increases initially but dramatically decreases when the reaction time exceeds 24 h, suggesting the concentration of VOs with the order of VO-BVO-24 < VO-BVO-9 < VO-BVO-12 < VO-BVO-15. EPR spectra in Fig. 1f also verify that VO-BVO-15 possesses the most VOs because of the strongest signal at g = 2.002 originating from the unpaired electrons at oxygen vacancies.29–31
Apart from the slight structure distortion, the morphologies of Bi4V2O11 are also strongly controlled by the concentration of oxygen vacancies. As shown in Fig. 2a, VO-BVO-9 with less VOs features irregular nanosheets mixed with seed-like nanorods. With the increase of VO concentration, these nanosheets gradually develop into long nanorods with a length of about 100–300 nm and width of 20 nm (VO-BVO-15). VO-BVO-24 remains a nanorod structure but becomes shorter and wider compared with VO-BVO-15. The HRTEM graph of VO-BVO-15 exhibits the lattice fringes with an interplanar spacing of 0.77 nm and 0.28 nm in Fig. 2b, assigned to (002) and (020) crystal facets, respectively. The selected area electron diffraction (SAED) of nanorods shows well-defined electron diffraction spots and further confirms that the lattice distances of (002) and (020) planes are dominant on nanorods (the inset in Fig. 2b). On the edge of the nanorod, a clear disorder layer is observable due to VOs.
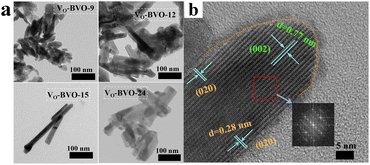 | ||
| Fig. 2 (a) TEM image of VO-BVO-9, VO-BVO-12 and VO-BVO-15. (b) HRTEM image of VO-BVO-15 and selected area electron diffraction graph (the inset). | ||
Photo-driven CO2 reduction coupled with PET oxidation
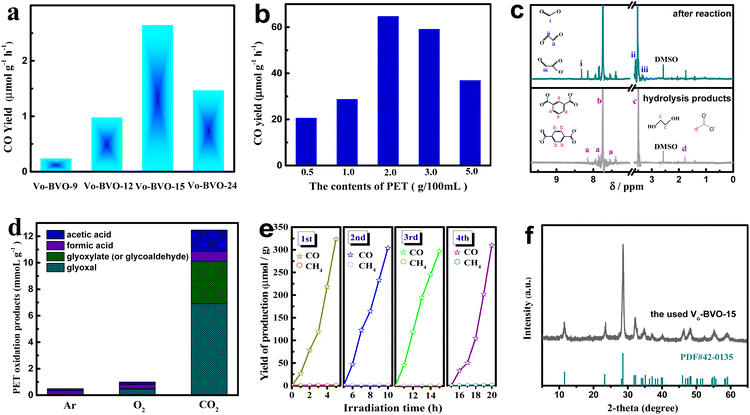
The synergistic ox/red reaction of CO2 and PET on different defective Bi4V2O11 samples is evaluated in KOH aqueous solution (pH = 14.16) under full-wavelength light irradiation (intensity: 150 mW cm−2). All gas and liquid products are investigated by GC and 1H-NMR spectra in detail. Fig. 3a demonstrates CO2 reduction on various catalysts in KOH solution (2M) without PET, which is highly related to the oxygen vacancy concentration in catalysts, and the highest CO conversion rate is 2.6 μmol g−1 h−1 on VO-BiVO-15 with the most oxygen vacancies. Though the value is far higher than those reported for Bi4V2O11 composites (<1 μmol g−1 h−1),32 it is still unsatisfactory. An attempt is made to conduct the synergistic catalytic CO2 reduction and industrial PET oxidation in one system. CO and HCOOH are the main products from CO2 photoreduction. Fig. 3b compares the conversion rates of CO and HCOOH on VO-BiVO-15 in the presence of different PET contents. It is found that the synergistic PET oxidation can significantly improve CO2 reduction, and CO2-to-CO conversion rate increases to 64.7 μmol g−1 h−1 at the optimal PET content of 20 g L−1, about 24.5-fold higher than that from the sole CO2 reduction in KOH solution. 1HNMR spectra of solution before and after photocatalytic reaction are presented in Fig. 3c. The hydrolysis products of industrial PET in KOH solution (before photochemical reaction) are identified to be composed of a large amount of ethylene glycol (EG, c) and a little phthalic acid (a) and acetic acid (d) after removing the insoluble terephthalic acid (TPA, b) by filtration, which could be reused as feedstocks in the synthesis of PET.20 After photocatalytic reaction, new signals of formic acid (i), glyoxal (ii), and glyoxylate/glycoaldehyde (iii) are visible. Accordingly, the HCOOH (i) product originates from CO2 reduction with a yield of 0.7 mmol gcata.−1 under 5 h of irradiation.Products (ii) and (iii) are ascribed to the PET oxidation-half-reaction, which are not detected in the absence of light irradiation or catalysts. The CO2 bubbling consumedly improves the PET oxidation, compared with an Ar or O2 atmosphere. As shown in Fig. 3d, the production rate reaches 6.9 mmol gcata.−1 for glyoxal (ii) and 3.2 mmol gcata.−1 for glyoxylate (or glycoaldehyde) (iii), almost 15 and 64 fold those under an O2 atmosphere, respectively. These results indicate that CO2 bubbling is highly effective in promoting the selective photo-oxidation of PET components to organic chemicals on VO-BVO catalysts.
The stability of VO-BVO-15 in a synergistic reaction of CO2 reduction and PET oxidation is investigated by quantifying CO product in four cycle experiments with each run for 5 h. Fig. 3e displays that CO evolution yield had no obvious decline in four cycle experiments. The XRD pattern of the used VO-BVO-15 well corresponds to Bi4V2O11 without noticeable impurity in Fig. 3f. The used VO-BVO-15 still retains a similar morphology (nanorods) to the fresh one (Fig. S1†). The above results indicate a good durability of VO-BiVO-15 in long-term photocatalytic synergistic reaction of CO2 reduction and PET oxidation.
Role of VOs in enhanced photocatalytic activity
From the photocatalytic kinetic viewpoint, the adsorption of substrate, e.g., CO2 on a catalyst is an important prerequisite for product efficiency.33Fig. 4a illustrates that the order of CO2 uptake capacity is VO-BVO-9 (0.0667 mmol g−1) < VO-BVO-12 (0.1169 mmol g−1) < VO-BiVO-15 (0.1603 mmol g−1) at 298 K and 1.8 bar, probably ascribed to the gradually increased surface areas analysed by N2 adsorption–desorption isotherms (Fig. S2, ESI†). CO2-TPD measurements are performed to determine the strength distribution of basic sites on all catalysts. Except for the weak physical adsorption for CO2 in 50–150 °C,34,35 the strong chemical adsorption appears at 400–600 °C in Fig. 4b. VO-BiVO-9 with less VOs only shows a peak at about 420 °C. With the increase of VOs, the peak becomes stronger and wider and shifts to higher temperature for VO-BiVO-12 and VO-BiVO-15. In addition, a sharp peak at higher temperature between 500 and 600 °C is probably attributed to the formed CO32− with Bi3+ in the CO2-TPD spectrum of VO-BiVO-15.34,35 The quantity of various basic sites is determined by the integral of peak area and displayed in Table S1.† Obviously, VO-BiVO-15 possesses the most basic sites for CO2 adsorption among the three catalysts owing to the highest concentration of VOs, which are beneficial for CO2 adsorption and activation.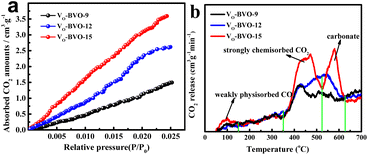 | ||
| Fig. 4 (a) CO2 absorption–desorption isotherms and (b) CO2-TPD curves of VO-BVO-9, VO-BVO-12 and VO-BVO-15. | ||
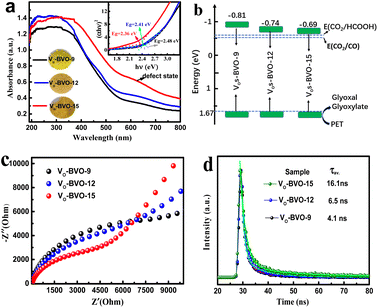
In addition, UV-Vis DRS spectra present gradually enhanced light absorption from VO-BVO-9 to VO-BVO-15 due to the increase of VO concentration (Fig. 5a),36,37 in accordance with the colour change from yellowish-green to yellowish-brown (the inset in Fig. 5a). Moreover, a bump correlative to the VO-induced defect state becomes more obvious between 600 and 700 nm,32,38 which probably forms an intermediate energy level for charge transfer. The corresponding optical band gap is determined by the Kubelka–Munk formula to be 2.48 eV (VO-BVO-9), 2.41 eV (VO-BVO-12) and 2.36 eV (VO-BVO-15), respectively (inset in Fig. 5a).30 XPS valence spectra demonstrate an almost similar valence band maximum (VBM) at 1.67 eV for the three samples (Fig. S3, ESI†). As a result, the conduction band minimum (CBM) calculated according to ECB = EVB − Eg exhibits a slight positive-shift due to gradually narrowed band gap, i.e., −0.81 eV for VO-BVO-9, −0.74 eV for VO-BVO-12 and −0.69 eV for VO-BVO-15, as shown in Fig. 5b, which are sufficient for CO2 reduction to CO and HCOOH.
To confirm VOs promoting charge carrier migration, electrochemical experiments including photocurrent response and EIS spectra are performed. Fig. S4 in the ESI† demonstrates the stable and reproducible on-off current on all samples with/without light irradiation. The photocurrent density on VO-BVO-15 is about 1.31 and 1.62 times that of VO-BVO-12 and VO-BVO-9, respectively, indicating the fastest photogenerated electron transfer on VO-BVO-15. In electrochemical impedance spectra (EIS) (Fig. 5c), the semicircle radius in the high frequency region diminishes with the increase of VO concentration on the catalyst, which also elucidates the decreasing electron transfer resistance on the electrode interface with increasing VOs.39
The TRPL spectra are studied to further understand the charge transfer process. The collected spectra are displayed in Fig. 5d, and the PL decay lifetime (τ) components and corresponding intensity (A) are extracted by curve fitting using a two-exponential function and shown in Table S2.†40 Both short lifetime τ1 and long lifetime τ2, related to intrinsic fluorescence from radiative decay and non-radiative coupling, respectively, prolong with the increase of oxygen vacancy concentration. The resultant average lifetime (τav.) gradually increased, i.e., 4.1 ns for VO-BVO-9 < 6.5 ns for VO-BVO-12 < 16.1 ns for VO-BVO-15, indicating that oxygen vacancies effectively promote charge carrier separation; especially, non-radiative recombination related to defects is dramatically suppressed due to the intensity (A2) drop from 16% on VO-BVO-9 to 6.5% on VO-BVO-15. This is presumedly associated with the special Bi4V2O11 structure that VOs generally reside in V–O layers (〈110〉 direction).41 The increase of VO concentration greatly improves the oxygen ion migration in Bi4V2O11, thus enhancing the conductivity (electrochemical results) and decreasing non-radiative recombination.
Conclusions
In this work, for the first time, Bi4V2O11 photocatalysts with modulating VOs are used in a dual-functional system to photo-catalyse carbon dioxide reduction and plastic waste oxidation. VOs significantly promote the light adsorption, and charge separation and provide abundant sites for CO2 capture, thus synergistically improving the photocatalytic CO2 reduction and PET oxidation. In a dual-function system, CO2-to-CO conversion rate increases to 64.7 μmol g−1 h−1 at the optimal PET content of 20 g L−1, about 24.5-fold higher than that from the sole CO2 reduction in KOH solution. Despite this, a considerable amount of HCOOH is also produced with a yield of 0.7 mmol gcata.−1 under 5 h of irradiation. In the oxidation-half-reaction, considerable glyoxal and glyoxylate are produced by oxidation of glycol coming from PET hydrolysis. As a result, this study provides a novel strategy to reuse plastic waste and promote carbon cycle with low energy consumption.Conflicts of interest
There are no conflicts to declare.Acknowledgements
The work was funded by the National Natural Science Foundation of China (no. 51872081).Notes and references
- L. Yi, W. Zhao, Y. Huang, X. Wu, J. Wang and G. Zhang, Sci. China Mater., 2020, 63, 2206–2214 CrossRef CAS.
- L. Jiang, K. Wang, X. Wu and G. Zhang, Sol. RRL, 2021, 5, 2000326 CrossRef CAS.
- T. Liu, Y. G. Mao and Y. Peng, CrystEngComm, 2018, 20, 2553 RSC.
- M. Liang, L. Chen, Z. Yang, Z. Zeng and S. Yang, Funct. Mater. Lett., 2019, 12, 1850109 CrossRef.
- Y. Lin, H. Cai, H. Chen and H. Luo, Appl. Surf. Sci., 2021, 544, 148921 CrossRef CAS.
- L. Zong, P. Cui, F. Qin, K. Zhao, Z. Wang and R. Yu, Mater. Res. Bull., 2017, 86, 44–50 CrossRef CAS.
- J. Li, H. Li, G. Zhan and L. Zhang, Acc. Chem. Res., 2017, 50, 112–121 CrossRef CAS PubMed.
- H. Li, J. Shang, Z. Ai and L. Zhang, J. Am. Chem. Soc., 2015, 137, 6393–6399 CrossRef CAS PubMed.
- F. C. Tompkins, Nature, 1960, 186, 3–6 CrossRef.
- L. Hao, H. Huang, Y. Zhang and T. Ma, Adv. Funct. Mater., 2021, 31, 2100919 CrossRef CAS.
- C. Lv, G. Chen, J. Sun and Y. Zhou, Inorg. Chem., 2016, 55, 4782–4789 CrossRef CAS PubMed.
- G. Mairesse, P. Roussel, R. N. Vannier, M. Anne and G. Nowogrocki, Solid State Sci., 2003, 5, 861–869 CrossRef CAS.
- Y. Zhang and Y. Ueda, Inorg. Chem., 2013, 52, 5206–5213 CrossRef CAS PubMed.
- Y. Zhang, T. Yamamoto, M. A. Green, H. Kageyama and Y. Ueda, Inorg. Chem., 2015, 54, 10925–10933 CrossRef CAS PubMed.
- H. Liu, C. Xu, D. Li and H. L. Jiang, Angew. Chem., Int. Ed., 2018, 130, 5477–5481 CrossRef.
- J. R. Jambeck, R. Geyer, C. Wilcox, T. R. Siegler, M. Perryman, A. Andrady, R. Narayan and K. L. Law, Science, 2015, 347, 768–771 CrossRef CAS PubMed.
- M. F Kuehnel and E. Reisner, Angew. Chem., Int. Ed., 2018, 57, 3290–3296 CrossRef PubMed.
- Y. Li, S. Wan, C. Lin, Y. Gao, Y. Lu, L. Wang and K. Zhang, Sol. RRL, 2021, 5, 2000427 CrossRef CAS.
- T. Uekert, M. F. Kuehnel, D. W. Wakerley and E. Reisner, Energy Environ. Sci., 2018, 111, 2853–2857 RSC.
- T. Uekert, H. Kasap and E. Reisner, J. Am. Chem. Soc., 2019, 141, 15201–15210 CrossRef CAS PubMed.
- A. K. Arora, T. Sato, T. Okada and T. Yagi, Phys. Rev. B: Condens. Matter Mater. Phys., 2012, 85, 094113 CrossRef.
- K. Trzciński, J. Gasiorowski, A. B. Centkowska, M. Szkoda, M. Sawczak, K. Hingerl, D. R. T. Zahn and A. L. Oleksiak, Thin Solid Films, 2017, 638, 251–257 CrossRef.
- F. D. Hardcastle and I. E. Wachs, J. Solid State Chem., 1991, 90, 194–210 CrossRef CAS.
- G. Silversmit, D. Depla, H. Poelman, G. B. Marin and R. D. Gryse, J. Electron Spectrosc. Relat. Phenom., 2004, 135, 167–175 CrossRef CAS.
- C. Lv, G. Chen, X. Zhou, C. Zhang, Z. Wang, B. Zhao and D. Li, ACS Appl. Mater. Interfaces, 2017, 9, 23748–23755 CrossRef CAS PubMed.
- H. L. Tan, A. Suyanto, A. T. D. Denko, W. H. Saputera, R. Amal, F. E. Osterloh and Y. H. Ng, Part. Part. Syst. Charact., 2017, 34, 1600290 CrossRef.
- H. Ali-Löytty, M. W. Louie, M. R. Singh, L. Li, H. G. S. Casalongue, H. Ogasawara, E. J. Crumlin, Z. Liu, A. T. Bell, A. Nilsson and D. Friebel, J. Phys. Chem. C, 2016, 120, 2247–2253 CrossRef.
- W. C. Huo, X. Dong, J. Y. Li, M. Liu, X. Y. Liu, Y. X. Zhang and F. Dong, Chem. Eng. J., 2019, 361, 129–138 CrossRef CAS.
- X. Y. Kong, Y. Y. Choo, S. P. Chai, A. K. Soh and A. R. Mohamed, Chem. Commun., 2016, 52, 14242–14245 RSC.
- Y. Lv, W. Yao, R. Zong and Y. Zhu, Sci. Rep., 2016, 6, 19347–19355 CrossRef CAS PubMed.
- B. Santara, P. K. Giri, K. Imakita and M. Fujii, J. Phys. Chem. C, 2013, 117, 23402–23411 CrossRef CAS.
- X. Zhao, Z. Duan and L. Chen, Ind. Eng. Chem. Res., 2019, 58, 10402–10409 CrossRef CAS.
- S. Navarro-Jaén, M. Virginie, J. Bonin, M. Robert, R. Wojcieszak and A. Y. Khodakov, Nat. Rev. Chem., 2021, 5, 564–579 CrossRef.
- Y. Wang, T. Chen, F. Chen, R. Tang and H. Huang, Sci. China Mater., 2022, 65, 3497–3503 CrossRef CAS.
- L. Jiang, Y. Li, X. Wu and G. Zhang, Sci. China Mater., 2021, 64, 2230–2241 CrossRef CAS.
- H. Yu, J. Li, Y. Zhang, S. Yang, K. Han, F. Dong, T. Ma and H. Huang, Angew. Chem., Int. Ed., 2019, 58, 3880–3884 CrossRef CAS PubMed.
- F. Qiu, W. Li, F. Wang, H. Li, X. Liu and C. Ren, Colloids Surf., A, 2017, 517, 25–32 CrossRef CAS.
- W. Zhao, Q. Zhong, Y. Pan and R. Zhang, Chem. Eng. J., 2013, 228, 815–823 CrossRef CAS.
- G. Zhao, J. J. Xu and H. Y. Chen, Electrochem. Commun., 2006, 8, 148–154 CrossRef CAS.
- Q. Li, Z. Guan, D. Wu, X. Zhao, S. Bao, B. Tian and J. Zhang, ACS Sustainable Chem. Eng., 2017, 5, 6958–6968 CrossRef CAS.
- H. J Stroud, C. E Mohn, J.-A. Hernandez and N. L Allan, Philos. Trans. R. Soc., A, 2021, 379, 2211 CrossRef PubMed.
Footnotes |
| † Electronic supplementary information (ESI) available: Fig. S1–S4 and Tables S1, S2. See DOI: https://doi.org/10.1039/d2ta09345f |
| ‡ The authors contributed equally to this work. |
| This journal is © The Royal Society of Chemistry 2023 |

