
 Open Access Article
 This Open Access Article is licensed under a
 Creative Commons Attribution 3.0 Unported Licence
Wavelength dependent mechanism of phenolate photooxidation in aqueous solution†
Kate
Robertson
 a,
William G.
Fortune
a,
Julia A.
Davies
a,
Anton N.
Boichenko
b,
Michael S.
Scholz
a,
Omri
Tau
a,
Anastasia V.
Bochenkova
b and
Helen H.
Fielding
*a
a,
William G.
Fortune
a,
Julia A.
Davies
a,
Anton N.
Boichenko
b,
Michael S.
Scholz
a,
Omri
Tau
a,
Anastasia V.
Bochenkova
b and
Helen H.
Fielding
*a
aDepartment of Chemistry, University College London, 20 Gordon Street, London WC1H 0AJ, UK. E-mail: h.h.fielding@ucl.ac.uk
bDepartment of Chemistry, Lomonosov Moscow State University, 119991 Moscow, Russia
First published on 20th February 2023
Abstract
Phenolate photooxidation is integral to a range of biological processes, yet the mechanism of electron ejection has been disputed. Here, we combine femtosecond transient absorption spectroscopy, liquid-microjet photoelectron spectroscopy and high-level quantum chemistry calculations to investigate the photooxidation dynamics of aqueous phenolate following excitation at a range of wavelengths, from the onset of the S0–S1 absorption band to the peak of the S0–S2 band. We find that for λ ≥ 266 nm, electron ejection occurs from the S1 state into the continuum associated with the contact pair in which the PhO˙ radical is in its ground electronic state. In contrast, we find that for λ ≤ 257 nm, electron ejection also occurs into continua associated with contact pairs containing electronically excited PhO˙ radicals and that these contact pairs have faster recombination times than those containing PhO˙ radicals in their ground electronic state.
1 Introduction
Photooxidation is observed in many biological systems following excitation with ultraviolet (UV) light and, even though it is a driving force for many important photochemical reactions, for example, in the photocycle of fluorescent proteins,1–3 it can also have deleterious effects, such as DNA photodamage.4 Phenolate has been studied extensively as a model for photooxidation in a range of biological systems, e.g., tyrosine and the green fluorescent protein (GFP) and photoactive yellow protein (PYP) chromophores.5–10 Nonetheless, there remains some controversy over the mechanism of phenolate photooxidation.An early picosecond transient absorption spectroscopy (TAS) study found that electron ejection was essentially instantaneous following photoexcitation at 265 nm.11 The first detailed femtosecond TAS study, by Chen et al.,12 found that 266 nm photoexcitation, high in the first absorption band (Fig. 1), generated solvated electrons, e(aq)−, on a timescale that was longer than typical charge-transfer-to-solvent (CTTS) processes in inorganic anions.13 A detailed global target analysis identified two competing pathways for e(aq)− formation: fast (sub-picosecond) electron ejection from vibrationally hot S1(1ππ*), hereafter termed simply S1, and vibrational relaxation followed by slow (few picosecond) electron ejection from vibrationally cold S1. A more recent femtosecond TAS study by Tyson and Verlet14 found that 257 nm photoexcitation, between the first and second absorption bands (Fig. 1), generated e(aq)− on a fast, sub-picosecond, timescale that was comparable with typical charge-transfer-to-solvent (CTTS) processes in inorganic anions. They concluded that the fast electron ejection was from vibrationally hot S1 and, to explain the difference between their observations and those of Chen et al.,12 proposed a Marcus model in which e(aq)− were formed via a tunnelling mechanism. We were curious as to why electron detachment from higher lying S1n(1nπ*) and S2(2ππ*) states, hereafter termed simply S1n and S2, had not been considered. This led us to undertake a systematic femtosecond TAS study of the photooxidation dynamics of aqueous phenolate following photoexcitation at a range of wavelengths, from the onset of the S0–S1 absorption band to the peak of the S0–S2 band, complemented by liquid-microjet photoelectron spectroscopy (LJ-PES) measurements and high-level quantum chemistry calculations.
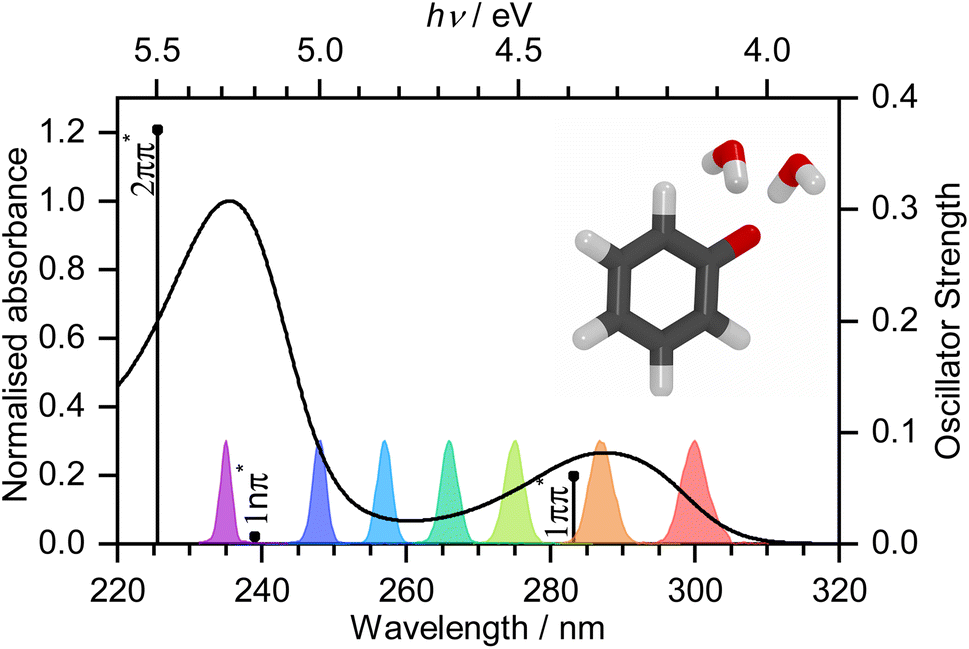 | ||
| Fig. 1 UV-vis spectrum of 20 mM aqueous solution of phenolate. Vertical lines mark XMCQDPT2/SA(7)-CASSCF(10,8)/(aug)-cc-pVDZ//EFP calculated vertical excitation energies (VEEs) with heights proportional to oscillator strengths. Gaussians mark the spectral profiles of the femtosecond pump pulses employed in the work reported here. Inset: PBE0/(aug)-cc-pVDZ//EFP(1043) equilibrium geometry of PhO− + 2H2O. | ||
2 Experimental and computational methods
2.1 Experimental methods
Phenol was purchased (≥99%, Sigma-Aldrich) and used without further purification. Steady state UV-visible absorption spectra of aqueous phenolate were recorded using a PerkinElmer LAMBDA 365 spectrophotometer. Femtosecond laser spectroscopy experiments employed laser pulses derived from a regenerative amplifier seeded by a Ti:sapphire oscillator (Coherent Astrella-HE-USP). Tuneable laser pulses were obtained using optical parametric amplifiers (OPAs; Coherent OPerA Solo).The TA spectra were recorded using a commercial transient absorption spectrometer (Ultrafast Systems Helios Fire) following photoexcitation at seven pump wavelengths over the range 300–235 nm (4.13–5.28 eV). The UV pump beam was generated from one OPA and was attenuated to achieve a pulse energy of around 100 nJ at the sample. The broadband probe beam was created via white-light generation by focussing the 800 nm fundamental beam into a sapphire (visible) or calcium fluoride (UV) plate, giving a combined probe range spanning 350–720 nm. The relative polarisations of the pump and probe beam were set at the magic angle 54.7° to suppress polarisation effects. Solutions of 20 mM aqueous phenolate were prepared from aqueous phenol with concentrated sodium hydroxide solution added to achieve pH 13. The phenolate sample was flowed continuously at 10 mL min−1 through a Harrick cell with a 100 μm path length using a liquid diaphragm pump (KNF, Simdos 02). The instrument response function was determined at each pump wavelength using a fit to solvent-only spectra (Fig. S1†).
Photoelectron spectra of aqueous phenolate were recorded using our liquid microjet photoelectron spectrometer that has been described in detail elsewhere.15 Solutions of aqueous phenolate were prepared by addition of 0.1 mM phenol to ∼2 mM NaOH solution; all solutions were made up with pure water (resistivity >15 MΩ cm−1). The NaOH concentration was adjusted slightly to flatten the potential in the interaction region of the spectrometer,16 with complete formation of the phenolate anion verified by UV-visible absorption spectroscopy. Aqueous phenolate solution was passed into the spectrometer by a high-performance liquid-chromatography pump, operating with backing pressures ∼70 bar. The resulting microjet had a nominal diameter of 20 μm at a flow rate of 0.7 mL min−1. The solution was intersected with femtosecond pulses of ultraviolet light around 2 mm downstream from the liquid microjet nozzle and the resulting photoelectrons were guided by a strong inhomogeneous magnetic field into the time-of-flight region. The interaction region was around 1 mm from the skimmer, and the polarisation of the laser light was parallel to the time-of-flight axis. Photoelectron spectra of NO and Xe were recorded to measure the instrument function, potential gradient in the interaction region, and the vacuum level offset between the interaction region and the analyser.1,17
2.2 Computational details
The structure of aqueous phenolate was constructed as a single molecule placed at the centre of a large box of water molecules with a length of 100 Å. Initially, molecular dynamics (MD) simulations were performed with NAMD.18 The CHARMM force field parameters were used to describe the solute,19 and the water molecules were described with the modified TIP3P parameters.20,21 The system was optimised for 5000 steps and MD simulations were carried out with an integration step of 1 fs for 2 ns. Periodic boundary conditions were applied during room-temperature simulations using the NVT ensemble. The system was gradually cooled down to 20 K in steps of 1 K during 560 ps to get a representative lowest-energy minimum on the multidimensional ground-state potential energy surface. The final MD geometry was obtained by performing geometry optimization for an additional 10![[thin space (1/6-em)]](https://www.rsc.org/images/entities/char_2009.gif) 000 steps. The structure was then reduced in size by cutting it into a sphere of a radius of 17 Å with ∼1000 water molecules for subsequent quantum chemistry calculations coupled to the Effective Fragment Potential method (EFP).22 The quantum (QM) part included phenolate and two water molecules, which were hydrogen-bonded to the chromophore, while all other water molecules were treated as EFPs. The structure was optimized using the PBE0 (ref. 23 and 24)/(aug)-cc-pVDZ25//EFP method with diffuse functions affixed to the oxygen atoms. The optimized structure was used for calculating vertical excitation energies (VEEs) in the phenolate anion and its radical in their ground electronic states at the equilibrium geometry of the anion as well as their transient absorption from the S1, D0, and D1 states.
000 steps. The structure was then reduced in size by cutting it into a sphere of a radius of 17 Å with ∼1000 water molecules for subsequent quantum chemistry calculations coupled to the Effective Fragment Potential method (EFP).22 The quantum (QM) part included phenolate and two water molecules, which were hydrogen-bonded to the chromophore, while all other water molecules were treated as EFPs. The structure was optimized using the PBE0 (ref. 23 and 24)/(aug)-cc-pVDZ25//EFP method with diffuse functions affixed to the oxygen atoms. The optimized structure was used for calculating vertical excitation energies (VEEs) in the phenolate anion and its radical in their ground electronic states at the equilibrium geometry of the anion as well as their transient absorption from the S1, D0, and D1 states.
The VEEs of aqueous phenolate were calculated using the extended multi-configuration quasi-degenerate perturbation theory, XMCQDPT2,26,27 combined with the EFP method. The zeroth-order wave functions were constructed using the state-averaged complete active space self-consistent field method, SA-CASSCF. The active space included all valence π and π* orbitals as well as the n-orbital located at the oxygen atom. The XMCQDPT2 calculations employed a one-particle DFT/PBE0-based Fock matrix to obtain energies of all CASSCF semi-canonical orbitals.
The optimized structure of PhO− + 2H2O inside the water sphere of 1043 EFPs was also used in large-scale hybrid calculations of the first vertical detachment energy (D0 VDE) of aqueous phenolate. A series of structures of increasing size with additional outer-shell water molecules was constructed to test convergence of the calculated VDE with respect to the system size. The fully optimized QM/EFP system was additionally solvated with a large box of water molecules with a length of 100 Å. MD simulations with periodic boundary conditions were performed with the QM/EFP core kept frozen. The same MD protocol was used as in the initial MD step. Following equilibration, the system was slowly cooled down and then optimized. The final structure was cut into smaller-sized systems, with distances from water molecules to the chromophore ranging from 10 Å to 40 Å. The VDEs were calculated at the PBE0/(aug)-cc-pVDZ//EFP level of theory as a difference in energy between the chromophore anion and its neutral radical. Both the inner and outer water shells were treated as EFPs in these calculations. The calculated VDE reached a converged value of 7.3 eV for a system with ∼11250 water molecules. This value was further validated by high-level XMCQDPT2/SA(10)-CASSCF(8,8)/(aug)-cc-pVDZ+//EFP calculations, with both detached and valence states of the anion being treated simultaneously using a state-averaging procedure. The computational details are described elsewhere.1 All XMCQDPT2/EFP calculations were performed omitting the fragment polarization term, thus only allowing the QM electron density to be polarized in the field of effective fragments. The solvent response was calculated separately in a fully self-consistent manner at the PBE0/EFP level of theory and used as a correction to the XMCQDPT2/EFP results.
The electronic structure theory calculations were performed within the Firefly computational package,27 which is partially based on the GAMESS (US) source code.28
3 Results and discussion
Transient absorption maps of 20 mM aqueous phenolate following photoexcitation at seven pump wavelengths in the range 300–235 nm are presented in Fig. S2–S8.†Fig. 2 shows the transient absorption spectra at different pump-probe delays following photoexcitation at the maxima of the S0–S1 and S0–S2 absorption bands, at 287 nm and 235 nm, respectively. Following photoexcitation of S1 at 287 nm, an absorption band centered around 540 nm appears, effectively instantaneously. The spectral profile changes substantially between 1 ps and 10 ps to reveal a broad absorption band centered near 700 nm, which decreases in intensity between 10 ps and 1 ns without significantly changing its spectral profile. From the work of Chen et al.,12 we can assign the feature around 540 nm to an excited state absorption (ESA) of the phenolate S1 state, and the broad absorption around 700 nm is characteristic of e(aq)−. Our XMCQDPT2/SA(15)-CASSCF(10,8)/(aug)-cc-pVDZ//EFP calculations support this assignment. In the visible region, the most bright vertical transition from S1 is located at 547 nm with an oscillator strength of 0.07 and corresponds to S3 excitation. In contrast, following photoexcitation of S2 at 235 nm, the e(aq)− absorption spectrum appears effectively instantaneously and starts decreasing rapidly after around 1 ps. There is no evidence of S1 ESA.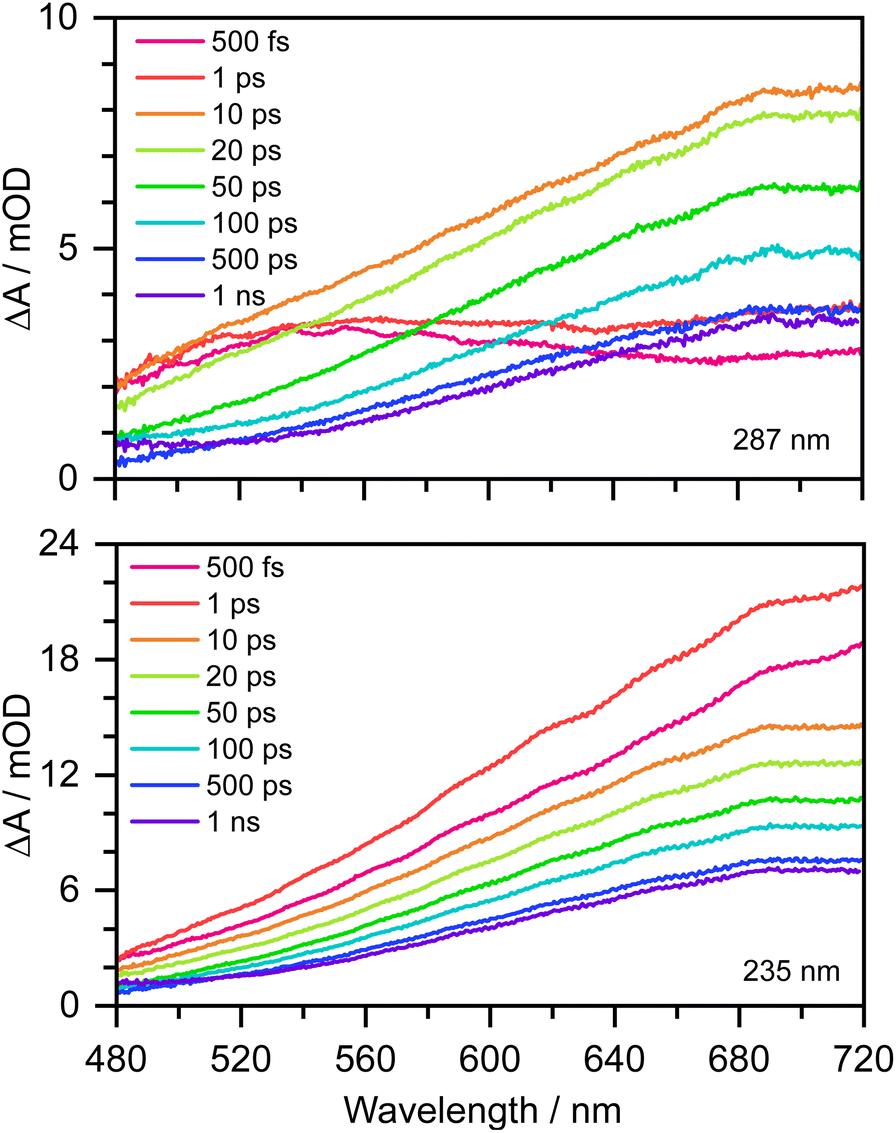 | ||
| Fig. 2 480–720 nm transient absorption spectra of 20 mM aqueous phenolate at displayed pump-probe delays following photoexcitation at 287 nm (top) and 235 nm (bottom). The broad absorption centered around 700 nm is attributed to solvated electrons and the absorption feature with a peak around 540 nm is attributed to the S1 state of phenolate.12 | ||
Fig. 3 shows normalised kinetic traces of 20 mM aqueous phenolate at 540 nm (the S1 ESA) and 700 nm (e(aq)− absorption) following photoexcitation at seven wavelengths, from the origin of the S0–S1 absorption band at 300 nm, to the peak of the S0–S2 band at 235 nm, including the wavelengths employed in the earlier femtosecond TAS studies (266 nm and 257 nm).12,14 Kinetic traces before normalisation are presented in Fig. S9.† Even though the spectral profiles associated with S1 and e(aq)− extend over the full probe range (350–720 nm), their relative contributions to the transient absorption spectra can be deconvoluted due to their substantially different spectral profiles.
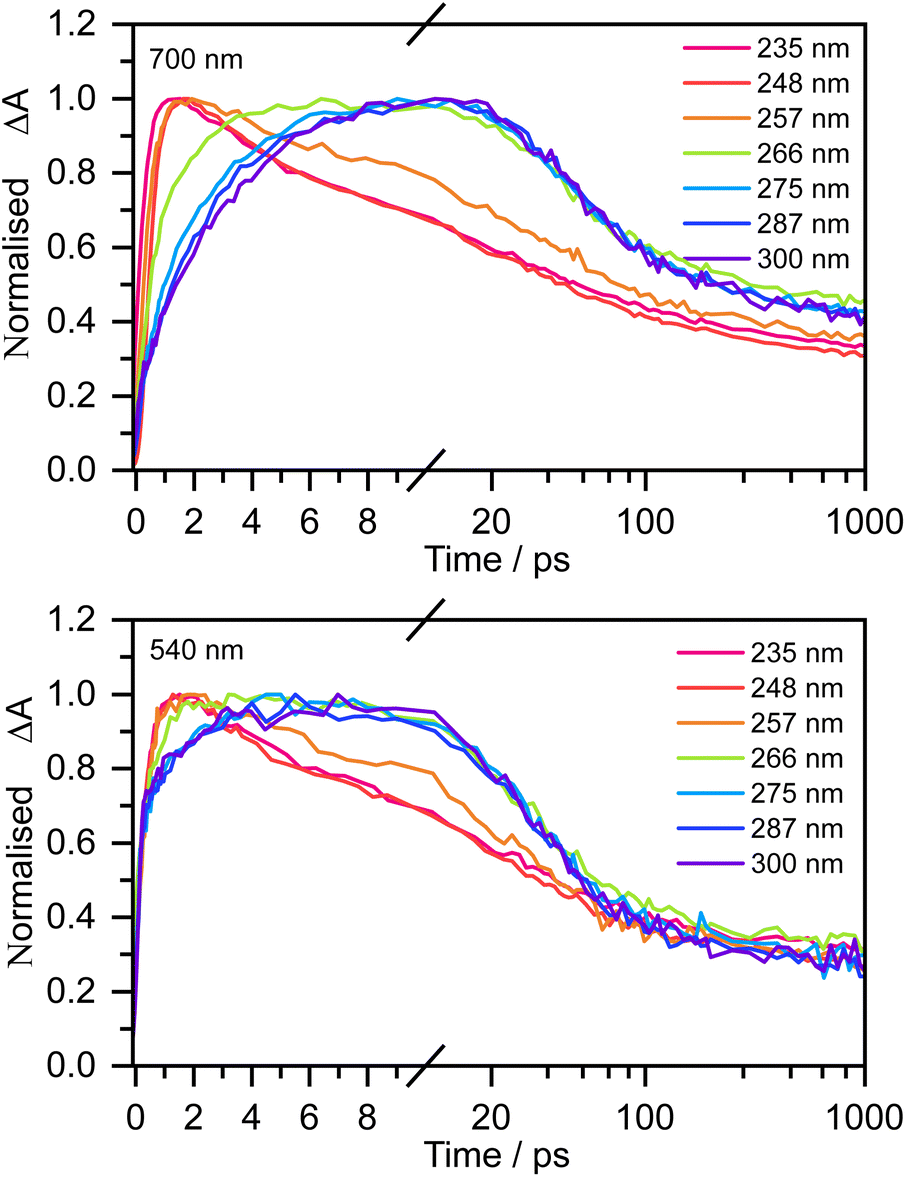 | ||
| Fig. 3 Kinetic traces of the transient absorption spectra of 20 mM aqueous phenolate at a probe wavelength of 700 nm (top) and 540 nm (bottom) and displayed pump wavelengths. Data have been normalised to maximum ΔA. | ||
The 700 nm kinetic traces show that e(aq)− formation is more rapid following photoexcitation of S2 (λ ≤ 248 nm) compared to photoexcitation of S1 (λ ≥ 266 nm). It is also clear that there are two distinct timescales for e(aq)− formation following photoexcitation of S1: an initial few picosecond rise followed by a slower approximately 20 ps rise matching the fluorescence lifetime of S1 recorded by Chen et al.12 Interestingly, the timescales for e(aq)− decay also appear to depend on the photoexcitation wavelength: following photoexcitation of S2, the e(aq)− absorbance begins to decay within a few picoseconds, whereas following photoexcitation of S1, the absorbance only begins to decay after around 10 ps.
The 540 nm kinetic traces are also dependent on photoexcitation wavelength. Following photoexcitation with λ ≤ 248 nm, the 540 nm kinetic traces are virtually identical to the 700 nm kinetic traces. In contrast, following photoexcitation of S1 (λ ≥ 266 nm), the 540 nm transient absorption appears effectively instantaneously, then after a few picoseconds it begins to resemble the 700 nm transient absorption.
For 257 nm photoexcitation, it is clear from the 700 nm kinetic trace that there is a slower decay component in the 2–20 ps region that is characteristic of the S1 relaxation dynamics, and that the long time dynamics (100–1000 ps) has a contribution from the slower decay characteristic of S1. The contribution of S1 is confirmed by comparing kinetic traces at probe wavelengths of 515 and 680 nm (Fig. S16†).
Time constants obtained from fits to the transient absorption spectra at the six pump wavelengths corresponding to photoexcitation of either S1 (λ ≥ 266 nm) or S2 (λ ≤ 248 nm) are listed in Table 1. Following photoexcitation of S1, the spectra were fit using a procedure based on that employed by Chen et al.12 Following photoexcitation of S2, the spectra were best fit with four exponentials (one rise and three decays). Both fitting procedures are described in the ESI (Fig. S10–S16†). Photoexcitation at 257 nm is more complex and will be discussed later.
 is the timescale of e(aq)− formation from directly populated ‘hot’ S1 or S2 and τS1→e−(aq) is the timescale of e(aq)− formation from ‘cold’ S1. τr1, τr2 and τr3 describe the decay of e(aq)− by geminate recombination
| λ pump/nm | τ instr |
|
τ S1→e−(aq) | τ r1 | τ r2 | τ r3 |
|---|---|---|---|---|---|---|
| 235 | 0.4 | 0.4 ± 0.2 | 6.6 ± 0.4 | 99 ± 9 | >1000 | |
| 248 | 0.4 | 0.4 ± 0.3 | 6.2 ± 0.5 | 90 ± 8 | >1000 | |
| 266 | 0.4 | 1.02 ± 0.03 | 25 ± 1 | 36 ± 6 | 210 ± 50 | |
| 275 | 0.4 | 2.3 ± 0.1 | 23 ± 0.8 | 54 ± 5 | 550 ± 300 | |
| 287 | 0.3 | 2.6 ± 0.1 | 23 ± 1 | 50 ± 3 | 490 ± 200 | |
| 300 | 0.3 | 3.5 ± 0.1 | 21 ± 0.8 | 52 ± 4 | >1000 |

The time constants show that following photoexcitation to S1 (λ ≥ 266 nm), solvated electrons are formed on both few-picosecond and ∼20 ps timescales ( and τS1→e−(aq), respectively). This is consistent with the earlier assignment of two timescales to fast electron ejection from vibrationally hot S1, and vibrational relaxation followed by slower electron ejection from vibrationally cold S1.12 Following photoexcitation at 300 nm, close to the bottom of the well, the slow electron emission occurs on a timescale of 21 ± 0.8 ps which is very similar to the fluorescence lifetime of S1 measured by Chen et al.12 (22 ± 2 ps). In contrast, following photoexcitation to S2 (λ ≤ 248 nm), solvated electrons are formed on a sub-picosecond timescale and there is no evidence of the slower electron formation associated with relaxation to vibrationally cold S1. A similar observation was reported by Tyson and Verlet following photoexcitation at 257 nm.14
Following photoexcitation to S1 with λ in the range 287–266 nm, the e(aq)− decays are best described by fitting with two exponential decays, τr1 and τr2. Although geminate recombination is a complex process, and fitting exponentials only estimates the timescales, the τr1 timescales obtained from our fits are of the same order of magnitude as the faster recombination timescale observed in the earlier 266 nm TAS measurement (50 ps).12 It is worth noting that the e(aq)− absorbance does not decay to zero within our experimental window of 1 ns. Interestingly, we found that following photoexcitation at 300 nm, τr2 > 1000 ps, which is longer than our experimental window and thus has a large associated error (ESI†). Following photoexcitation to S2 (248 and 235 nm), the e(aq)− decays are best described by fitting with three exponential decays, τr1, τr2 and τr3. The last of these has a timescale longer than that of our experimental window of 1 ns. τr1 and τr2 are noticeably shorter than the equivalent timescales observed following photoexcitation of S1. This suggests that the PhO˙ radical could be formed in a higher lying electronically excited state, where recombination would be expected to be faster since the corresponding electron would have less kinetic energy, following photoexcitation at 248 and 235 nm compared to photoexcitation at λ ≥ 266 nm.
It is interesting to note that the fast time constant,  , decreases following S1 photoexcitation from 300–266 nm. The decrease is most marked between 275 and 266 nm, which could suggest that there is some contribution from the S2 state at 266 nm. However, the long time dynamics (100–1000 ps) in the 700 nm kinetic trace for 266 nm photoexcitation follows that of S1 and there is no noticeable contribution from S2. Therefore, we attribute this decrease in the fast time constant to increasing vibrational energy in S1. In the Marcus picture,14 the tunnelling rate from S1 to the contact pair is very sensitive to barrier height and width, so the marked decrease in fast time constant between 275 and 266 nm photoexcitation could be because 266 nm excites close to the top of the barrier.
At 257 nm, simultaneous photoexcitation of S1 and S2 makes it difficult to separate the contributions from the S1 and S2 photooxidation mechanisms. The presence of the S1 ESA (Fig. S16†) as well as the faster electron formation time (consistent with the 257 nm TAS measurements reported by Tyson and Verlet14) and faster electron recombination time, confirm that 257 nm photoexcitation populates both S1 and S2.
To determine which photodetachment continua are accessible from the different electronically excited states of phenolate accessed in our measurements, we recorded photoelectron spectra following 1 + 1 resonance-enhanced photodetachment of aqueous phenolate at 285 nm (via S1), 236 nm (via S2), and 266 and 257 nm (wavelengths employed in the earlier TAS studies12,14). The spectra are plotted as a function of electron kinetic energy (eKE) in Fig. 4. The measured spectra are slightly distorted as a result of inelastic scattering of the photoelectrons in liquid water,16,17,29,30 so the true photoelectron spectra were retrieved using the algorithm described in ref. 31 and are overlaid on the measured spectra, in red. The photoelectron spectra obtained following photoexcitation at 285 nm (close to the peak of the S0–S1 absorption band) and 266 nm, correspond to resonance-enhanced detachment via S1 and are best fit by single Gaussians. In contrast, the broader spectra obtained following photoexcitation at 236 nm (close to the peak of the S0–S2 absorption band) and 257 nm, are best fit by three Gaussians (Fig. S17 and Table S1†). The increased broadening and number of Gaussians required to fit the two shorter wavelength photoelectron spectra compared to the two longer wavelength photoelectron spectra, indicates that higher lying electronically excited states of phenolate are accessible at 257 nm as well as 236 nm, and that these may be coupled to solvated electron continua associated with higher lying electronic states of the PhO˙ radical, supporting our interpretation of the different timescales for geminate recombination observed in our femtosecond TAS measurements.
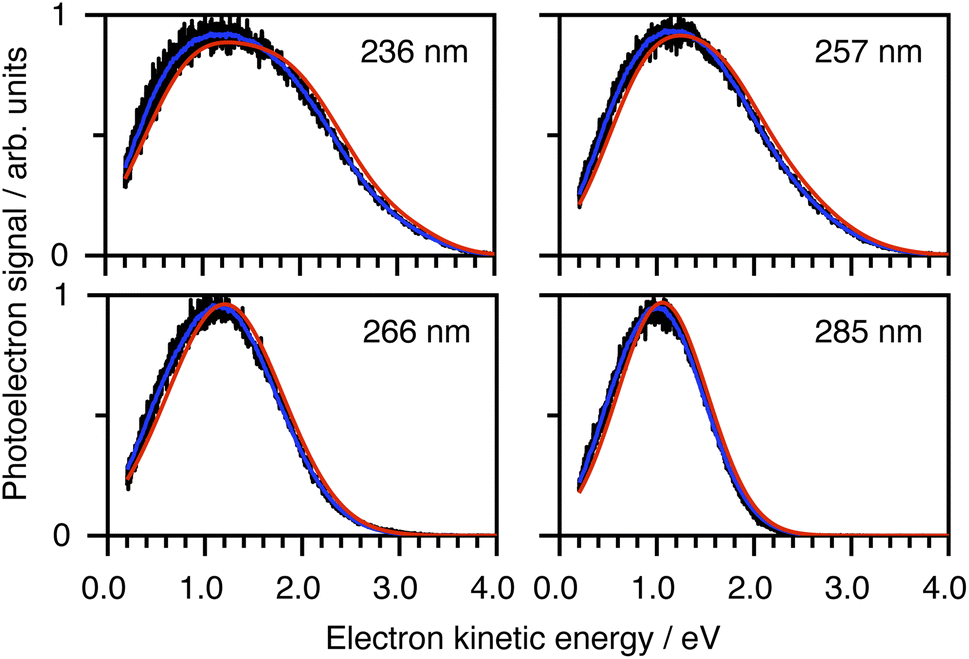 | ||
| Fig. 4 Resonance-enhanced 1 + 1 photoelectron spectra (PES) of aqueous phenolate at 236, 257, 266 and 285 nm (black) together with retrieved true PES (solid red lines).31 The 285 nm spectrum is adapted according to CC-BY license from ref. 31. Copyright 2022 the authors. Published by American Chemical Society under a Creative Commons CC BY 4.0 license. | ||
To determine which resonance-enhanced photodetachment pathways are accessible energetically, we carried out high-level quantum chemistry calculations of the electronic structure of the singlet states of PhO− and doublet states of PhO˙ (Fig. 5). Using Koopmans' arguments, we are able to determine that S0 is most likely to detach to D0 and D1n, S1 to D0, S1n to D1n, and S2 to D0, D1 and D2. Thus, it is clear that the peaks which are modelled well with single Gaussian functions in the 285 and 266 nm photoelectron spectra correspond to S1–D0 detachment. The situation is more complicated for the 236 and 257 nm photoelectron spectra, as their lineshapes could only be satisfactorily reproduced using a linear combination of Gaussian functions. The high eKE tails of both spectra lie at similar two-photon binding energies close to the D0 binding energy, suggesting that all four spectra contain contributions from detachment to D0. The 236 nm photoelectron spectrum likely has contributions from resonance-enhanced photodetachment via S2 to D0, D1 and D2, although we cannot rule out ultrafast internal conversion to S1 followed by photodetachment to D1. The 257 nm photoelectron spectrum likely has contributions from excitation of both S1 and S2, as discussed above. A detailed analysis of the photoelectron spectra of aqueous phenolate at a wide range of photon energies will be reported in a future publication.
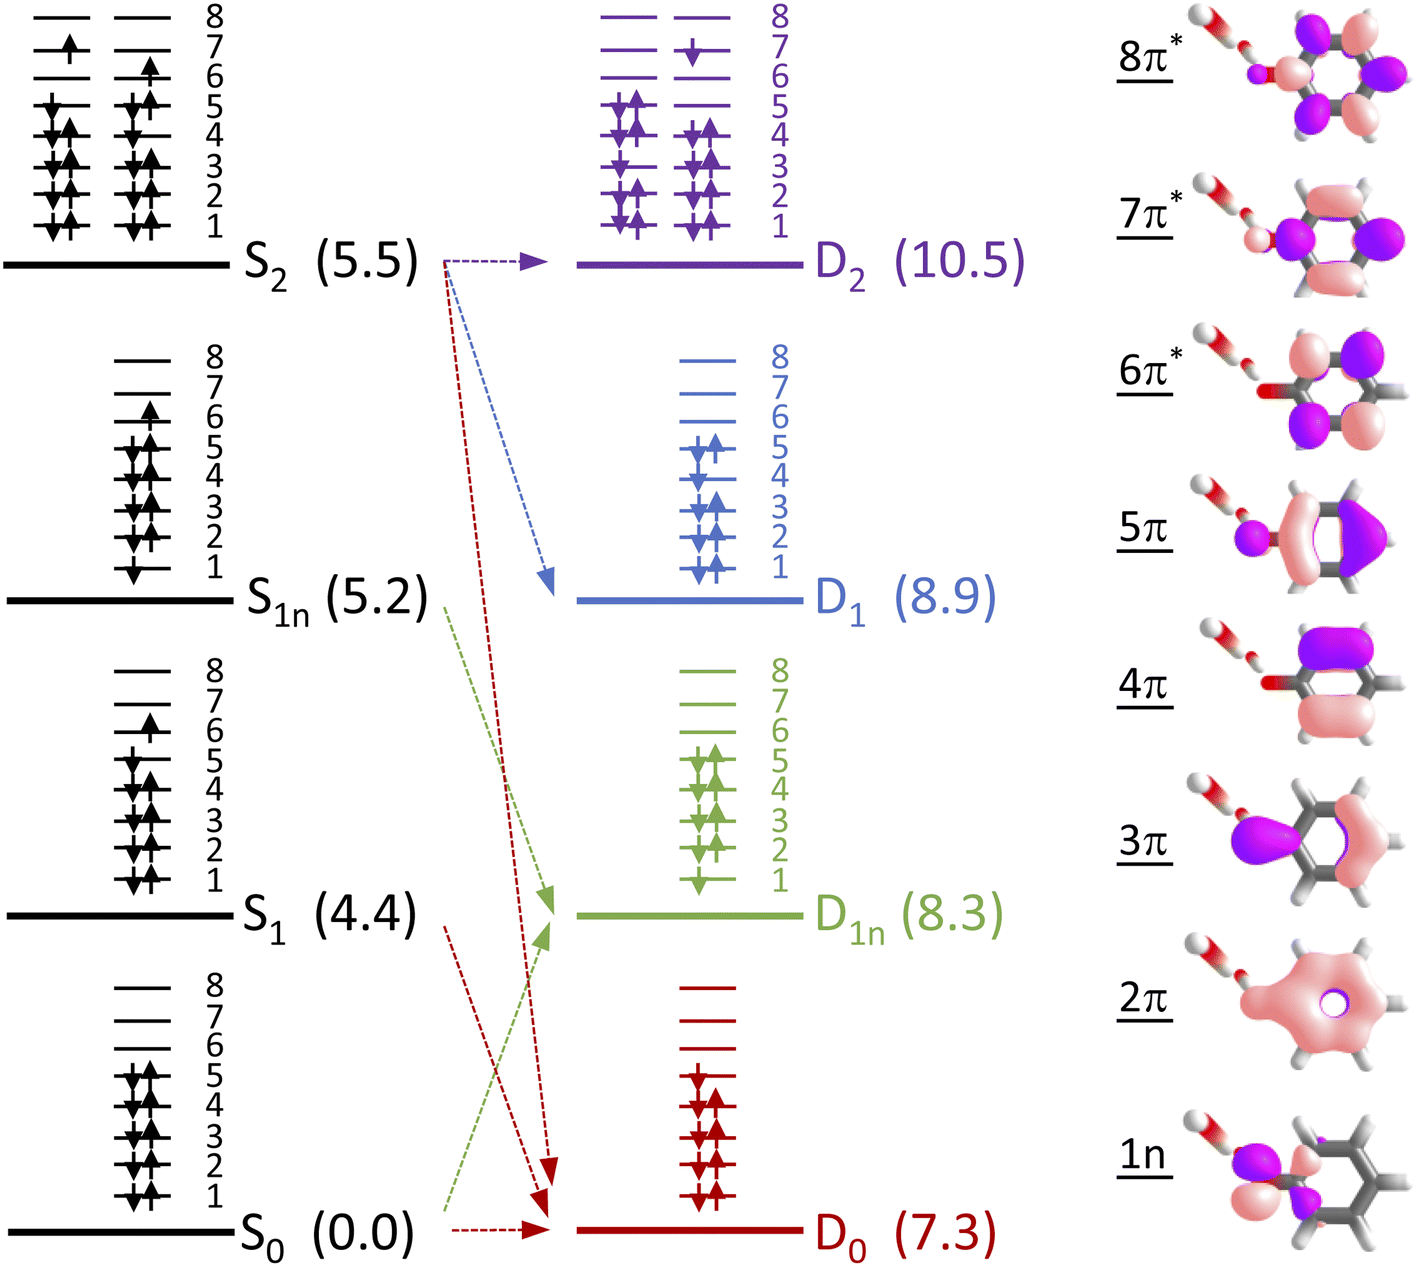 | ||
| Fig. 5 Electronic configurations of the four lowest singlet electronic states of phenolate and four lowest doublet electronic states of the corresponding radical in aqueous solution. Numbers in brackets refer to XMCQDPT2/SA(7)-CASSCF(10,8)/(aug)-cc-pVDZ//EFP and XMCQDPT2/SA(7)-CASSCF(9,8)/(aug)-cc-pVDZ//EFP calculated vertical excitation and vertical detachment energies in eV, relative to S0. Arrows highlight possible electron detachment processes. Also shown are the SA(7)-CASSCF(10,8) natural orbitals. | ||
Having explored which photodetachment pathways are accessible from the different electronically excited states, and knowing that the binding energy of the solvated electron is between 3.7 and 3.8 eV,29,32 we can explore which photooxidation pathways might be accessible (Fig. 6). The S1 state is presumably coupled to the solvated electron continuum associated with the PhO˙ radical in the D0 state, and the S2 state is likely coupled with the continua associated with the PhO˙ radical in the D0 and D1 states. Although Tyson and Verlet suggested that it was not possible to access a higher lying detachment continuum following photoexcitation at 257 nm, based on our calculations and the second vertical detachment energy of phenolate reported in ref. 33, we find that it is possible to access the D1 continuum from S2 following 257 nm photoexcitation. Thus, having determined the possible photooxidation pathways, and observed that higher lying detachment continua may be accessible following 1 + 1 photodetachment at 257 and 236 nm, we conclude that the faster timescale observed for electron recombination following photoexcitation at λ ≤ 257 nm could be the result of the PhO˙ radical being formed in an excited electronic state.
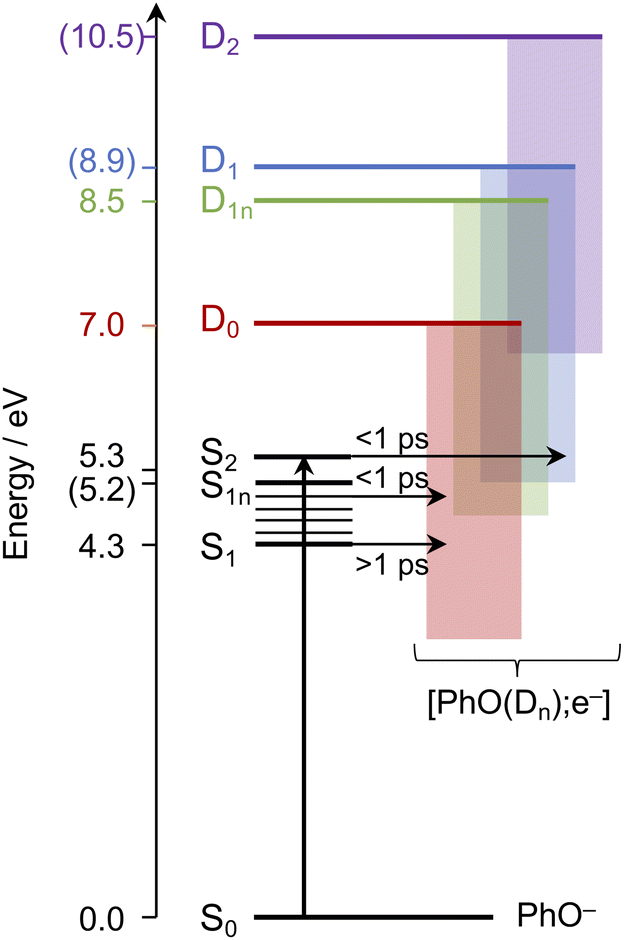 | ||
| Fig. 6 Schematic energy level diagram illustrating the different photooxidation pathways and timescales following photoexcitation of the S1, S1n and S2 electronically excited states of phenolate in aqueous solution. Numbers not in parentheses are λmax (in eV) from the UV-vis spectrum presented in Fig. 1 and VDEs obtained from UV (D0) and X-ray (D1n) liquid-jet photoelectron spectroscopy measurements.31,33 Numbers in parentheses are the calculated VEEs and VDEs presented in Fig. 5. Horizontal arrows represent coupling of S2, hot S1 and cold S1 to the different solvated electron continua (shaded blocks) with representative timescales (see text). | ||
To confirm this, as Chen et al. observed the formation of the PhO˙ radical in its D0 state between 330 and 400 nm,12 we recorded the 350–450 nm transient absorption spectrum of aqueous phenolate following photoexcitation at 235 nm to see whether we could find direct evidence of the formation of the PhO˙ radical in a higher lying state (Fig. 7). In addition to the structured band system between 350 and 400 nm reported by Chen et al., we observe an additional peak around 427 nm and a shoulder on the longer wavelength edge of the peak around 400 nm. These additional features decay on a subpicosecond timescale and are not observed in the 350–450 nm transient absorption spectrum of aqueous phenolate following photoexcitation at 287 nm (Fig. 7). Similar features were observed for aqueous phenol following excitation at 200 nm and the small peak at 427 nm was assigned to the phenol radical cation.34 Such an assignment would not be consistent with our measurements as they were carried out at pH 13. Instead, we attribute the weak transient absorption around 427 nm to absorption of an excited electronic state of the PhO˙ radical, slightly red-shifted from the absorption band attributed to the radical in its ground electronic state. This is supported by our XMCQDPT2/SA(15)-CASSCF(9,8)/(aug)-cc-pVDZ//EFP calculations which show that in this region, the most bright D1 → D3 vertical transition is at 411 nm with an oscillator strength of 0.06, red-shifted from the most bright D0 → D2 transition located at 386 nm with an oscillator strength of 0.1. This is consistent with the earlier observation of this feature, as photolysis of phenol at 200 nm could generate phenoxy radicals in the D1 state.34 The shoulder on the long wavelength side of the 400 nm feature may arise from vibrational structure associated with the 427 nm feature or to hot/combination bands of the radical ground-state absorption. These UV TAS spectra reinforce our conclusion that photoexcitation at shorter wavelengths generates PhO˙ radicals in higher lying states that undergo more rapid geminate recombination than the PhO˙ radical in its ground electronic state.
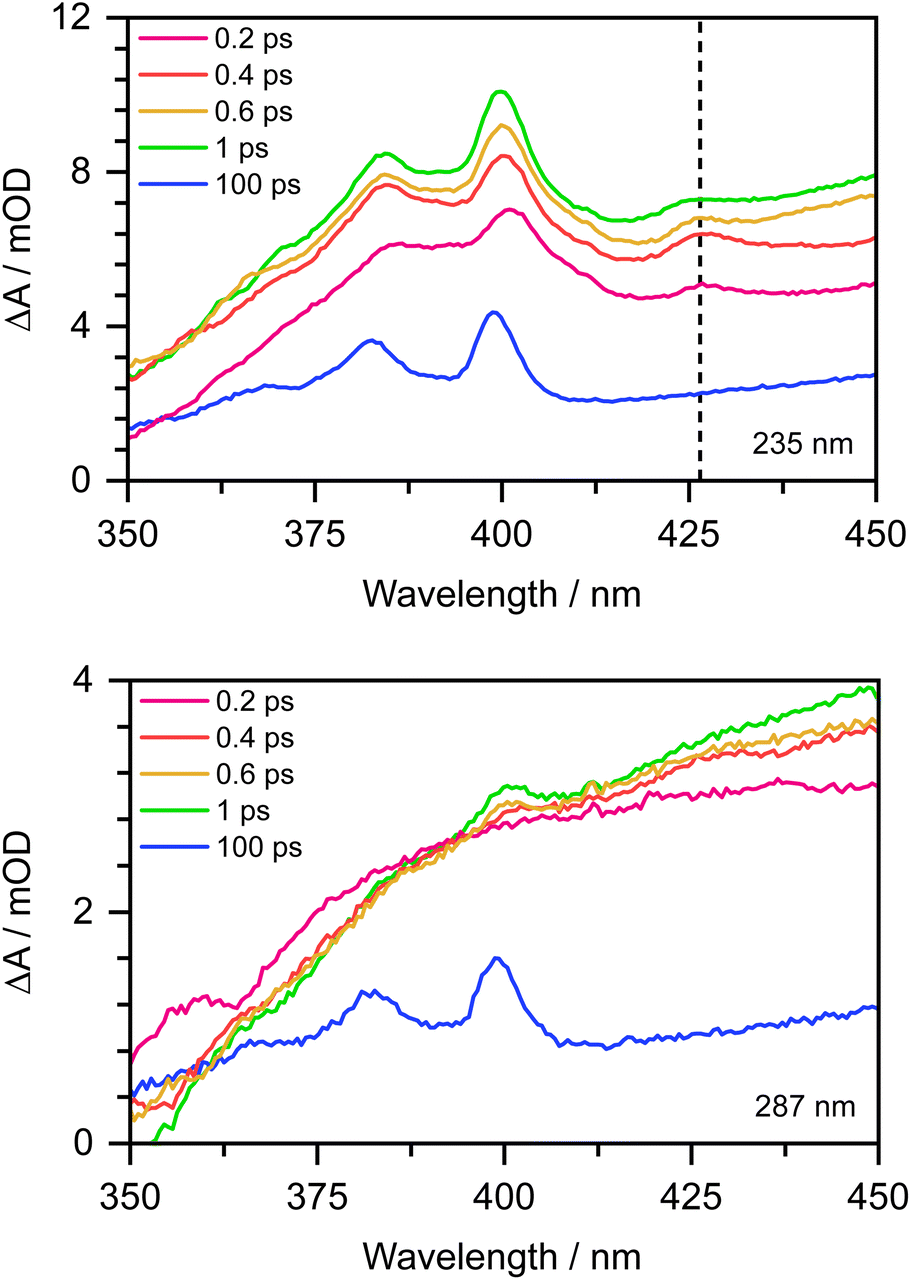 | ||
| Fig. 7 350–450 nm transient absorption spectra of 20 mM aqueous phenolate at displayed pump-probe delays following photoexcitation at 235 nm (top) and 287 nm (bottom). The dashed vertical highlights the peak at 427 nm described in the main text. | ||
4 Conclusions
In summary, by using a combination of femtosecond TAS, liquid-microjet photoelectron spectroscopy and quantum chemistry calculations, we have unravelled the wavelength dependant mechanism for phenolate photooxidation. We find that for λ ≥ 266 nm, electron ejection occurs from the S1 state into the continuum associated with the [PhO˙(D0); e−] contact pair, with timescales that support the competing pathway mechanism proposed by Chen et al.12 For λ ≤ 248 nm, electron ejection occurs from a higher lying electronically excited state into continua associated with contact pairs in which PhO˙ radicals are also formed in electronically excited states. These contact pairs have faster recombination timescales than the [PhO˙(D0); e−] contact pair. We found that photoexcitation at 257 nm populated both S1 and S2, and we propose that the fast electron ejection process previously attributed to tunnelling14 actually arises from S2.Understanding the mechanism of phenolate photooxidation following photoexcitation of higher lying excited electronic states is directly relevant to the photooxidation of protein chromophores since the higher lying electronically excited states of both GFP and PYP chromophores have been implicated in the formation of solvated electrons.1,35–37 To the best of our knowledge this work represents one of the first direct observations of photooxidation of an organic chromophore in aqueous solution yielding an oxidised species in an electronically-excited state. The subsequent relaxation dynamics of such electronically-excited oxidised species represent an enticing target for future studies, particularly since chromophores containing phenolate motifs are ubiquitous in biology.
Author contributions
The project was conceived and supervised by H. H. F. The TAS data were recorded by J. A. D., with assistance from K. R., and processed, analysed and interpreted by K. R., with contributions from J. A. D. and M. S. The PES data were recorded by W. G. F., with assistance from O. T., and processed, analysed and interpreted by W. G. F., with assistance from M. S. Calculations were undertaken and interpreted by A. N. B. and A. V. B. The manuscript was written by K. R. and H. H. F. with contributions from A. V. B., W. G. F., M. S. and J. A. D. All authors read and approved the final version of the manuscript.Conflicts of interest
There are no conflicts to declare.Acknowledgements
This work was supported by the EPSRC (grants EP/T011637/1 and EP/V026690/1) and UCL. K. R. acknowledges studentship co-funding from Coherent Inc. Spectroscopy experiments were performed using the Ultrafast Laser Facility in the Department of Chemistry at UCL (EPSRC EP/T019182/1). A. N. B. and A. V. B. acknowledge support from RSF (grant no. 22-13-00126). Calculations were carried out using the equipment of the shared research facilities of HPC computing resources at Lomonosov Moscow State University and local resources provided through the Lomonosov Moscow State University Program of Development. The authors are grateful to Tom Oliver (Bristol) for valuable discussions about the interpretation of the TAS data.Notes and references
- O. Tau, A. Henley, A. N. Boichenko, N. N. Kleshchina, R. Riley, B. Wang, D. Winning, R. Lewin, I. P. Parkin and J. M. Ward, et al. , Nat. Commun., 2022, 13, 1–7 CrossRef PubMed.
- J. J. van Thor, Chem. Soc. Rev., 2009, 38, 2935–2950 RSC.
- A. Acharya, A. M. Bogdanov, B. L. Grigorenko, K. B. Bravaya, A. V. Nemukhin, K. A. Lukyanov and A. I. Krylov, Chem. Rev., 2017, 117, 758–795 CrossRef CAS PubMed.
- J. P. Hall, F. E. Poynton, P. M. Keane, S. P. Gurung, J. A. Brazier, D. J. Cardin, G. Winter, T. Gunnlaugsson, I. V. Sazanovich and M. Towrie, et al. , Nat. Chem., 2015, 7, 961–967 CrossRef CAS PubMed.
- E. Amouyal, A. Bernas, D. Grand and J.-C. Mialocq, Faraday Discuss. Chem. Soc., 1982, 74, 147–159 RSC.
- J. J. Snellenburg, S. P. Laptenok, R. J. DeSa, P. Naumov and K. M. Solntsev, J. Am. Chem. Soc., 2016, 138, 16252–16258 CrossRef CAS PubMed.
- A. Henley, A. M. Patel, M. A. Parkes, J. C. Anderson and H. H. Fielding, J. Phys. Chem. A, 2018, 122, 8222–8228 CrossRef CAS PubMed.
- J. L. Woodhouse, A. Henley, M. A. Parkes and H. H. Fielding, J. Phys. Chem. A, 2019, 123, 2709–2718 CrossRef CAS PubMed.
- Z. He, C. H. Martin, R. Birge and K. F. Freed, J. Phys. Chem. A, 2000, 104, 2939–2952 CrossRef CAS.
- J. H. Hanamoto, P. Dupuis and M. El-Sayed, Proc. Natl. Acad. Sci. U. S. A., 1984, 81, 7083–7087 CrossRef CAS PubMed.
- J.-C. Mialocq, J. Sutton and P. Goujon, Chem. Phys., 1980, 72, 6338–6345 CAS.
- X. Chen, D. S. Larsen, S. E. Bradforth and I. H. van Stokkum, J. Phys. Chem. A, 2011, 115, 3807–3819 CrossRef CAS PubMed.
- J. Peon, G. C. Hess, J.-M. L. Pecourt, T. Yuzawa and B. Kohler, J. Phys. Chem. A, 1999, 103, 2460–2466 CrossRef CAS.
- A. L. Tyson and J. R. Verlet, J. Phys. Chem. B, 2019, 123, 2373–2379 CrossRef CAS PubMed.
- J. W. Riley, B. Wang, M. A. Parkes and H. H. Fielding, Rev. Sci. Instrum., 2019, 90, 083104 CrossRef PubMed.
- W. G. Fortune, M. S. Scholz and H. H. Fielding, Acc. Chem. Res., 2022, 507–6895 Search PubMed.
- J. W. Riley, B. Wang, J. L. Woodhouse, M. Assmann, G. A. Worth and H. H. Fielding, J. Phys. Chem. Lett., 2018, 9, 678–682 CrossRef CAS PubMed.
- J. C. Phillips, R. Braun, W. Wang, J. Gumbart, E. Tajkhorshid, E. Villa, C. Chipot, R. D. Skeel, L. Kalé and K. Schulten, J. Comput. Chem., 2005, 26, 1781–1802 CrossRef CAS PubMed.
- N. Reuter, H. Lin and W. Thiel, J. Phys. Chem. B, 2002, 106, 6310–6321 CrossRef CAS.
- W. L. Jorgensen, J. Chandrasekhar, J. D. Madura, R. W. Impey and M. L. Klein, J. Chem. Phys., 1983, 79, 926–935 CrossRef CAS.
- D. J. Price and C. L. Brooks, J. Chem. Phys., 2004, 121, 10096–10103 CrossRef CAS PubMed.
- M. S. Gordon, D. G. Fedorov, S. R. Pruitt and L. V. Slipchenko, Chem. Rev., 2012, 112, 632–672 CrossRef CAS PubMed.
- J. P. Perdew, K. Burke and M. Ernzerhof, Phys. Rev. Lett., 1996, 77, 3865–3868 CrossRef CAS PubMed.
- C. Adamo and V. Barone, J. Chem. Phys., 1999, 110, 6158–6170 CrossRef CAS.
- R. A. Kendall, T. H. Dunning and R. J. Harrison, J. Chem. Phys., 1992, 96, 6796–6806 CrossRef CAS.
- A. A. Granovsky, J. Chem. Phys., 2011, 134, 214113 CrossRef PubMed.
- A. A. Granovsky, Firefly version 8.2.0, https://classic.chem.msu.su/gran/firefly Search PubMed.
- M. W. Schmidt, K. K. Baldridge, J. A. Boatz, S. T. Elbert, M. S. Gordon, J. H. Jensen, S. Koseki, N. Matsunaga, K. A. Nguyen, S. Su, T. L. Windus, M. Dupuis and J. A. Montgomery, J. Comput. Chem., 1993, 14, 1347–1363 CrossRef CAS.
- D. Luckhaus, Y.-i. Yamamoto, T. Suzuki and R. Signorell, Sci. Adv., 2017, 3, e1603224 CrossRef PubMed.
- J. Nishitani, Y.-i. Yamamoto, C. W. West, S. Karashima and T. Suzuki, Sci. Adv., 2019, 5, eaaw6896 CrossRef CAS PubMed.
- M. S. Scholz, W. G. Fortune, O. Tau and H. H. Fielding, J. Phys. Chem. Lett., 2022, 13, 6889–6895 CrossRef CAS PubMed.
- T. Suzuki, Chem. Phys., 2019, 151, 090901 Search PubMed.
- D. Ghosh, A. Roy, R. Seidel, B. Winter, S. Bradforth and A. I. Krylov, J. Phys. Chem. B, 2012, 116, 7269–7280 CrossRef CAS PubMed.
- T. A. Oliver, Y. Zhang, A. Roy, M. N. Ashfold and S. E. Bradforth, J. Phys. Chem. Lett., 2015, 6, 4159–4164 CrossRef CAS PubMed.
- A. V. Bochenkova, C. R. S. Mooney, M. A. Parkes, J. L. Woodhouse, L. Zhang, R. Lewin, J. M. Ward, H. C. Hailes, L. H. Andersen and H. H. Fielding, Chem. Sci., 2017, 8, 3154–3163 RSC.
- D. S. Larsen, M. Vengris, I. H. Van Stokkum, M. A. Van Der Horst, F. L. de Weerd, K. J. Hellingwerf and R. Van Grondelle, Biophys. J., 2004, 86, 2538–2550 CrossRef CAS PubMed.
- P. Changenet-Barret, P. Plaza and M. M. Martin, Chem. Phys. Lett., 2001, 336, 439–444 CrossRef CAS.
Footnote |
| † Electronic supplementary information (ESI) available. See DOI: https://doi.org/10.1039/d3sc00016h |
| This journal is © The Royal Society of Chemistry 2023 |