
 Open Access Article
 This Open Access Article is licensed under a Creative Commons Attribution-Non Commercial 3.0 Unported Licence
One-year post-exposure assessment of 14C-few-layer graphene biodistribution in mice: single versus repeated intratracheal administration†
Antoine
Sallustrau‡
 *a,
Mathilde
Keck‡
*b,
Peggy
Barbe
b,
Dominique
Georgin
a,
Nathalie
Fresneau
ca,
Stephane
Campidelli
c,
Baptiste
Pibaleau
d,
Mathieu
Pinault
d,
Martine
Mayne-L'Hermite
d,
Christine
Granotier-Beckers
ef,
Michel
Schlegel
g,
Viviana Jehová
González
h,
Ester
Vázquez
h,
Denis
Servent
b and
Frédéric
Taran
a
*a,
Mathilde
Keck‡
*b,
Peggy
Barbe
b,
Dominique
Georgin
a,
Nathalie
Fresneau
ca,
Stephane
Campidelli
c,
Baptiste
Pibaleau
d,
Mathieu
Pinault
d,
Martine
Mayne-L'Hermite
d,
Christine
Granotier-Beckers
ef,
Michel
Schlegel
g,
Viviana Jehová
González
h,
Ester
Vázquez
h,
Denis
Servent
b and
Frédéric
Taran
a
aUniversité Paris Saclay, CEA, INRAE, Département Médicaments et Technologies pour la Santé (DMTS), SCBM, 91191 Gif-sur-Yvette, France. E-mail: antoine.sallustrau@cea.fr
bUniversité Paris Saclay, CEA, INRAE, Département Médicaments et Technologies pour la Santé (DMTS), SIMos, 91191 Gif-sur-Yvette, France
cUniversité Paris-Saclay, CEA, CNRS, NIMBE, LICSEN, 91191 Gif-sur-Yvette, France
dUniversité Paris-Saclay, CEA, CNRS, NIMBE, LEDNA, 91191 Gif-sur-Yvette, France
eUniversité Paris Cité, Inserm, CEA, Stabilité Génétique Cellules Souches et Radiations/iRCM, 92265 Fontenay-aux-Roses, France
fUniversité Paris-Saclay, Inserm, CEA, Stabilité Génétique Cellules Souches et Radiations/iRCM, 92265 Fontenay-aux-Roses, France
gUniversité Paris Saclay, CEA, Service de Recherche en Matériaux et Procédés Avancés, 91191 Gif-sur-Yvette, France
hInstituto Regional de Investigación Científica Aplicada (IRICA), Universidad de Castilla-La Mancha, 13071Ciudad Real, Spain
First published on 11th October 2023
Abstract
Research on graphene-based nanomaterials has experienced exponential growth in the last few decades, driven by their unique properties and their future potential impact on our everyday life. With the increasing production and commercialization of these materials, there is significant interest in understanding their fate in vivo. Herein, we investigated the distribution of 14C-few-layer graphene (14C-FLG) flakes (lat. dim. ∼![[thin space (1/6-em)]](https://www.rsc.org/images/entities/char_2009.gif) 500 nm) in mice over a period of one year. Furthermore, we compared the effects of repeated low-dose and acute high-dose exposure by tracheal administration. The results showed that most of the radioactivity was found in the lungs in both cases, with longer elimination times in the case of acute high-dose administration. In order to gain deeper insights into the distribution pattern, we conducted ex vivo investigations using μ-autoradiography on tissue sections, revealing the heterogeneous distribution of the material following administration. For the first time, μ-autoradiography was used to conduct a comprehensive investigation into the distribution and potential presence of FLG within lung cells isolated from the exposed lungs. The presence of radioactivity in lung cells strongly suggests internalization of the 14C-FLG particles. Overall these results show the long-term accumulation of the material in the lungs over one year, regardless of the administration protocol, and the higher biopersistence of FLG in the case of an acute exposure. These findings highlight the importance of the exposure scenario in the context of intratracheal administration, which is of interest in the evaluation of the potential health risks of graphene-based nanomaterials.
500 nm) in mice over a period of one year. Furthermore, we compared the effects of repeated low-dose and acute high-dose exposure by tracheal administration. The results showed that most of the radioactivity was found in the lungs in both cases, with longer elimination times in the case of acute high-dose administration. In order to gain deeper insights into the distribution pattern, we conducted ex vivo investigations using μ-autoradiography on tissue sections, revealing the heterogeneous distribution of the material following administration. For the first time, μ-autoradiography was used to conduct a comprehensive investigation into the distribution and potential presence of FLG within lung cells isolated from the exposed lungs. The presence of radioactivity in lung cells strongly suggests internalization of the 14C-FLG particles. Overall these results show the long-term accumulation of the material in the lungs over one year, regardless of the administration protocol, and the higher biopersistence of FLG in the case of an acute exposure. These findings highlight the importance of the exposure scenario in the context of intratracheal administration, which is of interest in the evaluation of the potential health risks of graphene-based nanomaterials.
Introduction
Graphene based nanomaterials (GBN) have emerged as highly promising nanomaterials across a wide range of research fields.1 Due to their distinctive and unique properties such as chemical inertness, exceptional mechanical strength, high thermal conductivity, and excellent transmittance, GBN have shown great potential in diverse domains such as energy, electronics, photonics, sensors and biomedical applications.2 GBN can now be produced in large quantities, which has led to a significant boost in the development of graphene-based technologies,3 with market estimations expected to reach more than £1100 million by 2025.4 Given their increasing exploitation and the potential for both occupational and public exposure, the impact of GBN on health has become a significant concern.5 A recent example is the use of graphene-coated face masks produced and distributed all over the world to prevent COVID-19 transmission, which were withdrawn in some countries owing to their potential toxic effects on the respiratory tract.6–8 In this context, the assessment of their fate in vivo remains of great interest.Since graphene discovery by Novoselov et al.,9 many graphene related materials have been developed and in vivo studies have been conducted to assess their absorption, distribution, and excretion, mainly driven by their physicochemical properties (lateral dimensions, thickness, and carbon-to-oxygen ratio), their functionalization and the route of administration.10 However, when assessing the potential risks of GBN on human health, the respiratory system is considered as one of the most concerning routes of exposure.11 Following intranasal or tracheal instillation, previous studies have shown that GBN primarily accumulate in the lungs. Over time, signs of clearance can occur as GBN translocate to the blood, either directly from the lungs or through intestinal adsorption. Notably, in the case of tracheal administration, large amounts of the material could be detected in the stomach and intestines, potentially attributed to mechanisms such as mucociliary clearance, swallowing, and redistribution of inhaled GBN to the gastrointestinal tract.14,15 Furthermore, intranasal exposure investigations revealed that graphene oxide could be found in the brain and remain there for over 30 days, showing signs of biodegradation over time.12,13
Overall, when considering respiratory exposure, there is evidence that various GBN are able to cross physiological barriers, reaching distant secondary organs and showing in some cases severe lung toxicity.16 Noteworthily, most of these studies consider single-dose administration. Long-term in vivo studies exploring repeated dose administration are still scarce despite their high relevance when considering occupational exposure.17,18 In 2015, Shin et al. exposed rats to commercial graphene nanoplatelets (GNP) (lateral dimensions: ∼500 nm, thickness: 8 nm) through 5 day repeated exposure (6 h per day), using a nose-only inhalation system.19 The repeated exposure to GNP did not change neither the body weight nor the organ weight of the rats during the recovery period of 28 days. No signs of lung damage were noticed at any time point. In a second study, rats were exposed to GNP (lat. dim.: sizes up to 2 μm, thickness: 20–30 layers) for 6 h per day, 5 days per week, for 4 weeks.20 The animals were sacrificed at 1, 28, and 90 days after exposure. Inhaled materials were found in macrophages, with translocation also to lung lymph nodes, but without inducing any toxicity regardless of the dose applied. More recently, the same group studied repeated exposure of graphene oxide (GO) using the same nose-only inhalation exposure system over 5 days for 6 hours per day.21 Exposure impact was assessed at 1, 3 and 21 days by haematological and biochemical analyses and no significant toxic effects of graphene oxide were found. Recently, a reproductive toxicity study was carried out in male mice after the intratracheal instillation of commercial GO once a week for 7 weeks. The increased neutrophil number in the bronchoalveolar lavage fluid suggested pulmonary inflammation.22 In addition to their scarcity, these investigations used histopathological examination to provide distribution and toxicity evaluation. Undoubtedly, in vivo qualitative and quantitative biodistribution analysis of GBN represents a big challenge due to their carbon and oxygen composition, two elements also present as the major part of organic matter.
Radiolabelling has been used in numerous studies to investigate the biodistribution of GBN using tags such as 111In and 99mTc or 18F, 89Zr, and 68Ga in tandem with radio imaging techniques.23–28 These highly sensitive detection and quantification techniques allow the monitoring of very low concentrations of materials and the study of realistic environmental doses in vivo but require surface chemical modification that potentially alters the physicochemical properties of the material or may cause a loss of the tag during in vivo circulation. Direct incorporation of carbon isotopes (13C, 14C) into the backbone of carbon-based nanomaterials has proven to be a method of choice to overcome these limitations. Carbon-13 was recently used to structurally label FLG by González et al.29 in order to trace and quantify its distribution inside the different cellular compartments of HepG2 cells. 13C-labeling is indeed mostly used to study metabolic pathways or for the preparation of internal standards. Nevertheless, in the context of in vivo biodistribution investigations, the utilization of 14C radiolabelling, coupled with exceptionally sensitive detection and quantification techniques, is a reference as it allows following extremely low material concentrations (ranging from ng L−1 to μg L−1) and facilitates the examination of realistic environmental doses. Moreover, carbon-14 is considered in the pharmaceutical industry as one of the gold standards for absorption, distribution, metabolism, and excretion (ADME) studies due to its long half-life (5730 years), ideal for long-term distribution investigations. Our group recently used 14C-labeled GO to develop a tandem imaging technique combining digital autoradiography (β-imager) with mass spectrometry imaging (MSI), hence providing high resolution and quantitative assessment of its distribution in vivo.30 In 2013, a graphitized material was labelled with 14C to assess and measure its uptake and excretion in Daphnia magna.31 A year later, Czarny et al. conducted a study where carbon nanotubes (CNTs) were labelled with 14C, revealing their translocation across the air–blood barrier to distant organs.32 Recently, Lu et al.33 utilized 14C to study the fate of smaller size few layer graphene (FLG) (SLG, lat. dim.: 20–40 nm) and larger size FLG (LLG, lat. dim.: 330–630 nm) in mice over a one-year period after intravenous administration. Their findings demonstrated that liver cells were able to degrade larger 14C-FLG (LLG) into 14C–CO2. In addition to the typical quantification of radioactivity in collected organs, the researchers captured and quantified the exhaled 14C–CO2 after intravenous injection in mice.
Considering the need for long-term in vivo studies exploring repeated dose administration of GBN, we propose here the assessment of the distribution of FLG over one year, from the whole animal to the cellular level, using 14C radiolabelling to track the material and compare repeated low dose exposure against single acute dose exposure after intratracheal administration in mice (Fig. 1).
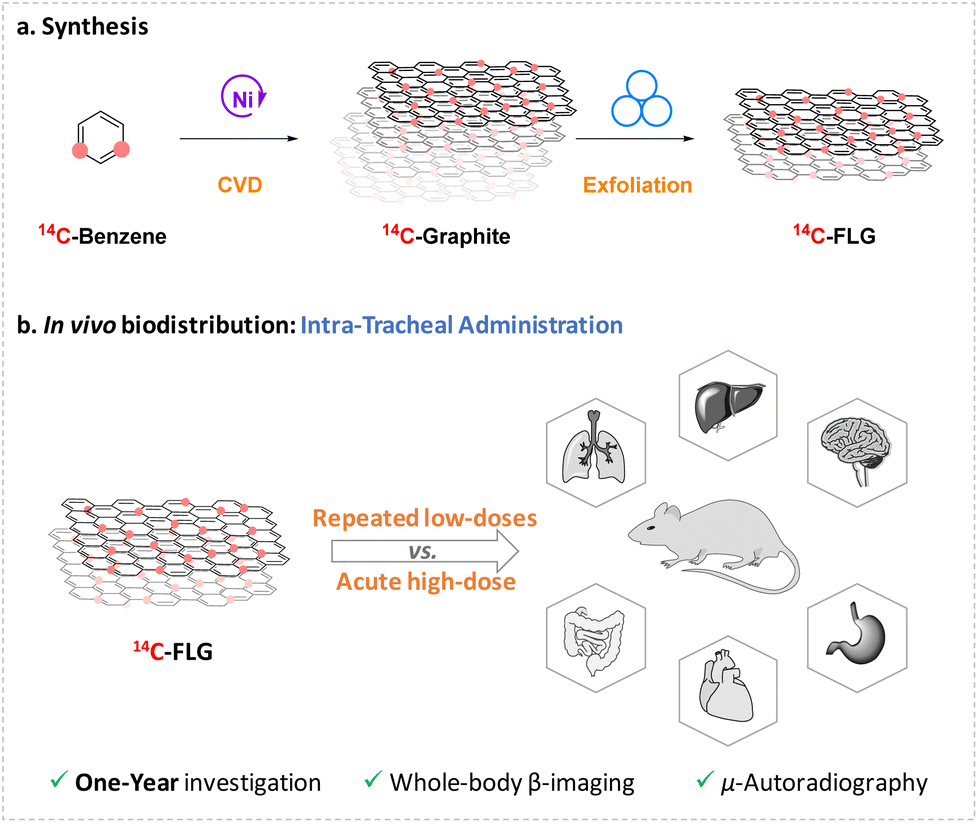 | ||
| Fig. 1 (A) Strategy for the synthesis of 14C-few-layer graphene (14C-FLG). (B) In vivo biodistribution investigation of 14C-FLG in mice over 1 year after intra-tracheal administration. Red circles correspond to the incorporation of 14C into the structure. | ||
Experimental
Chemicals
Organic chemicals and solvents (Sigma-Aldrich) were used without further purification. 14C-benzene (319 mg, 18.5 GBq, 4.77 GBq per mmol, 58 MBq per mg) was purchased from Quotient Bioresearch Radiochemicals Ltd with radiochemical and chemical purity > 99.9%. Scintillation fluid (Gold Star, Meridian) was purchased from PerkinElmer, USA. The deionized water used in the experiment was prepared using a Millipore Milli-Q ultra-purification system (resistance > 18.2 MΩ cm). Porous nickel foams (95%, 5 cm × 1 cm × 1 mm) for the growth of graphite were purchased from Metal Material Co., Ltd.Materials and methods
Graphite and FLG were analysed by transmission electron microscopy (TEM) or scanning electron microscopy (SEM) (Philips CM 30; CEA Saclay, DEN-LM2E, France, and LVEM5 low-voltage transmission electron microscope, CORDOUAN Technologies, Pessac, France) at an accelerating voltage of 5 kV. For the TEM studies in high resolution mode (HRTEM), we used a Titan ETEM 300 microscope (from FEI/Thermo Fisher Scientific) working at 80 kV and equipped with an image aberration corrector and a K2 in situ direct detection camera from Gatan. Raman spectra of 12C-FLG were recorded on an InVia Renishaw micro-spectrometer equipped with a 532 nm point-based laser. In all cases the power density was kept below 1 mW μm−2 to avoid laser heating effects. Raman samples were measured in the solid state under ambient conditions. The resulting spectra (after at least 30–40 random locations on each sample) were fitted with Lorentzian-shaped bands in their D, G and 2D peaks to ascertain band positions, widths and intensities. μRaman spectra of 14C-FLG were recorded on a LabRam HR800 spectrometer with an Olympus microscope and a 50× long-range objective. Thermogravimetric analyses (TGA) were performed with a TGA Q50 (TA Instruments) at 10 °C min−1 under nitrogen flow, from 100 °C to 800 °C. The chemical composition of the non-radiolabelled graphite was evaluated by XPS (X-ray induced photoelectron spectroscopy) analysis using a Kratos Analytical Axis Ultra DLD spectrometer with monochromatic Al KR X-ray radiation (hν = 1486.6 eV). Milling treatments were carried out in a Retsch PM100 planetary mill using a 50 mL stainless steel milling ball and 10 stainless steel beads. UV–vis spectra were recorded using a Cary 5000 UV-vis-NIR spectrophotometer with 1 cm quartz cuvettes. The measurements of 12C-graphite and 12C-FLG were performed at 271 nm and 660 nm for 12.5 and 48 hours, respectively, at various time intervals in the dual beam mode and using baseline correction. Graphite and FLG concentrations were determined from the optical absorption coefficient at the maximum absorbance, using the formula A = α × l × c, where l (m) represents the light path length, c (g L−1) corresponds to the concentration, and α (L g−1 m−1) corresponds to the absorption coefficient. The absorption coefficient α was determined to be 21.9 L g−1 m−1 for graphite at 271 nm and 690 L g−1 m−1 for FLG at 660 nm. The relationship between optical absorbance divided by cell length and concentration confirmed Lambert–Beer behavior.Few-layer graphene synthesis
Few-layer graphene was prepared by exfoliation of graphite obtained by a chemical vapour deposition process (CVD). First developed and optimized on carbon-12, this strategy was employed to synthesize 14C-FLG.In vivo experiments
Blood and plasma. Before sacrifice, blood sampling via the retro-orbital route was performed under anesthesia (2% of isoflurane) on five distinct mice of each group at each time of sacrifice. The plasma was separated by centrifugation of the blood in a heparin tube at 1500g for 15 min.
Urine and faeces. The urine and faeces of eight mice administered with 14C-FLG were collected for 30 days following administration thanks to individual metabolic cages (Techniplast, France). The urine and faeces were stored at −20 °C before analysis.
Organs. At 1, 30, 90, 180, and 360 days after the administration of 14C-FLG, five mice of both groups were sacrificed by perfusion with 0.9% NaCl (10 mL per mouse, 200 mL h−1) for collection of organs (brain, thymus, heart, trachea, lungs, liver, spleen, stomach, stomach bowl, small intestine, small intestine content, large intestine, large intestine content, and kidneys). The organs were immediately frozen at −80 °C by immersion in a mixture of dry ice and isopentane to prevent redistribution of the 14C-FLG. The organs were stored at −20 °C before analysis.
Whole-body and tissue sections. At 1, 30, 90, 180, and 360 days after the administration of 14C-FLG, three mice of both groups were sacrificed for whole-body and tissue sections. The carcass or the organs were frozen and sectioned at 30 μm and 20 μm thickness, respectively, with a CM3050 S cryostat (Leica Biosystems, Wetzlar, Germany) in which the chamber temperature was adjusted to −18 °C and the object temperature to −20 °C. The cryotome was carefully cleaned with a water/ethanol solution between each sample to remove any traces of radioactivity and to avoid contamination between different mice. The whole-body or tissue sections were placed on glass slides and were kept at room temperature for 1 day in the presence of silica gel to ensure complete drying for radio imaging.
Primary culture cells. At 1 and 30 days after the administration of 14C-FLG, three mice of both groups were sacrificed by perfusion with 0.9% NaCl (10 mL per mouse, 200 mL h−1) for lung collection. Almost whole lungs were frozen and sectioned at 20 μm thickness, as described above. A small part of the lungs was cut in small pieces and digested at 37 °C for 15 min with 0.25% trypsin (Gibco, Thermo Fisher Scientific, Massachusetts, USA). The digested organs were filtered on a 100 μm cell strainer (Corning, Dutscher, Issy-les-Moulineaux, France). Then, 100 μL of cells were diluted in 900 μL of RPMI medium plus 10% fetal bovine serum and 1% penicillin–streptomycin (Gibco, Thermo Fisher Scientific, Massachusetts, USA). Cells were plated on LabTek chambers (Thermo Fisher Scientific, Massachusetts, USA) and incubated overnight at 37 °C with 5% CO2. The plated cells from lungs were immersed for 5 min in 4% formalin for fixation.
Analysis of clinical chemistry, elimination and organ distribution
Autoradiography from the whole body to cells
μ-Autoradiography
14C-FLG was detected in tissue sections and cells by μ-autoradiography following the detailed protocol described in the ESI.† Briefly, slides were dipped in a liquid radiosensitive emulsion (NTB, Carestream), and after drying under a humidified atmosphere, the slides were exposed for 4 days at 4 °C. The slides were then developed in Kodak D-19 (Kodak) and then stained with Mayer's hemalum (Merck).Results and discussion
With the aim of assessing the long-term effects of repeated graphene exposure and comparing them to those of single exposure, we conducted an investigation into the distribution of 14C-labelled few-layer graphene (14C-FLG) in mice. Our approach adopted a comprehensive “top to bottom” strategy, analysing the distribution from the whole animal down to the cellular level. To produce 14C-FLG, we developed a two-step methodology. Initially, 14C-labelled graphite was obtained through a chemical vapor deposition (CVD) process. Subsequently, a mechano-chemical exfoliation step was employed to achieve the desired 14C-FLG. The methodology, previously established with carbon-12 materials, was effectively applied to synthesize 14C-FLG.Preparation of 14C-graphite
14C-graphite synthesis proceeded first with the injection of diluted 14C-benzene (3 mL) in the CVD system. It was pushed using argon pressure (2 bars) from the tank and then injected into the rest of the device (Fig. S1†) using an injection head connected to a computer-assisted control system. This system adjusts the injection frequency and the valve opening time to control the amount of injected benzene. Once injected, the carbon source was carried by a flow of hydrogen regulated by a flow meter and then heated in the vaporiser. At this stage, the fine droplets of 14C-benzene are transformed into gas, which was sent into the quartz tube and heated to 1000 °C by means of a tube furnace with a 12 cm isothermal zone. Based on the work of Chen et al.,34 five nickel foams, playing the role of a support for the growth of graphite, were placed in the middle of this isothermal zone. Out of the oven, the gas passes through a water cooler and a bubbler filled with acetone, which isolates the device from ambient air and allows the gas flow to be monitored. Finally, a stream of air was directed at the walls of the quartz tube to control the cooling rate of the furnace (up to 100 °C min−1). After cooling down to room temperature, the nickel foams were collected and placed in a 3 M HCl solution heated at 100 °C for 5 hours. After complete dissolution of the nickel, the 14C-graphite was filtered, rinsed and dried, providing 25 mg of 14C-graphite (135 MBq, 5.4 MBq mg−1).Physicochemical characterization of 12C-graphite and 14C-graphite was performed to confirm the consistency of the production method and the quality of the engineered materials. Electron microscopy (TEM, SEM, STEM) analysis of 12C-graphite performed directly after CVD showed flakes of graphite covering the entire structure of the nickel foam (Fig. S2†). After dissolution and removal of the nickel, the recovered 12C-graphite appeared as micrometre scale particles (>1 μm) (Fig. 2A and S3†).
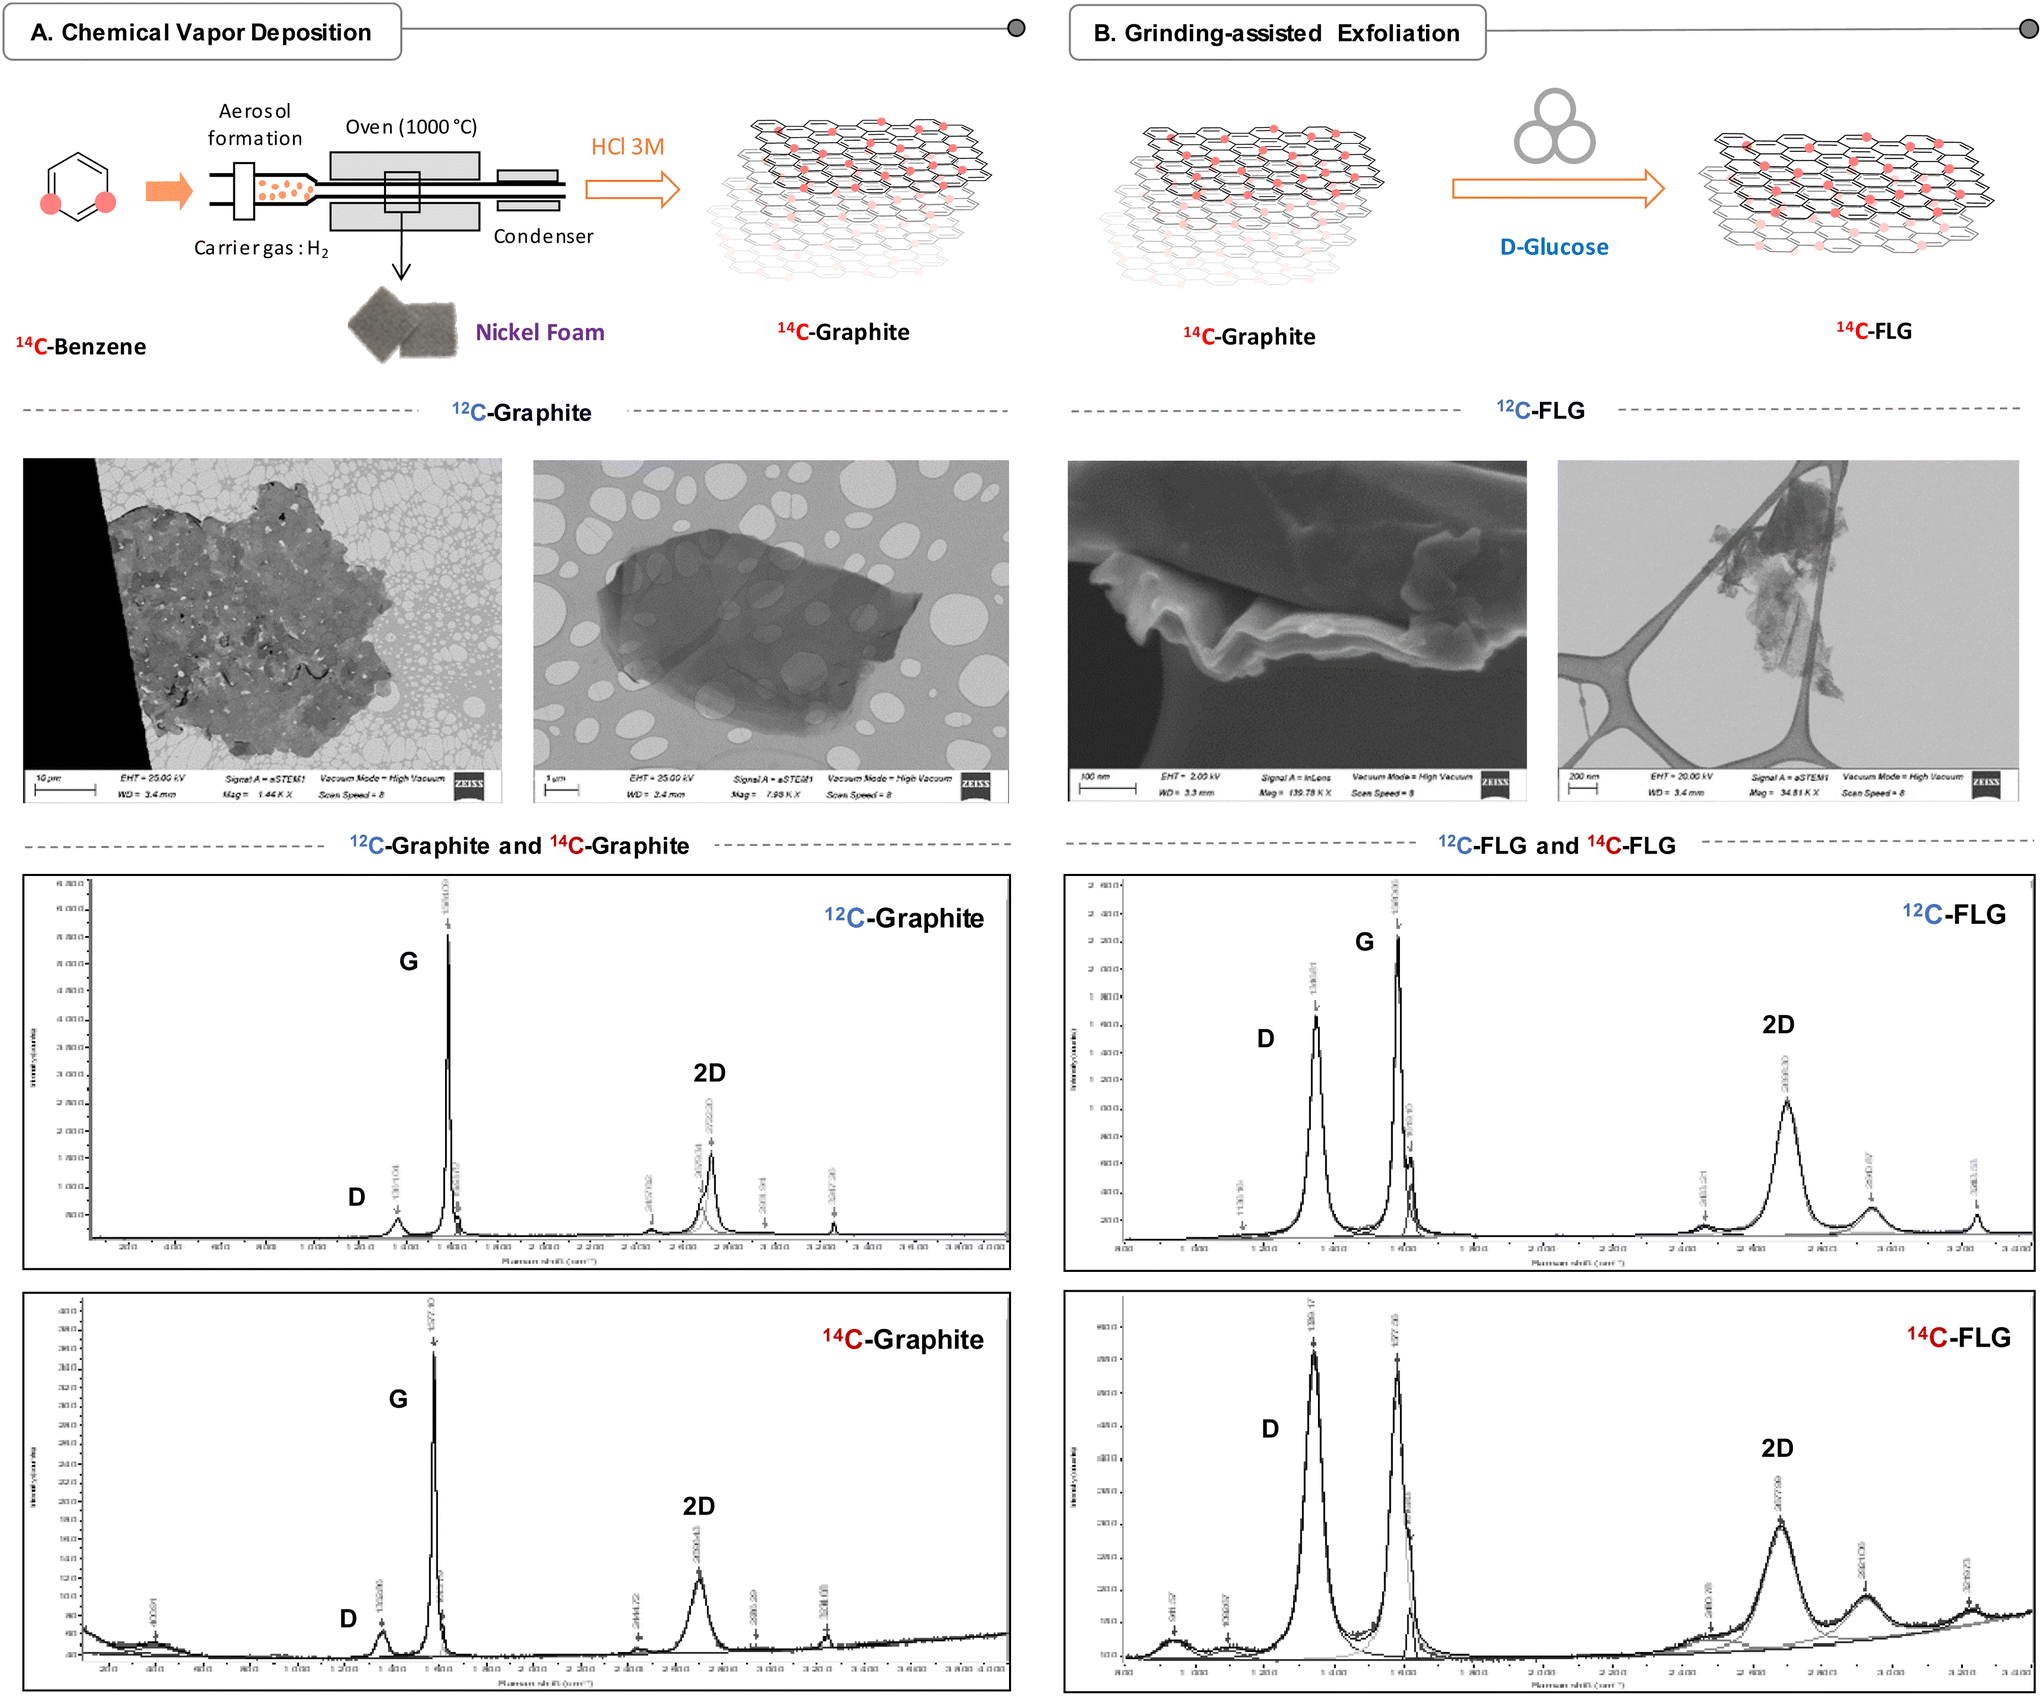 | ||
| Fig. 2 (A) Synthesis and characterization of 14C-graphite. Upper panel: schematic representation of the CVD preparation of 14C-graphite from 14C-benzene. Middle panel: morphological characterization of 12C-graphite by STEM. Scale: 10 μm (left) and 1 μm (right). Lower panel: Raman spectra of 12C-graphite (up) and 14C-graphite (down). (B) Synthesis and characterization of 14C-FLG. Upper panel: schematic representation of the grinding-assisted exfoliation of 14C-graphite to provide 14C-FLG. Middle panel: morphological characterization of 12C-FLG by STEM. Scale: 100 nm (left) and 200 nm (right). Lower panel: Raman spectra of 12C-FLG (up) and 14C-FLG (down). | ||
All graphite samples analysed by Raman spectroscopy presented the characteristic bands of graphene-based materials: D, G and 2D. The D band stands for the presence of defects in the structure since it is related to Csp3 carbons and the G band corresponds to Csp2 carbons and the stretching of the C–C bond in graphitic materials. Then, the ID/IG ratio can be used to evaluate the defects in the structure and I2D/IG can be related to the thickness of the material. The 2D band can also be used to assess and determine the number of layers using the full width at half-maximum (FWHM)35 of the band, e.g., a narrow 2D band indicates a low number of layers.36
Just after the chemical vapour deposition, 12C-graphite deposited on nickel presented a very similar Raman spectrum (Fig. S4†) to 12C-graphite without nickel. Interestingly in the latter case, the 2D band is slightly shifted and the intensity of the D peak decreased, which indicated that the structural quality of the graphene was preserved and the disorder effects associated with the nickel have disappeared. Graphite on nickel showed an ID/IG ratio equal to 0.13, which indicates a low amount of defects in the structure. This ratio is similar for both 12C and 14C-graphite after removing the nickel foam with an ID/IG ratio of 0.18 and 0.16, respectively, and demonstrates the high quality of the produced material. The I2D/IG ratios for 12C- and 14C-graphite are comparable (12C: 0.27, 14C: 0.33) (Fig. S5–S7†), which confirmed the multilayer graphitic nature of the material. The number of layers was obtained from the determination of the FWHM (12C: 69 cm−1, 14C: 86 cm−1), corresponding to a thickness of more than 20 layers for both 12C-and 14C-graphite.
Interestingly, introduction of 14C atoms into the structure led to significant downshifts of the three bands showing peaks at 1352 cm−1 (D), 1577 cm−1 (G) and 2696 cm−1 (2D) compared to the peaks at 1361 cm−1 (D), 1584 cm−1 (G) and 2722 cm−1 (2D) for the 12C-graphite. These downshifts depend on the frequency of the mode: higher frequency modes shift more than modes at lower frequencies, as described by the simple harmonic oscillator model.37–39 Based on them, it is possible to determine the enrichment of the labelled graphite (eqn (S1)†),40,41 leading to 10.7 wt% (1577 cm−1) carbon-14 enrichment, corresponding to a 14C/12C ratio of 1/10 due to the isotopic dilution of the 14C-benzene (0.3 mL) with 12C-benzene (2.7 mL) before the CVD step.
XPS analyses were performed on 12C-graphite only, to avoid any radioactive contamination of the equipment. The deconvolution C 1s spectrum of 12C-graphite exhibits one major asymmetric C 1s peak at 284 eV and minor ones at 286 and 287.5 eV. The peak at 284 eV is assigned to C–C and C![[double bond, length as m-dash]](https://www.rsc.org/images/entities/char_e001.gif) C. The contribution of C–O, CO and COOH species is negligible. Additionally, the XPS spectrum of 12C-graphite indicates that the carbon content is the dominant feature (ca. 97.9%) as expected, with a small proportion of oxygen (ca. 2.1%) (Fig. S8–S10†). TGA was also performed on 12C-graphite under an air atmosphere (Fig. S11†), showing high thermal stability (647 °C). All together these characterization studies confirmed the consistency of the production method and the quality of the prepared radiolabelled 14C-graphite.
C. The contribution of C–O, CO and COOH species is negligible. Additionally, the XPS spectrum of 12C-graphite indicates that the carbon content is the dominant feature (ca. 97.9%) as expected, with a small proportion of oxygen (ca. 2.1%) (Fig. S8–S10†). TGA was also performed on 12C-graphite under an air atmosphere (Fig. S11†), showing high thermal stability (647 °C). All together these characterization studies confirmed the consistency of the production method and the quality of the prepared radiolabelled 14C-graphite.
Preparation of 14C-few-layer graphene
Exfoliation of 14C-graphite was performed using D-glucose as an exfoliating agent through a ball milling treatment previously developed by the group of Vázquez29,42,43 that we adapted for the preparation of the radiolabelled FLG. In addition to being considered as a green process, the method relies on the utilization of a biocompatible and non-toxic exfoliating agent, which is essential to conduct in vivo studies.In a typical experiment, 5 mg of 14C-graphite and 300 mg of D-glucose were placed in a 50 mL stainless-steel jar containing 10 stainless-steel balls. Optimisation was carried out by varying the grinding time (30 min, 1 h, and 2 h) and speed (100 rpm and 250 rpm) (Fig. S12 and Table S1 and Fig. S2†). In order to obtain the few-layer graphene material, the graphitic material was ground at room temperature and under the ambient atmosphere for 2 hours at 250 rpm using a Retsch planetary ball mill.
After the milling step, the resulting solid mixture was dispersed in water and dialyzed to remove the excess of glucose. The dispersion was then decanted to separate the precipitating graphite from the FLG sample. The resulting supernatant was subsequently collected, yielding a suspension of 14C-FLG (18.12 MBq, 607 kBq mL−1, 5.4 MBq mg−1), which was further lyophilized for storage.
Raman analysis of 12C-FLG showed peaks at 1346 cm−1 (D), 1580 cm−1 (G) and 2698 cm−1 (2D). Compared to graphite, the D band intensity increases significantly, which can be correlated with the appearance of defects in the structure of the materials due to the mill process. These results are in agreement with the recent work of González et al.29 where they reported a similar result for glucose exfoliation-assisted graphitized carbon nanofibers to prepare FLG. The I2D/IG ratios for 12C- and 14C-FLG were found to be identical (12C: 0.47, 14C: 0.46) and higher than that for graphite (Table S2, Fig. S13–S15†). Together with the FWHM of the 2D band (12C: 67 cm−1), this confirmed the few-layer nature of the material. Analysis of the 2D band indicated a change in the shape with a thinner band according to the FWHM (12C: 67 cm−1), which revealed a thickness between 5 and 6 layers. Similarly to 14C-graphite, 14C-FLG presented here again downshifted peaks at 1339 cm−1 (D), 1577 cm−1 (G) and 2677 cm−1 (2D) due to the presence of carbon-14 atoms in the structure of FLG. It is worth noting that the 14C-FLG spectra presented higher background noise due to the smaller amount of the precious 14C-FLG used for characterization studies and showed additional peaks at 941 cm−1 and 1092 cm−1 related to the contribution of the glass window and the coverslip as parts of the container designed to confine the radioactive sample during Raman acquisition (Fig. S16–S18†). In a more general way, the characterized material has shown small FWHM widths in the 2D band and a small I2D/IG ratio compared to graphite, overall corresponding to FLG.
The transmission electron microscopy (TEM) and scanning transmission electron microscopy images (STEM) of 12C-FLG shown in Fig. 2 indicate a lateral dimension of around 500 nm for the prepared FLG. TGA was used to assess the thermal stability of the FLG under an air atmosphere. 12C-FLG showed a residual loss of 5 wt% (Fig. S19†).
Finally, the colloidal stability of FLG in deionized water was evaluated by UV–vis absorption spectroscopy (Fig. S20†) at 660 nm over 60 hours. A first sedimentation appears in the first 24 h followed by a plateau at around 0.055 mg mL−1 where the suspension is stable. This stability window has been used to optimize the extraction of the desired suspended FLG apart from the precipitate (mainly graphite and poorly exfoliated graphene). The resulting suspension was then rapidly frozen and, subsequently, lyophilised in a freeze-drier, providing a low-density black powder essentially made of FLG sheets. A few hours before injection, the powder was then re-suspended in deionized water and sonicated to provide stable suspensions suitable for their administration in vivo.
Long-term impact of 14C-few-layer graphene after tracheal administration in mice
Most of the studies investigating the respiratory administration route primarily focused on the short-term distribution of GBN in mice (≤21 days).19–21 Long-term studies present significant challenges and costs, frequently leading to a lack of knowledge on the impact of GBN over a long period of time. To address this issue, we chose to explore the biodistribution of 14C-FLG in female mice over the course of one year. To the best of our knowledge, only one study has examined the fate of 14C-FLG over such an extended duration, focusing solely on single dose exposure through intravenous administration.33 Since respiratory exposure is considered as one of the most concerning routes of exposure, intratracheal instillation was considered as an interesting route of exposure for this study. While inhalation is recognized as more physiologically relevant for human exposure, the intratracheal route is often chosen due to the scarcity and high cost of inhalation system installation, and to its directness and efficiency in delivering materials to the lungs. By doing so, it avoids deposits in the nose or in the digestive tract that can lead to misinterpretations, especially in the context of whole-body distribution studies. Furthermore, this technique is especially suitable for the administration of radioactive materials, as the dose is confined to a small volume and it uses an individual and disposable cannula, thus preventing the need for extensive equipment decontamination.On these bases, we compared the effects of an acute high-dose versus a repeated low-dose exposure to FLG after intratracheal administration at different levels of analysis, ranging from the animal down to the cellular level. The mice used were outbred Balb/cJ mice, which are the most practical and commonly used species for pre-clinical toxicity studies. The protocol was conducted in female mice (nulliparous and non-pregnant), which are generally considered more sensitive than male mice in toxicity studies.
Biodistribution and elimination
Two groups of female Balb/cJ mice were exposed to 14C-FLG by tracheal administration to either a unique high dose of 13 μg (74 kBq) or a low dose of 3.4 μg (18.5 kBq) that was repeated once a week for 4 weeks. The distribution of 14C-FLG in the mice was subsequently monitored for one year after the end of the administration period, corresponding to the completion of the fourth and final repeated administration. The mice were sacrificed at day 1, 30, 90, 180, and 360 post-exposure. At each of these times, radioactivity was imaged on whole-body sections using a β-imager and quantified using scintillation counting in the following organs: brain, thymus, heart, trachea, lungs, liver, spleen, stomach, stomach bowl, small intestine, small intestine content, large intestine, large intestine content, and kidneys. Radioactivity was also quantified in urine and faeces to follow the elimination of FLG.Whole-body β-imaging demonstrated that radioactivity remained predominantly concentrated in the lungs, even after 360 days, irrespective of the administration protocol (Fig. 3A, S21 and S22†). Upon further quantification of all collected and shredded organs, it was confirmed that the lungs contained the majority of radioactivity, accounting for 72 ± 3% after acute administration and 69 ± 5% after repeated administration. This trend was consistent when considering the total organs, with the lungs comprising 80 ± 8% after acute administration and 71 ± 5% after repeated administration (Fig. 3B). Lung distribution of large nanoparticles (size > 1 μm) and FLG had also been demonstrated after intravenous administration,33 showing that these nanoparticles could be trapped in the capillary beds of lungs. FLG exhibited reduced distribution to other organs, such as the trachea, stomach, and large intestine, with these organs containing less than 5% of the administered dose only one day after the administration. In agreement with previous results,14,15 tracheal instillation of FLG leads to mucociliary clearance and to the redistribution of inhaled FLG to the gastrointestinal tract. However, conversely to several other reports, no radioactivity was detected in the brain, even at low levels (Fig. S22 and S23†), which suggests that FLG flakes of around 500 nm administered via the tracheal route are unlikely to pass through the blood–brain barrier.
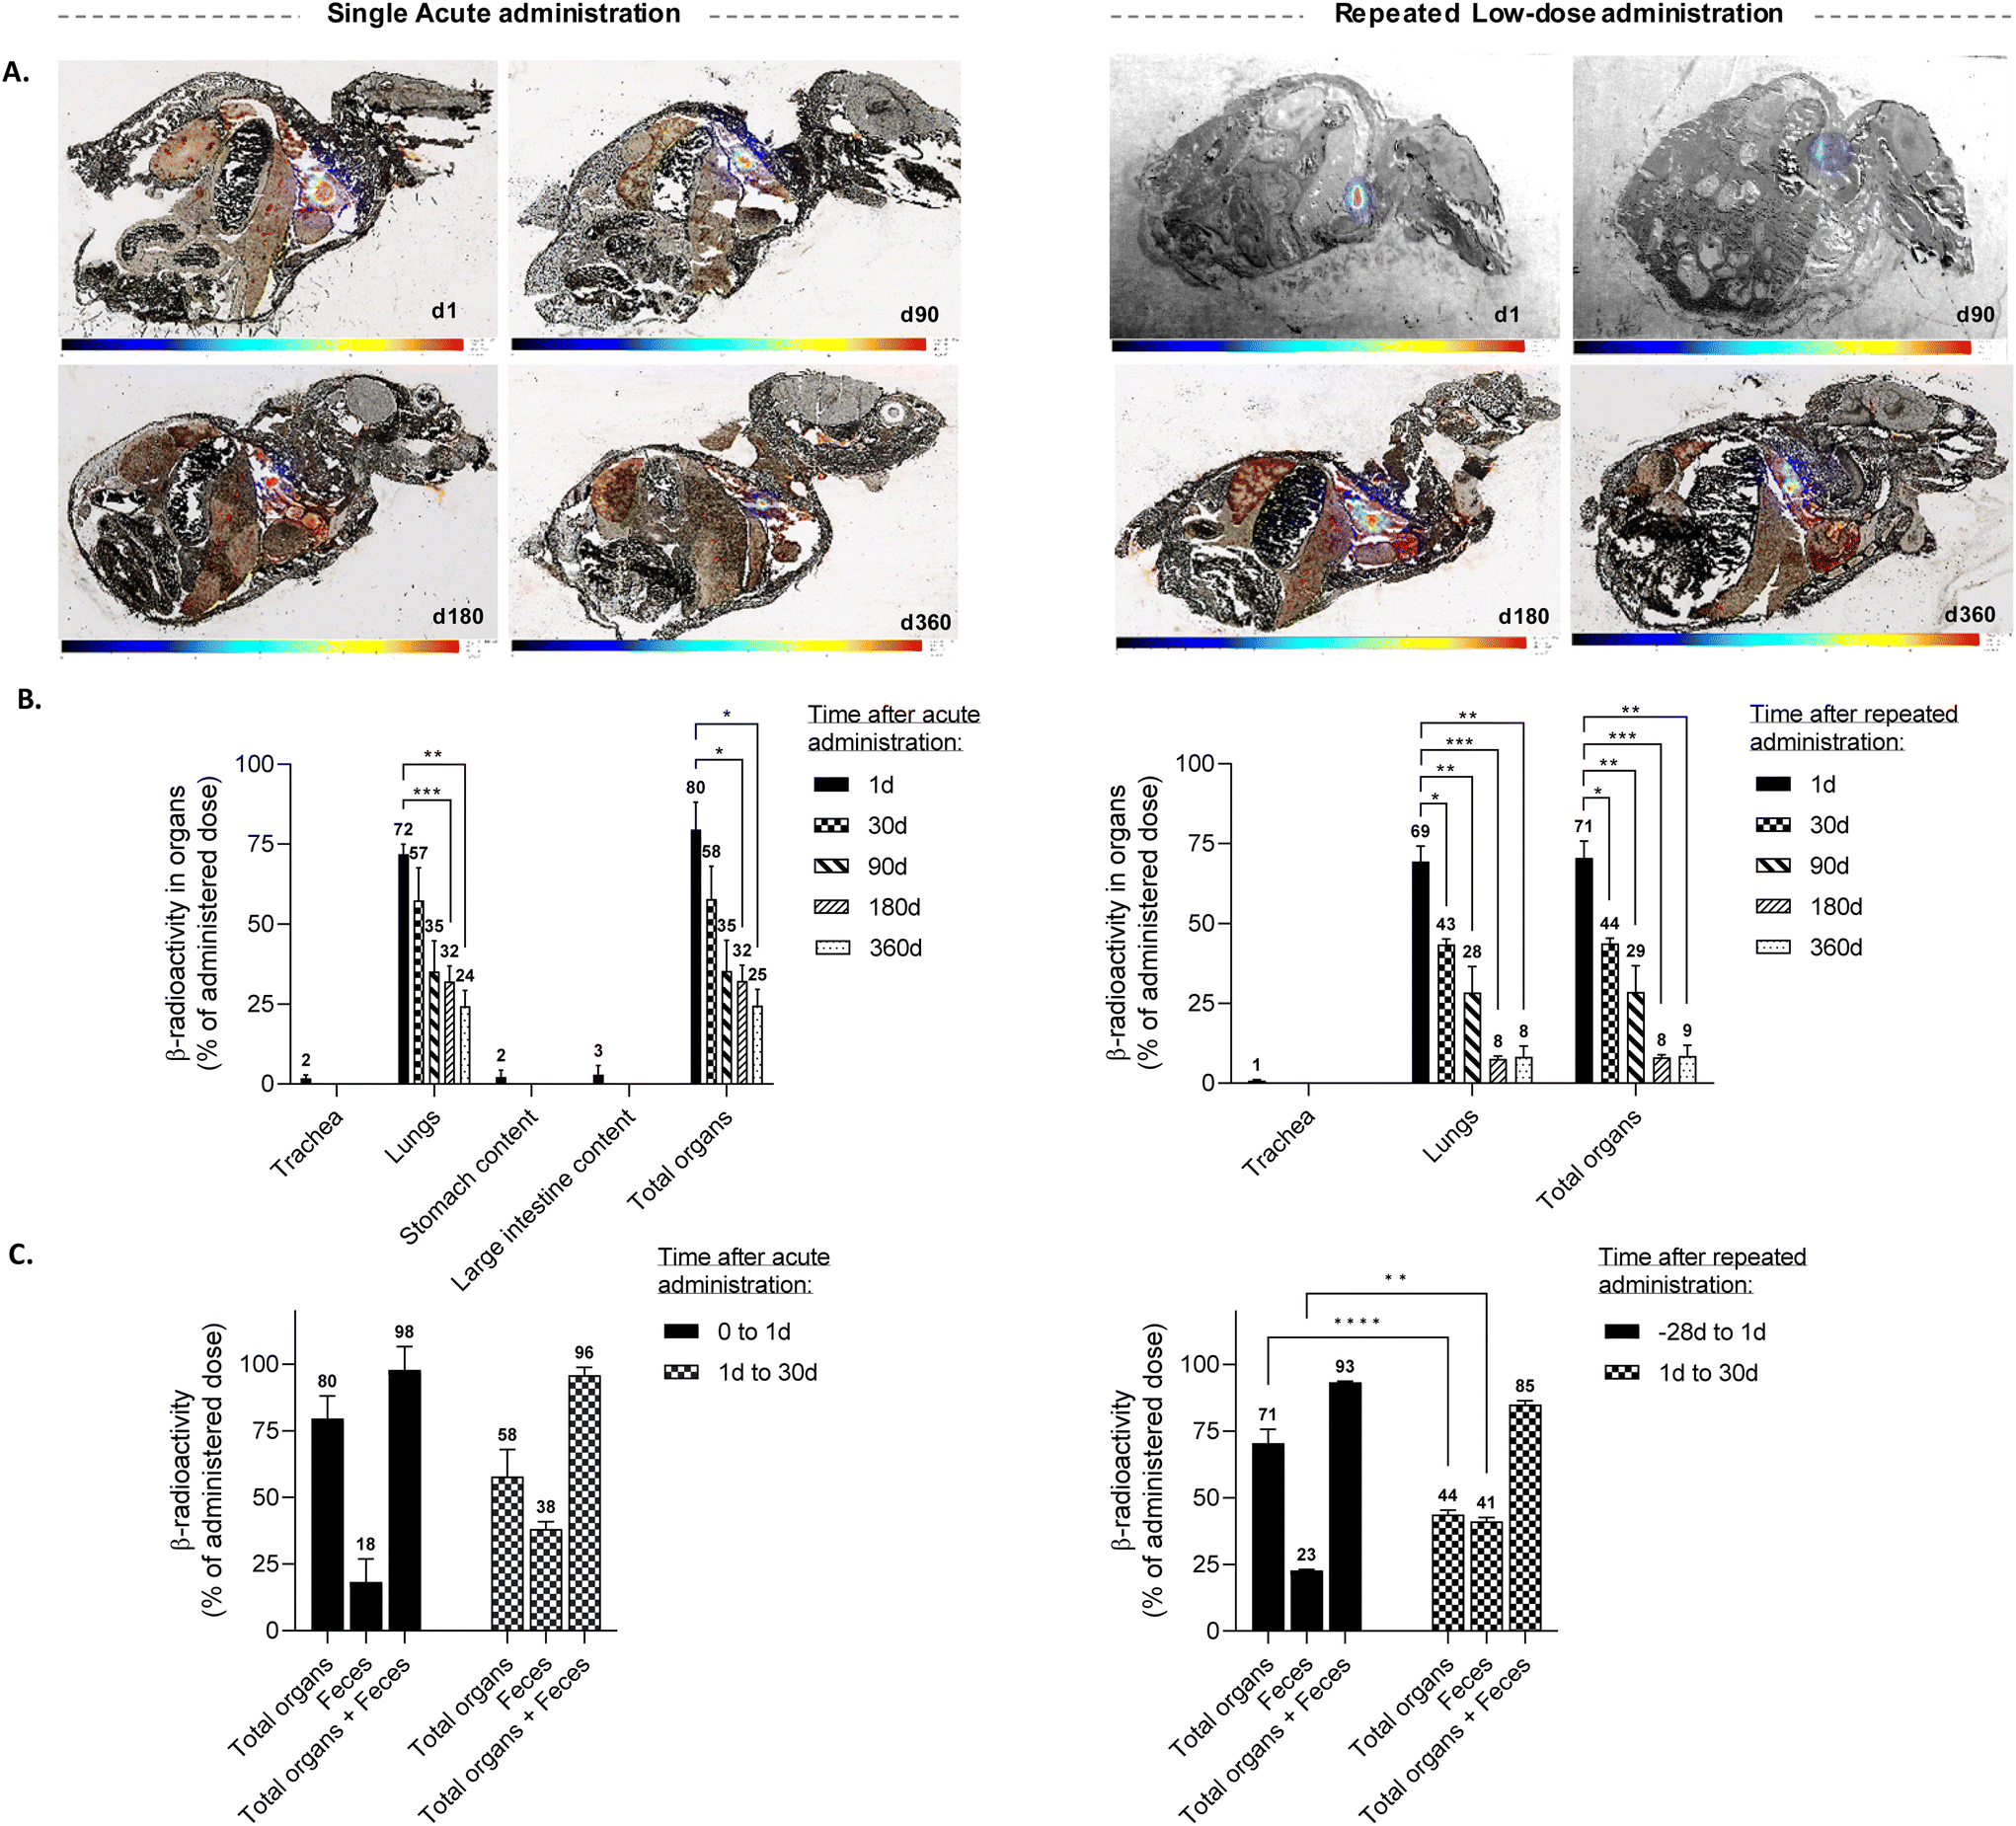 | ||
| Fig. 3 (A) Whole-body slices (30 μm thick) of female Balb/cJ mice observed by β-imaging after 14C-FLG single (left panel) or repeated (right panel) tracheal administration over 360 days. A slice is representative of 6 slices per mouse of n = 3 mice per time and per group. (B) Mean ± SEM of the percentage of organ β-radioactivity administered dose over time following 14C-FLG single (left panel) or repeated (right panel) tracheal administration. Organs with <1% of administered dose are not presented. n = 5 female Balb/cJ mice per time and per group. Mixed-effect model followed by Dunnett's multiple comparison test; * p < 0.05, ** p < 0.01, *** p < 0.001 compared to 1 day for each organ. (C) Mean ± SEM of the percentage of β-radioactivity administered dose contained in faeces and total organs over 30 days following 14C-FLG single (left panel) or repeated (right panel) tracheal administration. n = 8 mice per time and per group. | ||
Interestingly, when examining the amount of radioactivity remaining after a year, we observed distinct differences in the biopersistence of FLG following acute versus repeated administration. For instance, a significant decrease in the radioactivity content was observed in the lungs only after 180 days following acute exposure, with 25 ± 5% of the administered dose persisting in all organs after 360 days (Fig. 3B, left panel and Fig. S22†). Surprisingly, the content of FLG in the lungs decreased much faster after repeated exposure, by 57, 72, and 92%, at 30, 90, and 180 days post-exposure, respectively (Fig. 3B, right panel and Fig. S23†). During the six remaining months, the radioactivity found in the lungs after repeated exposure stabilised to 8 ± 3%, indicating a bioaccumulation of the graphene in that organ. Dose and frequency of FLG exposure play a crucial role in influencing the biodistribution of FLG in the lungs.
No radioactivity was found in the kidneys at any time point (Fig. S22 and S23†), and only 0.01–0.10% of the injected dose was recovered in urine (Table S3†), suggesting no clearance of the 14C-FLG via glomerular filtration. While no significant radioactivity was detected in urine, most of the elimination was through faeces, peaking at 18 ± 9 and 23 ± 0.4% at 1 day after acute and repeated administration, respectively (Fig. 3C, left panel). Then, 38 ± 3 and 41 ± 1% of radioactivity was eliminated through faeces in the next 30 days after acute and repeated administration, respectively.
Tissue and cellular localization
Following the investigation of FLG distribution at both the whole-body and organ levels, we further explored the sub-organ distribution of 14C-FLG on tissue slices by μ-autoradiography. This technique is used to provide a subcellular assessment of the localisation of radiolabelled compounds.44,45 Silver grains (black spots on images) emerge as a result of the interaction between the emitted β-particles from the radioelement (in this case, 14C) and a radiosensitive emulsion containing silver bromide nanocrystals.46To visualise 14C-FLG at the cellular level, we first optimized the autoradiography conditions on HeLa cells (Fig. S25†). We then applied them on tissue sections from exposed mice. Lung and liver slices were analysed 30 and 90 days after 14C-FLG administration, and acute exposure and repeated tracheal exposure were compared (Fig. 4A). To optimize the resolution of the μ-autoradiography images, different times of exposure to the radiosensitive nuclear emulsion were investigated (1, 4 and 15 days). After 4 days of exposure of lung and liver slices (from mice 30 days after administration) to the emulsion, μ-autoradiography images showed a heterogeneous distribution of radioactivity in the lungs with larger spots of silver grains in the central region of the lungs and smaller ones in the peripheral region (black dots in Fig. 4A, S26 and S28†). These observations may be attributed to FLG tendency to aggregate at the entrance of the lungs shortly after administration. In line with the quantification of radioactivity in organs, no radioactivity was observed in liver sections as indicated by the absence of black dots in Fig. S27 and S29† for both exposure modes. Additionally, we examined lung slices from mice after 90 days of both acute and repeated tracheal administrations of 14C-FLG. Over time, we observed fewer, smaller, and more dispersed aggregates in the lung slices. However, lung slices from mice after 90 days were not further investigated due to the extended exposure time to the emulsion, which exceeded the period needed to yield a significant silver grain signal (greater than 15 days).
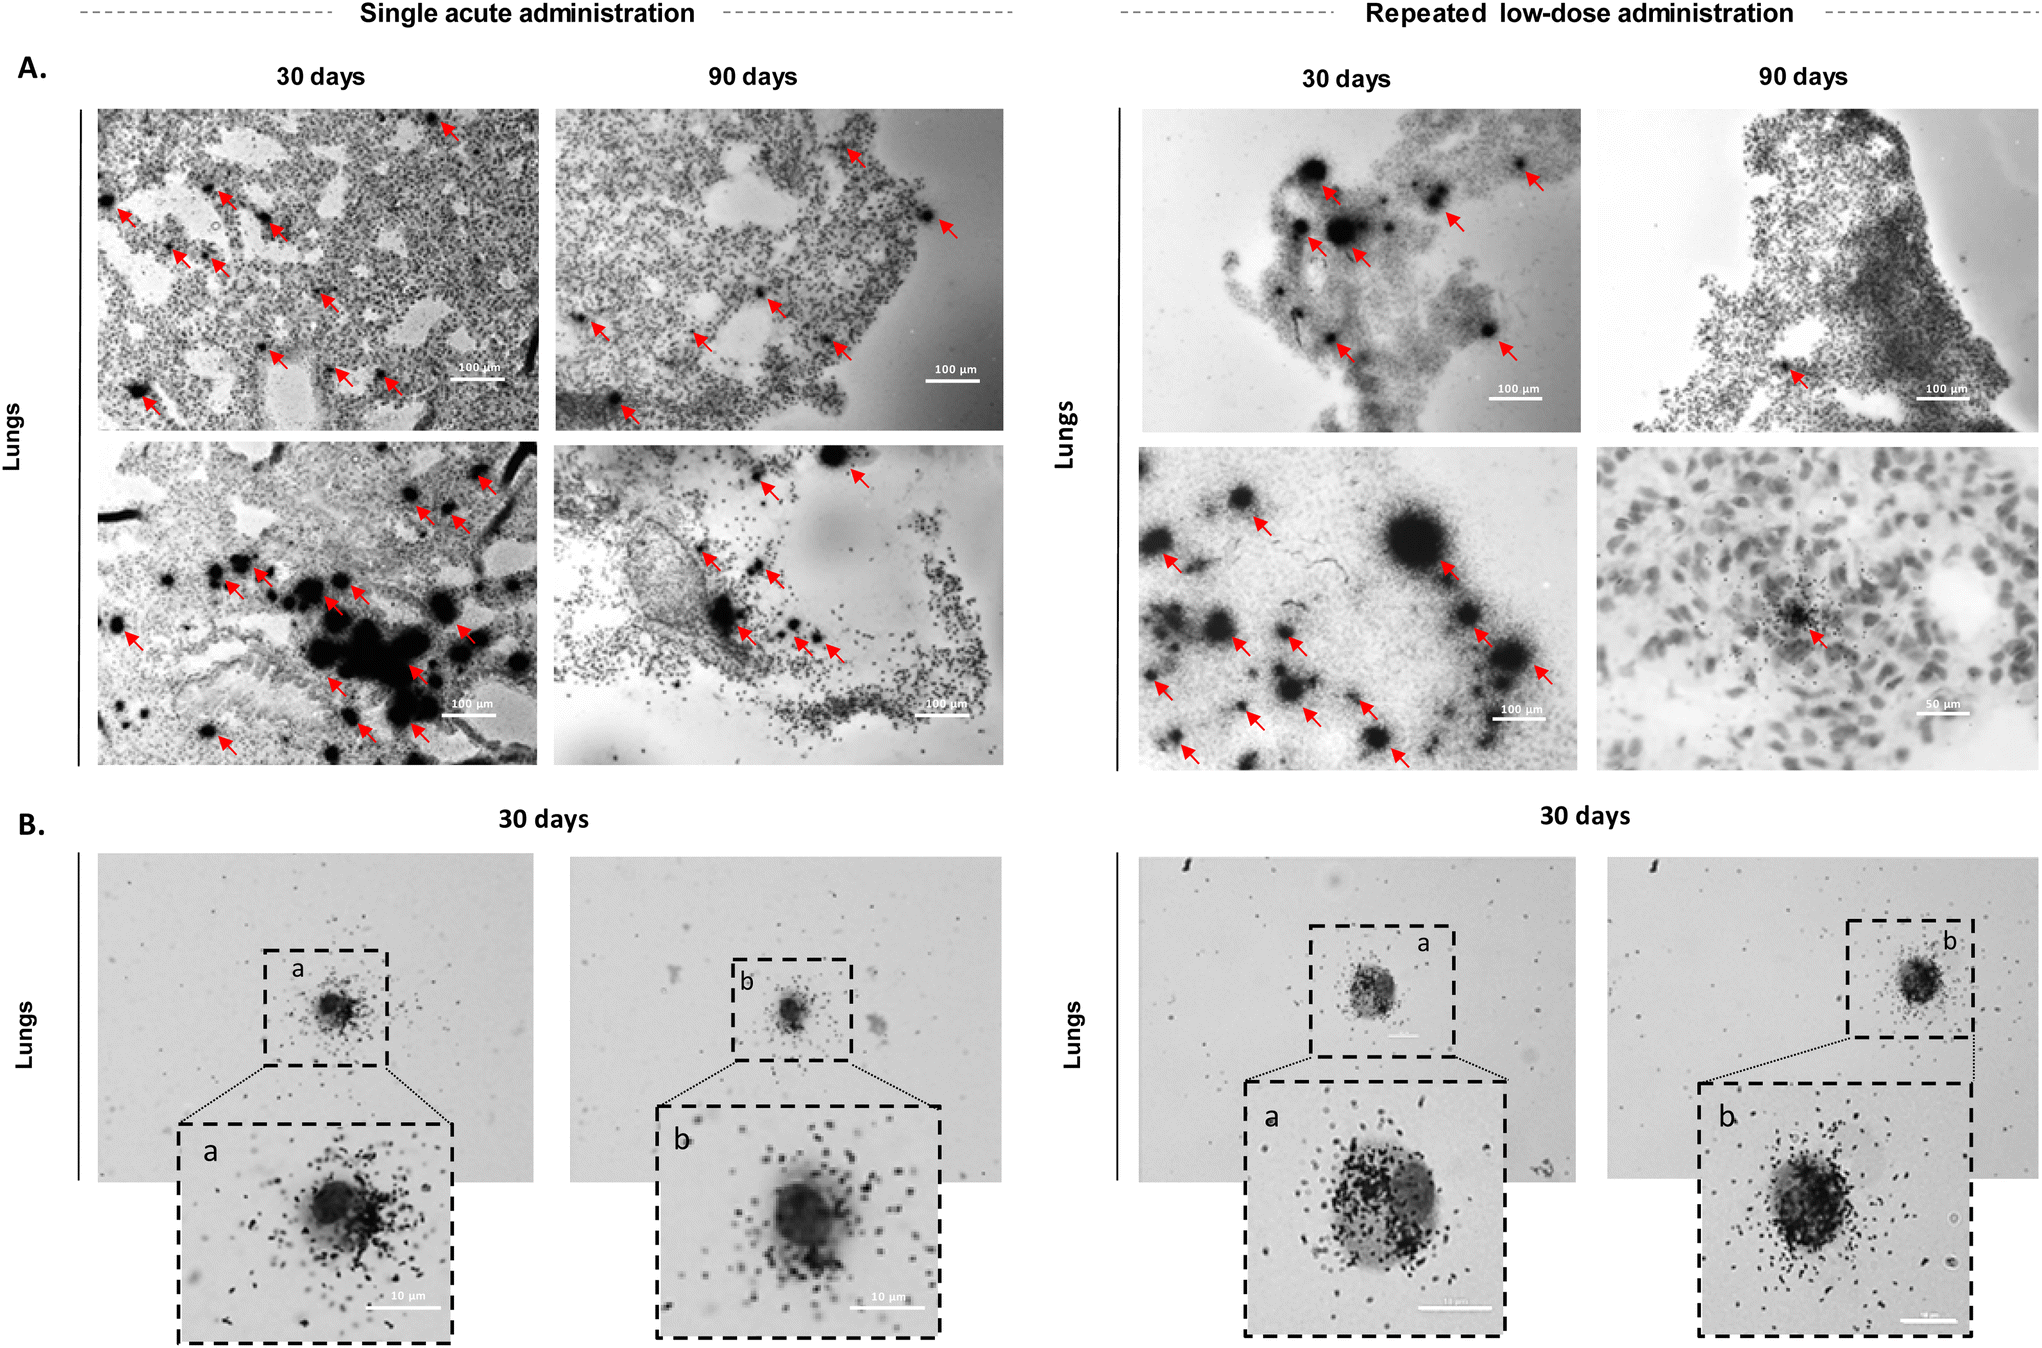 | ||
| Fig. 4 (A) μ-Autoradiography images of lung tissue sections of exposed organs at 30 and 90 days after 14C-FLG single (left panel) or repeated (right panel) tracheal administration. The upper images focus on the peripheral region of the lung and the lower images focus on the central region. The red arrows correspond to the presence of radioactivity. Scale: 100 μm. (B) μ-Autoradiography analysis of primary culture cells of the lungs after 14C-FLG single (left panel) or repeated (right panel) tracheal administration. Scale: 10 μm. | ||
To obtain a more in-depth understanding of the material fate, we decided to examine primary culture cells from the lungs and determine if we could detect radioactivity within these cells using μ-autoradiography. As the lungs are the primary targeted organs, primary culture cells were derived from lung tissue samples collected 30 days after administration. Lung tissues were mechanically dissociated, enzymatically digested, and then subjected to centrifugation to isolate lung cells, which were subsequently cultured. Autoradiography revealed that primary lung cells consistently exhibited radioactivity and that 14C-FLG is mainly located in their cytoplasm (Fig. 4B, S30 and S31†), suggesting the internalization of the nanomaterials into the cells, as it seems unlikely that the material would have remained solely on the cell surface during the primary culture cell mechanical and enzymatic treatments.
Noteworthily, the studied lung cells associated with radioactivity exhibit a morphological aspect more indicative of alveolar macrophages rather than epithelial cells. However, to confirm this suggestion, it would be essential to achieve accurate identification using specific cellular markers. Interestingly, a very recent comparative study of the impact of several GBN in vivo reported evidence of FLG (lat. dim. ∼200 nm) degradation through macrophages and neutrophils in the lungs, and suggested that there may be a size threshold (<1 μm) for more efficient degradation of GBMs by macrophages and faster elimination from the lungs.47
Clinical chemistry
The toxicological effect of 14C-FLG exposure was also investigated in the plasma from mice at different times after acute and repeated administration. Hepatic, renal, pancreatic, metabolic, and muscle parameters, as well as electrolytes, have been quantified over one year.Regardless of the administration protocol, no significant signs of perturbations of plasma chemistry were detected over time (Fig. S32 and S33†). There was a non-significant increase in alanine and aspartate aminotransferases during the first month, which decreased over time for repeated administration but not for acute administration. Albumin showed a slight increase after one year of acute administration. Significant variations in creatine kinase were observed, attributed to sample haemolysis. However, overall, electrolytes remained within standard thresholds, suggesting the absence of systemic toxicity over time under these conditions, regardless of the frequency of administration. However, local lung toxicity, where FLG is mostly accumulated, cannot be excluded. This should be confirmed using specific biomarkers for lung toxicity. Further studies should be performed to explore this hypothesis.
Conclusions
With the extended production and commercialization of graphene related materials, the assessment of their fate in vivo remains a main public health priority, particularly when considering the effect of repeated low-dose exposure over a long period of time.We showed that FLG was mainly present in the lungs of mice when an acute high dose or repeated low doses of 14C-FLG were administered, in agreement with previous reports. We have not been able to detect even low doses of radioactivity in the brain, indicating that such a material (500 nm and 6 layers thickness) is unlikely to pass through the blood–brain-barrier. The biopersistence of FLG differs between acute high-dose and repeated low-dose administrations. Actually, the content of FLG in the lungs showed a more rapid decrease after repeated low-dose exposure, indicating reduced biopersistence compared to that in acute administration. Furthermore, we showed the long-term accumulation of the material in the lungs over one year, regardless of the administration protocol, which was not correlated to any significant perturbations of the plasma chemistry under these conditions but without excluding potential lung toxicity. Our findings also described the elimination of graphene nanomaterials of around 500 nm through faeces, but not via glomerular filtration. Finally, 14C-FLG materials were found to be present in lung cells and more particularly within the cytoplasm, suggesting a possible internalisation of the nanomaterials.
Although the physico-chemical characteristics of the material (size, thickness, carbon/oxygen ratio) play a dominant role, it is clear that the in vivo fate of FLG after intratracheal administration shows similar biodistribution trends to GO with a clear and major accumulation in the lungs that decreases over time. However, in contrast to GO, FLG is demonstrated to be eliminated less rapidly in the long term. Both have been found to be internalized in lung cells, most probably by macrophages which have been shown to participate actively in the degradation of the materials.33,47
In summary, this work provides an initial glimpse into the long-term impact of repeated FLG exposure through the respiratory tract and shows that radiolabelling and autoradiography are powerful techniques to assess its distribution from the animal to the cell level. Further and more comprehensive analyses would be interesting to gain a deeper understanding of the degradation mechanisms of FLG in vivo.
Author Contributions
A. S. and M. K. contributed equally to this work. The manuscript was written through contributions of all authors. All authors have given approval to the final version of the manuscript.Ethical statement
All animal procedures were performed in accordance with Care and Use of Laboratory Animals of the Directive 2010/63/EU of the European Parliament, which has been approved by the Ministry of Agriculture, France. The project was approved by the French Ethics Committee CEEA (Comité d'Ethique en Expérimentation Animale) which is responsible for overseeing the provisions for the care and well-being of animals used for research and educational purposes at CEA-Saclay and serves the public by ensuring compliance with all legal and ethical standards regarding the use of vertebrate animals in research and teaching at CEA-Saclay.Conflicts of interest
There are no conflicts to declare.Acknowledgements
This work was supported by the Commissariat à l'Energie Atomique et aux Energies Alternatives. This project has also received funding of the GrapheneCore3 project from the European Union's Horizon 2020 Research and Innovation Program under grant agreement no. 881603. This study forms part of the Advanced Materials programme and was supported by MCIN with funding from the European Union NextGenerationEU (PRTR-C17.I1) and by the Junta de Comunidades de Castilla-La Mancha. The authors thank G. Patriarche for the support and help with the transmission electron microscopy.References
- A. C. Ferrari, F. Bonaccorso, V. Fal'ko, K. S. Novoselov, S. Roche, P. Bøggild, S. Borini, F. H. L. Koppens, V. Palermo, N. Pugno, J. A. Garrido, R. Sordan, A. Bianco, L. Ballerini, M. Prato, E. Lidorikis, J. Kivioja, C. Marinelli, T. Ryhänen and A. Morpurgo, et al. , Nanoscale, 2015, 7, 4598 RSC.
- G. Reina, J. M. Gonzalez-Dominguez, A. Criado, E. Vázquez, A. Bianco and M. Prato, Chem. Soc. Rev., 2017, 46, 4400 RSC.
- T. Reiss, K. Hjelt and A. C. Ferrari, Nat. Nanotechnol., 2019, 14, 907 CrossRef CAS PubMed.
- Global Graphene Market Size and Forecast To 2025. BBC Research. (2018) https://www.bccresearch.com/partners/verified-market-research/global-graphene-market-size-and-forecast.html.
- A. B. Seabra, A. J. Paula, R. de Lima, O. L. Alves and N. Duran, Chem. Res. Toxicol., 2014, 27, 159 Search PubMed.
- G. Pullangott, U. Kannan, S. Gayathri, D. V. Kiran and S. M. Maliyekkal, RSC Adv., 2021, 11, 6544 RSC.
- C. M. White Are graphene-coated face masks a COVID-19 miracle – or another health risk?, 2021. https://theconversation.com/are-graphene-coated-face-masks-a-covid-19-miracle-or-another-health-risk-159422 Search PubMed.
- K. Pal, G. Z. Kyzas, S. Kralj and F. Gomes de Souza, J. Mol. Struct., 2021, 1233, 130100 CrossRef CAS PubMed.
- K. S. Novoselov, A. K. Geim, S. V. Morozov, D. Jiang, Y. Zhang, S. V. Dubonos, I. V. Grigorieva and A. A. Firsov, Science, 2004, 306, 666 CrossRef CAS PubMed.
- B. Fadeel, C. Bussy, S. Merino, E. Vázquez, E. Flahaut, F. Mouchet, L. Evariste, L. Gauthier, A. J. Koivisto, U. Vogel, C. Martín, L. G. Delogu, T. Buerki-Thurnherr, P. Wick, D. Beloin-Saint-Pierre, R. Hischier, M. Pelin, F. Candotto Carniel, M. Tretiach, F. Cesca, F. Benfenati, D. Scaini, L. Ballerini, K. Kostarelos, M. Prato and A. Bianco, ACS Nano, 2018, 12, 10582 CrossRef CAS PubMed.
- A. Schinwald, F. A. Murphy, A. Jones, W. MacNee and K. Donaldson, ACS Nano, 2012, 6, 736 CrossRef CAS PubMed.
- L. Newman, A. F. Rodrigues, D. A. Jasim, I. A. Vacchi, C. Ménard-Moyon, A. Bianco, C. Bussy and K. Kostarelos, Cell Rep. Phys. Sci., 2020, 1, 100176 CrossRef.
- A. F. Rodrigues, L. Newman, D. A. Jasim, S. P. Mukherjee, J. Wang, I. A. Vacchi, C. Ménard-Moyon, A. Bianco, B. Fadeel, K. Kostarelos and C. Bussy, Adv. Sci., 2020, 7, 1903200 CrossRef CAS PubMed.
- B. Li, J. Yang, Q. Huang, Y. Zhang, C. Peng, Y. Zhang, Y. He, J. Shi, W. Li, J. Hu and C. Fan, NPG Asia Mater., 2013, 5, e44 CrossRef CAS.
- L. Mao, M. Hu, B. Pan, Y. Xie and E. J. Petersen, Part. Fibre Toxicol., 2015, 13, 7 CrossRef PubMed.
- M. Ema, M. Gamo and K. Honda, Regul. Toxicol. Pharmacol., 2017, 85, 7 CrossRef CAS PubMed.
- A. Spinazzè, A. Cattaneo, D. Campagnolo, V. Bollati, P. A. Bertazzi and D. M. Cavallo, Aerosol Sci. Technol., 2016, 50, 812 CrossRef.
- J. H. Lee, J. H. Han, J. H. Kim, B. Kim, D. Bello, J. K. Kim, G. H. Lee, E. K. Sohn, K. Lee, K. Ahn, E. M. Faustman and I. J. Yu, Inhalation Toxicol., 2016, 28, 281 CrossRef CAS PubMed.
- J. H. Shin, S. G. Han, J. K. Kim, B. W. Kim, J. H. Hwang, J. S. Lee, J. H. Lee, J. E. Baek, T. G. Kim, K. S. Kim, H. S. Lee, N. W. Song, K. Ahn and I. J. Yu, Nanotoxicology, 2015, 9, 1023 CrossRef CAS PubMed.
- J. K. Kim, J. H. Shin, J. S. Lee, J. H. Hwang, J. H. Lee, J. E. Baek, T. G. Kim, B. W. Kim, J. S. Kim, G. H. Lee, K. Ahn, S. G. Han, D. Bello and I. J. Yu, Nanotoxicology, 2016, 10, 891 CrossRef CAS PubMed.
- Y. H. Kim, M. S. Jo, J. K. Kim, J. H. Shin, J. E. Baek, H. S. Park, H. J. An, J. S. Lee, B. W. Kim, H. P. Kim, K. H. Ahn, K. Jeon, S. M. Oh, J. H. Lee, T. Workman, E. M. Faustman and I. J. Yu, Nanotoxicology, 2018, 12, 224 CrossRef CAS PubMed.
- A. Skovmand, A. Jacobsen Lauvås, P. Christensen, U. Vogel, K. S. Hougaard and S. Goericke-Pesch, Part. Fibre Toxicol., 2018, 15, 10 CrossRef PubMed.
- D. A. Jasim, C. Menard-Moyon, D. Begin, A. Bianco and K. Kostarelos, Chem. Sci., 2015, 6, 3952 RSC.
- D. A. Jasim, S. Murphy, L. Newman, A. Mironov, E. Prestat, J. McCaffrey, C. Ménard-Moyon, A. F. Rodrigues, A. Bianco, S. Haigh, R. Lennon and K. Kostarelos, ACS Nano, 2016, 10, 10753 CrossRef CAS PubMed.
- A. Bianco, Angew. Chem., Int. Ed., 2013, 52, 4986 CrossRef CAS PubMed.
- B. Cornelissen, S. Able, V. Kersemans, P. A. Waghorn, S. Myhra, K. Jurkshat, A. Crossley and K. A. Vallis, Biomaterials, 2013, 34, 1146 CrossRef CAS PubMed.
- D. A. Jasim, H. Boutin, M. Fairclough, C. Ménard-Moyon, C. Prenant, A. Bianco and K. Kostarelos, Appl. Mater. Today, 2016, 4, 24 CrossRef.
- H. Hong, K. Yang, Y. Zhang, J. W. Engle, L. Feng, Y. Yang, T. R. Nayak, S. Goel, J. Bean, C. P. Theuer, T. E. Barnhart, Z. Liu and W. Cai, ACS Nano, 2012, 6, 2361 CrossRef CAS PubMed.
- V. J. González, J. Frontiñan-Rubio, M. V. Gomez, T. Montini, M. Durán-Prado, P. Fornasiero, M. Prato and E. Vázquez, ACS Nano, 2023, 17, 606 CrossRef PubMed.
- H. Cazier, C. Malgorn, D. Georgin, N. Fresneau, F. Beau, K. Kostarelos, C. Bussy, S. Campidelli, M. Pinault, M. Mayne-L'Hermite, F. Taran, C. Junot, F. Fenaille, A. Sallustrau and B. Colsch, Nanoscale, 2023, 15, 5510 RSC.
- X. Guo, S. Dong, E. J. Petersen, S. Gao, Q. Huang and L. Mao, Environ. Sci. Technol., 2013, 47, 12524 CrossRef CAS PubMed.
- B. Czarny, D. Georgin, F. Berthon, G. Plastow, M. Pinault, G. Patriarche, A. Thuleau, M. Mayne-L'Hermite, F. Taran and V. Dive, ACS Nano, 2014, 8, 5715 CrossRef CAS PubMed.
- K. Lu, S. Dong, T. Xia and L. Mao, ACS Nano, 2021, 15, 396 CrossRef CAS PubMed.
- Z. Chen, W. Ren, L. Gao, B. Liu, S. Pei and H. M. Cheng, Nat. Mater., 2011, 10, 424 CrossRef CAS PubMed.
- K. R. Paton, E. Varrla, C. Backes, R. J. Smith, U. Khan, A. O'Neill, C. Boland, M. Lotya, O. M. Istrate, P. King, T. Higgins, S. Barwich, P. May, P. Puczkarski, I. Ahmed, M. Moebius, H. Pettersson, E. Long, J. Coelho and S. E. O'Brien, et al. , Nat. Mater., 2014, 13, 624 CrossRef CAS PubMed.
- Y. Hao, Y. Wang, L. Wang, Z. Ni, Z. Wang, R. Wang, C. K. Koo, Z. Shen and J. T. Thong, Small, 2010, 6, 195 CrossRef CAS PubMed.
- S. Wang, S. Suzuki and H. Hibino, Nanoscale, 2014, 6, 13838 RSC.
- C. Zhang, Q. Li, B. Tian, Z. Huang, W. Lin, H. Li, D. He, Y. Zhou and W. Cai, Mech. Astron., 2014, 57, 1817 CrossRef CAS.
- Y. Anno, K. Takei, S. Akita and T. Arie, Phys. Status Solidi RRL, 2014, 8, 692 CrossRef CAS.
- M. Kalbáč, L. Kavan, M. Zukalová and L. Dunsch, Small, 2007, 3, 1746 CrossRef PubMed.
- J. Ren and S. Licht, Sci. Rep., 2016, 6, 27760 CrossRef CAS PubMed.
- V. J. González, A. M. Rodríguez, V. León, J. Frontiñán-Rubio, J. L. G. Fierro, M. Durán-Prado, A. B. Munoz-García, M. Pavone and E. Vázquez, Green Chem., 2018, 20, 3581 RSC.
- V. J. González, A. M. Rodríguez, I. Payo and E. Vázquez, Nanoscale Horiz., 2020, 5, 331 RSC.
- C. Granotier, G. Pennarun, L. Riou, F. Hoffschir, L. R. Gauthier, A. De Cian, D. Gomez, E. Mandine, J.-F. Riou, J.-L. Mergny, P. Mailliet, B. Dutrillaux and F. D. Boussin, Nucleic Acids Res., 2005, 33, 4182 CrossRef CAS PubMed.
- S. Mokrani, C. Granotier-Beckers, O. Etienne, T. Kortulewski, C. Grisolia, J.-P. de Villartay and F. D. Boussin, DNA Repair, 2020, 88, 102801 CrossRef CAS PubMed.
- E. G. Solon, A. Schweitzer, M. Stoeckli and B. Prideaux, AAPS J., 2010, 12, 1 CrossRef PubMed.
- T. Loret, L. A. Visani de Luna, M. A. Lucherelli, A. Fordham, N. Lozano, A. Bianco, K. Kostarelos and C. Bussy, Small, 2023, 2301201 CrossRef CAS PubMed.
Footnotes |
| † Electronic supplementary information (ESI) available. See DOI: https://doi.org/10.1039/d3nr03711h |
| ‡ These authors contributed equally to this work. |
| This journal is © The Royal Society of Chemistry 2023 |